Resilient Cooperative Adaptive Cruise Control for Autonomous Vehicles Using Machine Learning
Abstract
Cooperative Adaptive Cruise Control (CACC) is a fundamental connected vehicle application that extends Adaptive Cruise Control by exploiting vehicle-to-vehicle (V2V) communication. CACC is a crucial ingredient for numerous autonomous vehicle functionalities including platooning, distributed route management, etc. Unfortunately, malicious V2V communications can subvert CACC, leading to string instability and road accidents. In this paper, we develop a novel resiliency infrastructure, RACCON, for detecting and mitigating V2V attacks on CACC. RACCON uses machine learning to develop an on-board prediction model that captures anomalous vehicular responses and performs mitigation in real time. RACCON-enabled vehicles can exploit the high efficiency of CACC without compromising safety, even under potentially adversarial scenarios. We present extensive experimental evaluation to demonstrate the efficacy of RACCON.
Index Terms:
Connected and autonomous vehicles, V2X communication, anomaly detection, securityI Introduction
Recent years have seen proliferation of electronics and software in automotive systems targeted towards increasing autonomy. Autonomous features hold the promise of dramatically increasing transportation efficiency and road safety by reducing and eventually eliminating human errors [20]. However, an undesired side-effect is the increased vulnerability of Connected and Autonomous Vehicles (CAVs) to cyber-security threats. Recent research has shown that it is possible, even straightforward, to mount cyber-attacks that compromise a vehicle and control its driving functionality [19, 8, 15]. Increasing dependence of critical vehicular operations on communication with the external world will exacerbate this situation by creating larger attack surfaces. This increases the attacker’s ability to compromise the vehicle causing catastrophic impact. Consequently, the proliferation and even adoption of CAVs depends critically on our ability to mitigate such attacks.
An important feature of autonomous vehicles is the ability to interact with other vehicles (V2V), the transportation infrastructure (V2I), and devices connected to the Internet (V2IoT). Vehicular communications, collectively referred to as V2X, form a key constituent of several emergent applications including platooning, cooperative route management, intersection management, cooperative collision detection, etc. Unfortunately, V2X also enables a large class of adversarial opportunities: an adversary can easily create disruption by manipulating communicated messages through mutation, misdirection, or jamming. For example, in platooning, the adversary may cause an accident by simply sending misleading acceleration directive while braking [9].
In this paper, we develop an infrastructure for systematically integrating resiliency against communication attacks on V2V applications. Our focus is a fundamental application of vehicular communications: Cooperative Adaptive Cruise Control (CACC). CACC is an extension of Adaptive Cruise Control (ACC); Adaptive Cruise Control (ACC) uses RADAR/LIDAR measurements to derive relative velocity and headway from the vehicle in front. Additionally, CACC also accounts for the preceding vehicle’s (intended) acceleration. The acceleration is communicated through V2V messages, typically as Dedicated Short Range Communication (DSRC) [30]. CACC is a key component of several connected car applications such as vehicle platooning, cooperative on-ramp merging, etc. Attacks on CACC can disrupt traffic movement, cause catastrophic accidents, and bring down the transportation infrastructure.
Our framework, RACCON (for “Resilient Cooperative Adaptive Cruise Control”), is a real-time anomaly detection and mitigation system for communication attacks on CACC. The key idea is to use machine learning (ML) to develop an on-board prediction model for estimating the response of the following vehicle given normal (benign) patterns of V2V input messages. This enables the detection of anomalies in the vehicle’s responses resulting from potentially malicious communications. RACCON involves two cooperative components: (1) an on-board architecture installed in vehicles participating in CACC that enables the follower vehicle (also called ego vehicle) to perform real-time anomaly detection and mitigation; and (2) an offline cloud-based infrastructure for construction of prediction models.
The paper makes several important contributions. First, unlike related approaches that focus on detection of CACC attacks (see Section XII), RACCON represents the first framework that also enables real-time resiliency. Second, our framework provides high flexibility through attack-agnostic defense against an elaborate set of adversaries in the connected car ecosystem, including man-in-the-middle (MITM) attack, wormhole attack, Sybil, Denial-of-Service (DoS), etc. RACCON also accounts for the natural differences in communication patterns among a variety of driving scenarios, road conditions, etc. Finally, our work represents the most comprehensive experimental evaluation to date on vulnerabilities in CACC, impact of attacks on target vehicles, and the quality of resiliency provided by the security architecture. In addition to showcasing confidence in our approach, we believe the experimental framework will serve as a roadmap for evaluation of resiliency in other CAV applications.
The remainder of the paper is organized as follows. Section II provides relevant background in V2X, cooperative vehicular applications, and CACC. We introduce RACCON in Section III and explain the design constraints induced by the requirements for real-time detection and mitigation. Section IV presents details of the RACCON architecture and implementation. A unique contribution of the paper is the extensive evaluation performed to demonstrate the efficacy of RACCON. Sections V through XI explain our experimental results. We discuss related work in Section XII and conclude in Section XIII.
II Background
II-A Connected Vehicle Applications and V2X Communications
Connected autonomous vehicle (CAV) applications exploit Internet connectivity to enhance driving efficiency, safety, mobility, and sustainability [11]. With the increasing proliferation and speed of Internet connectivity, several such applications have emerged in the past decade. Today, connected vehicle applications constitute some of the core components of R&D around autonomous driving. Some applications currently designed include platooning, dynamic cooperative route management (DCRM), automated collision detection, cooperative automated on-ramp merging, etc.
V2X is an essential centerpiece of all CAV applications. DSRC is a popular communication scheme that enables V2X. It is a modified version of the IEEE 802.11p Wide Local Area Network (WLAN) protocol, designed for vehicular ad-hoc networks comprising high mobility nodes. US Federal Communications Commission (FCC) has allocated a dedicated bandwidth of MHz in the -GHz band to DSRC. In an effort to expedite the deployment of connected vehicle technologies, United States Department of Transportation put forth a proposal in 2016 mandating integration of DSRC devices on all new light-duty vehicles produced in USA.
II-B ACC and CACC Overview
Adaptive Cruise Control (ACC) enables a vehicle to automatically adjust acceleration and closely follow its preceding vehicle , while maintaining a safe space gap . Most ACC implementations target a constant time headway; the goal is to compute such that takes at least time to reach the same position as , where is a design constant. The safe space gap is a function of , the maximum deceleration capability of , and the velocities and . Vehicle computes its desired acceleration using (1) the inter-vehicle distance and velocity of the preceding vehicle measured by RADAR/LIDAR; and (2) the velocity and acceleration of measured by on-board sensors. Cooperative Adaptive Cruise Control (CACC) extends ACC by using the intended acceleration of in the computation of . Vehicle communicates through V2V messages (Fig. 1). Both ACC and CACC operate in two modes. If , they operate in gap control mode, where follows as closely as possible; if , they switch to collision avoidance mode and uses maximum deceleration . The use of the preceding vehicle’s acceleration enables CACC to maintain a shorter time headway (THW) than ACC, resulting in a more efficient roadway utilization: in a representative implementation [5], CACC uses of while ACC needs to use .

II-C CACC Architecture and A Representative Implementation
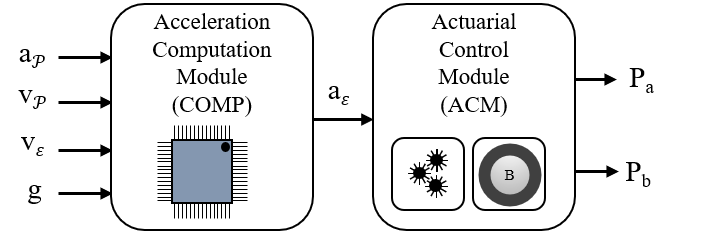
Fig. 2 shows the key components of an on-board CACC architecture. While low-level details vary, all implementations to our knowledge constitute two key components: Acceleration Computation Module (COMP) computes the desired acceleration of the host vehicle ; Actuarial Control Module (ACM) manipulates motor output torque or braking pressure to enforce the desired acceleration.
Although RACCON is oblivious to the underlying CACC implementation, for our evaluation we use representative CACC (and ACC) implementations by Amoozadeh et al. [5] shown below. In the equations, and are the desired accelerations for ACC and CACC respectively, is a constant defining a lower bound on space gap, and are constant time headway for ACC and CACC respectively, and , , and are acceleration, velocity, and position constants. Amoozadeh et al. specify the values , , , , , and .
III Introduction to RACCON
III-A RACCON as a Service
At the user level, RACCON is a vehicular service that is enabled with the help of additional on-board hardware (see Section IV). We refer to the subscribing vehicle as the ego vehicle,“”; all our evaluations are done from the perspective of an ego vehicle. When enabled, RACCON collects normal behavior data during ’s operation. Data from all vehicles with RACCON installed is periodically uploaded to a trusted cloud server for progressively refining ML models used by the on-board hardware; periodically updates the on-board system by downloading the latest ML models. The communication with cloud is performed when is connected to Internet through a trusted network, e.g., when stationary at the owner’s residence; on-road connectivity with cloud is not necessary. During driving operation, if CACC is engaged in , the on-board hardware automatically detects anomalies in V2V communication from the preceding vehicle, and performs mitigation.
III-B Design Considerations
A unique feature that distinguishes RACCON from related ML approaches for anomaly detection in CACC is real-time resiliency. For our solution to be viable, a number of design constraints must be satisfied.
-
•
Basic safety: ML-based solutions can only provide a “high probability” guarantee on prediction accuracy. Consequently, it is critical that the RACCON mitigation generates decisions that are safe (under the assumed threat model), i.e., do not increase the risk of accident in response to a detected anomaly.
-
•
Flexibility: The solution should work without modification, for the entire adversarial spectrum. Hence, control-theoretic solutions that require detailed customized models of adversarial functionalities are infeasible.
-
•
Limited Computation and Real-time Requirements: The security system should operate within the computational constraints of an automotive platform and meet real time requirements of CACC application.
-
•
Small Data Problem and Machine Learning Attacks: Any ML-based prediction system requires a significant amount of training data. Obviously, significant attack data does not exist in real life, a phenomenon we refer to as the small data problem. It is critical for the prediction system to be accurate in the presence of limited anomaly data. Furthermore, the system must be robust against detector subversion, i.e., attacks targeted specifically to fool the prediction system (see Section XI).
RACCON addresses the resource constraints and real-time requirements by separating the training of ML models from on-road prediction. A key observation is that the computation-intensive component of machine learning is training predictor models; once a model is created, detection can be performed within the limited resources of automotive ECUs. Our system includes a cloud-based methodology for training prediction models, while the on-board architecture is responsible for collecting data and performing real-time prediction. We ensure basic safety by introducing a plausibility checker which guarantees that RACCON’s mitigation cannot compromise safety due to V2V anomalies. To address the small data problem, we observe that while labelled anomalous/malicious data is limited, data on normal behavior is typically plentiful. Consequently, we train prediction algorithms to learn normal behavior model (NBM), i.e., the response of to normal (benign) pattern of V2V communications rather than anomalous behavior. The on-board anomaly detector then calculates the degree of deviation from NBM as a measure of the anomaly. Finally, for ensuring resiliency under detection subversion attacks, we systematically fine-tune the detection threshold to capture minute anomalies that have a perceptible effect on the safety or efficiency of the target vehicle. As a result, stealthy attacks that indeed subvert the detection system fail to cause any adverse impact on the vehicle.
III-C Threat Model
Given our focus on V2V, our threat model assumes that the attacker can tamper with arbitrary V2V messages. This includes mutation, denial of delivery, masquerading as a different vehicular or infrastructure entity, message fabrication, etc. Our framework is oblivious to the source of the attack: it can be a rogue preceding vehicle, a compromised ego vehicle infrastructure component, or an intermediate networking component, e.g., denial of message delivery is possible by compromising the software/hardware component of the ego vehicle or interfering with the communication protocol. We assume that the RACCON on-board system in the ego vehicle, as well as the actuarial components it controls, are not compromised. We also assume that the sensory inputs to the ego vehicle are not corrupted.111There has been significant research showing how vehicular sensors can be compromised [22], [4], [10], [3]. Nevertheless, since the modalities of compromising sensors and V2V are different, it is reasonable in the context of detecting V2V anomalies to assume that the sensory inputs are trusted.
IV RACCON Implementation
Fig. 3 shows the RACCON on-board architecture, and Algorithm 1 provides a top-level description. A key insight is that since on-board architecture of most CACC implementations follows the “template” from Fig. 2, it is possible to develop a streamlined resiliency architecture by systematically augmenting the template with resiliency components. RACCON adds three such components: (1) Anomaly Detector; (2) Mitigator; and (3) Data Collector.
IV-A Anomaly Detector
Anomaly detector checks at each instant whether the response of the COMP module of CACC deviates from the expected normal behavior; any such deviation is captured as an anomaly to be passed on to Mitigator. The detection comprises the following two modules.
-
1.
Predictor is a machine learning model that is trained offline. It estimates predicted acceleration value in real time, taking the same input parameters as COMP. Predictor can capture contextual/conditional anomalies, in addition to point anomalies.
-
2.
Comparator computes the deviation between the predicted value and ; if the deviation is beyond a pre-defined threshold, it is detected as an anomaly. The detection threshold is a function of driving conditions and typical velocities of vehicles in a driving environment (See Section IX).

IV-B Mitigator
For each anomaly captured by the detector, Mitigator computes an alternate response overriding the CACC controller response , to neutralize any potential adversarial impact. Mitigator comprises the following components.
-
1.
Response Estimator is a pre-trained machine learning model analogous to Predictor, that generates an estimated acceleration . However, unlike Predictor (and indeed, COMP), it uses only trusted sensory inputs, e.g., relative velocity and position of and .
-
2.
Plausibility Checker ensures that Response Estimator’s output does not compromise the safety of , even under attack.
Algorithm 2 describes the Mitigator functionality. In the absence of anomaly, sensory inputs are typically sampled at a lower rate . When Mitigator is invoked to handle an anomaly (lines through , the sensor sampling frequency is switched to a higher value to generate more accurate sensory data. The received as anomalous message, and computed using that value, are discarded. Instead, is calculated approximately using the rate of change in the velocity of the from the previous time step. Lines through describe the plausibility checker functionality; it accounts for the worst case for safety, e.g., sudden halt of . The resultant is computed for the scenario where and corrected were applied. The plausibility checker then determines the optimal choice out of and the corrected that is both safe and efficient. If it fails to find such a value, the system falls back to conservative ACC. Consequently, THW never reaches value less than minimum safe threshold .
IV-C Data Collector
The Data Collector collects on-road driving data, which is aggregated and periodically communicated to the cloud for improving the ML models (see below). The collected data includes (1) inputs to the CACC controller, e.g., preceding vehicle acceleration, inter-vehicle space headway, and the velocities of the two vehicles; (2) the acceleration value computed by the COMP module of CACC in response to these inputs; and (3) an “anomaly flag” to indicate whether the response is classified as an anomaly by RACCON.
IV-D Off-line Cloud Infrastructure
The ML components of RACCON (Predictor and Response Estimator) are trained offline on trusted cloud servers and updated periodically, as new on-road CACC data is made available from the Data Collector modules of different vehicles subscribing to the RACCON service. We assume that these communications cannot be corrupted. This is viable in practice since we do not require real-time communication with the cloud. Data can be transferred from the vehicles when a trusted connection to the cloud is available. RACCON-enabled vehicles securely download the latest instances of trained Predictor and Response Estimators along with a list of anomaly thresholds for different driving environments, prior to CACC engagement in untrusted operating conditions.
V RACCON Evaluation, Setup, and Attack Orchestration Methodology
A unique aspect of our work is the extensive experimental evaluation of RACCON. In addition to showing the viability of RACCON itself, we believe our experiments provide a roadmap for evaluation of resiliency in other connected vehicular applications as well.
V-A Data Generation
A key challenge with evaluating ML-based solutions is the need for realistic data. As discussed in Section III-B, we avoid the need for real vulnerability data by training the ML components to learn NBM (for which there is plentiful data on deployment). However, our experimental evaluation obviously needs to be done before deployment, when in-field data is not yet available. Consequently, we generate normal driving data using a state-of-the-art physical automotive research simulator, RDS1000® [24] and a software system replicating a representative CACC controller functionality (described in II). Data collected from the simulator is fed to the CACC software system to generate vehicular trajectories. RACCON detection and mitigation components are integrated with the CACC system. Attacks are orchestrated by manipulating the inputs to the RACCON-integrated CACC system. The impacts of the attack (and our mitigation) are computed by modifying vehicular parameters (e.g., acceleration of the ego vehicle, THW between vehicles, etc.).
We curated a dataset corresponding to vehicles engaged in CACC, operating in different driving environments. These environments were programmed as a cross-product of the following parameters: (i) Road terrain (highway, suburban and urban); (ii) Weather (clear, windy, snowy, rainy); and (iii) Time of day (day, night). The set of parameters (terrain, weather, and time of day) are typically used to analyze driving patterns [20]. We also added ambient traffic to obtain realistic vehicular trajectory data. Each of the datasets corresponds to about minutes of driving time and constitutes approximately samples collected at a frequency of Hz. The data collected provides the preceding vehicle trajectory; ego vehicle response is computed using the COMP controller from Section II-B. The global dataset is generated by aggregating data from all environments, and is split - into training and test data.
V-B Attack Taxonomy

Since the security paradigm of V2V communications is continuously increasing in complexity, it is challenging to develop an evaluation strategy to comprehensively cover the attack space. All previous works on V2X attack detection only focused on specific attack instances, e.g., Biron et al. [3] only target jamming and flooding attacks, and Jagielski et al. [13] focus on specific mutation attacks. Such evaluation does not provide adequate evidence of resiliency against other potentially unknown attacks.
| Attack Mechanism | Attack Origin | Operation | Frequency | Impact | |||||||
| Preceding Vehicle | MITM | Mutation | Fabrication | Delivery Prevention | Discrete | Cluster | Continuous | Collision | Efficiency degradation | String Instability | |
| Message falsification | ✓ | ✓ | ✓ | ✓ | ✓ | ✓ | ✓ | ✓ | ✓ | ||
| DoS (Jamming) | ✓ | ✓ | ✓ | ✓ | ✓ | ✓ | |||||
| DoS (Flooding) | ✓ | ✓ | ✓ | ✓ | ✓ | ✓ | ✓ | ✓ | ✓ | ✓ | |
| Masquerade | ✓ | ✓ | ✓ | ✓ | ✓ | ✓ | ✓ | ✓ | ✓ | ||
| Replay | ✓ | ✓ | ✓ | ✓ | ✓ | ✓ | ✓ | ||||
| Misdirection | ✓ | ✓ | ✓ | ✓ | ✓ | ✓ | |||||
We address this problem by developing a comprehensive taxonomy of V2V attacks on CACC (Fig. 4) that is used to systematically navigate the attack space. The taxonomy is inspired by threat modeling approaches in hardware and system security [23], but adapted for V2V adversaries. The idea is to represent a V2V attack through three features, viz., stealth, operation, and impact. This feature combination forms a holistic characterization of any attack under the RACCON adversary model. In particular, since the adversary is confined to V2V communications, the only choices for the adversary are to (1) mutate an existing message, (2) fabricate a new message, and (3) prevent the delivery of a message. Correspondingly, since the message payload constitutes the preceding vehicle’s acceleration, the impact of an attack can be to (1) increase the probability of collision (by reporting a lower than actual acceleration value), (2) reduce efficiency through an increased headway (by reporting a higher than actual acceleration value), or (3) creating instability (e.g., through random mutation of the actual value). We refer to deviations by a positive bias as collision attacks and deviations by a negative bias as efficiency degradation attacks. Note that the taxonomy is oblivious to the mechanics of the attack (e.g., man-in-the-middle, rogue vehicle, hardware-software modules of the ego vehicle, etc.), but only considers the effect on V2V messages. For instance, delivery prevention operation accounts for jamming, flooding, channel subversion, etc., each of which can be carried out through a variety of ways. Table I shows how the taxonomy accounts for different well-known attacks. The focus on attack characteristics rather than the mechanics enables the taxonomy to provide a comprehensive classification of V2V attacks.
V-C Attack Orchestration Methodology
We used the taxonomy above to develop a systematic attack orchestration framework. Attacks are represented as -tuples, representing the three features identified in the taxonomy. Delivery prevention attacks are realized through intermittent or absent communication. Mutation and fabrication attacks are realized through fake acceleration messages that deviate from ground truth. We consider four different ways for generating fake accelerations:
| (1) | |||
| (2) | |||
| (3) | |||
| (4) |
Equation (1) represents a constant bias added to the ground truth. Equations (2) and (3) represent linear and sinusoidal time-varying biases, respectively. Given a specific combination of attack features (e.g., discrete mutation attack with collision as targeted impact), the framework permits attack impact simulation. We use THW () as a natural measure to quantify the risk of collision or the extent of efficiency degradation. An erratic change in can also potentially indicate string instability in the traffic.
V-D Summary of Experiments
Evaluation of CAV application resiliency must address a variety of orthogonal facets. Note that within the broad umbrella of ML-based resiliency, the number of architectural parameters available for a security designer to tweak is dauntingly large. This includes the choice of ML model, anomaly threshold, adversary classifications, etc. In addition to evaluating the quality of infrastructure, the methodology must enable systematic estimation of these parameters. Following is an overview of the experiments performed to evaluate RACCON. We elaborate on the experiments in Sections VI through XI.
-
1.
Data Validation: For our conclusions to be meaningful, it is critical that the data we use is realistic. We validate that the vehicular driving patterns reflected in our simulation data conform to real-world patterns from a public dataset. (Section VI)
-
2.
Identification of Appropriate ML Model: Implementing Predictor and Response Estimator functionalities requires selecting and tuning the appropriate ML architecture. We develop a systematic evaluation methodology to address this problem. (Section VII)
-
3.
Attack Impact Analysis: The viability of attack orchestration framework for RACCON evaluation depends on the quality of the orchestrated attacks themselves. We develop a methodology to analyze attacks, in terms of stealth and impact. (Section VIII)
-
4.
Anomaly Detection Threshold: A key factor in the effectiveness of RACCON is the identification of anomaly threshold, i.e., the extent of deviation from normal behavior pattern that would be classified as a potential threat. Selecting an appropriate threshold involves balancing the trade-off between maximizing attack detection accuracy and minimizing false alarms. We present a series of experiments to achieve this balance. (Section IX)
-
5.
V2V Attack Resilience: The central component of our evaluation shows the robustness of RACCON against various V2V attacks. (Section X)
-
6.
Resilience Against Detector Subversion: Since RACCON depends on ML-based predictions, it is exposed to adversaries that aim to subvert the ML component. We call such adversaries Detection Subversion Adversaries, and evaluate the resiliency of RACCON against them. We also present an interesting connection between anomaly threshold and detection subversion. (Section XI)
VI Data Validation
A key challenge with using simulator data is to ensure that it is realistic. Unfortunately, there is no available repository of sufficient real-world driving data across different driving scenarios. Indeed, the lack of available real-world data is the reason why we rely on simulated data in the first place. To address this problem, we observe that while sustained data over a period of time is unavailable, there are datasets that provide short-duration driving patterns. These snippets can then be used to corroborate data obtained from the simulator under similar driving conditions.
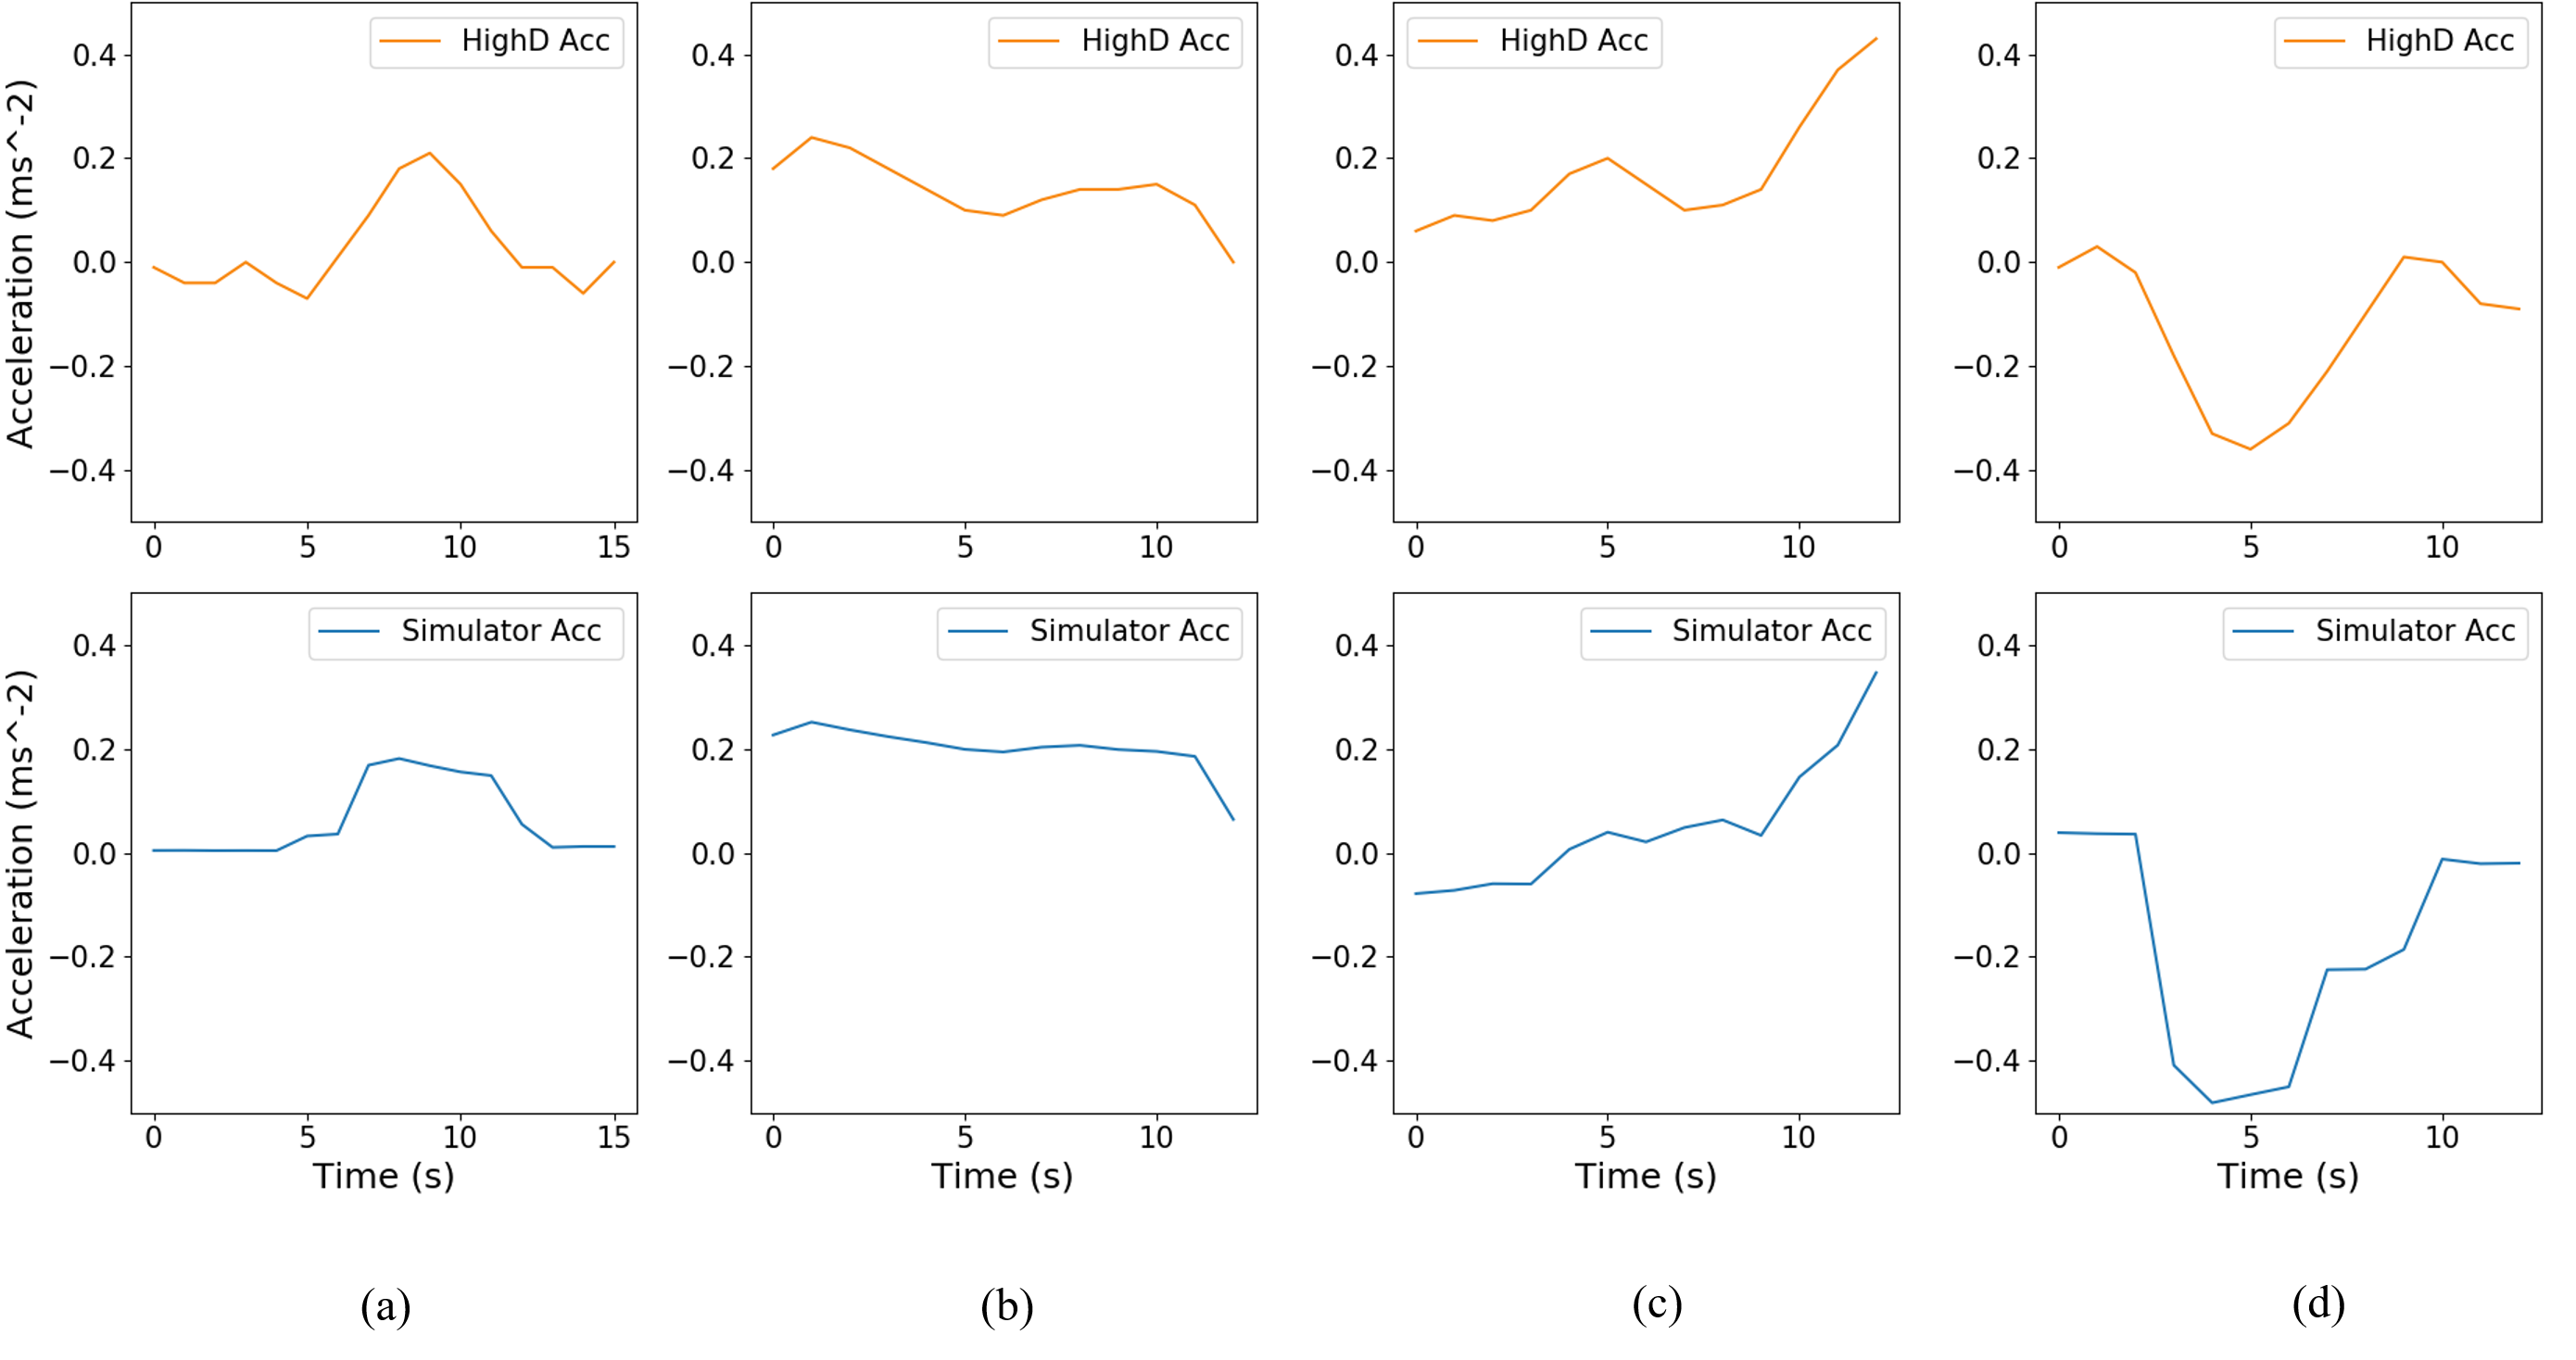
We carried out this experiment with HighD dataset [16] that provides trajectory data corresponding to real vehicles driving in German highways. The length of individual vehicle trajectories is approximately seconds. We compare acceleration patterns of similar length trajectories collected from the simulator. Fig. 5 shows sample comparisons for four vehicles from HighD data. The results clearly indicate that the acceleration patterns from the simulator correlate closely with HighD data.
VII Fidelity of ML Models
Viability of RACCON critically depends on the presumption that ML Models involved (Predictor and Response Estimator) have high accuracy. We can formulate the ML regression problem in two ways: (i)stateless prediction and (ii)time-series prediction. Cumulatively, these result in a prohibitively large space ML architecture choices. It is important to navigate this space systematically and converge to an optimal architecture. The ML model must address two orthogonal requirements: (1) avoid false alarms for benign messages and (2) accurately classify malicious messages as anomalous. Furthermore, it must be possible to perform real-time prediction under the computation and storage constraints of automotive systems. Finally, since driving patterns vary according to driving conditions, we must determine whether each driving environment requires a customized ML model.
VII-A Identifying ML Architecture
Since detecting malicious activity essentially involves identifying anomalous behavior, it is imperative that the model learns NBM (i.e., estimating the normal behavior of CACC controller) accurately for effective performance in adversarial settings. Furthermore, efficiency of a resiliency solution depends primarily on the prediction accuracy under benign scenarios, since most of the messages encountered by vehicles in field are likely benign. Our methodology entails the following steps to determine the appropriate ML architecture.
-
1.
Find a set of candidate architectures that can satisfy automotive resource constraints.
-
2.
Discard candidates that do not provide acceptable prediction accuracy under benign conditions.
-
3.
Of the remaining candidates, select the architecture with highest accuracy under malicious conditions.
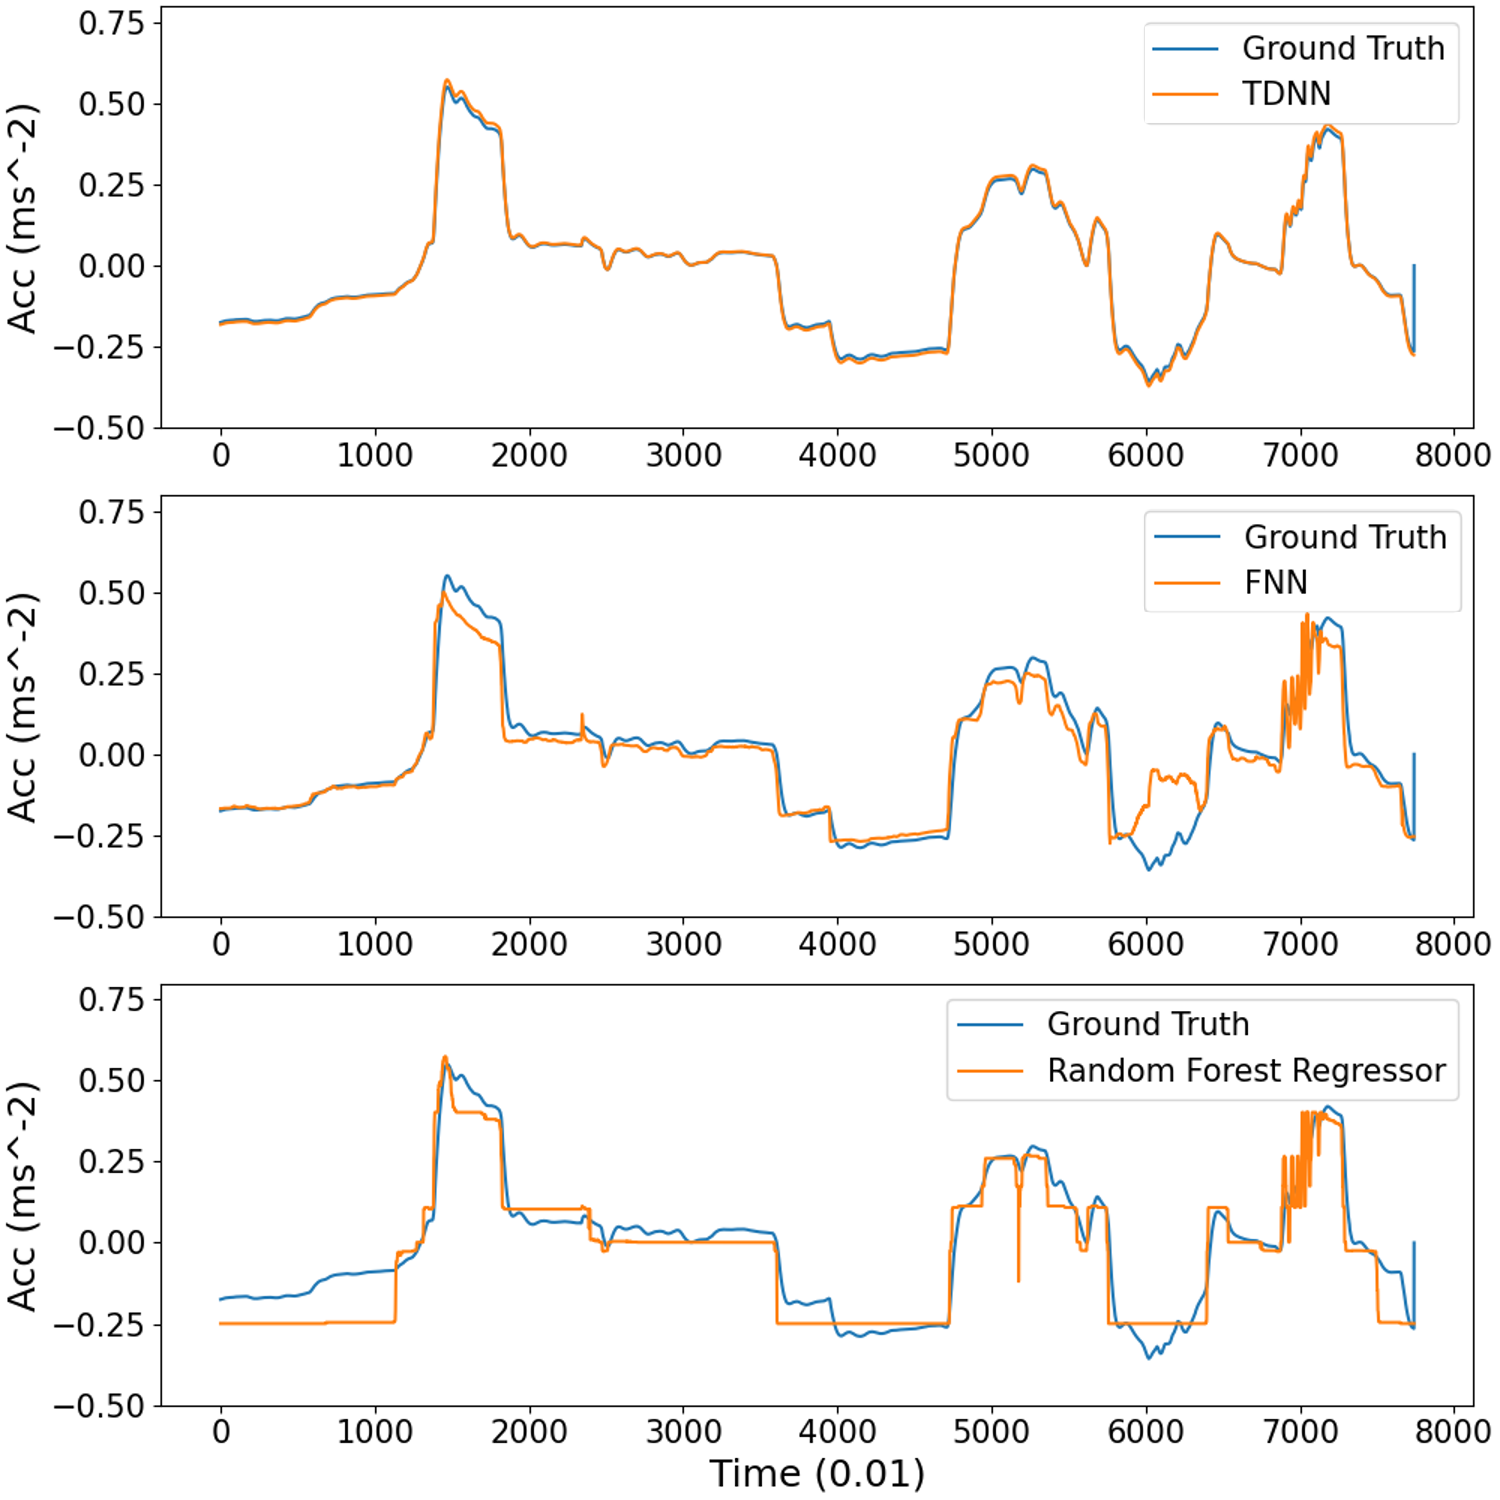
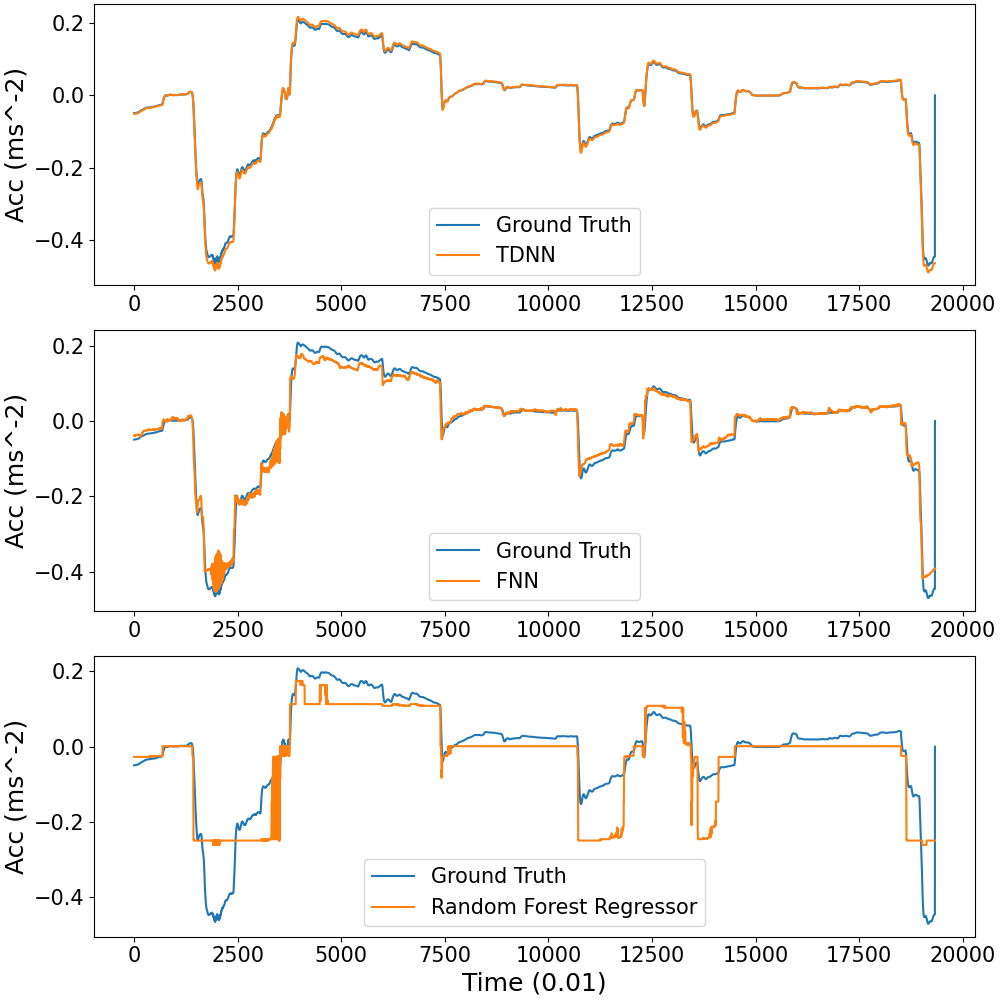
In our evaluations, we started with five architectures: Random Forest Regressor (RF), Support Vector Machine (SVM), and Feed-forward Neural Network (FNN) are examined for stateless prediction; Univariate Time Delayed Neural Network (TDNN) and Multivariate Long Short-Term Memory (LSTM) network are examined for time-series prediction. Architectures more sophisticated than LSTM were estimated to be too complex, given the constraints of automotive systems. For these candidates, we apply a two-step triage process based on prediction accuracy in benign environment. In the first step, we compute the Mean Absolute Error (MAE) in prediction, under six different driving environments, for each ML architecture. This provides a “coarse” evaluation of accuracy and facilitates identification of a small subset of candidates (Table II ). Clearly RF, TDNN, and FNN show much better accuracy than SVM and LSTM. In the next step, we examine them more closely to identify any local “kinks”. Fig. 6 plots the accuracy of Predictor in two different environments. Note that RF is ineffective in capturing minute variations in acceleration (indicated by several flat lines in prediction). This behavior can be attributed to the fact that the RF regressor ignores minute variations in the data as noise. Since tracking such variations is critical for accurate anomaly detection, RF is discarded as a viable candidate.
| Test Environment | ML Model | ||||
| RF | FNN | LSTM | TDNN | SVM | |
| Env 1 | 0.040 | 0.021 | 0.155 | 0.007 | 0.440 |
| Env 2 | 0.149 | 0.177 | 1.640 | 0.027 | 1.057 |
| Env 3 | 0.101 | 0.116 | 0.985 | 0.021 | 0.787 |
| Env 4 | 0.075 | 0.089 | 1.166 | 0.010 | 0.510 |
| Env 5 | 0.199 | 0.310 | 1.130 | 0.035 | 0.364 |
| Env 6 | 0.062 | 0.073 | 0.201 | 0.010 | 0.987 |
FNN and TDNN are further examined under simulated attacks to determine anomaly detection and mitigation efficacy. In each attack, malicious acceleration values are generated by adding a bias (constant or sinusoidal) to the ground truth. Clearly, FNN performs significantly better than TDNN in mitigating attacks, as indicated by the resultant THW values in Table III 222We believe the better performance of FNN over TDNN is due to the stateless design of the CACC controller. The stateless FNN model captures the context well and approximates the controller behavior while time-dependant regression models learn spurious temporal dependencies making them ineffective in detecting anomalous inputs. Based on these results, FNN is determined as the appropriate ML architecture for the RACCON detection system..
| Time Headway | Cluster Attack (Bias:1.5) | Cluster Attack (Bias:-0.8) | Continuous Attack (Bias:0.1) | Continuous Attack (Bias:sin(0.05t)) | ||||||||
| FNN | TDNN | Naive CACC | FNN | TDNN | Naive CACC | FNN | TDNN | Naive CACC | FNN | TDNN | Naive CACC | |
| THW 0.55s | 0% | 30.85% | 80.64% | 0% | 0% | 0% | 0% | 63.22% | 63.22% | 0% | 20.47% | 21.14% |
| THW: | 100% | 65.81% | 19.36% | 100% | 55.89% | 34.24% | 100% | 36.78% | 36.78% | 100% | 77.97% | 78.86% |
| THW 0.75s | 0% | 3.34% | 0% | 0% | 44.11% | 65.76% | 0% | 0% | 0% | 0% | 1.56% | 0% |
VII-B Environment Specific Models vs Global Model
We investigate whether one global Predictor model can provide sufficient resiliency or a unique model is necessary for each driving scenario. Firstly, we train a unique Predictor model for each driving scenario as well as a cumulative global model. We then compare the global model against all unique models in normal operating conditions to determine the optimal approach. Table IV shows the mean absolute error for using a global predictor model vis-a-vis unique models. The error corresponding to the global model is generally less than (but typically close to) unique models. Even when the error is greater, e.g., for , the difference is insignificant. Consequently, using a global predictor to estimate is sufficient, obviating the need for unique models for different driving scenarios.333The conclusion that the global model performs better than unique tailor-made models for some driving conditions is somewhat surprising. One reason is that it usually has more training data, incorporating driving patterns from many individual scenarios, resulting in a better accuracy. This holds true for practical deployments as well as our experimental setup.
| Road Infrastructure | Day | Night | ||||||||||||||
| Rain | Snow | Clear | Windy | Rain | Snow | Clear | Windy | |||||||||
| Unique | Global | Unique | Global | Unique | Global | Unique | Global | Unique | Global | Unique | Global | Unique | Global | Unique | Global | |
| Highway | 0.070 | 0.051 | 0.130 | 0.131 | 0.045 | 0.044 | 0.059 | 0.058 | 0.082 | 0.073 | 0.087 | 0.084 | 0.071 | 0.068 | 0.098 | 0.091 |
| Suburban | 0.125 | 0.119 | 0.038 | 0.141 | 0.193 | 0.178 | 0.103 | 0.121 | 0.101 | 0.140 | 0.074 | 0.096 | 0.133 | 0.119 | 0.110 | 0.212 |
| City | 0.081 | 0.056 | 0.084 | 0.051 | 0.212 | 0.050 | 0.005 | 0.016 | 0.051 | 0.140 | 0.059 | 0.038 | 0.053 | 0.052 | 0.034 | 0.042 |
VIII Attack Impact Analysis
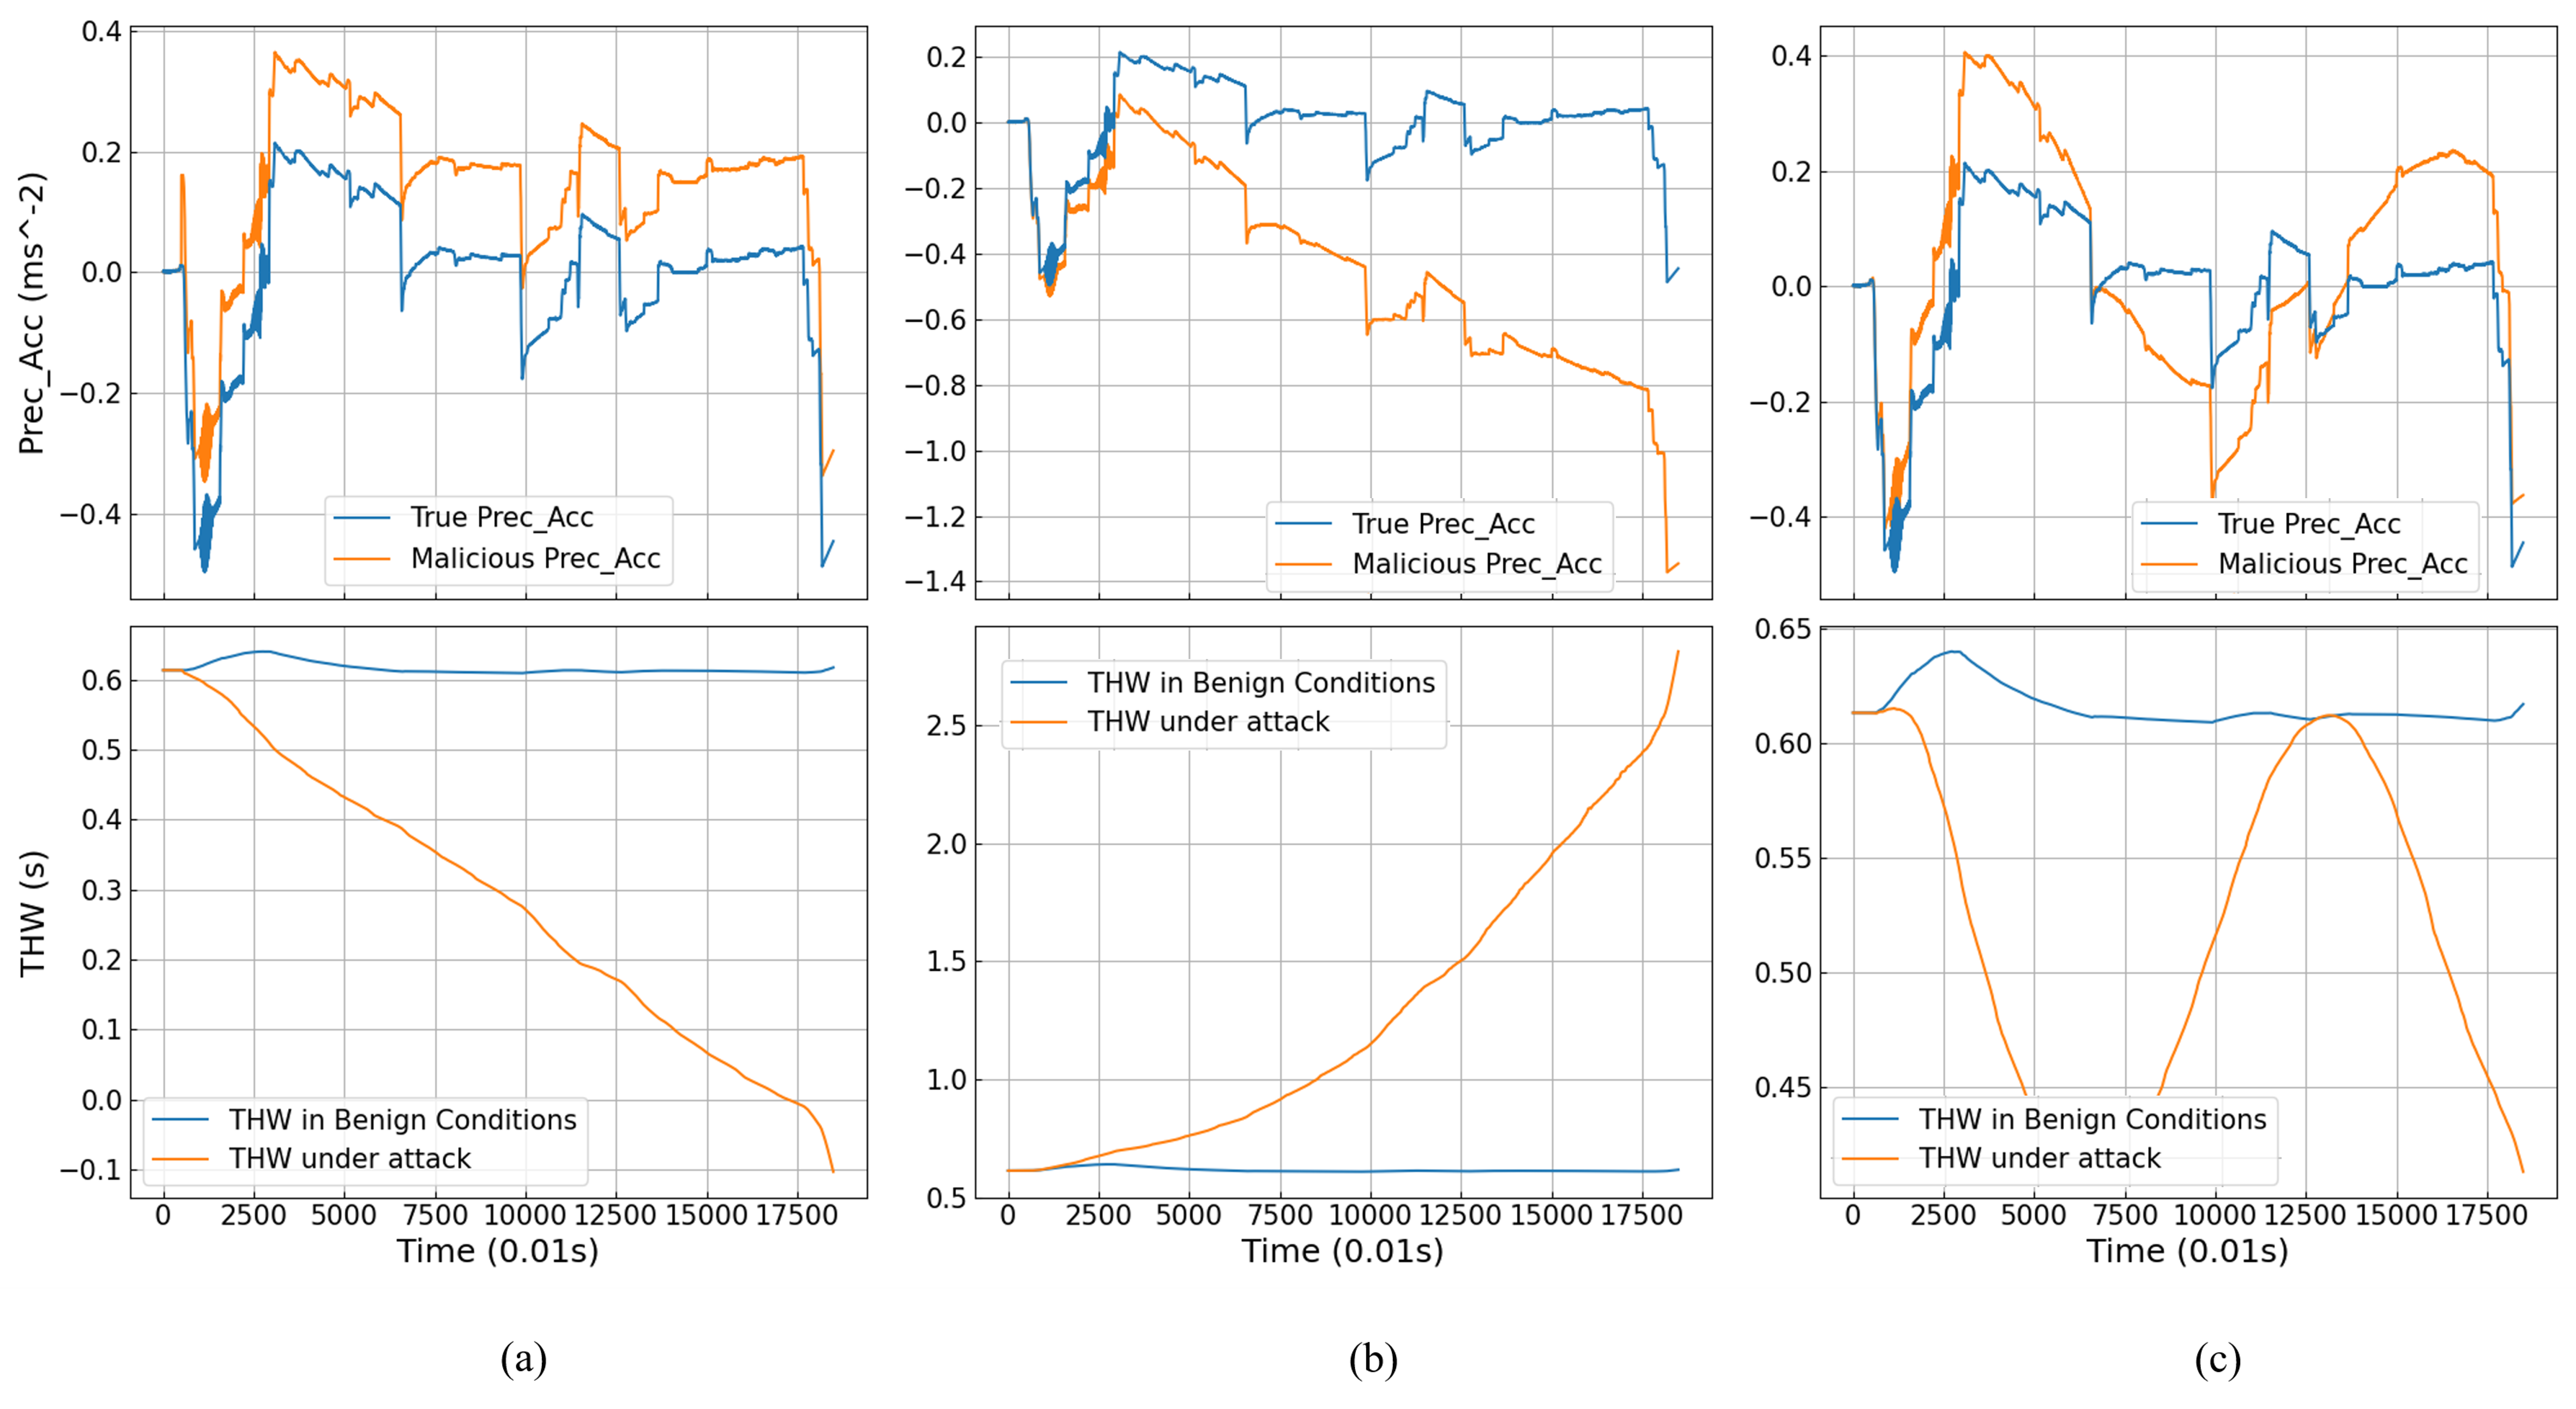

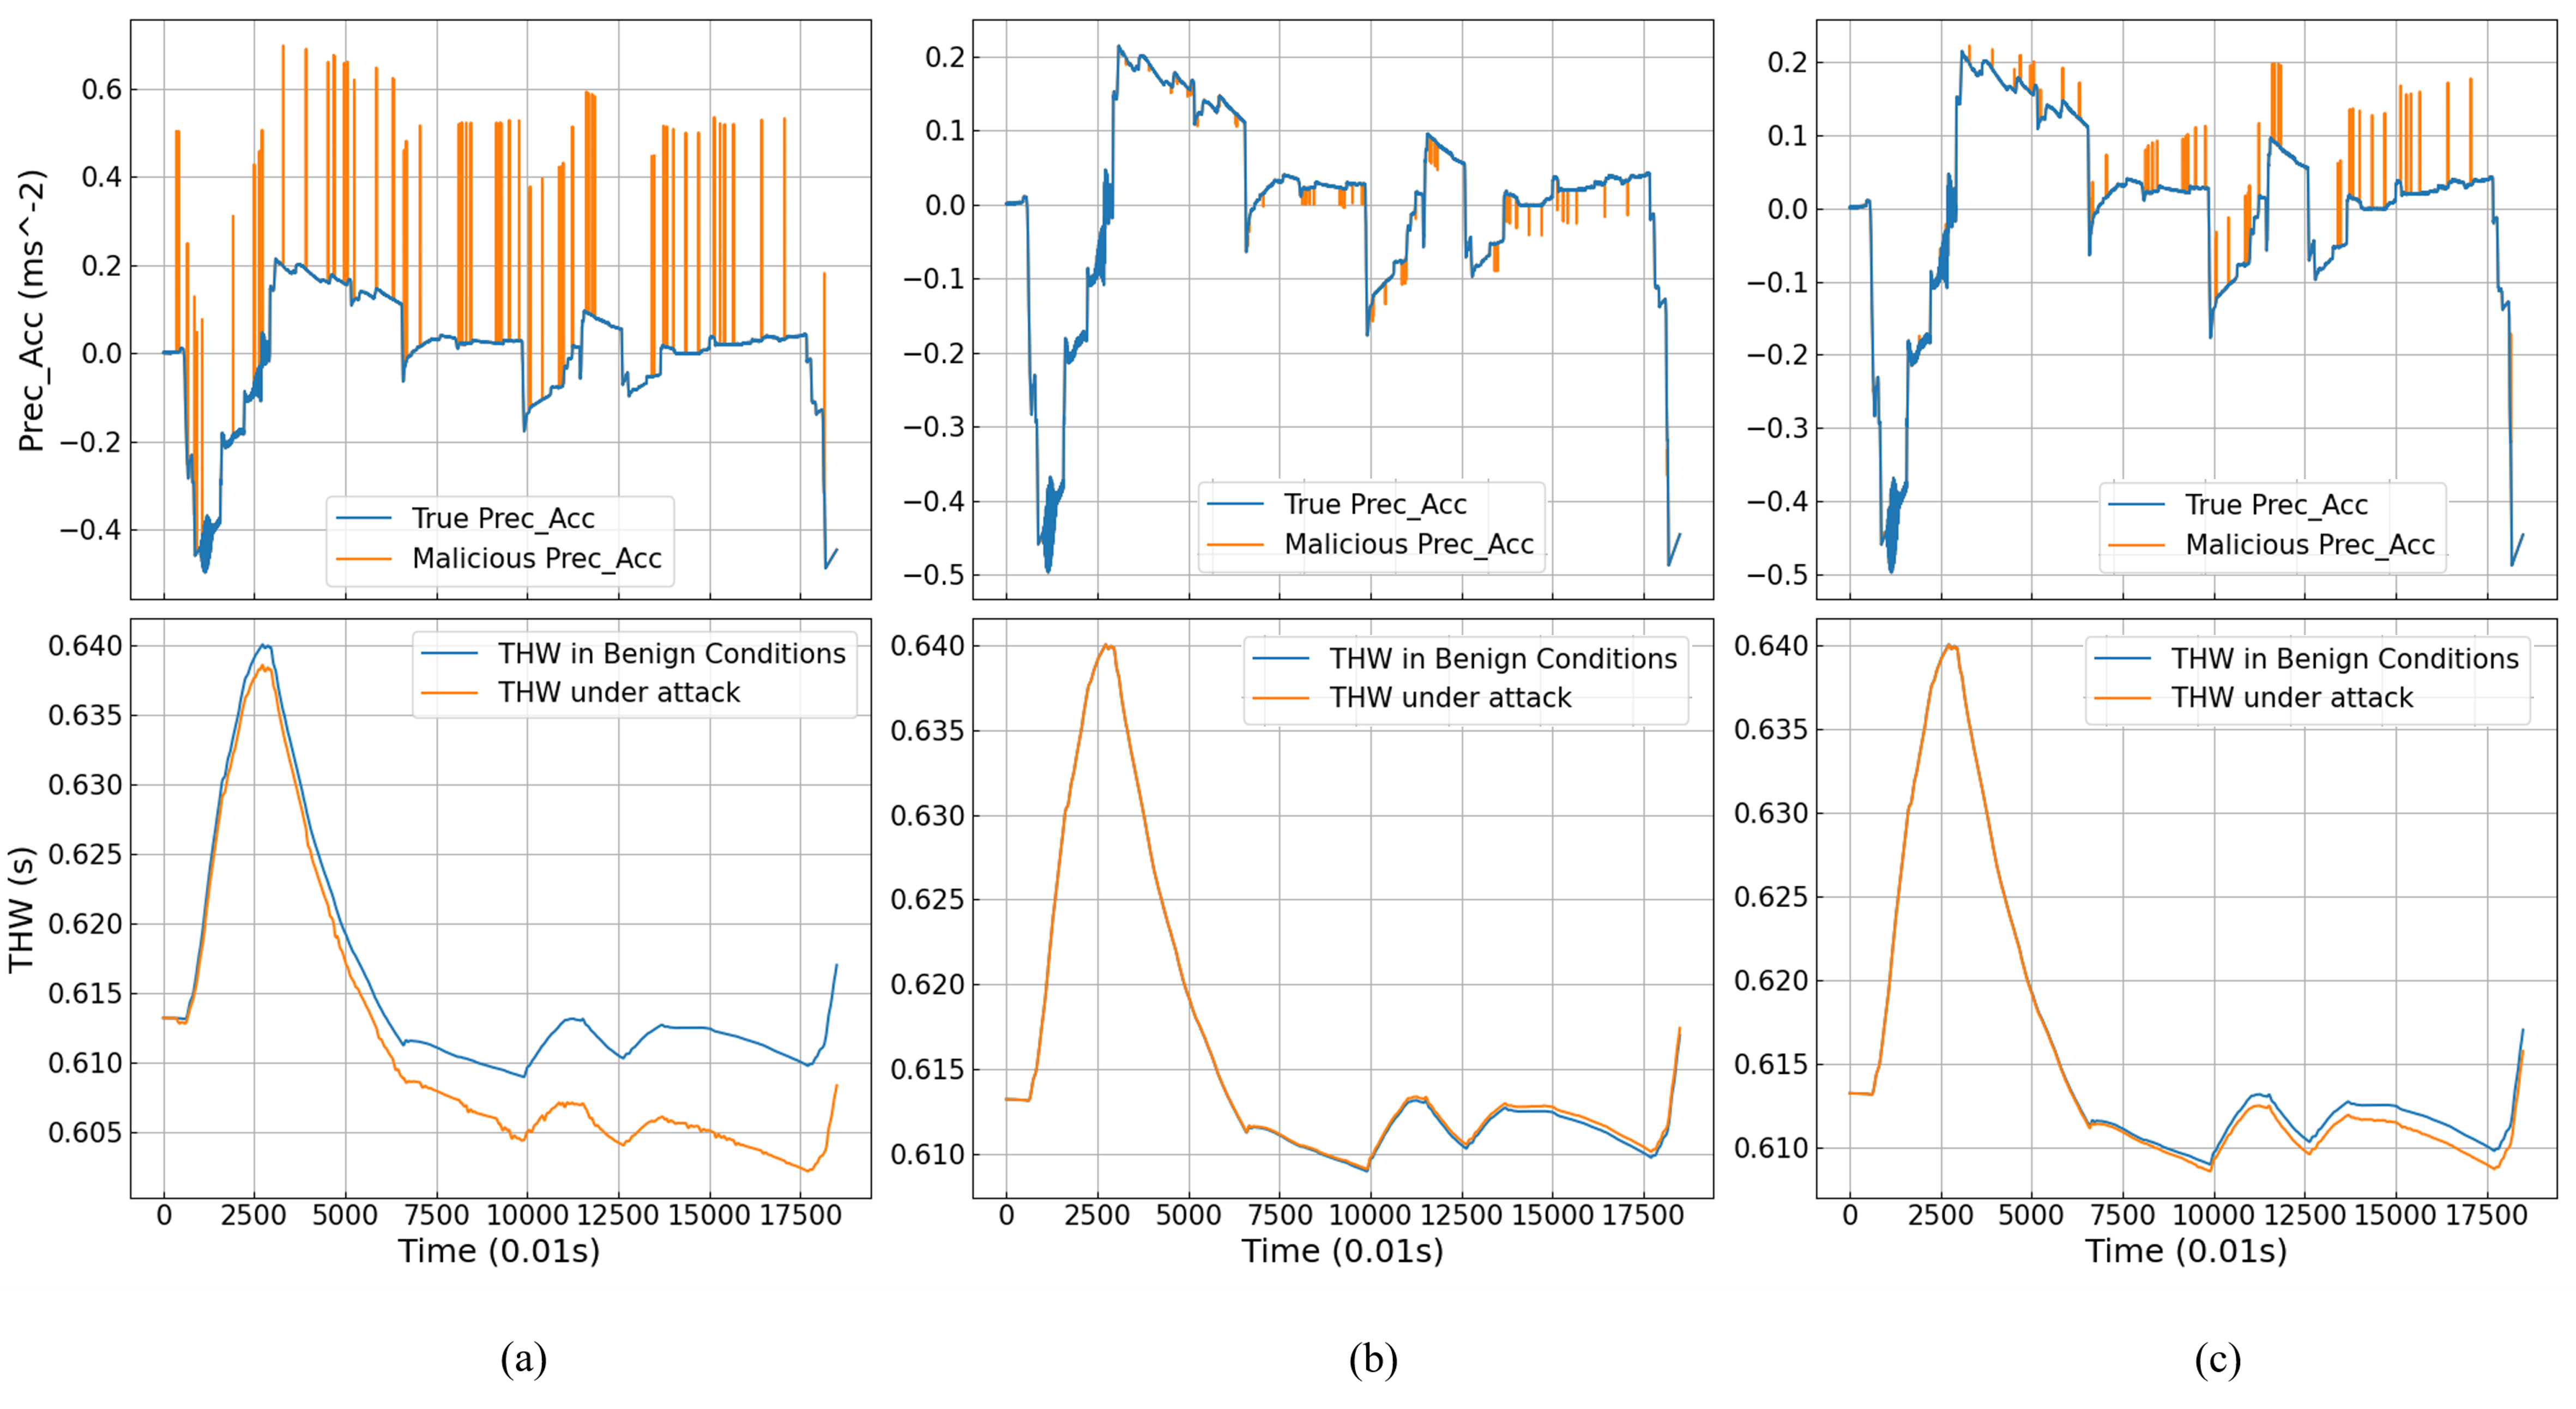
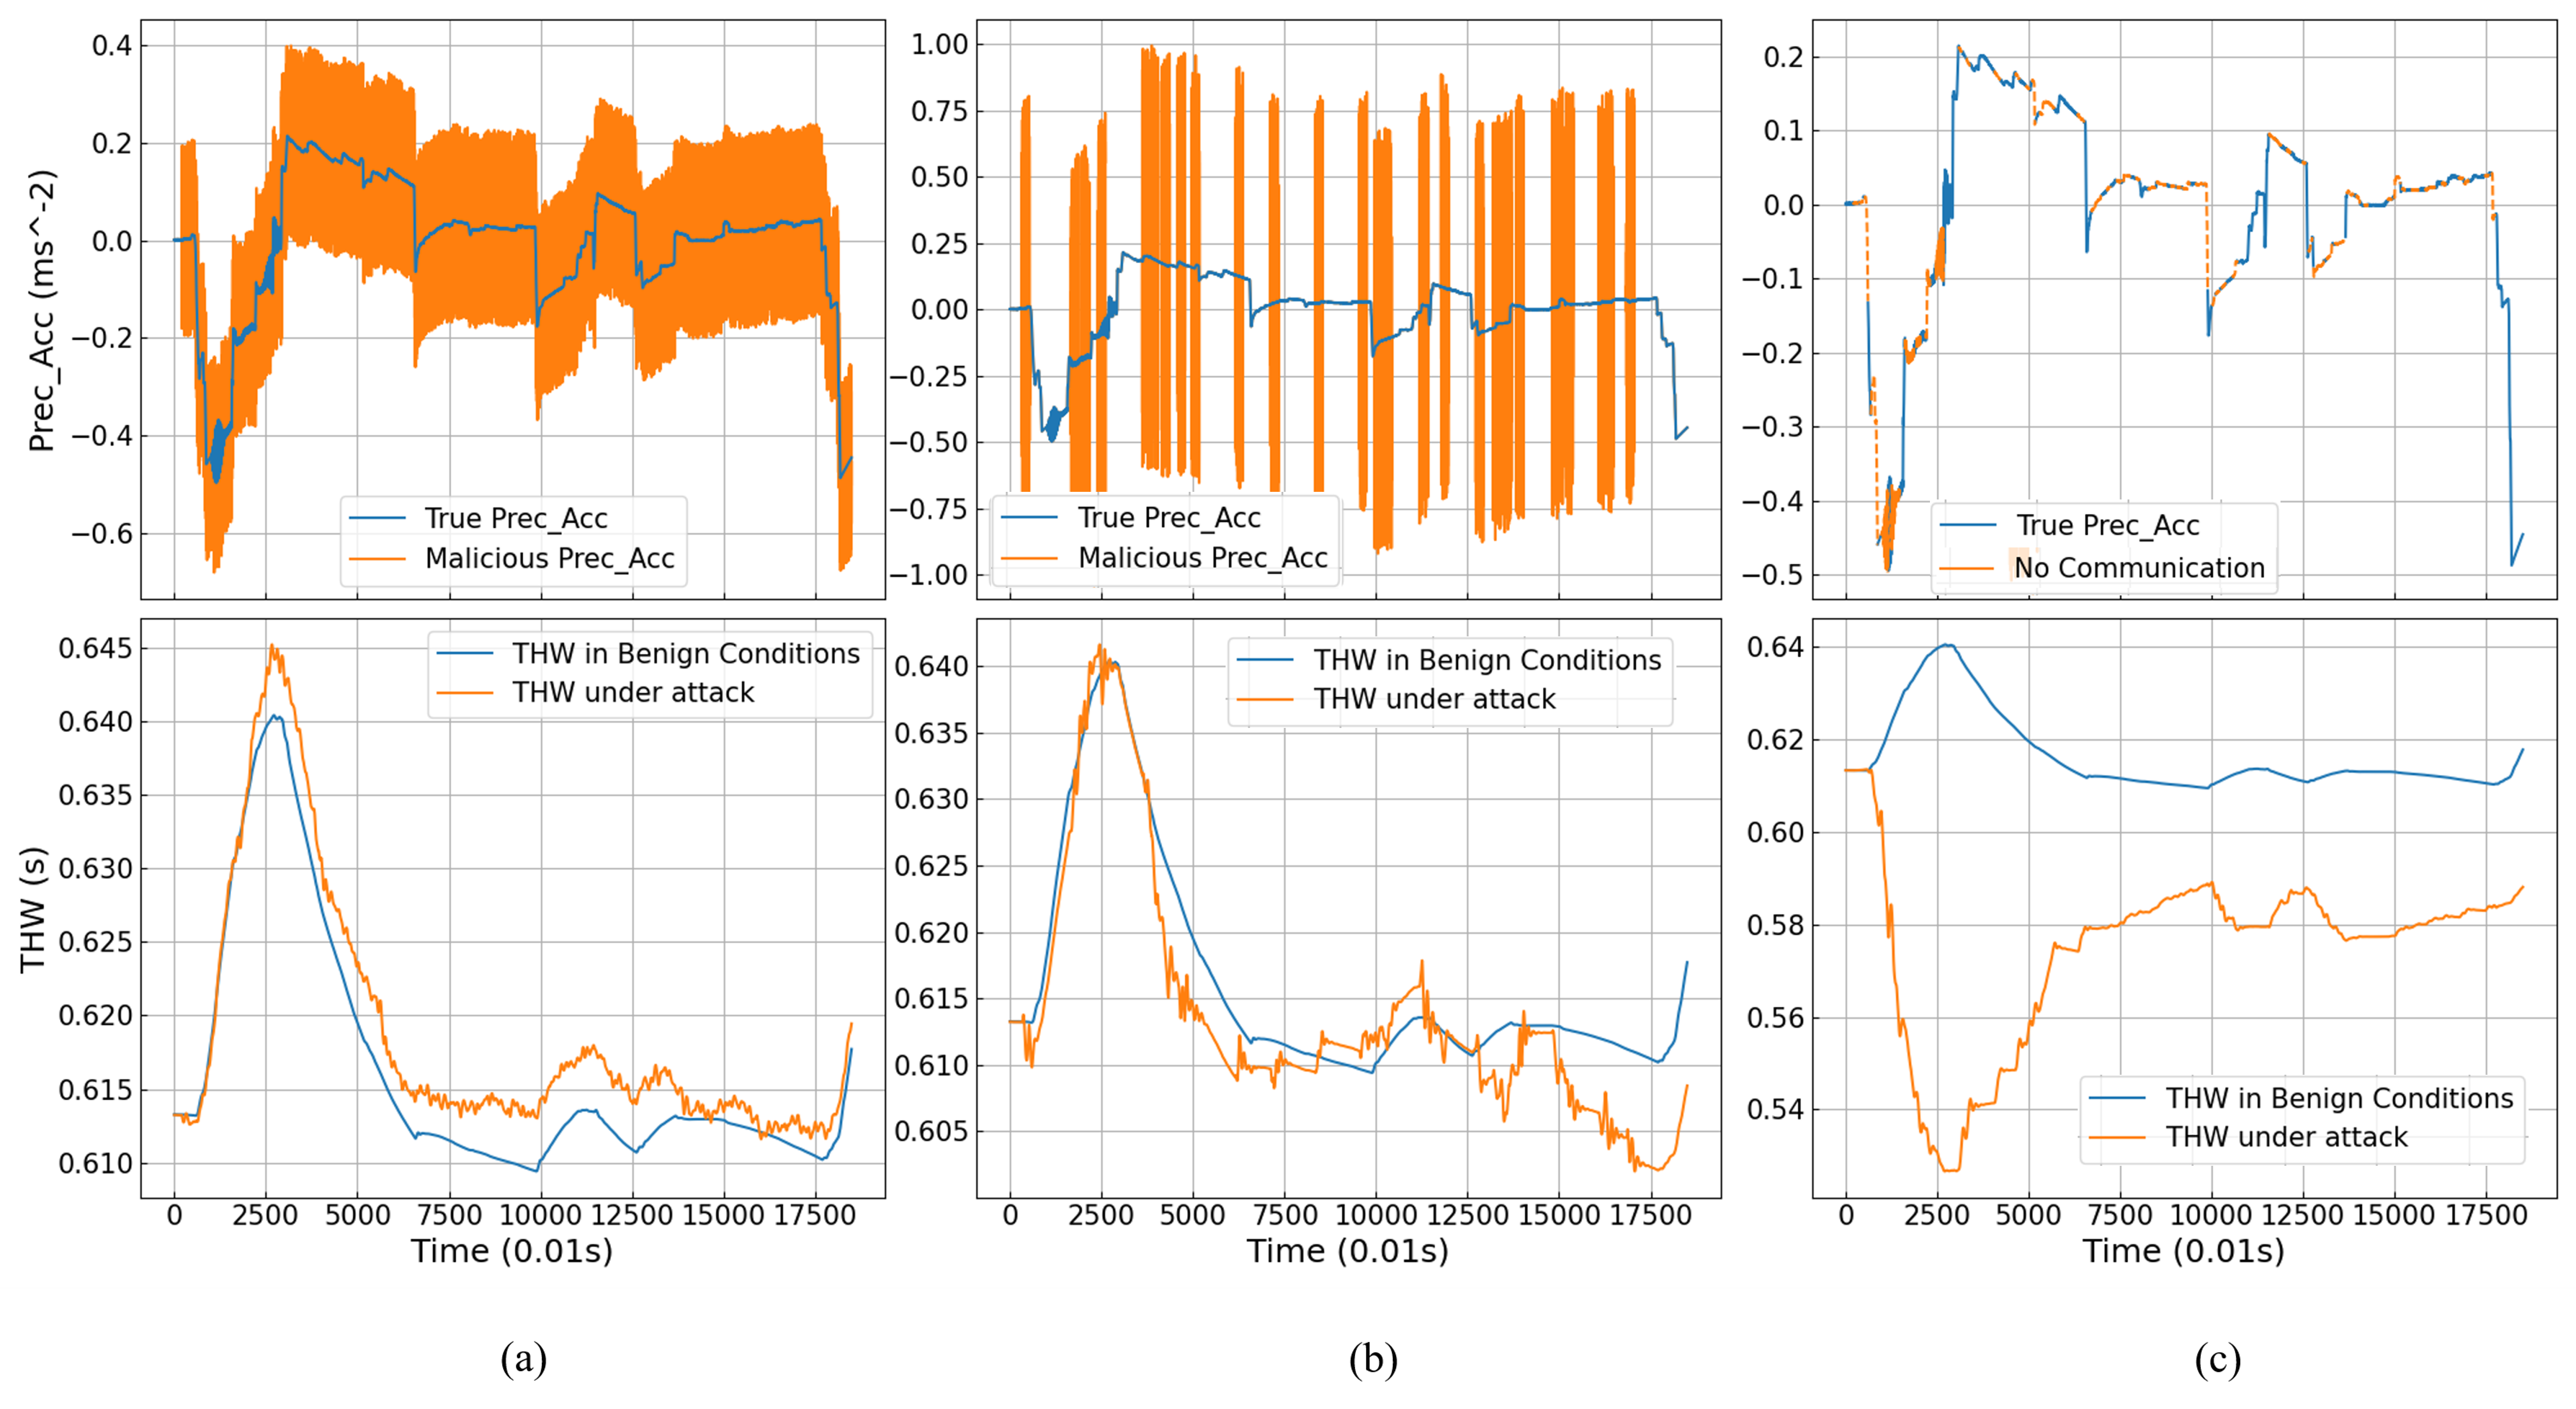
Our attack orchestration framework (Section V-C) enables systematic exploration of V2V attack space. However, to evaluate a resiliency solution we must also comprehend the impact of these attacks. Note that the impact depends not only on the magnitude of the bias (deviation from normal) but also the frequency: an attack with a small bias, but performed for a long duration, can cause a significant impact on the victim vehicle. Based on the taxonomy, we perform extensive experiments across the attack space to comprehend the impact of different categories of attacks.
Figs. 7, 8, 9, and 10 show the results of impact analysis for attack instances. These are specifically chosen attack scenarios that result in a perceptible impact on the target vehicle, while remaining stealthy. The attacks either involve smaller deviations from ground truth or infrequent malicious activity, making them hard to detect. In addition to the impact of the individual attack instances, we can make several cumulative conclusions. In particular, discrete attacks generally have lesser impact on the vehicle compared to cluster or continuous attacks. Furthermore, attacks that involve systematic mutation of ground truth (linear or sinusoidal) have significantly more impact on the target vehicle than attacks involving random mutation. In Section X, we will demonstrate the efficacy of RACCON under a similar set of attack instances.
IX Anomaly Detection Threshold
RACCON resiliency depends on the choice of the anomaly threshold: a threshold higher than optimal may lead to reduced detection accuracy, while a lower threshold may lead to increased false alarms in detection. High degree of false alarms results in inefficient invocation of RACCON’s Plausibility checker. Although plausibility checking computation is lightweight, the cumulative overhead can become significant since on-road vehicles operate mostly under benign conditions. An optimal threshold would enable safety as well as efficiency under adversarial scenarios while incurring minimal performance overhead in benign conditions. Our threshold estimation methodology works in three stages:
-
1.
Identify an acceptable threshold range for adversarial scenarios.
-
2.
Compute an approximate threshold value within the range by accounting for performance overhead under benign conditions.
-
3.
Fine-tune the value to optimize for detection subversion attacks. (See Section XI.)
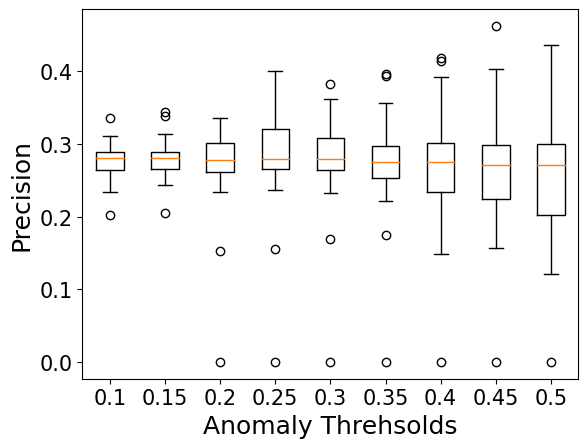
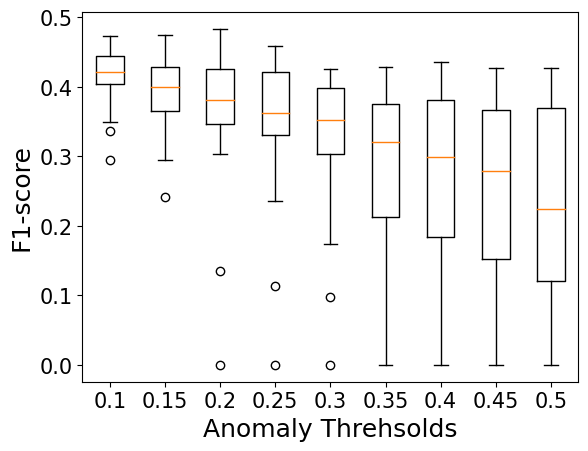
Computing Acceptable Threshold Range. We use three detection metrics: recall, precision, and f1-score, to estimate the quality of resiliency under attacks. A high precision value reflects smaller percentage of false alarms while a high recall reflects smaller percentage of undetected anomalies. A high f1-score (computed as the harmonic mean of recall and precision) indicates a combination of high precision as well as recall. We prioritize recall over precision since it is important to capture any anomaly that can possibly cause an undesired impact. Fig. 11(a), (b), and (c) show the distribution box-plots of the three detection metrics over all environments. The evaluation is carried out under a clustered sinusoidal attack corrupting about of the V2V messages. This attack is representative since it includes characteristics of both discrete and continuous attacks, and incorporates both positive and negative biases within the same attack instance. Note that recall degrades as the anomaly threshold increases from to . The best recall values (close to ) are observed for thresholds in the range -; however, the corresponding precision values are only -, indicating higher number of false alarms. Consequently, f1-scores reach an optimal value () for smaller values of the threshold (-) but decrease as the threshold increases.
Remark.
Observe from Fig. 11 that the f1-score boxes are not tightly packed around the mean, implying that the optimal anomaly threshold (based on f1-score) can vary across environments. Consequently, RACCON supports on-the-fly adjustment of threshold based on the current environment, using parameters from maps (e.g., location, terrain, etc.), ambient weather, and clocks.
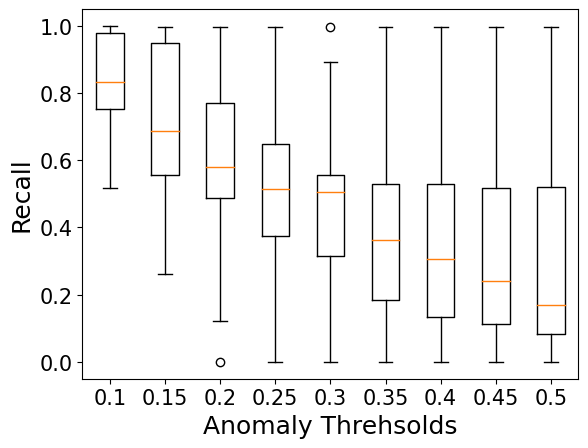
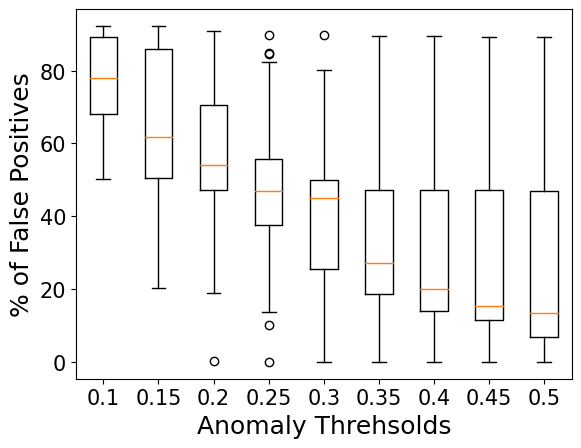
Performance Overhead in Benign Conditions. Fig. 11(d) illustrates the distribution of false positives under benign conditions for thresholds ranging -. Since larger thresholds result in low recall (see above), values larger than are disregarded. As with f1-score, thresholds in the range - have a high variance, indicating fluctuation with changing driving environment. The optimal anomaly threshold is selected by balancing the trade-off between better coverage under attack conditions and minimal overhead in benign conditions.
As an example, we obtain the optimal threshold for the environment Highway-Day-Windy as follows. First, we determine the ballpark range - that gives the best f1-score (recall close to and precision close to ). We eliminate thresholds less than to keep the false positives below %, refining the range to -. This is fine-tuned after evaluation under detection subversion to obtain the optimal choice (Section XI).
X RACCON Resiliency Evaluation
We performed extensive evaluation of RACCON resiliency using our flexible attack orchestration framework. Note that related work on detecting V2V compromises (see Section XII) does not include real-time mitigation; the only implied mitigation entails degrading to ACC (conservative controller action relying only on the trusted sensor systems). To provide a fair evaluation of RACCON, we compare it with (1) Naive CACC with no resiliency; and (2) CACC that degrades to ACC as mitigation. One way to view this evaluation is as a comparison between two extremes for safety-compromising attacks: the naive CACC controller is efficient but at the cost of safety, while degradation to ACC provides safety guarantee but at a significant efficiency cost (since ACC headway is much larger than CACC). The goal of RACCON is to enable optimal efficiency while guaranteeing safety, by maintaining THW in the range -s.
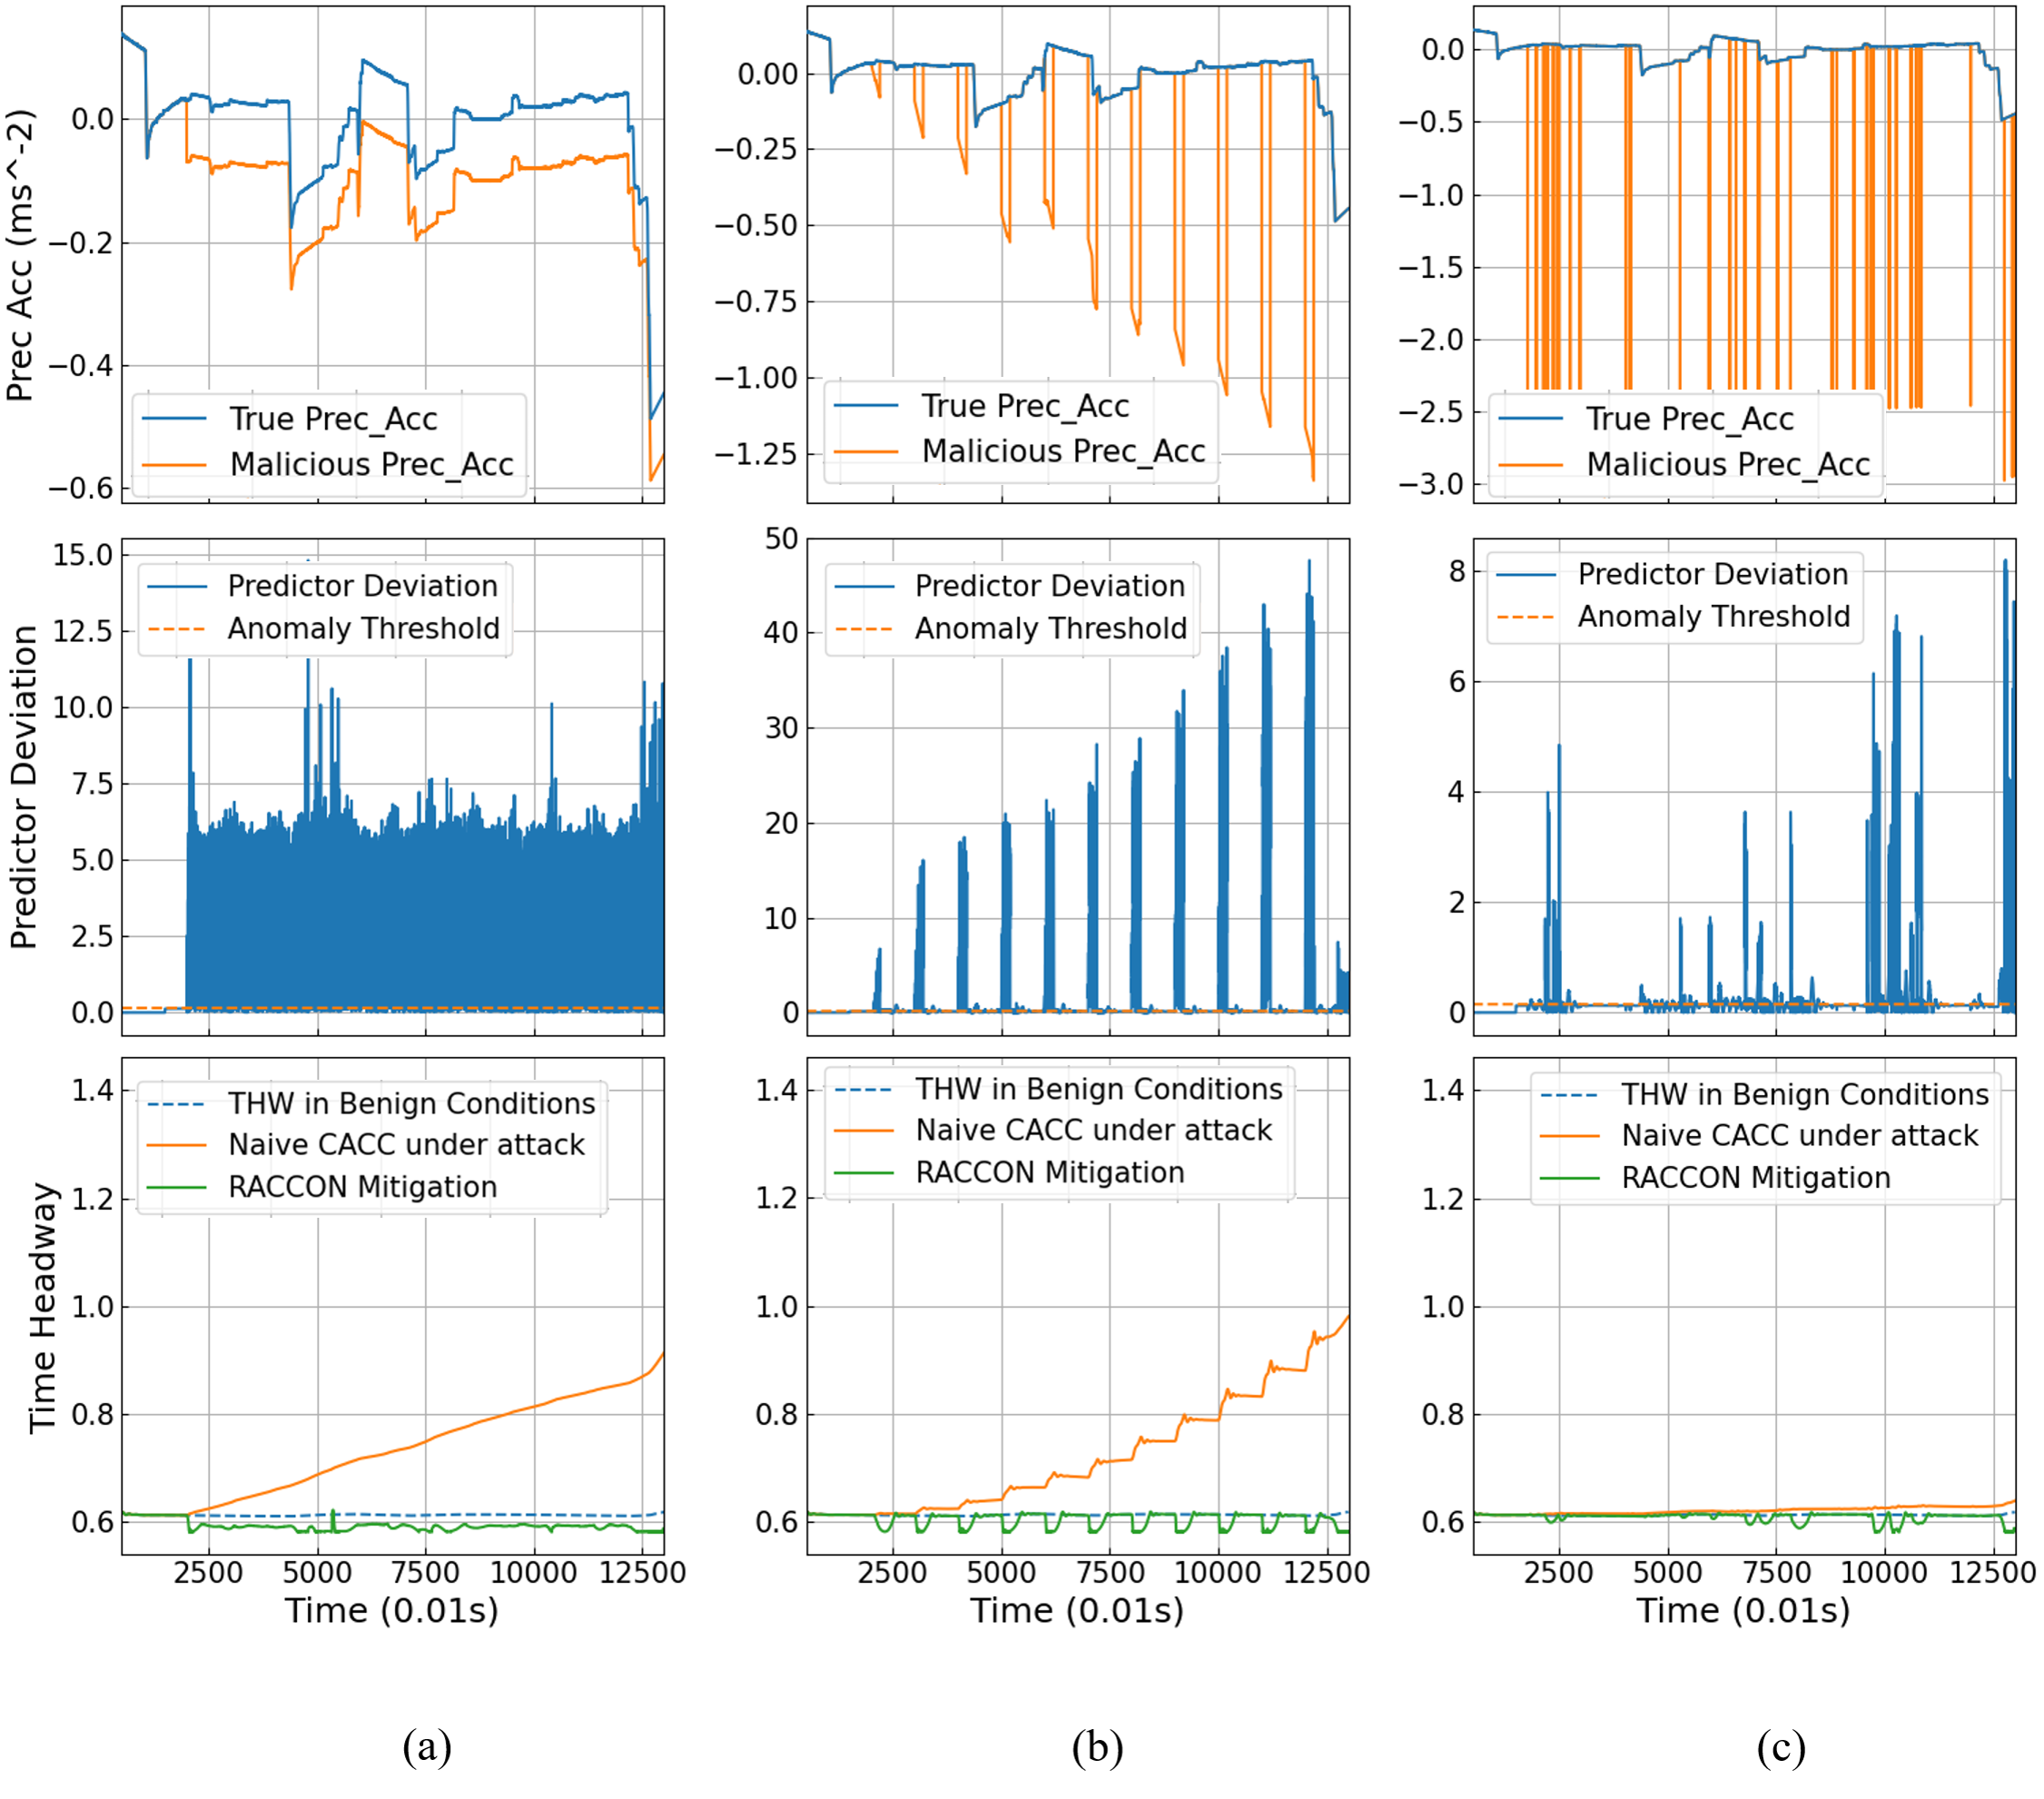
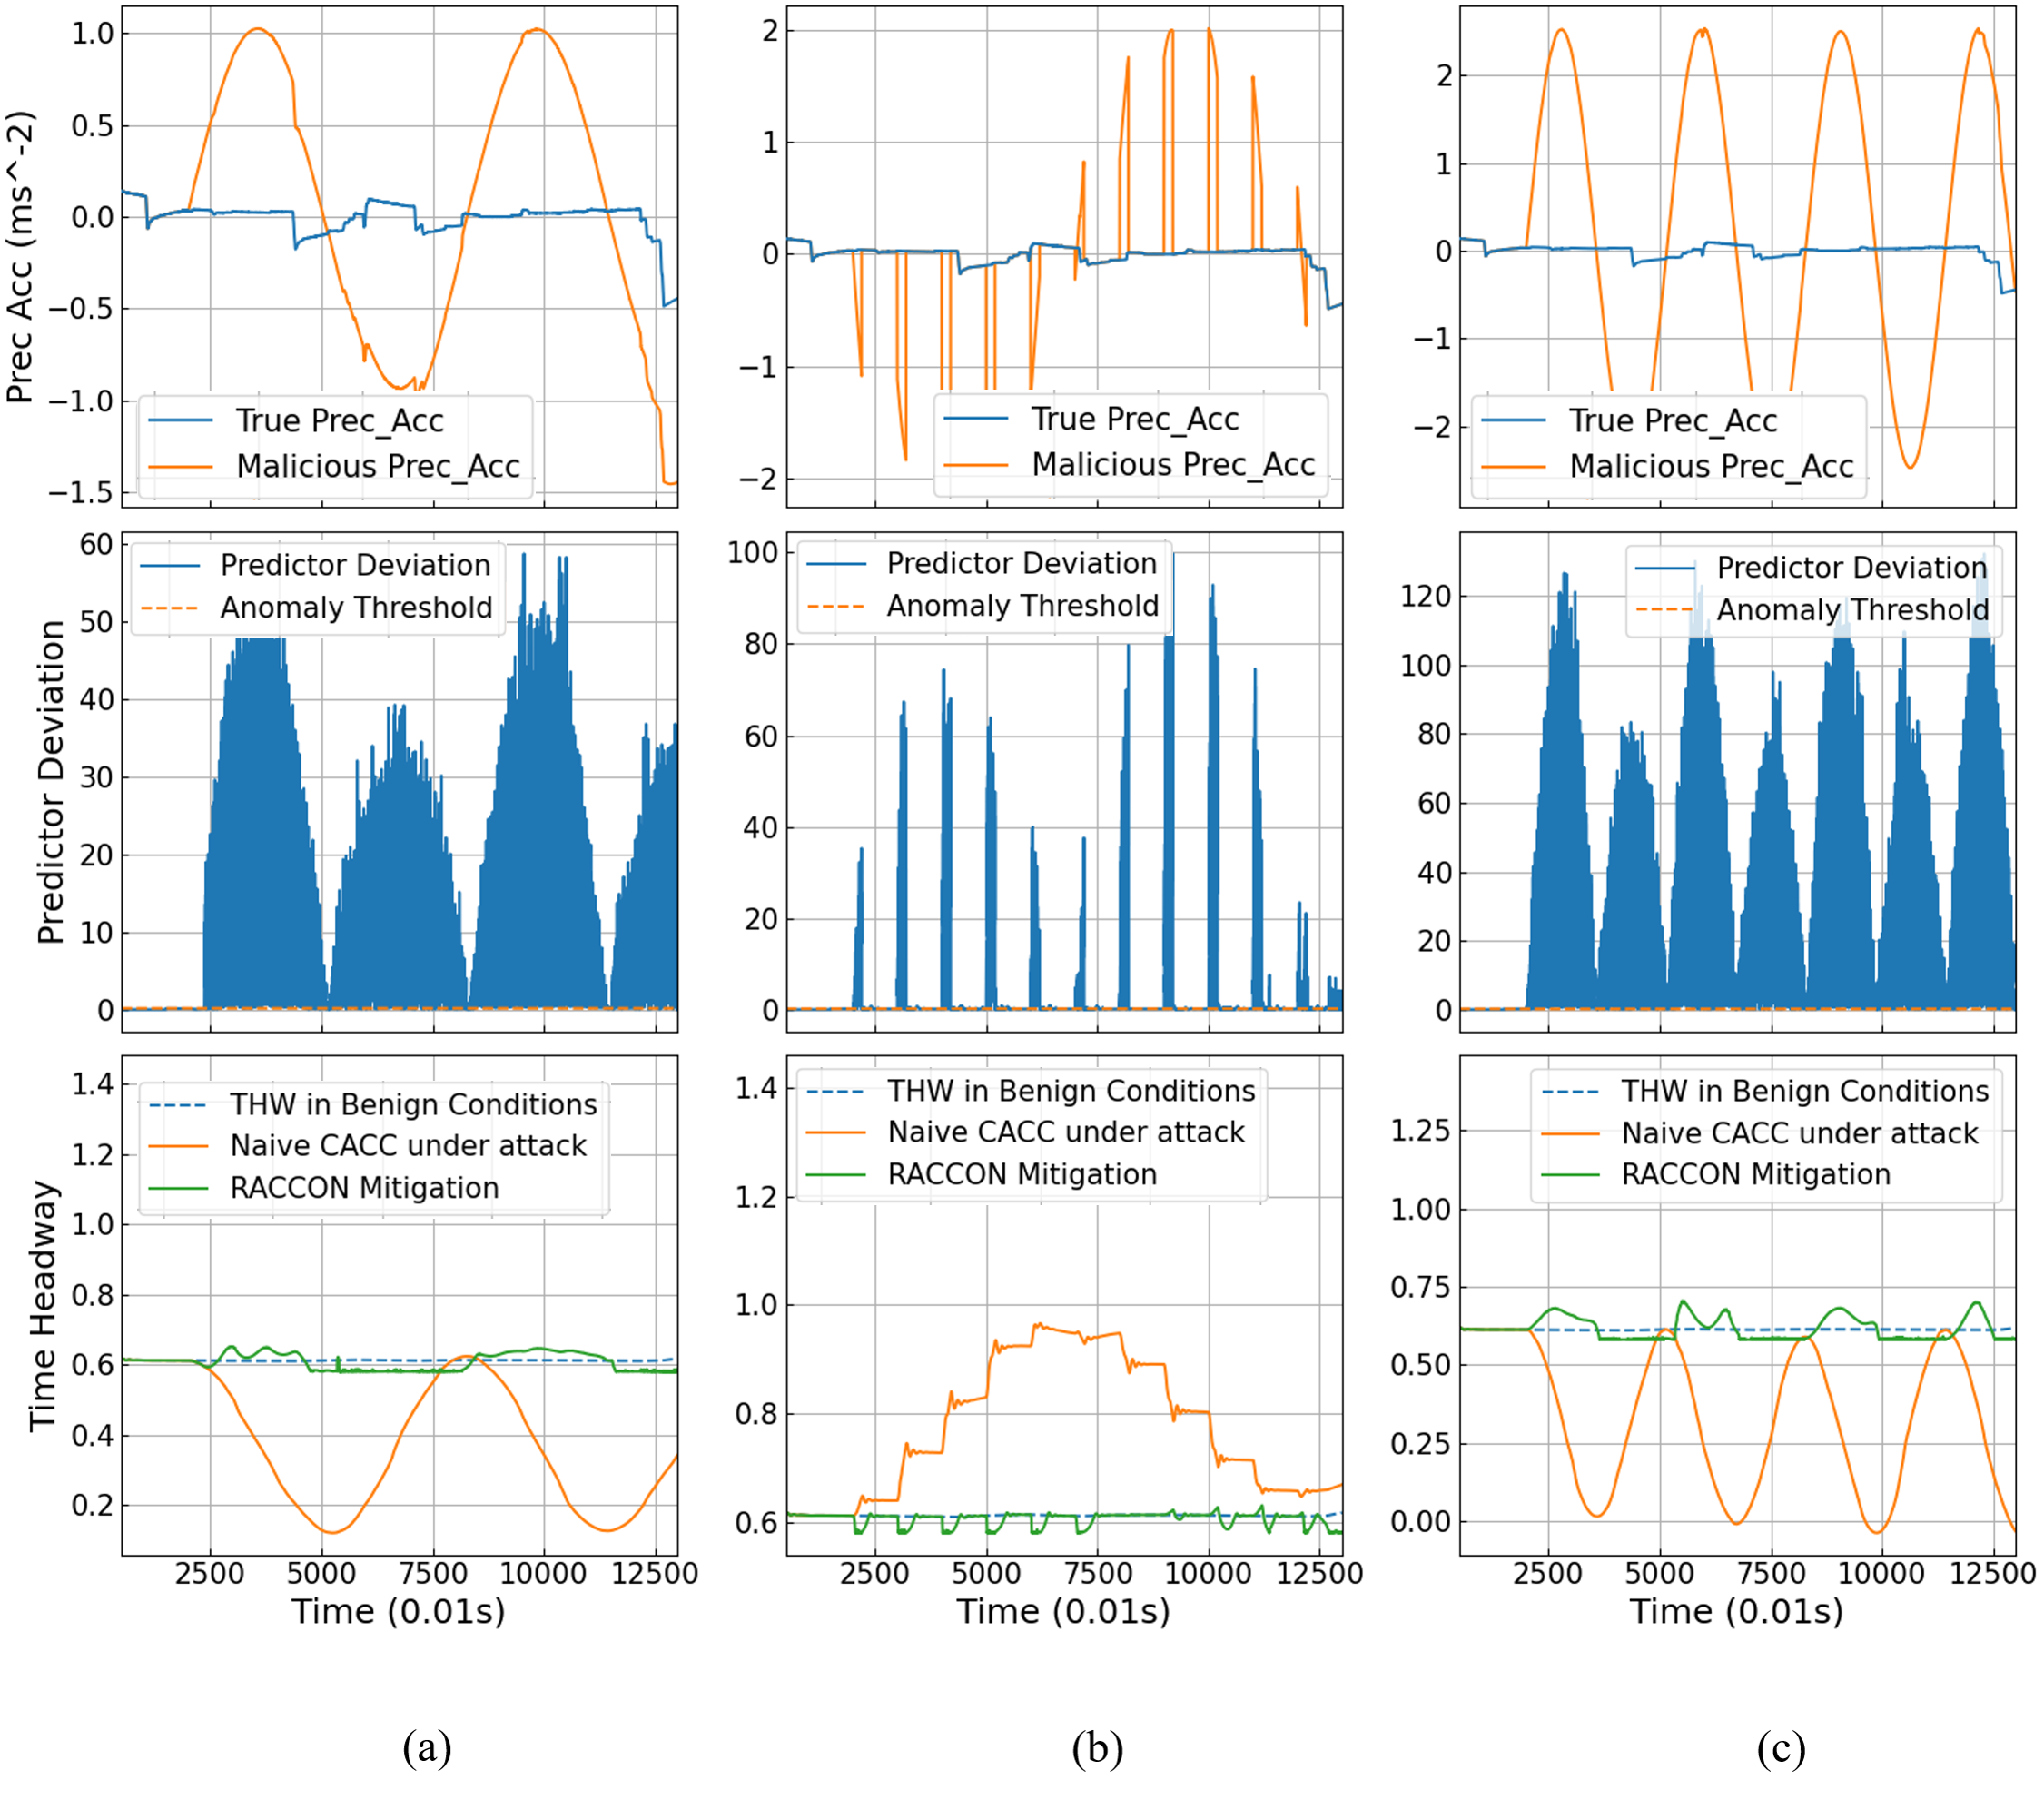
X-A Collision and Efficiency Degradation Attacks
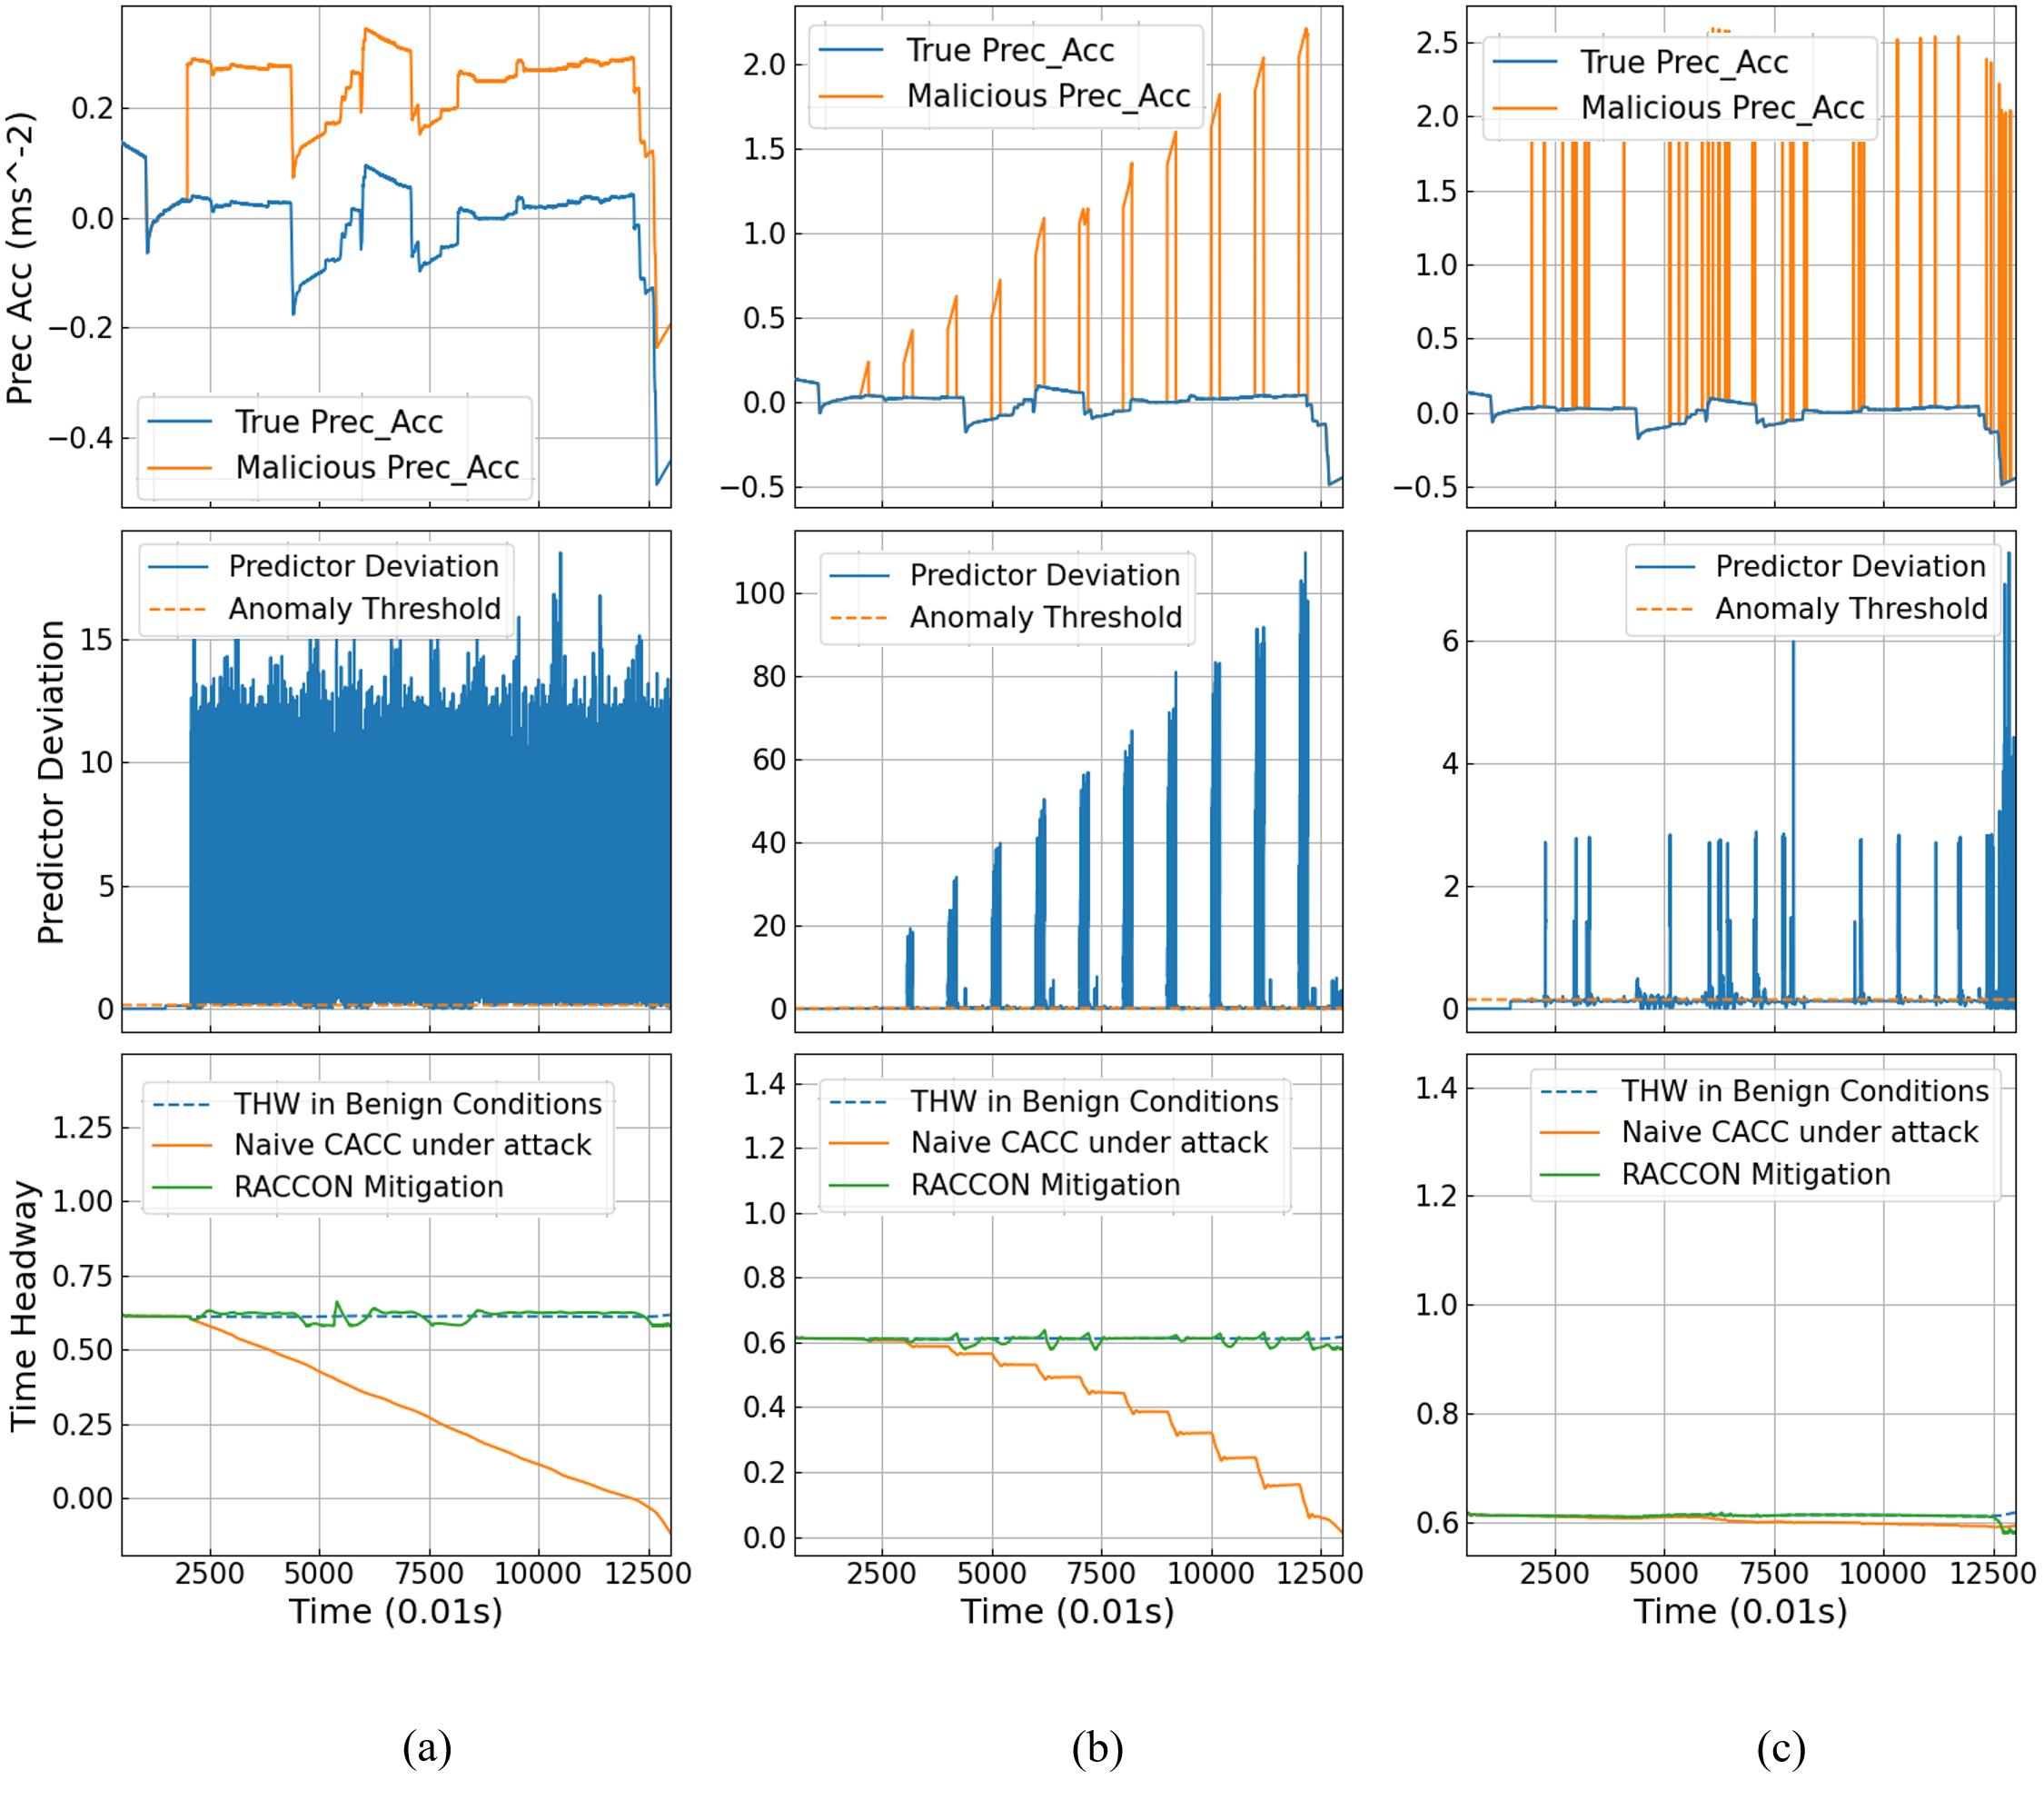
Tables V and VI show the numerical results for evaluation under six representative collision and efficiency attack scenarios. Figs. 12, 13 and Fig. 14 provide visual representation of RACCON mitigation. As with Section VIII, we showcase attacks that are impactful yet hard to detect due to small biases or infrequent malicious activities. In each table, we present a comparison between RACCON, mitigation degrading to ACC, and naive CACC with no resiliency. Tabular entries indicate the amount of time (as percentages of total driving time) during which the vehicle experiences THW values falling within a certain range. Based on these results we make the following observations.
-
•
Collision Attacks: RACCON successfully mitigates the collision attacks, maintaining THW within the optimal range of -s at all times. CACC without any resilience results in unsafe headway of less than s, and eventually, collision in some cases. Degrading to ACC prevents collisions, but THW is above s for over of the attack duration.
-
•
Efficiency Degradation Attacks: With RACCON, the maximum THW is around s. Without resilience, THW reaches s. Degrading to ACC also results in THW as high as s.
| Spurious communication: Linear function of ground truth | |||||||||
| Continuous Attack (linear bias= 0.3t) | Cluster Attack (constant bias= +0.8) | Discrete Attack (constant bias= +2.0) | |||||||
| RACCON | Degrade ACC | Naive CACC | RACCON | Degrade ACC | Naive CACC | RACCON | Degrade ACC | Naive CACC | |
| THW 0.55s | 0% | 0% | 84.54% | 0% | 0% | 73.83% | 0% | 0% | 0% |
| THW: | 100% | 54.01% | 15.46% | 100% | 51.13% | 26.17% | 100% | 55.28% | 100% |
| THW 0.75s | 0% | 45.99% | 0% | 0% | 48.86% | 0% | 0% | 44.72% | 0% |
| Collision | No | No | Yes | No | No | Yes | No | No | No |
| Spurious Communication: Sinusoidal function of ground truth | |||||||||
| Continuous Attack (bias= 0.5sin(0.02t)) | Cluster Attack (bias= 0.8sin(0.03t)) | Cluster Attack (bias= sin(0.05t)) | |||||||
| RACCON | Degrade ACC | Naive CACC | RACCON | Degrade ACC | Naive CACC | RACCON | Degrade ACC | Naive CACC | |
| THW 0.55s | 0% | 0% | 33.03% | 0% | 0% | 12.60% | 0% | 0% | 3.81% |
| THW: | 100% | 54.64% | 66.97% | 100% | 54.81% | 87.40% | 100% | 53.94% | 96.19% |
| THW 0.75s | 0% | 45.36% | 0% | 0% | 45.19% | 0% | 0% | 46.06% | 0% |
| Collision | No | No | Yes | No | No | No | No | No | No |
| Spurious communication: Linear function of ground truth | |||||||||
| Continuous (linear bias= -0.3t) | Cluster (constant bias= -0.8) | Discrete (constant bias= -2.0) | |||||||
| RACCON | Degrade ACC | Naive CACC | RACCON | Degrade ACC | Naive CACC | RACCON | Degrade ACC | Naive CACC | |
| THW 0.55s | 0% | 0% | 0% | 0% | 0% | 0% | 0% | 0% | 0% |
| THW: | 100% | 55.42% | 21.55% | 100% | 55.25% | 18.85% | 100% | 54.83% | 100% |
| THW 0.75s | 0% | 44.58% | 78.45% | 0% | 44.75% | 81.15% | 0% | 45.17% | 0% |
| Maximum THW | 0.65s | 1.56s | 1.79s | 0.65s | 1.55s | 1.54s | 0.65s | 1.54s | 0.70s |
| Spurious Communication: Sinusoidal function of ground truth | |||||||||
| Continuous Attack (bias= -0.5sin(0.02t)) | Cluster Attack (bias= -0.8sin(0.03t)) | Cluster Attack (bias= -sin(0.05t)) | |||||||
| RACCON | Degrade ACC | Naive CACC | RACCON | Degrade ACC | Naive CACC | RACCON | Degrade ACC | Naive CACC | |
| THW 0.55s | 0% | 0% | 0% | 0% | 0% | 0% | 0% | 0% | 0% |
| THW: | 100% | 54.67% | 79.97% | 100% | 54.14% | 94.01% | 100% | 54.49% | 98.35% |
| THW 0.75s | 0% | 45.33% | 20.03% | 0% | 45.86% | 5.99% | 0% | 45.51% | 1.65% |
| Maximum THW | 0.65s | 1.56s | 0.83s | 0.65s | 1.55s | 0.79s | 0.65s | 1.54s | 0.75s |
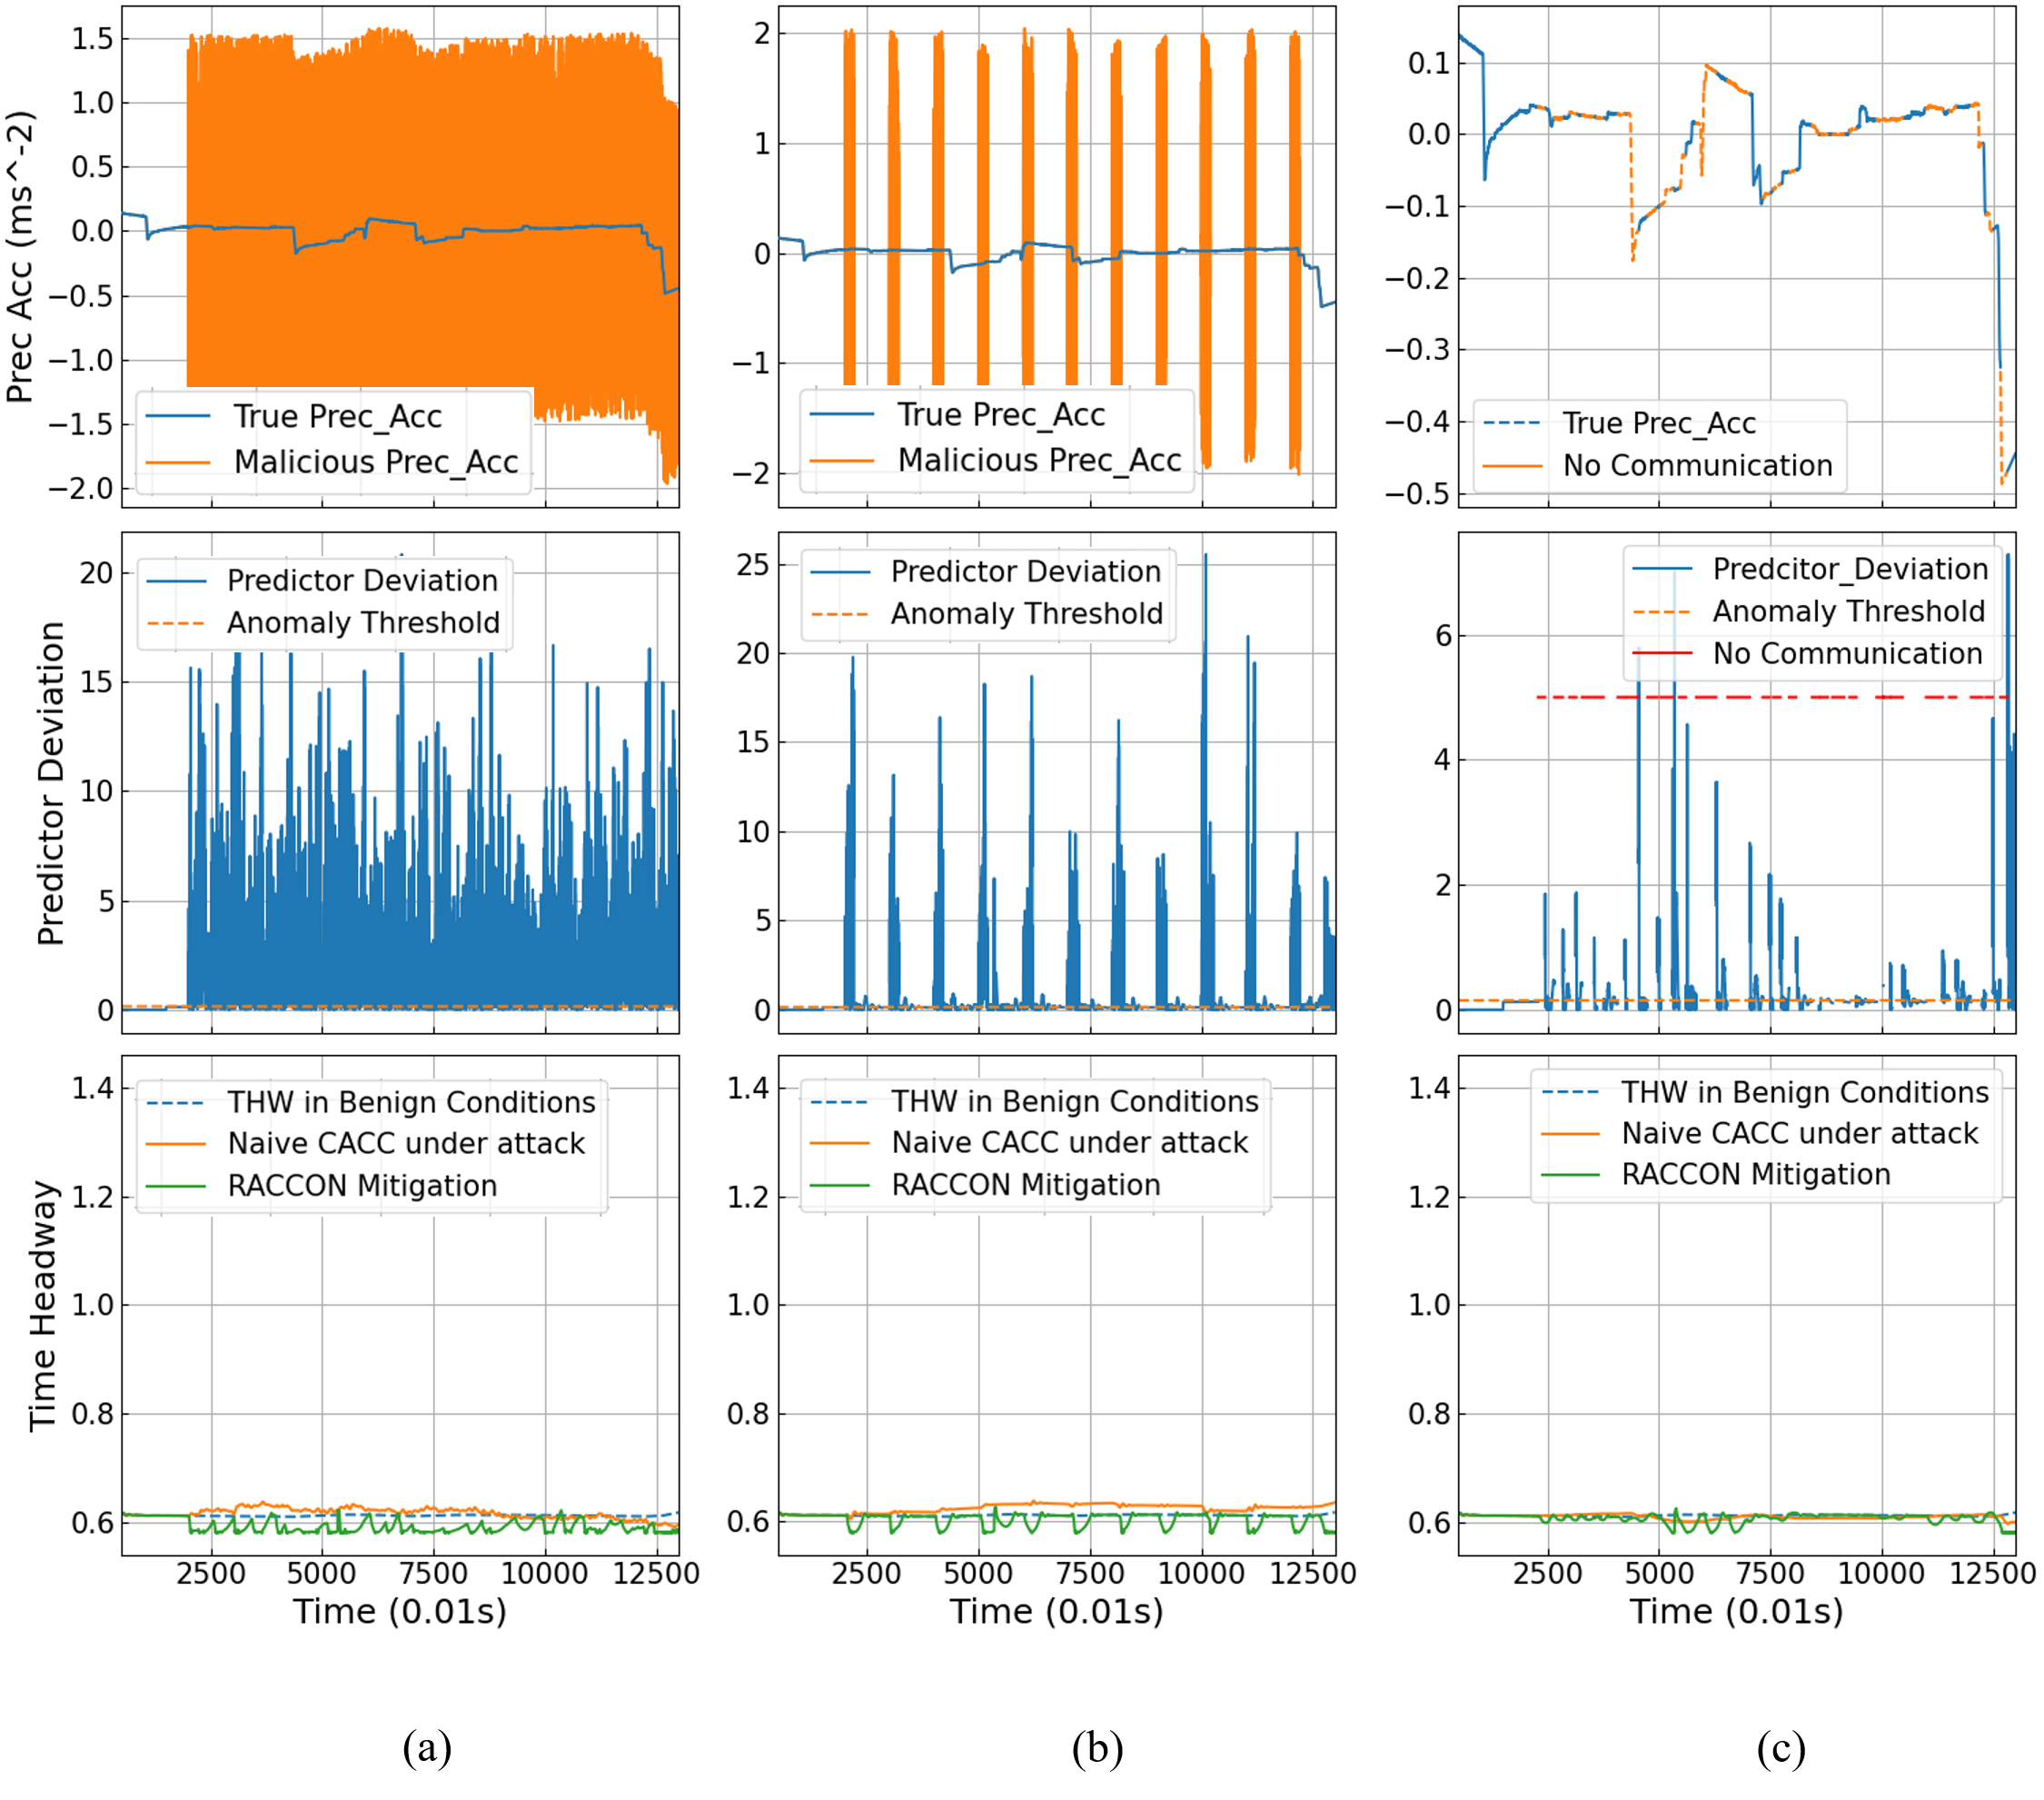
X-B Random Communication and Delivery Prevention attacks
We also studied effects of random message mutation and delivery prevention (Table VII and Fig. 15). The results show the importance of the thorough attack impact analysis we carried out. Recall from Section VIII that these attacks have much less impact than Collision and Efficiency Degradation attacks. A critical aspect of resiliency evaluation is to ensure it does not incur high mitigation overhead. Both RACCON and naive CACC maintain within the ideal range at all times; however, degrading to ACC incurs significant efficiency loss.
| Random Mutation Attacks | |||||||||
| Continuous (random bias=-2.0,2.0) | Cluster (random bias=-2.0,2.0) | Discrete (random bias=-2.0,2.0) | |||||||
| RACCON | Degrade ACC | Naive CACC | RACCON | Degrade ACC | Naive CACC | RACCON | Degrade ACC | Naive CACC | |
| THW 0.55s | 0% | 0% | 0% | 0% | 0% | 0% | 0% | 0% | 0% |
| THW: | 100% | 54.07% | 100% | 100% | 55.69% | 100% | 100% | 55.20% | 100% |
| THW 0.75s | 0% | 45.93% | 0% | 0% | 44.31% | 0% | 0% | 44.80% | 0% |
| Max THW | 0.65 | 1.54 | 0.73 | 0.65 | 1.55 | 0.65 | 0.65 | 1.54 | 0.65 |
| Delivery Prevention Attacks | |||||||||
| Intermittent (frequency= 0.2Hz, duration=1.5s) | Intermittent (frequency= 0.1Hz, duration=2s) | Intermittent (frequency= 0.2Hz, duration=5s) | |||||||
| RACCON | Degrade ACC | Naive CACC | RACCON | Degrade ACC | Naive CACC | RACCON | Degrade ACC | Naive CACC | |
| THW 0.55s | 0% | 0% | 0% | 0% | 0% | 0% | 0% | 0% | 3.29% |
| THW: | 100% | 54.86% | 100% | 100% | 54.88% | 100% | 100% | 54.92% | 96.71% |
| THW 0.75s | 0% | 45.14% | 0% | 0% | 45.12% | 0% | 0% | 45.08% | 0% |
| Max THW | 0.65 | 1.54 | 0.65 | 0.65 | 1.54 | 0.65 | 0.65 | 1.54 | 0.66 |
X-C N-Day Attacks
Attacks orchestrated in Sections X-A and X-B systematically cover the taxonomy discussed in Section V-B. Since our taxonomy comprehensively represents the whole V2V attack spectrum, it is established from our evaluation results that RACCON is robust against any arbitrary V2V attack under the threat model, including both known (-day) and unknown (-day) attacks. Nevertheless, it is illustrative to directly evaluate RACCON against some known attacks. In this section, we consider three well-known attacks, e.g., Man-in-the-Middle (MITM), Denial-of-Service (DoS) through Jamming, and DoS through Flooding.
-
•
MITM Attack: We instantiate an MITM adversary that mutates the preceding vehicle acceleration values by adding a continuous sinusoidal bias, using the function .
-
•
DoS through Jamming: We implement a DoS attack in which the adversary jams the communication channel, preventing delivery of (legitimate) V2V messages. The channel is jammed for seconds once every seconds.
-
•
DoS through Flooding:. The adversary floods the communication channel with fabricated packets that interfere with delivery of legitimate communication. We add fabricated packets in bursts, once every seconds, for a duration of seconds.

Fig. 16 illustrates RACCON mitigation efficacy under these attacks. It maintains close to ideal at all times, while CACC without resiliency results in of less than s for MITM. Mitigation based on fallback to ACC results in significant efficiency degradation for the jamming attack.
XI Detector Subversion
The fact that RACCON is an ML-based framework can make it vulnerable to adversaries subverting the learning and prediction systems themselves. Such adversaries can create anomalous data that is nevertheless accepted as normal by the detector, thereby bypassing any mitigation against the attack. We call these attacks detector subversion.
Obviously, a very low selection of anomaly threshold can ensure high robustness against detector subversion. However, recall from Section IX that a low anomaly threshold can result in high false alarms. Consequently, we fine-tune the threshold value within the ballpark range obtained from Section IX, balancing the trade-off. We use the following parameters in our analysis.
-
•
Tolerable Bias: This is the maximum bias added to the ground truth, beyond which there is a perceptible impact on the target vehicle’s safety or efficiency.
-
•
Subversion Detectability Index: This is the minimum bias added to ground truth, that can be successfully captured by the detection system.
-
•
False Positives in Benign Conditions: This is the percentage of normal communication messages, incorrectly tagged as anomalies by RACCON in benign operating conditions.
The goal is to determine the optimal anomaly threshold which enables the detection of every attack beyond the tolerable bias, while keeping the the number of false positives small.
Table VIII presents results for threshold choices for a representative driving environment, Highway-Day-Windy. Recall from Section IX that we determined the approximate optimal threshold range for this environment to be -. To fine-tune for resiliency under detector subversion, we determine the tolerable bias for attacks of varying stealth factor; note that it is much smaller for a continuous attack () than a discrete attack (). For optimal threshold, the subversion detectability index should be less than the tolerable bias for each class of attack. The highlighted row shows the optimal choice of the anomaly threshold (), since it has the minimum fraction of false positives out of all the choices providing acceptable subversion detectability.
| Anomaly Threshold | False Positives Benign Condition | Subversion Detectability Index | |||||
| Continuous (Tolerable bias: 0.04) | Cluster (Tolerable bias: 0.1) | Discrete (Tolerable bias: 5.0) | |||||
| Min. constant bias | Min. sinusoidal bias | Min. constant bias | Min. sinusoidal bias | Min. constant bias | Min. sinusoidal bias | ||
| 0.25 | 0% | 0.35 | 0.25sinft | 0.4 | 0.35sinft | 0.5 | 3sinft |
| 0.2 | 2.96% | 0.3 | 0.2sinft | 0.3 | 0.3sinft | 0.35 | 1sinft |
| 0.18 | 10.74% | 0.3 | 0.2sinft | 0.3 | 0.3sinft | 0.35 | 0.35sinft |
| 0.15 | 11.91% | 0.01 | 0.01sinft | 0.03 | 0.02sinft | 0.25 | 0.25sinft |
| 0.13 | 21.2% | 0 | 0 | 0.0001 | 0.0001sinft | 0.01 | 0.01sinft |
| 0.12 | 58.1% | 0 | 0 | 0 | 0 | 0 | 0 |
XII Related Work and Discussion
Automotive security research has been traditionally focused on in-vehicle vulnerabilities or adversaries exploiting the lack of secure communication [8, 15, 19]. Machine learning has primarily been used for computer vision modules to improve on-board perception [28, 26] or for securing in-vehicle networks, e.g., CAN bus [25, 31]. With the emergence of CAV systems, recent research has focused on security of cooperative and safety applications such as platooning [9], intersection management [7], collision avoidance, emergency vehicle warning, lane merge and turn conflict warning, etc. [6],[14]
Since CACC serves as a foundation of a variety of CAV applications, significant attention has been given towards detection of attacks on CACC. This research primarily involves application of control theory or machine learning solutions. Abdo et al. [2] present a survey on application level communication attacks on CACC and their adverse impacts on the target vehicles. Liu et al. [18], Parkinson et al. [21] and AbdAllah et al. [1] discuss the challenges in CACC security and provide research directions. Biron et al. [3] and Dutta et al. [10] use approaches based on control theory to detect and correct adversarial sensor-based attacks on CACC. Heijden et al. [29] propose a misbehavior detection mechanism based on subjective logic, to validate the position information exchanged between vehicles. Nunen et al. [30] propose a control-theoretic model-predictive approach to deal with short communication failures and packet dropouts in CACC. Among machine learning approaches, Alotibi et al. [4] propose a real-time detection mechanism for platoons, in the context of a compromised leader reporting falsified acceleration values to the following vehicles. Iorio et al. [12] propose a misbehavior detection approach for injection attacks on CACC, based on correlation between various vehicular motion parameters. Jagielski et al. [13] discuss detection of attacks that compromise communication or manipulate the on-board sensor readings, through physics-based constraints and machine learning. Levi et al. [17] present an event-based anomaly detection technique for connected vehicles using Hidden Markov Models. Tiwari et al. [27] describe attack features that are undetectable at individual time instances but can be detected from sequential data.
In spite of this extensive research, we are not aware of any previous solution addressing detection of the spectrum of attacks explored for RACCON. Control-theoretic approaches require a detailed functional model of the adversarial action. Each attack type (e.g., flooding, jamming, etc.) requires a different detailed adversary model. In contrast, RACCON is an ML-based anomaly detection approach that only depends upon benign V2V communication data. RACCON’s attack-agnostic defense is effective against the entire spectrum of V2V adversaries. On the other hand, related ML-based approaches have only been evaluated under a specific subset of attacks, e.g., linear or sinusoidal mutation attacks on acceleration values [4, 13].
A unique aspect of RACCON is real-time resiliency, providing optimal efficiency while guaranteeing safety under adversarial conditions. This vision has guided several components of RACCON’s design and evaluation. For instance, while all related ML-based anomaly detection approaches focus on identifying discrepancies in controller inputs, RACCON is designed to monitor the controller’s response. This permits RACCON to correct the erroneous response appropriately and minimize the impact of anomalous (and potentially malicious) inputs on the ego vehicle. The need for resiliency also requires us to determine the severity and impact of the attack itself, i.e., an attack is impactful and needs mitigation if it results in the ego vehicle performing an unsafe or inefficient action. This requirement has also led to the understanding of the trade-offs between stealth and impact, e.g., clustered and continuous attacks are more impactful than discrete attacks, and are correspondingly less stealthy. The need for real-time responses has motivated our design goals for viable ML models that satisfy automotive resource constraints. Finally, the complex trade-off between robustness and performance has guided our methodology for optimal anomaly threshold computation.
XIII Conclusion and Future Work
We have presented what we believe is the first comprehensive resiliency framework for CACC against V2V attacks. Our work uses machine learning to predict the ego vehicle’s responses, and capture communication anomalies in real-time, based on deviation between the predicted and actual responses. We also developed a robust real-time mitigation technique that can effectively nullify the adverse effects of anomalous communication. A unique feature of this mitigation is to guarantee safety while preserving efficiency. Unlike systems that degrade to ACC in response to an anomaly, our solution enables the target vehicle to safely engage in CACC even under attack. We have also developed one of the most comprehensive experimental frameworks for resiliency evaluation, based on a taxonomy of adversaries capturing the entirety of the V2V attack spectrum. Our experiments clearly demonstrate the viability of RACCON as a means for providing resiliency in CACC under V2V attacks.
In our future work, we will explore extension of this resiliency architecture to other connected car applications. We will also augment RACCON with existing techniques for additionally detecting sensor attacks, resulting in more robust CACC.
References
- [1] E. G. AbdAllah, M. Zulkernine, Y. X. Gu, and C. Liem. Towards defending connected vehicles against attacks. In Proceedings of the Fifth European Conference on the Engineering of Computer-Based Systems, ECBS ’17, New York, NY, USA, 2017. Association for Computing Machinery.
- [2] A. Abdo, S. M. B. Malek, Z. Qian, Q. Zhu, M. Barth, and N. Abu-Ghazaleh. Application level attacks on connected vehicle protocols. In 22nd International Symposium on Research in Attacks, Intrusions and Defenses (RAID 2019), pages 459–471, 2019.
- [3] Z. Abdollahi Biron, S. Dey, and P. Pisu. Real-time detection and estimation of denial of service attack in connected vehicle systems. IEEE Trans. Intelligent Transportation Systems, 19(12):3983–3902, 2018.
- [4] F. Alotibi and M. Abdelhakim. Anomaly detection for cooperative adaptive cruise control in autonomous vehicles using statistical learning and kinematic model. IEEE Transactions on Intelligent Transportation Systems, pages 1–11, 2020.
- [5] M. Amoozadeh et al. Platoon management with cooperative adaptive cruise control enabled by vanet. Vehicular Communications, 2015.
- [6] J. J. Blum, A. Neiswender, and A. Eskandarian. Denial of service attacks on inter-vehicle communication networks. In 2008 11th International IEEE Conference on Intelligent Transportation Systems, pages 797–802. IEEE, 2008.
- [7] A. Buzachis, A. Celesti, A. Galletta, M. Fazio, and M. Villari. A secure and dependable multi-agent autonomous intersection management (ma-aim) system leveraging blockchain facilities. In 2018 IEEE/ACM International Conference on Utility and Cloud Computing Companion (UCC Companion), pages 226–231. IEEE, 2018.
- [8] Checkoway et al. Comprehensive experimental analyses of automotive attack surfaces. In USENIX, volume 4. San Francisco, 2011.
- [9] S. Dadras. Cybersecurity for Autonomous Vehicle Platooning. See URL: link.
- [10] R. G. Dutta, F. Yu, T. Zhang, Y. Hu, and Y. Jin. Security for safety: A path toward building trusted autonomous vehicles. In ICCAD, 2018.
- [11] R. Ferlis. The dream of the automated highway. Public Roads, 71(1):42–47, 2007.
- [12] M. Iorio, F. Risso, R. Sisto, A. Buttiglieri, and M. Reineri. Detecting injection attacks on cooperative adaptive cruise control. In 2019 IEEE Vehicular Networking Conference (VNC), pages 1–8, 2019.
- [13] M. Jagielski, N. Jones, C.-W. Lin, C. Nita-Rotaru, and S. Shiraishi. Threat detection for collaborative adaptive cruise control in connected cars. In Proceedings of the 11th ACM Conference on Security & Privacy in Wireless and Mobile Networks, pages 184–189. ACM, 2018.
- [14] Y. Kim, I. Kim, and C. Y. Shim. A taxonomy for dos attacks in vanet. In 2014 14th International Symposium on Communications and Information Technologies (ISCIT), pages 26–27. IEEE, 2014.
- [15] Koscher et al. Experimental security analysis of a modern automobile. In IEEE Symposium on Security and Privacy, 2010.
- [16] R. Krajewski, J. Bock, L. Kloeker, and L. Eckstein. The highd dataset: A drone dataset of naturalistic vehicle trajectories on german highways for validation of highly automated driving systems. In 2018 21st International Conference on Intelligent Transportation Systems (ITSC), pages 2118–2125, 2018.
- [17] M. Levi, Y. Allouche, and A. Kontorovich. Advanced analytics for connected cars cyber security. CoRR, abs/1711.01939, 2017.
- [18] J. Liu and J. Liu. Intelligent and connected vehicles: Current situation, future directions, and challenges. IEEE Communications Standards Magazine, 2(3):59–65, 2018.
- [19] C. Miller and C. Valasek. Remote exploitation of an unaltered passenger vehicle. Black Hat USA, 2015:91, 2015.
- [20] National Highway Traffic Safety Association. Road Accidents In USA. See URL: link.
- [21] S. Parkinson, P. Ward, K. Wilson, and J. Miller. Cyber threats facing autonomous and connected vehicles: Future challenges. IEEE Transactions on Intelligent Transportation Systems, 18(11):2898–2915, 2017.
- [22] J. Petit, B. Stottelaar, M. Feiri, and F. Kargl. Remote attacks on automated vehicles sensors: Experiments on camera and lidar. Black Hat Europe, 11:2015, 2015.
- [23] S. Ray, E. Peeters, M. Tehranipoor, and S. Bhunia. System-on-Chip Platform Security Assurance: Architecture and Validation. Proceedings of the IEEE, 106(1):21–37, 2018.
- [24] Realtime-Technologies. Physical Automotive Simulator. See URL: link.
- [25] A. Taylor, S. Leblanc, and N. Japkowicz. Anomaly detection in automobile control network data with long short-term memory networks. In IEEE DSAA, 2016.
- [26] Y. Tian, K. Pei, S. Jana, and B. Ray. Deeptest: Automated testing of deep-neural-network-driven autonomous cars. In Proceedings of the 40th International Conference on Software Engineering, ICSE ’18, pages 303–314, 2018.
- [27] A. Tiwari, B. Dutertre, D. Jovanović, T. de Candia, P. D. Lincoln, J. Rushby, D. Sadigh, and S. Seshia. Safety envelope for security. In Proceedings of the 3rd International Conference on High Confidence Networked Systems, HiCoNS ’14, pages 85–94, 2014.
- [28] M. Uricár, P. Krízek, D. Hurych, I. Sobh, S. Yogamani, and P. Denny. Yes, we GAN: applying adversarial techniques for autonomous driving. CoRR, abs/1902.03442, 2019.
- [29] R. W. van der Heijden et al. Enhanced position verification for vanets using subjective logic. In 2016 IEEE 84th Vehicular Technology Conference (VTC-Fall), Sep. 2016.
- [30] E. van Nunen et al. Robust model predictive cooperative adaptive cruise control subject to v2v impairments. In IEEE 20th International Conference on Intelligent Transportation Systems (ITSC), Oct 2017.
- [31] C. Wang et al. A distributed anomaly detection system for in-vehicle network using htm. IEEE Access, 6:9091–9098, 2018.