The Temporal Analysis of Light Pollution in Turkey using VIIRS data
Abstract
Artificial Light pollution (AL) in Turkey and in Turkish observatories between 2012–2020 have been studied using the archival data of Visible Infrared Imaging Radiometer Suite (VIIRS) instrument. The astroGIS database has been used in processing the data (astrogis.org) Aksaker et al. (2020a). The total energy released to space from Turkey increased by 80% in 2019 with respect to 2012. In the span of the dataset, a steady and continuous increase has been observed throughout all cities of the country. On the other hand, Dark Sky Park locations, East and Southeast Anatolian regions and mostly rural areas around the cities kept their AL level constant. Four demographic parameters have been studied and they were found to be correlated very well with AL: Population (); GDP (); Total Power Consumption () and Outdoor Lightening (). Contrary to countries acting to prevent AL increases, Turkey seems to be at the beginning of an era where AL will arithmetically increase throughout the country and enormous amount of energy will continuously escape to space and therefore will be wasted. Therefore, a preventive legislation, especially for invaluable astronomical site locations such as TURAG, TUG, DAG and ÇAAM where each is counted as a truly dark site due to their SQM values, has to be enacted in Turkey, in very near future.
published date
1 Introduction
Night sky is expected to be dark enough to conduct human based observations. However, there is an ongoing human activity throughout on all parts of the Earth surface which gradually prevents humanity experiencing the dark night sky. Thus, light pollution can simply be defined as artificial light contributing to the night sky (Cavazzani et al., 2020; Mendoza et al., 2020; Simons et al., 2020). The contribution is so large that one-third of the humanity cannot see and identify the Milky Way. The simplest reason is actually due to the world population being accumulated in or around the cities (Falchi et al., 2016). Light pollution in the night sky makes observations of astronomical objects very difficult when cumulative light above the large cities degrade the quality of observations especially for the observatories (Gronkowski et al., 2018). Light pollution is also an ecological problem besides its negative effect on astronomy (Navara & Nelson, 2007). Note also that, when the world-wide awareness considered, UNESCO has listed the night sky as a universal heritage111astronomicalheritage.net.
The most recent review on AL observed from space and it is interpretation for the human activity on the surface is given in Levin et al. (2020). Light pollution is monitored and studied using many different measurement techniques: Sky Quality Meter (SQM) photometers (Zamorano et al., 2016; Puschnig et al., 2019), Satellite base Defense Meteorological Satellite Program - Operational Line-Scan System (DMSP/OLS), International Space Station (ISS) nighttime light measurements (Kuffer et al., 2018) and Visible Infrared Imaging Radiometer Suite (VIIRS) (Levin et al., 2019).
Through the modern human history, populations are found to be not evenly distributed over the surface area of Earth. However, population always increases arithmetically and population density can be shown to correlate with other demographic parameters, especially human activities affecting the environment (Elvidge et al., 1999; Hara et al., 2004; Shi et al., 2014), specific to this work “the night sky” (Falchi et al., 2016). Thus, it could easily be summarized that human activity is correlated with consumed and/or with wasted energy, therefore this energy, when it is observed from the space, can also be correlated with “negative effect of human activity”.
The first studies on AL pollution in Turkey222isikkirliligi.org began under the leadership of TUBITAK National Observatory (TUG)333tug.tubitak.gov.tr which was initiated by Zeki Aslan, earlier director of TUG. They have been using a simple photodiode based instrument, namely “Sky Quality Meter - SQM”, to collect AL pollution values in the Zenith direction which can be carried out either personally or within a campaign to increase the awareness of dark skies. Since then, they have also been working on the legislation part of the awareness. In 2005, they documented the results of both engineering and legislative studies on AL which led the group to apply for a change in the law (see details in isikkirliligi.org).
Improper use of outdoor lighting has a negative impact on astronomical observatories in Turkey. An earlier study by Aslan (2001) noted that the background brightness level has increased by 23, from 1986 to 1999 due to increase in investments in tourism on the Mediterranean coast and use of outdoor lighting for decorative purposes. AL pollution has also been understood as an important issue in observatory site selection studies. In their site selection studies Aksaker et al. (2015) were made used DMSP/OLS (Defense Meteorological Satellite Program’s Operational Linescan System) data (years 2012–2015) for AL pollution in Turkey. Another national study is carried out by Koc-San et al. (2013) and they noted AL pollution analysis for 2010 using the same satellite data but for the city Antalya only. In Ege University Observatory, Devlen (2018) reported that the sky brightness measurements in 2017 was shortened by 1.5 hours compared to 2010. Impact of AL pollution is continued to be an important issue for observatories.
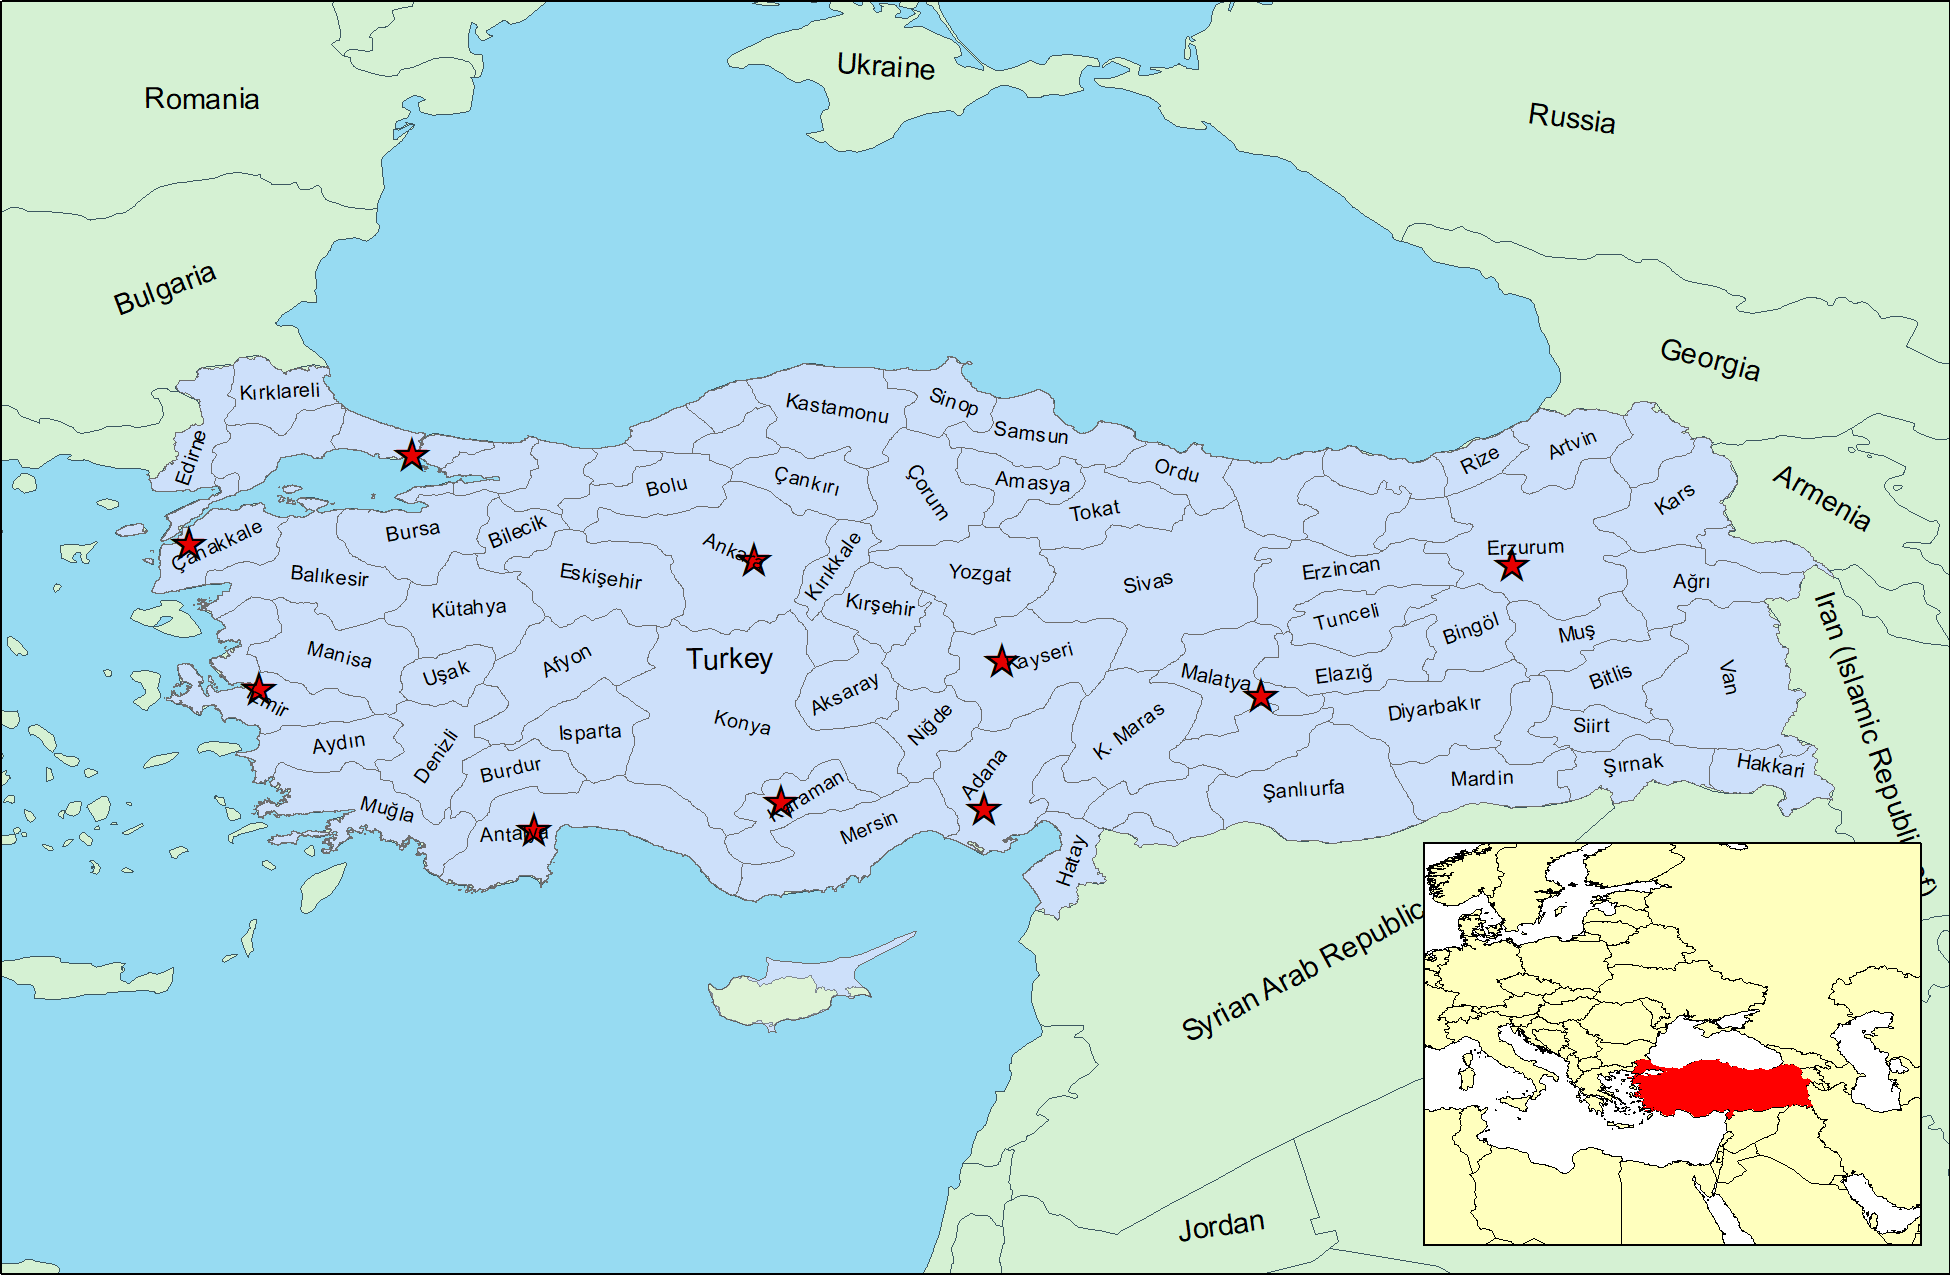
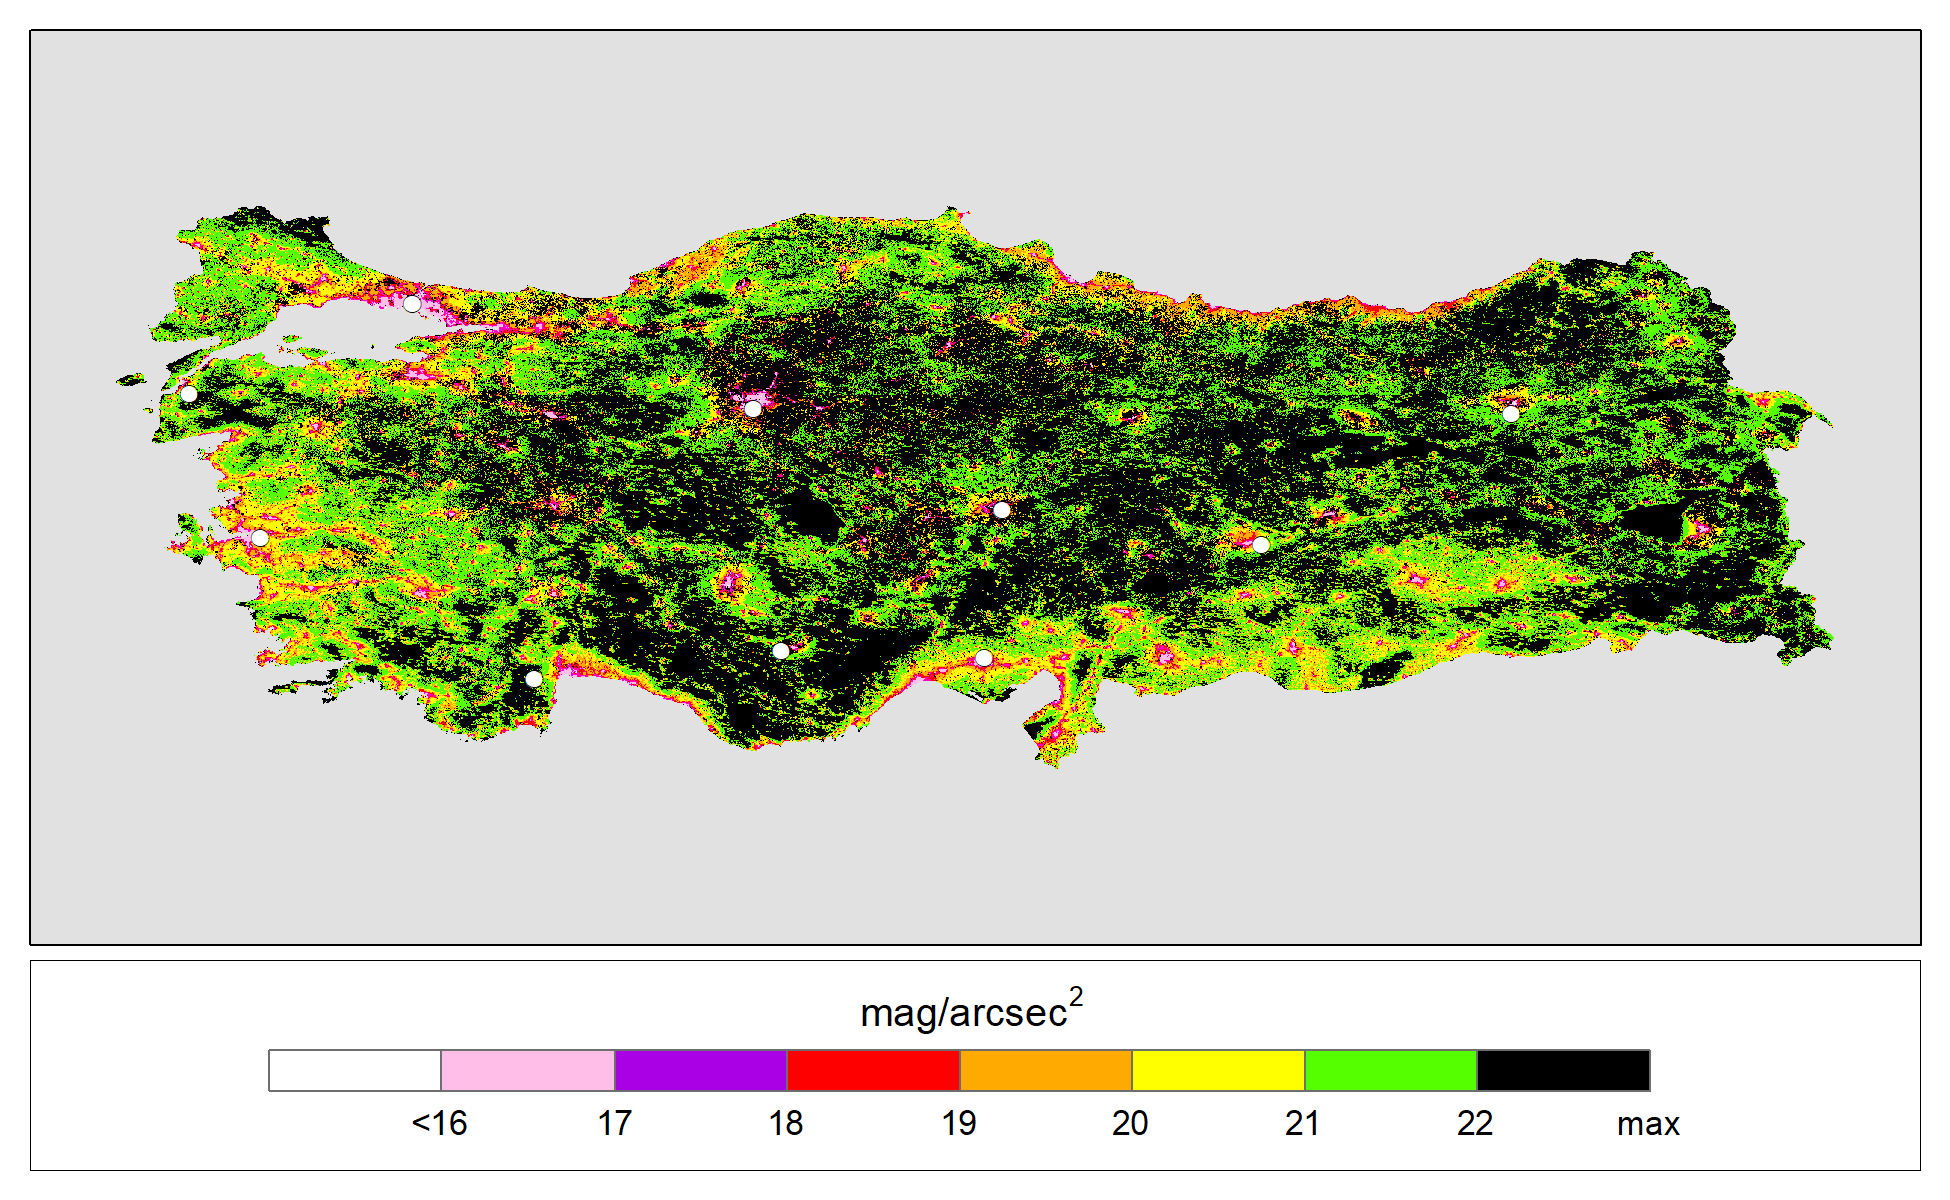
In this study, we aim to find Turkey’s position in terms of energy released into the space. For this purpose, the database introduced in Aksaker et al. (2020a) has been adapted for Turkey. The layering details of Artificial Light (AL) are published online in the astroGIS database 444astrogis.org. A subset of the dataset has been adapted from the database and is given in Fig. 1.
2 GIS and Nighttime Dataset
Geographic Information Systems (GIS) and Remote Sensing, and their capability to capture, store, manipulate and display data, have found robust, easy to use and, time and cost efficient utility in the analyses of any spatial phenomena anywhere on/above/below the earth surface (Chang, 2009). Advantages of GIS tools for spatial analysis along with progressively high precision and free-cost satellite-based remote-sensing datasets, become a key technology for environmental monitoring including human–environment interactions such as the economic, environmental, and social factors that influence settlement systems.
In this work, astroGIS database has been used (Aksaker et al., 2020a). In addition to GIS dataset, the demographic data for 2018 have been retrieved from the archival database of Turkish Statistical Institute555tuik.gov.tr. Since there is no legislation enacted in the country, we aimed to find more correlations in the demographic dataset with the AL pollution. Therefore, measured national power consumption parameters reported by the Turkish government in February 2020 has been retrieved and adopted to all cities are given in Table 1 (EPDK, 2020).
In constructing demographic dataset of Turkey the following information have been collected: 1) the country has 81 cities; 2) the city boundaries and total surface area were digitized from GADM dataset (see Table 1). It can be viewed in Fig. 1 (upper panel).
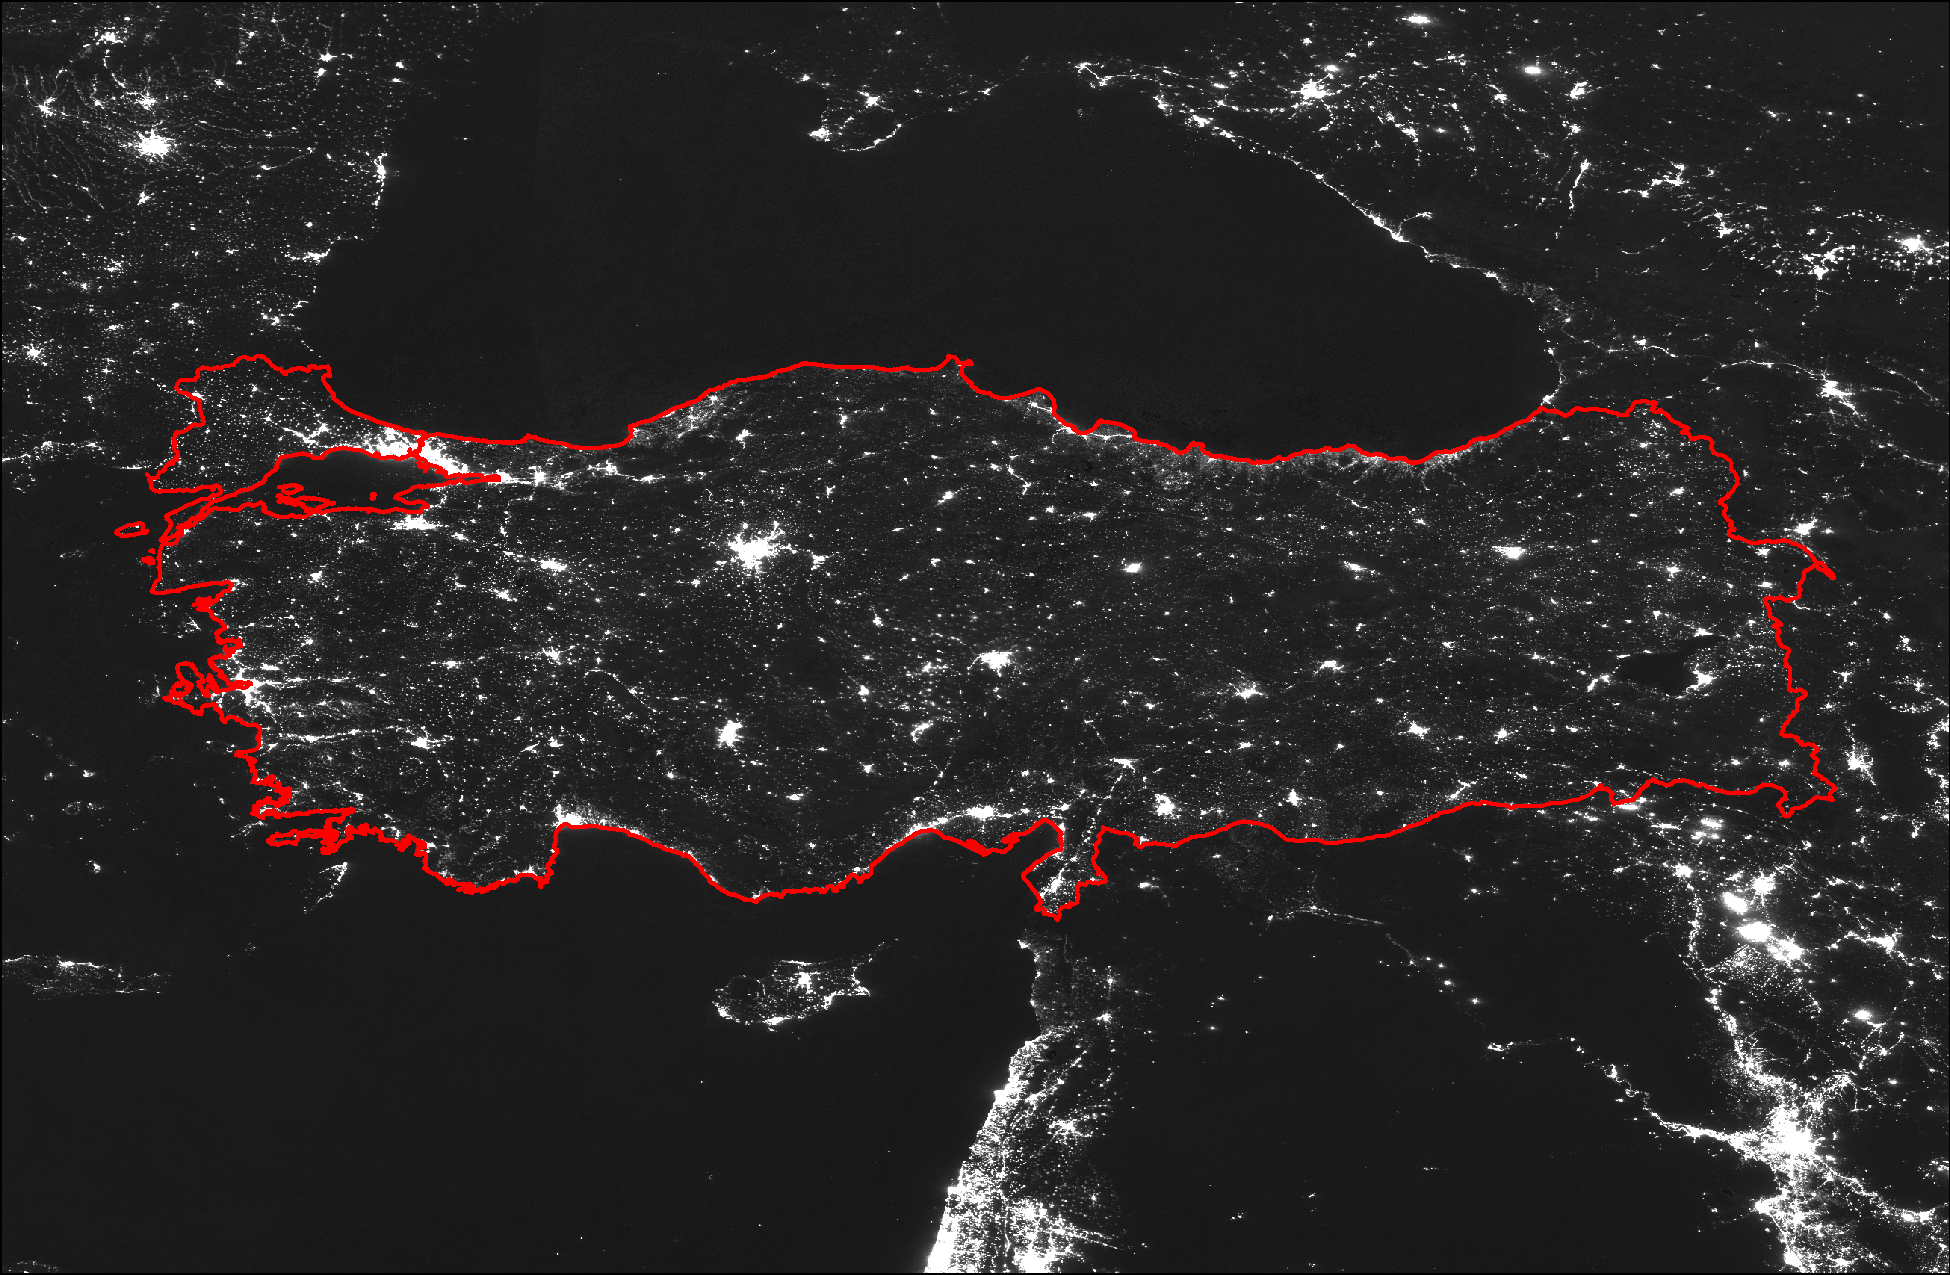
The Visible Infrared Imaging Radiometer Suite (VIIRS) instrument on board SUOMI-NPP satellite in the Day Night Band (DNB) is used to acquire the nighttime data and they correspond to visible part of the spectrum. Similar data analysis methods and techniques which were applied for France (Aksaker et al., 2020b), have been adapted in this work. Overall view of the nighttime data for December 2019 is given as an example in the lower panel of Fig. 1. The resultant spatial resolution of GEOTIFF images were 463 m per pixel.
3 Analysis of the data
Using astroGIS database, a monthly averaged nighttime dataset has been produced. This dataset contains 93 images. Their dates range from April 2012 to December 2019. Digitized GADM boundaries have been used, first to extract the surface area of Turkey. Afterwards, each city has been extracted from the same dataset. With respect to average light pollution value over the whole time span, above values were excluded for each pixel using a pre-filtering algorithm written in house Python code. In calculating pixel averages within each city boundary a model in Zonal Statistics tool of ArcGIS Desktop 10.4.1 has to be created to process 81 cities in total. A city-based light pollution dataset is produced using monthly nighttime data for each city. Earth Observation Group (EOG) updated VIIRS sensor calibration for Airglow (Uprety et al., 2019). Coesfeld et al. (2020) produced and published (Uprety et al., 2019) a mask for this new calibration. This airglow correction has been applied to our dataset and used through out in all stages of data manipulation.
VIIRS launched in 2012, therefore, it spans a eight-years of AL data. In this work, we aim to find AL variation over the full span of the satellite limiting to Turkey’s surface area.
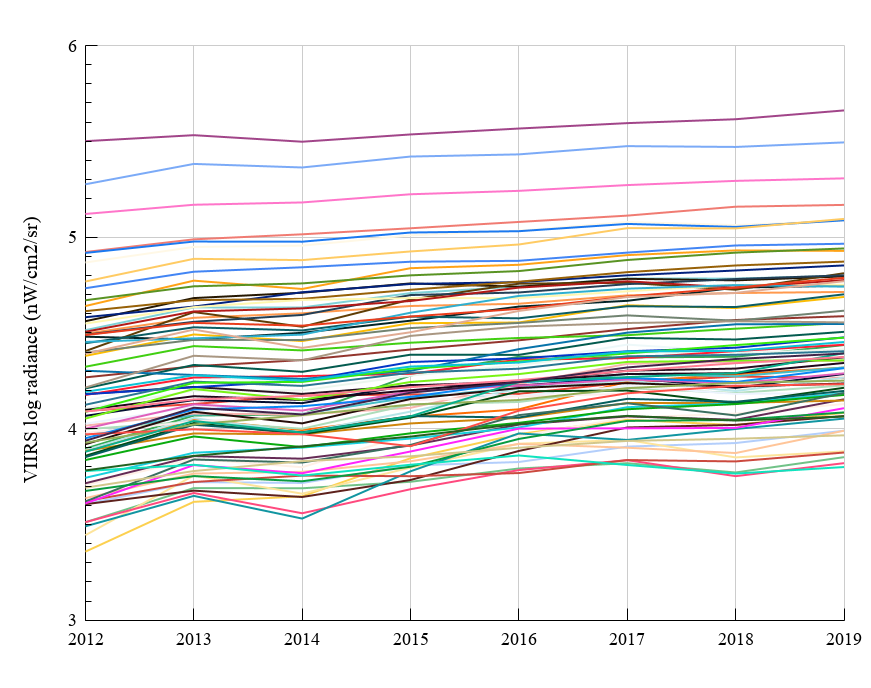
Accumulating this dataset for twelve month, yearly averaged data has been calculated and tabulated in Table 2. A linear regression fit applied to yearly averages (column ‘L.R.’) and it is given in the table along with goodness of fits (R2). Thus, possible variation in annual AL values could then be calculated (column ). Note that one of the main criteria in AL data is to locate and measure main AL contributing surface area or geographic locations throughout the country. Therefore, luminous flux values of cities are given in Fig. 2.
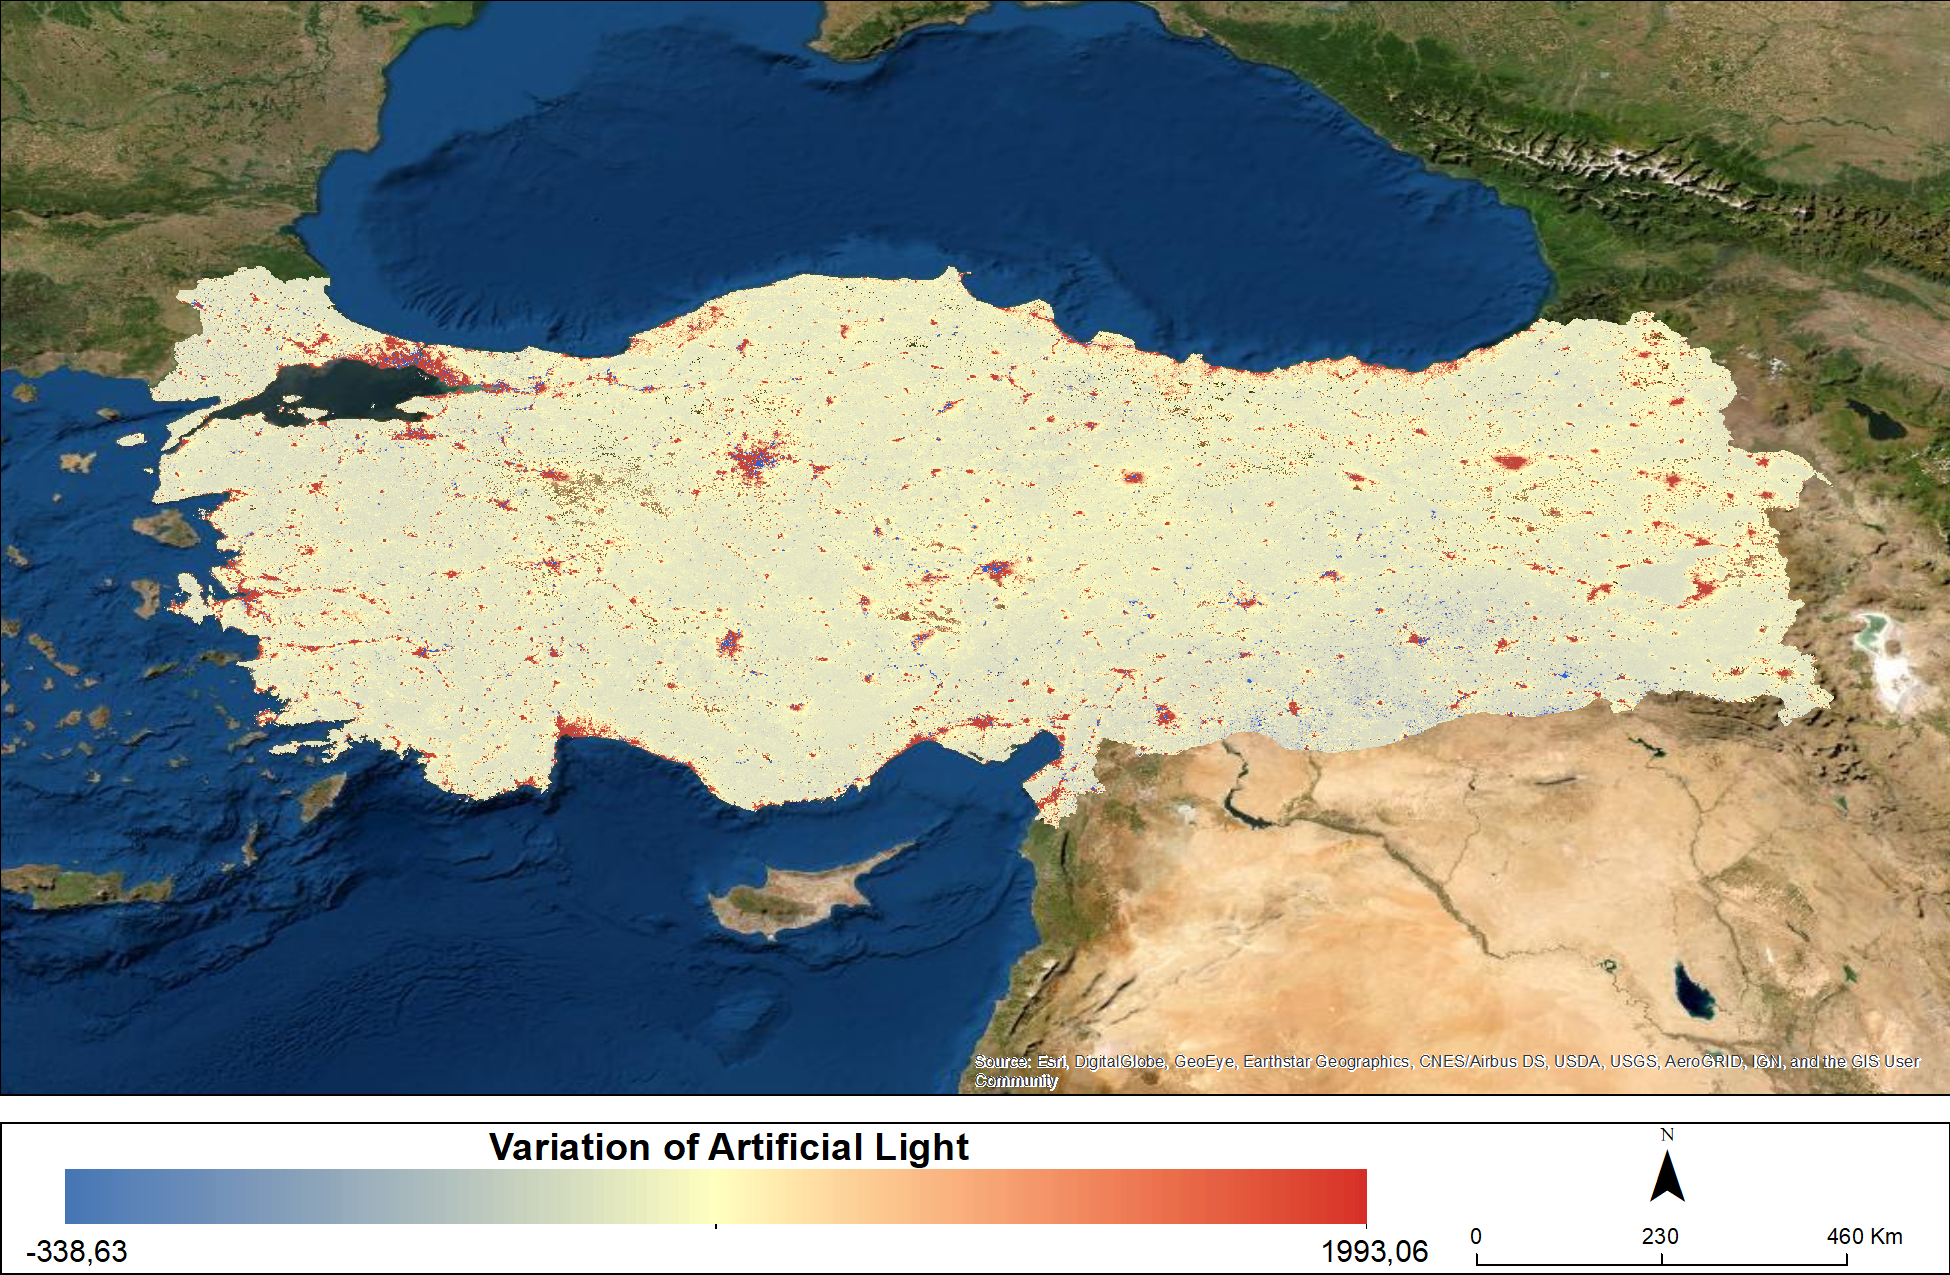
Overall view of variations were needed to visualize the effect of AL pollution through-out the country for the time span of the dataset emphasizing regional changes. This is given Fig. 3.
The Turkish observatory locations are given in Table 3. AL measurements were also carried for these locations (Table 4). They represent a single VIIRS pixel value which corresponds to 463463m and, therefore if it can be effected from nearby luminous pixels. SQM values (in units of mag/arcsec2 - mpsas) were calculated for each observatory location to have a good sense of site’s astronomical quality. Our AL dataset for each observatory is converted to SQM values using the following equation (Sanchez de Miguel et al., 2020):
| (1) |
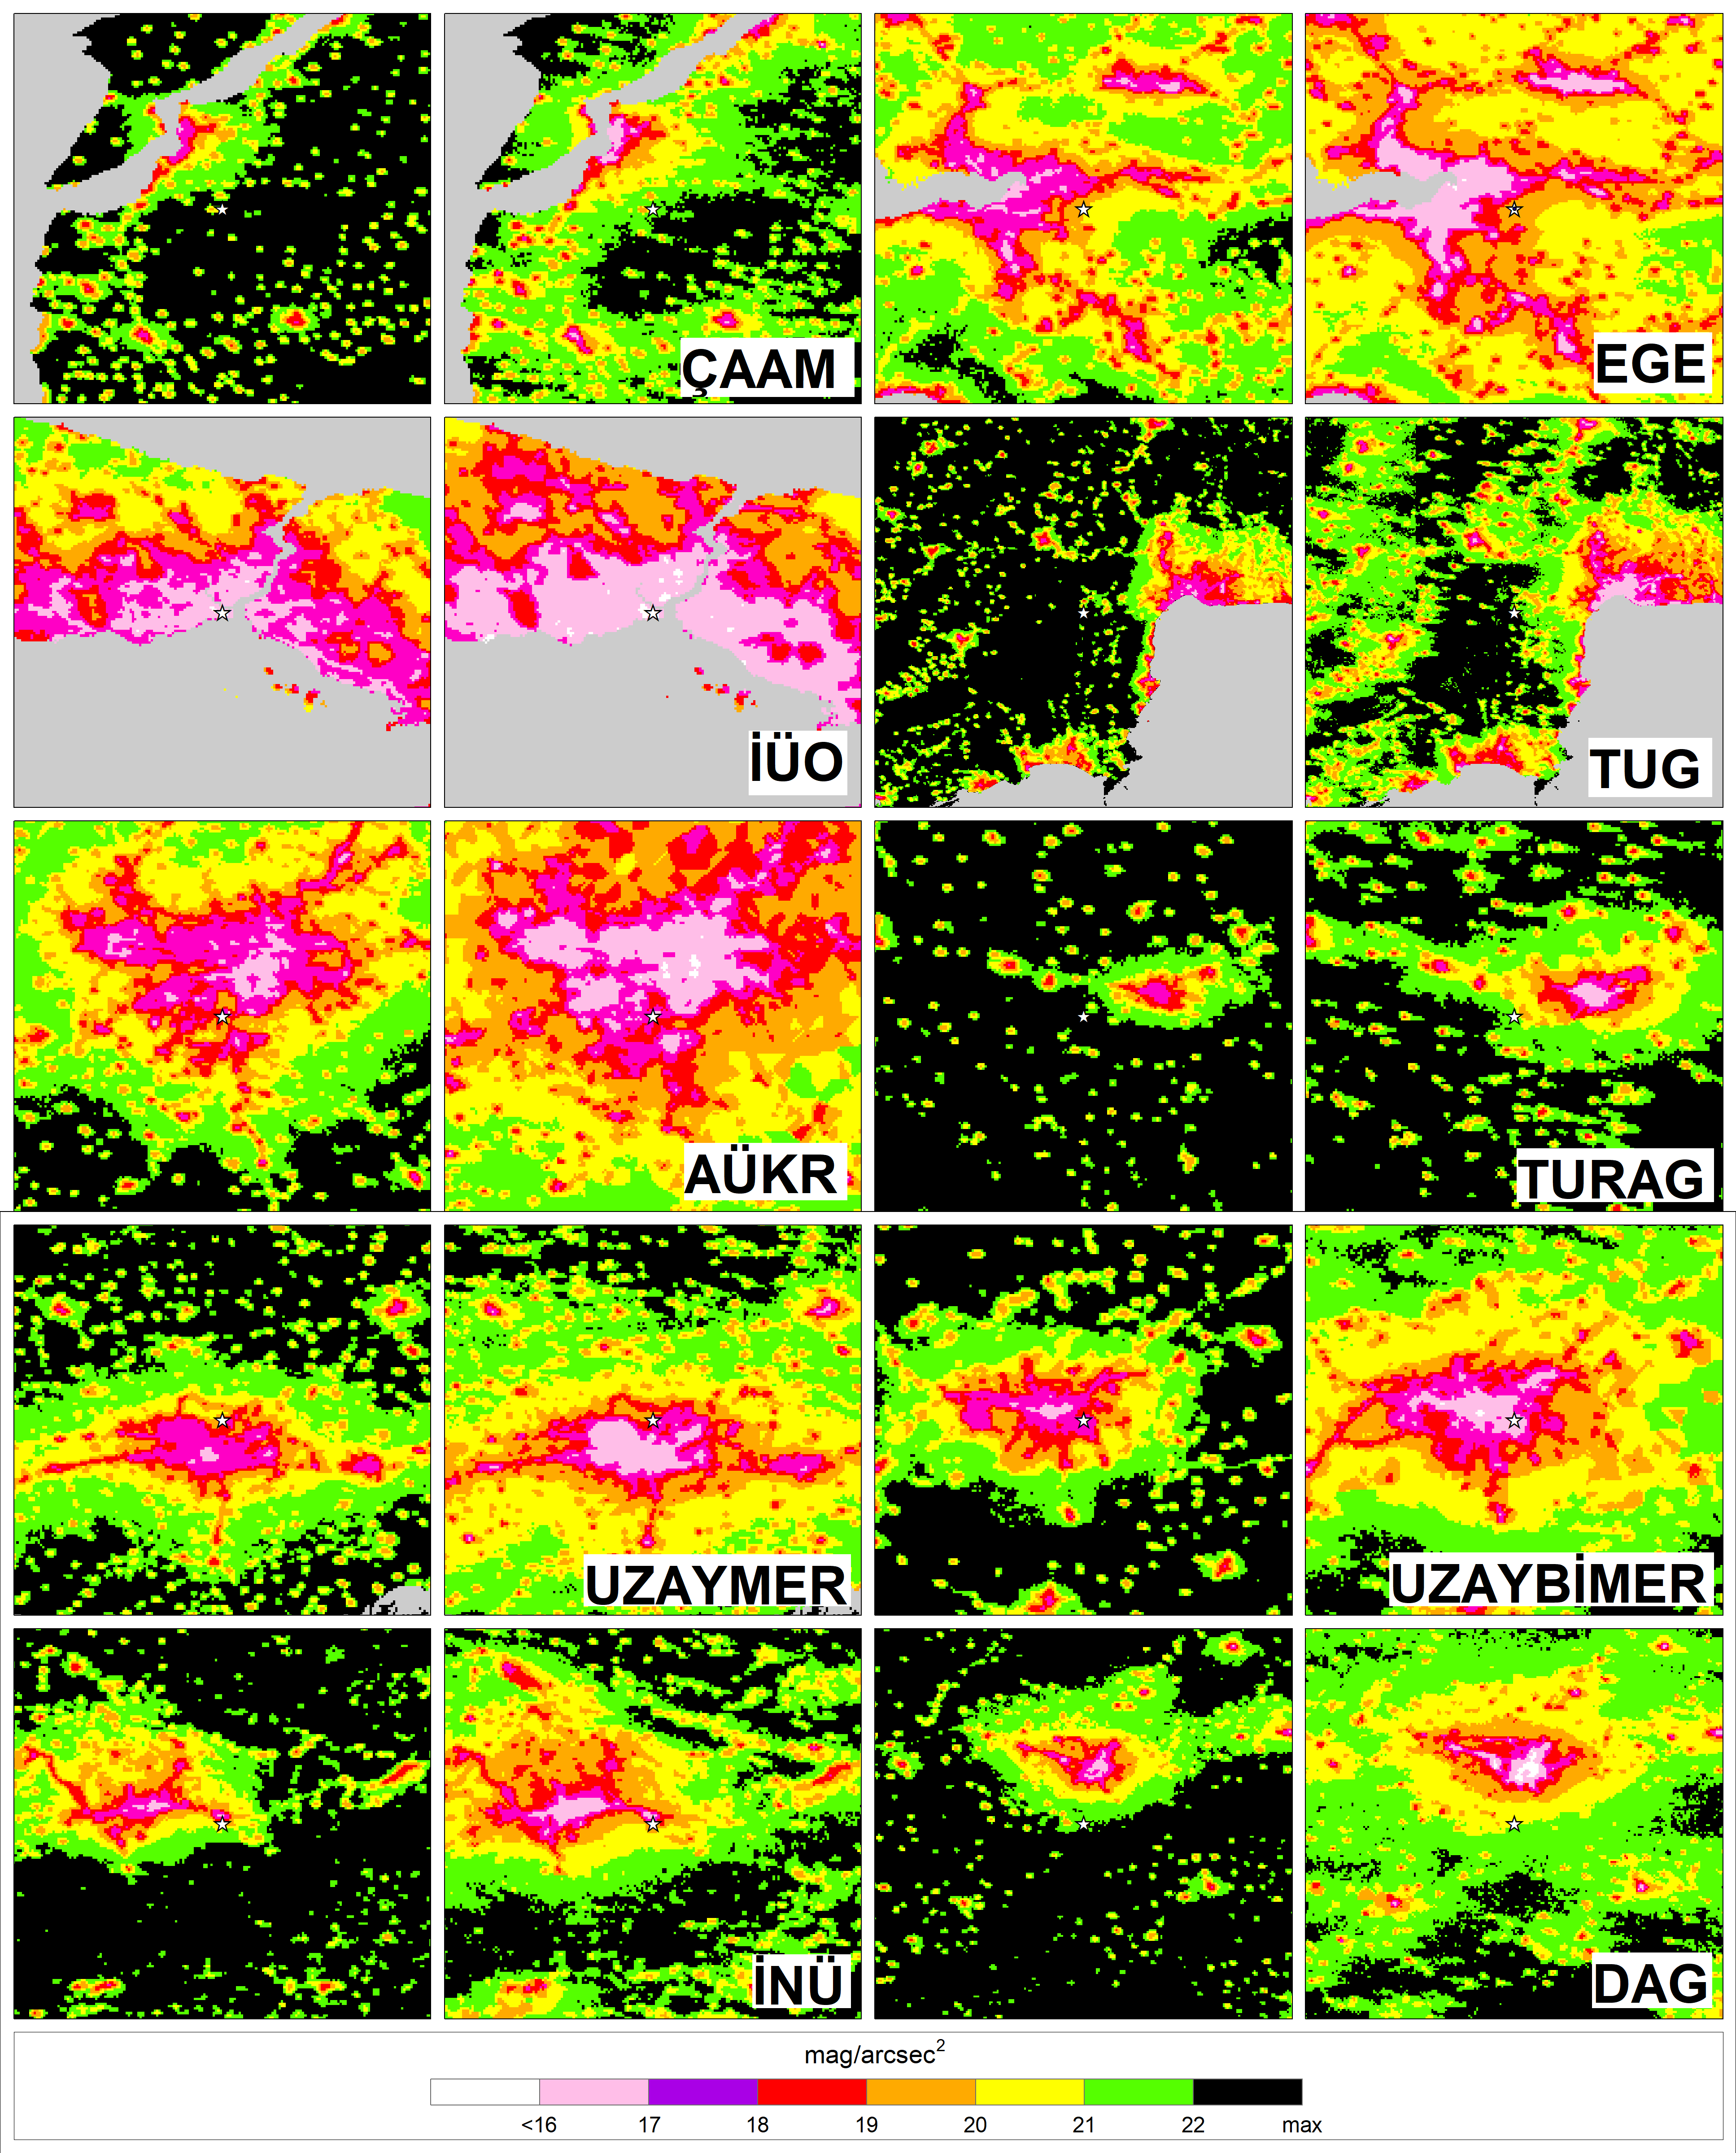
where AL is the VIIRS DNB value in nW cm-2 sr-1 units. The contour map of SQM for the whole county (Fig. 4), and for all observatories (Fig. 5) have also been produced to understand the effect of AL. The SQM values of the observatories are given in Table 4.
4 Results and Discussions
We investigated the light pollution dataset for Turkey. The data runs from January 2012 to December 2019. The whole dataset is created from our earlier astroGIS database (Aksaker et al., 2020a). The following outcomes have been noted after the analysis of the dataset:
-
•
The total energy released to space from Turkey increased by 80% in 2019 compared to 2012. Energy release of Turkey during 2019 is 20% higher than France Aksaker et al. (2020b).
-
•
İstanbul, as being the most populated city, produced 12% of the total AL of the country during 2019.
-
•
Even though there were disordered annual decreases in AL (Figure 2), trend of AL for all the cities is positive and steady.
Note that AL variation (Fig. 3) over the whole country might give the impression of ‘no improvement’. In the reality of data, accumulation of light pollution over the large cities (an increase – red colored pixels) might hide the improvements (a decrease – blue colored pixels).
-
•
During the time span of the dataset, all cities show a steady and positive increase in AL (Table 2). The maximum and minimum AL increase were observed in İstanbul and Tunceli, respectively. R2 of the variation during 2012–2019 stays above 0.90 for 51 cities which proves that the country’s AL continuously increases.
-
•
The following geographical “points”, where they correspond to pixels in our dataset, Yusufeli/Artvin and Çorlu/Tekirdağ have the minimum (0.00) and maximum (883.6) values in VIIRS’s luminous flux units, respectively. Note that these minimum and maximum values are for 2019 when the light pollution distribution over the country was considered.
-
•
Turkish observatory locations have also been studied for AL and the following statistical outcomes have been observed: The brightest and the darkest observatory in 2019 are found to be İÖÜ (138.03) and TUG & TURAG (0.10), respectively. The largest increase and decrease in AL, between 2012–2019, are found to be in UZAYBİMER and UZAYMER, respectively. Note that, AL for İÜO shows a decreasing trend which can be easily marked as an outlier since the observatory is within the most luminous city, İstanbul, showing a saturated trend in AL.
We present AL contour maps in Fig. 5 covering 100 km surface area centered on all observatory locations. The AL values for observatories show the same trend as the country. We would like to emphasis the importance of reducing AL especially for Turkey’s most important observatories, specifically for TUG (AL increase: 56%) and DAG (AL increase: 40%). It is not uncommon to predict the future with these outcomes that without having any controlling measures wealth of society will eventually degrade and destroy the astronomical night sky especially for these invaluable scientific investments on these observatories. Note also that, as it is given in Table 4, for TURAG, TUG, DAG and ÇAAM, SQM values prove that these observatories are counted as truly dark sites.
-
•
Aksaker et al. (2015) found two main groups of astronomical observatory sites (17 in total). Group A includes the most suitable sites where all located in Southeast Anatolia Region. Even though their dataset for AL was 2012, changes observed throughout 2012–2019 (Figure 3) show less light pollution (note dominated shades of blue) implying that the group A remained to be the most suitable site locations since all are in remote rural locations which are not effected very much from the human activities.
-
•
Excluding two of most important astronomical parameters (elevation and cloud coverage), AL can also be used as a criteria to select specific locations, for example Dark Sky Parks. Turkey has dozens of such potential locations (see Fig. 4). The darkest cities among these locations are Kilis, Tunceli, Gümüşhane and Bayburt, once again confirming the main outcome: rural locations away from the human activity stayed as they are throughout 2012–2019. Note that the work with the full parameter set has been carried out and all suitable astronomical locations have been found in Aksaker et al. (2020a).
-
•
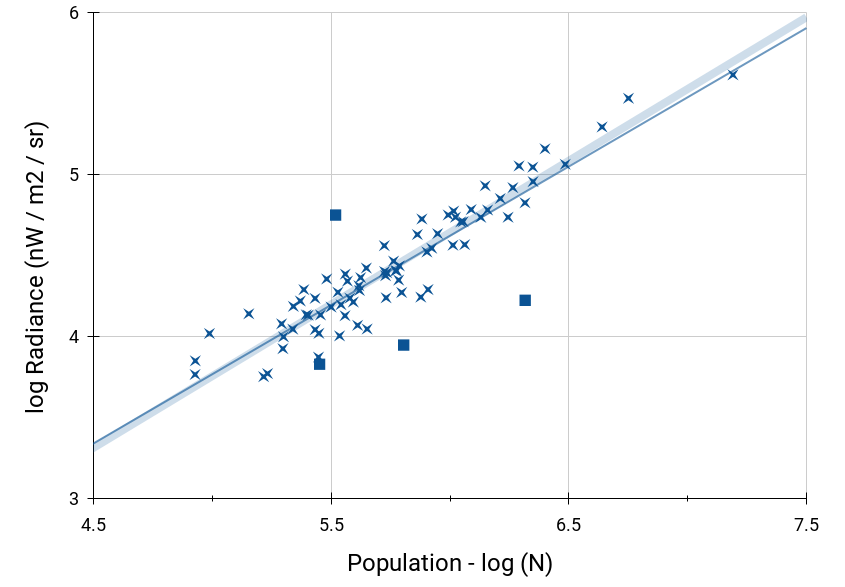
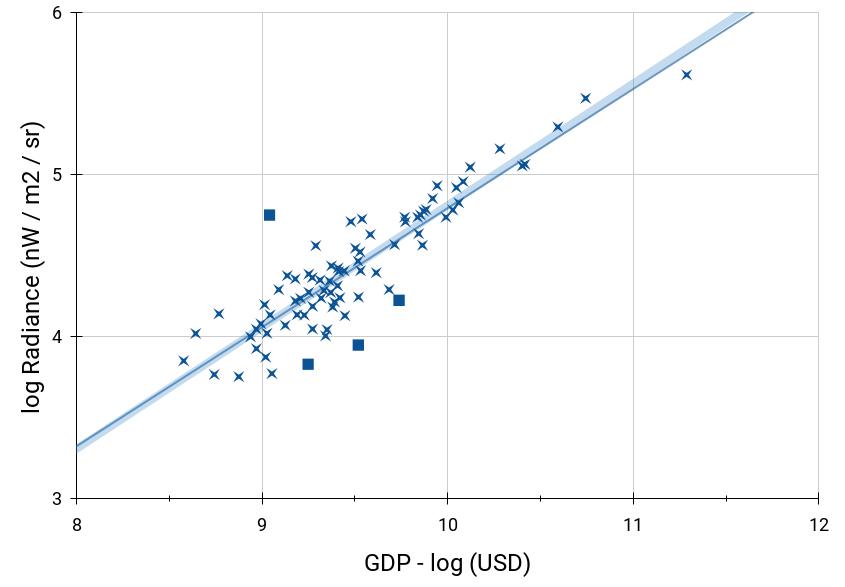
Examples given in Elvidge et al. (1999); Hara et al. (2004); Shi et al. (2014); Lin & Shi (2020) correlates human activity, say electric consumption, to the energy escaped to the space. Following this example as a base, our AL pollution dataset shows a strong correlation with both population (with 0.90 confidence) and GDP (with 0.87) (see Table 1 and Fig. 6).
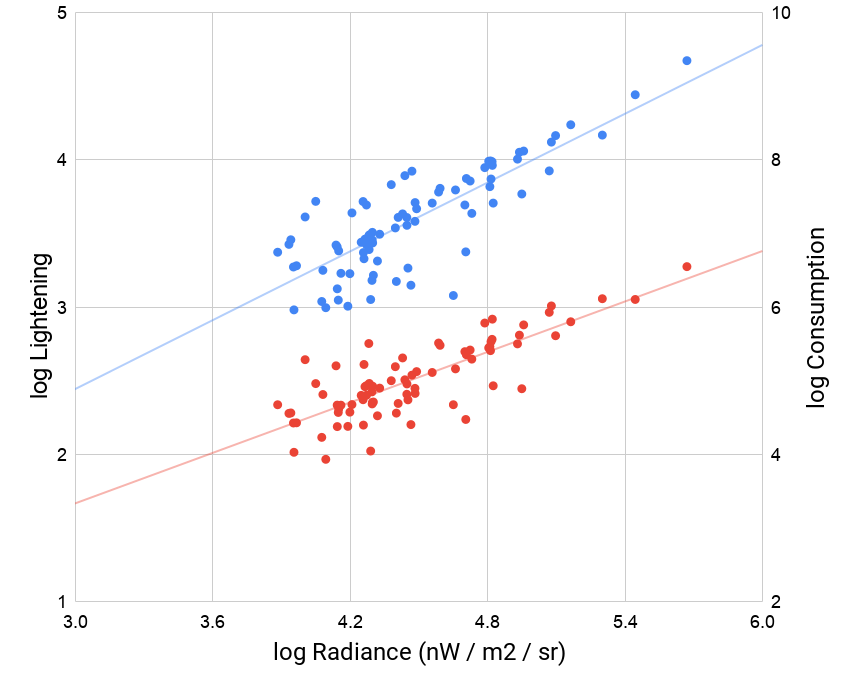
Even though there is a strong and obvious correlation between power consumption and AL observed in space, as it is noted in (Sánchez de Miguel et al., 2014) before coming to an immediate conclusion, the observed flux has to be assessed locally (e.g. city by city) and corrected accordingly. The aim of this work, however, was focused on whether there exists a trend of AL or not; we confirm the trend in Fig. 2. Due to free access to demographic values in Turkey, we have extended the impact of AL pollution by introducing two more consumption values (Elvidge et al., 1999; Lin & Shi, 2020). Observed good correlations (i.e. confidence level) for “Total Power Consumption” and “Outdoor Lightening” are 0.66 and 0.67, respectively (see Fig. 7).
-
•
Contrary to countries acting to prevent AL increases, Turkey, with the values presented in this work, seems to be at the beginning of an era where AL will arithmetically increase throughout the country and enormous amount of energy will continuously escape to space and therefore will be wasted. Therefore, to overcome expected worst scenario where other countries have been faced with in past decades (such as France, see Aksaker et al., 2020b) a preventive legislation has to be enacted in Turkey, in the very near future.
Acknowledgements
This research was supported by the Scientific and Technological Research Council of Turkey (TÜBİTAK) through project number 117F309. This research was also supported by the Çukurova University Research Fund through project number FYL-2019-11770.
Compliance with ethical standards
The authors declare that they have no potential conflict and will abide by the ethical standards of this journal.
References
- Aksaker et al. (2020a) Aksaker, N., Yerli, S. K., Erdoǧan, M. A., et al. 2020a, MNRAS, 493, 1204, doi: 10.1093/mnras/staa201
- Aksaker et al. (2020b) Aksaker, N., Yerli, S. K., Kurt, Z., et al. 2020b, arXiv e-prints, arXiv:2006.04440. https://arxiv.org/abs/2006.04440
- Aksaker et al. (2015) Aksaker, N., Yerli, S. K., Erdoğan, M. A., et al. 2015, Exp. Astron., 39, 547, doi: 10.1007/s10686-015-9458-x
- Aslan (2001) Aslan, Z. 2001, Symposium - International Astronomical Union, 196, 151–152, doi: 10.1017/S0074180900164009
- Cavazzani et al. (2020) Cavazzani, S., Ortolani, S., Bertolo, A., et al. 2020, MNRAS, 493, 2463, doi: 10.1093/mnras/staa416
- Chang (2009) Chang, K. 2009, Introduction to Geographic Information Systems with Data Files CD-ROM (McGraw-Hill Companies,Incorporated). https://books.google.com.tr/books?id=vnPYoAEACAAJ
- Coesfeld et al. (2020) Coesfeld, J., Kuester, T., Kuechly, H. U., & Kyba, C. 2020, Sensors, doi: 10.5880/GFZ.1.4.2020.003
- Devlen (2018) Devlen, A. 2018, in Ege Üniversitesi Gözlemevi’nin Gökyüzü Parlaklık Ölçümleri
- Elvidge et al. (1999) Elvidge, C. D., Baugh, K. E., Dietz, J. B., et al. 1999, Remote Sensing of Environment, 68, 77, doi: 10.1016/S0034-4257(98)00098-4
- EPDK (2020) EPDK. 2020, Electricity Monthly Sector Reports. https://www.epdk.org.tr/Detay/Icerik/3-0-23-3/elektrikaylik-sektor-raporlar
- Falchi et al. (2016) Falchi, F., Cinzano, P., Duriscoe, D., et al. 2016, Sci. Adv., 2, e1600377, doi: 10.1126/sciadv.1600377
- Gronkowski et al. (2018) Gronkowski, P., Tralle, I., & Wesołowski, M. 2018, Astronomische Nachrichten, 339, 37, doi: 10.1002/asna.201713387
- Hara et al. (2004) Hara, M., Okada, S., Hirosi, Y., et al. 2004, /IJReSES, 1, 31, doi: http://dx.doi.org/10.30536/j.ijreses.2004.v1.a1326
- Koc-San et al. (2013) Koc-San, D., San, B., Bakis, V., Helvaci, M., & Eker, Z. 2013, Advances in Space Research, 52, 39 , doi: https://doi.org/10.1016/j.asr.2013.03.001
- Kuffer et al. (2018) Kuffer, M., Pfeffer, K., Sliuzas, R., et al. 2018, IEEE Journal of Selected Topics in Applied Earth Observations and Remote Sensing, 11, 2578, doi: 10.1109/JSTARS.2018.2828340
- Levin et al. (2019) Levin, N., Kyba, C. C. M., & Zhang, Q. 2019, Remote Sensing, 11, 1472, doi: 10.3390/rs11121472
- Levin et al. (2020) Levin, N., Kyba, C. C. M., Zhang, Q., et al. 2020, Remote Sensing of Environment, 237, 111443, doi: 10.1016/j.rse.2019.111443
- Lin & Shi (2020) Lin, & Shi. 2020, ISPRS International Journal of Geo-Information, 9, 32, doi: 10.3390/ijgi9010032
- Mendoza et al. (2020) Mendoza, D., Kieda, D., & Seth, A. 2020, in American Astronomical Society Meeting Abstracts, American Astronomical Society Meeting Abstracts, 401.03
- Navara & Nelson (2007) Navara, K. J., & Nelson, R. J. 2007, Journal of Pineal Research, 43, 215, doi: 10.1111/j.1600-079X.2007.00473.x
- Puschnig et al. (2019) Puschnig, J., Wallner, S., Posch, T., & Binder, F. 2019, in Light Pollution: Theory, 1, doi: 10.5281/zenodo.3654028
- Sanchez de Miguel et al. (2020) Sanchez de Miguel, A., Kyba, C. C. M., Zamorano, J., Gallego, J., & Gaston, K. J. 2020, Scientific Reports, 10, 7829, doi: 10.1038/s41598-020-64673-2
- Sánchez de Miguel et al. (2014) Sánchez de Miguel, A., Zamorano, J., Gómez Castaño, J., & Pascual, S. 2014, J. Quant. Spec. Radiat. Transf., 139, 109, doi: 10.1016/j.jqsrt.2013.11.017
- Shi et al. (2014) Shi, K., Yu, B., Huang, Y., et al. 2014, Remote Sensing, 6, 1705, doi: 10.3390/rs6021705
- Simons et al. (2020) Simons, A. L., Yin, X., & Longcore, T. 2020, Environmental Research Communications, 2, 2, doi: 10.1088/2515-7620/ab7501
- Uprety et al. (2019) Uprety, S., Cao, C., Gu, Y., et al. 2019, IEEE Transactions on Geoscience and Remote Sensing, 57, 9602, doi: 10.1109/TGRS.2019.2927942
- Zamorano et al. (2016) Zamorano, J., Sánchez de Miguel, A., Ocaña, F., et al. 2016, J. Quant. Spec. Radiat. Transf., 181, 52, doi: 10.1016/j.jqsrt.2016.02.029
| City | Area | Pop. | GDP | Lout | City | Area | Pop. | GDP | Lout | ||
|---|---|---|---|---|---|---|---|---|---|---|---|
| Adana | 15843 | 2237940 | 12.1 | 11469 | 572566 | K.Maraş | 14586 | 2232374 | 5.2 | 6401 | 302219 |
| Adıyaman | 7455 | 626465 | 2.3 | 3088 | 91657 | Karabük | 3314 | 579257 | 1.5 | 2560 | 46580 |
| Afyon | 14752 | 729483 | 3.8 | 6241 | 144753 | Karaman | 8334 | 800165 | 1.7 | 1695 | 46483 |
| Ağrı | 10491 | 536199 | 1.4 | 1492 | 36262 | Kars | 10529 | 1440611 | 1.1 | 1407 | 25332 |
| Aksaray | 7626 | 337800 | 2.2 | 2755 | 63123 | Kastamonu | 13459 | 1154102 | 2.1 | 4931 | 85427 |
| Amasya | 6216 | 5639076 | 1.8 | 2858 | 48362 | Kayseri | 15953 | 838778 | 8.8 | 10106 | 316369 |
| Ankara | 25731 | 2511700 | 55.4 | 27665 | 1268170 | Kilis | 1428 | 983142 | 1.8 | 2357 | 47128 |
| Antalya | 21184 | 170875 | 19.1 | 17297 | 631273 | Kırıkkale | 4671 | 408809 | 2.8 | 2636 | 159177 |
| Ardahan | 4863 | 1110972 | 0.4 | 1125 | 11078 | Kırklareli | 6387 | 303010 | 1.2 | 2054 | 33347 |
| Artvin | 7868 | 1228620 | 1.1 | 2864 | 36451 | Kırşehir | 6780 | 362861 | 0.6 | 1115 | 37032 |
| Aydın | 8038 | 219427 | 5.9 | 7465 | 225340 | Kocaeli | 4044 | 754198 | 25.2 | 8410 | 848109 |
| Balıkesir | 14773 | 279812 | 7.7 | 9778 | 278824 | Konya | 40893 | 343212 | 13.2 | 14608 | 407950 |
| Bartın | 2583 | 348115 | 0.9 | 2665 | 35955 | Kütahya | 12217 | 1029650 | 3.3 | 4651 | 132832 |
| Batman | 4401 | 316126 | 2.1 | 1517 | 70481 | Malatya | 11544 | 1348542 | 3.4 | 5082 | 129279 |
| Bayburt | 3421 | 270796 | 0.4 | 990 | 8551 | Manisa | 13267 | 330280 | 10.7 | 7407 | 339163 |
| Bilecik | 4649 | 3056120 | 1.9 | 2129 | 166094 | Mardin | 10659 | 218243 | 3.2 | 1839 | 54939 |
| Bingöl | 8217 | 542157 | 1.0 | 1330 | 23799 | Mersin | 15213 | 638956 | 11.2 | 11253 | 415279 |
| Bitlis | 8805 | 195789 | 1.0 | 2346 | 24932 | Muğla | 12875 | 1055412 | 7.2 | 7177 | 260722 |
| Bolu | 8266 | 530864 | 2.4 | 2458 | 89022 | Muş | 8243 | 612747 | 1.3 | 1907 | 26778 |
| Burdur | 7261 | 1037208 | 1.6 | 2648 | 63407 | Nevşehir | 5137 | 808974 | 1.5 | 3216 | 50482 |
| Bursa | 10886 | 1756353 | 26.1 | 13188 | 1036221 | Niğde | 7187 | 84660 | 1.8 | 3124 | 79238 |
| Çanakkale | 9838 | 413903 | 4.1 | 4293 | 203743 | Ordu | 5929 | 2073614 | 3.3 | 6782 | 99933 |
| Çankırı | 7915 | 591098 | 1.0 | 2407 | 41435 | Osmaniye | 3077 | 370509 | 2.6 | 3037 | 319829 |
| Çorum | 12309 | 234747 | 2.6 | 4057 | 65379 | Rize | 3678 | 1136757 | 2.2 | 4359 | 47403 |
| Denizli | 10915 | 762062 | 7.4 | 6572 | 290005 | Sakarya | 4701 | 421200 | 7.3 | 6038 | 324691 |
| Diyarbakır | 14952 | 887475 | 5.9 | 4327 | 196251 | Samsun | 9529 | 596053 | 6.9 | 9821 | 255865 |
| Düzce | 2388 | 2069364 | 2.5 | 2891 | 82948 | Şanlıurfa | 19750 | 283017 | 5.4 | 1686 | 37383 |
| Edirne | 6166 | 448400 | 2.5 | 2725 | 84080 | Siirt | 5059 | 416367 | 1.1 | 2370 | 29735 |
| Elazığ | 9350 | 164521 | 2.8 | 3590 | 90339 | Sinop | 6010 | 84843 | 0.9 | 5221 | 91340 |
| Erzincan | 11616 | 280991 | 1.5 | 1643 | 51315 | Sivas | 28427 | 253279 | 3.3 | 4091 | 192925 |
| Erzurum | 24656 | 1628894 | 3.5 | 5859 | 77754 | Şırnak | 8018 | 608659 | 1.9 | 1198 | 47164 |
| Eskişehir | 14058 | 444914 | 7.0 | 4935 | 247879 | Tekirdağ | 6641 | 529615 | 9.8 | 8848 | 606927 |
| Gaziantep | 7172 | 1840425 | 11.5 | 9168 | 684888 | Tokat | 9853 | 198249 | 2.4 | 5124 | 67142 |
| Giresun | 6841 | 15519267 | 1.9 | 5209 | 55142 | Trabzon | 5069 | 97319 | 4.8 | 8372 | 118941 |
| Gümüşhane | 6658 | 4367251 | 0.7 | 1871 | 26633 | Tunceli | 8105 | 199442 | 0.6 | 957 | 10649 |
| Hakkari | 6331 | 285410 | 1.1 | 1013 | 23949 | Uşak | 4927 | 270976 | 2.3 | 3447 | 154947 |
| Hatay | 5794 | 379405 | 8.3 | 9708 | 364341 | Van | 21545 | 248458 | 3.0 | 5082 | 85245 |
| Iğdır | 4012 | 1407409 | 0.9 | 1091 | 16992 | Yalova | 651 | 142490 | 2.2 | 1776 | 64922 |
| Isparta | 8879 | 361836 | 2.6 | 3821 | 78671 | Yozgat | 13160 | 538759 | 1.9 | 4063 | 49076 |
| İstanbul | 4767 | 242938 | 194.2 | 47129 | 3540493 | Zonguldak | 3058 | 392166 | 3.4 | 7807 | 102832 |
| İzmir | 12435 | 1953035 | 39.3 | 14716 | 1298341 |
| City | Ave-All | Ave-19 | L.R. | City | Ave-All | Ave-19 | L.R. | ||
|---|---|---|---|---|---|---|---|---|---|
| Adana | 75661.0 | 92369.2 | 0.51 | 0.96 | K. Maras | 28267.1 | 38666.2 | 0.30 | 0.99 |
| Adıyaman | 15714.4 | 18490.8 | 0.09 | 0.94 | Karabük | 11220.9 | 14038.9 | 0.09 | 0.95 |
| Afyon | 36326.0 | 48749.7 | 0.33 | 0.93 | Karaman | 10233.5 | 15320.2 | 0.14 | 0.97 |
| Ağrı | 18604.6 | 27348.1 | 0.28 | 0.92 | Kars | 12523.4 | 16359.9 | 0.12 | 0.78 |
| Aksaray | 13824.7 | 20837.6 | 0.19 | 0.91 | Kastamonu | 15388.0 | 19453.0 | 0.12 | 0.90 |
| Amasya | 15369.1 | 20886.4 | 0.17 | 0.97 | Kayseri | 68485.9 | 84816.9 | 0.60 | 0.92 |
| Ankara | 262707.9 | 312326.8 | 1.60 | 0.91 | Kilis | 5973.6 | 7511.4 | 0.04 | 0.92 |
| Antalya | 117113.9 | 147358.0 | 0.91 | 0.99 | Kırıkkale | 10659.7 | 15008.0 | 0.11 | 0.94 |
| Ardahan | 7620.3 | 12112.6 | 0.15 | 0.95 | Kırklareli | 16969.1 | 22042.6 | 0.13 | 0.96 |
| Artvin | 5517.9 | 7104.9 | 0.05 | 0.84 | Kırşehir | 11767.5 | 15746.1 | 0.11 | 0.90 |
| Aydın | 43808.9 | 51746.7 | 0.28 | 0.95 | Kocaeli | 104777.1 | 122444.0 | 0.52 | 0.93 |
| Balıkesir | 51165.4 | 62837.4 | 0.43 | 0.94 | Konya | 91805.9 | 124538.6 | 0.89 | 0.96 |
| Bartın | 6737.0 | 9765.1 | 0.08 | 0.97 | Kütahya | 24657.0 | 32040.4 | 0.21 | 0.93 |
| Batman | 16369.0 | 22646.5 | 0.20 | 0.91 | Malatya | 28910.2 | 35651.4 | 0.18 | 0.93 |
| Bayburt | 6388.6 | 7614.3 | 0.07 | 0.65 | Manisa | 48519.9 | 63196.2 | 0.48 | 0.97 |
| Bilecik | 13312.5 | 16823.2 | 0.11 | 0.89 | Mardin | 25684.5 | 35221.4 | 0.28 | 0.85 |
| Bingöl | 7050.5 | 9763.3 | 0.06 | 0.85 | Mersin | 66947.3 | 87291.0 | 0.57 | 0.98 |
| Bitlis | 13654.8 | 18505.9 | 0.15 | 0.85 | Muğla | 48314.4 | 56420.4 | 0.27 | 0.91 |
| Bolu | 14158.9 | 15359.3 | 0.07 | 0.65 | Muş | 9802.8 | 15372.0 | 0.15 | 0.91 |
| Burdur | 14018.3 | 18886.4 | 0.13 | 0.98 | Nevşehir | 18262.5 | 22723.1 | 0.17 | 0.90 |
| Bursa | 102608.8 | 121942.3 | 0.67 | 0.93 | Niğde | 20178.5 | 25379.2 | 0.17 | 0.95 |
| Çanakkale | 20093.5 | 25955.5 | 0.20 | 0.96 | Ordu | 15431.2 | 20707.3 | 0.15 | 0.93 |
| Çankırı | 9221.6 | 13460.1 | 0.12 | 0.95 | Osmaniye | 13712.8 | 17825.3 | 0.14 | 0.98 |
| Çorum | 21636.7 | 27685.4 | 0.19 | 0.91 | Rize | 8369.0 | 12799.1 | 0.11 | 0.93 |
| Denizli | 53840.5 | 62375.7 | 0.31 | 0.82 | Sakarya | 33663.1 | 41319.0 | 0.22 | 0.93 |
| Diyarbakır | 41004.7 | 55799.3 | 0.42 | 0.95 | Samsun | 48676.5 | 59663.0 | 0.38 | 0.90 |
| Düzce | 15901.6 | 19319.1 | 0.09 | 0.80 | Şanlıurfa | 42984.3 | 55148.2 | 0.47 | 0.92 |
| Edirne | 18198.1 | 23596.3 | 0.11 | 0.87 | Siirt | 8143.0 | 12162.9 | 0.12 | 0.93 |
| Elazığ | 21352.2 | 27436.9 | 0.17 | 0.96 | Sinop | 7448.3 | 9236.9 | 0.06 | 0.97 |
| Erzincan | 14115.8 | 17225.3 | 0.13 | 0.84 | Sivas | 12290.2 | 17093.6 | 0.13 | 0.79 |
| Erzurum | 47536.9 | 64825.1 | 0.50 | 0.84 | Şırnak | 29471.3 | 35903.9 | 0.29 | 0.87 |
| Eskişehir | 38450.8 | 50304.5 | 0.28 | 0.93 | Tekirdağ | 43323.0 | 61303.2 | 0.42 | 0.94 |
| Gaziantep | 56220.0 | 71179.5 | 0.46 | 0.98 | Tokat | 21508.0 | 29875.7 | 0.23 | 0.98 |
| Giresun | 9376.0 | 14240.2 | 0.12 | 0.94 | Trabzon | 15022.6 | 24818.1 | 0.23 | 0.92 |
| Gümüşhane | 5190.2 | 6610.6 | 0.05 | 0.75 | Tunceli | 6316.4 | 6308.7 | 0.00 | 0.01 |
| Hakkari | 7313.8 | 11643.6 | 0.12 | 0.92 | Uşak | 17681.7 | 23676.8 | 0.16 | 0.99 |
| Hatay | 57326.0 | 74518.1 | 0.49 | 0.98 | Van | 39477.1 | 58893.6 | 0.49 | 0.90 |
| Iğdır | 7048.8 | 11293.2 | 0.12 | 0.90 | Yalova | 9416.6 | 11586.2 | 0.08 | 0.92 |
| Isparta | 22095.5 | 29978.3 | 0.21 | 0.98 | Yozgat | 16876.3 | 24698.2 | 0.23 | 0.97 |
| İstanbul | 368785.7 | 458720.4 | 1.92 | 0.88 | Zonguldak | 21851.1 | 28349.2 | 0.17 | 0.95 |
| İzmir | 169984.4 | 202726.1 | 1.01 | 0.99 |
| Observatory Acronym & Observatory Organisation | City | Elevation | |||
|---|---|---|---|---|---|
| AÜKR | Ankara University Kreiken Observatory | Ankara | 32.78 | 39.84 | 1254 |
| ÇAAM | Çanakkale Astrophysics Research Center | Çanakkale | 26.48 | 40.01 | 373 |
| DAG | Doğu Anadolu Gözlemevi | Erzurum | 41.23 | 39.78 | 3102 |
| EGE | Ege University Observatory | İzmir | 27.27 | 38.40 | 622 |
| İNÜ | İnönü University Observatory | Malatya | 38.44 | 38.32 | 1021 |
| İÜO | İstanbul University Göz. Uyg. Arş.Mrk. | İstanbul | 28.96 | 41.01 | 55 |
| TUG | TÜBİTAK National Observatory | Antalya | 30.34 | 36.82 | 2436 |
| TURAG | Turkish National Radio Astronomy Obs. Site | Karaman | 33.09 | 37.14 | 1062 |
| UZAYBİMER | Astr. ve Uzay Bil. Göz. Uyg. Arş.Mrk. | Kayseri | 35.55 | 38.71 | 1094 |
| UZAYMER | Uzay Bil. ve Güneş¸ En. Arş. Uyg. Mrk. | Adana | 35.35 | 37.06 | 112 |
| Obs. | Ave-All | Ave-19 | L.R. | SQM | |
|---|---|---|---|---|---|
| AÜKR | 11.09 | 14.40 | 0.79 | 0.42 | 17.8 |
| ÇAAM | 0.26 | 0.30 | 0.01 | 0.48 | 21.0 |
| DAG | 0.27 | 0.27 | 0.02 | 0.50 | 21.1 |
| EGE | 1.79 | 2.21 | 0.14 | 0.80 | 19.3 |
| İNÜ | 4.24 | 5.00 | 0.58 | 0.57 | 18.7 |
| İÜO | 138.03 | 130.04 | -3.09 | 0.40 | 16.0 |
| TUG | 0.10 | 0.14 | 0.01 | 0.60 | 21.6 |
| TURAG | 0.10 | 0.13 | 0.01 | 0.90 | 21.7 |
| UZAYBİMER | 47.99 | 58.89 | 2.84 | 0.94 | 16.6 |
| UZAYMER | 10.47 | 9.53 | -0.05 | 0.01 | 18.1 |