Where Did the Outskirts Go? Outer Stellar halos as a Sensitive Probe of Supernova Feedback
Abstract
A recent comparison by Merritt et al. (2020) of simulated and observed Milky Way-mass galaxies has identified a significant tension between the outskirts () of the stellar halos in simulated and observed galaxies. Using observations from the Dragonfly telescope and simulated galaxies from the Illustris-TNG100 project, Merritt et al. (2020) finds that the outskirts of stellar halos in simulated galaxies have surface densities dex higher than observed galaxies. In this paper, we compare two suites of 15 simulated Milky Way-like galaxies, each drawn from the same initial conditions, simulated with the same hydrodynamical code, but with two different models for feedback from supernovae. We find that the MUGS simulations, which use an older “delayed-cooling” model for feedback, also produce too much stellar mass in the outskirts of the halo, with median surface densities well above observational constraints. The MUGS2 simulations, which instead use a new, physically-motivated “superbubble” model for stellar feedback, have dex lower outer stellar halo masses and surface densities. The MUGS2 simulations generally match both the median surface density profile as well as the scatter in stellar halo surface density profiles seen in observed stellar halos. We conclude that there is no “missing outskirts” problem in cosmological simulations, provided that supernova feedback is modelled in a way that allows it to efficiently regulate star formation in the low-mass progenitor environments of stellar halo outskirts.
1 Introduction
The stellar halos of galaxies provide an interesting laboratory for testing theories of cosmological galaxy formation. The long dynamical times (e.g. Bullock & Johnston, 2005) and high stellar ex-situ fractions (e.g. Font et al., 2011) outside of the stellar disk can allow the structures formed by the accretion and tidal disruption (Bullock & Johnston, 2005) of progenitors to persist for a significant fraction of a Hubble time, preserving a relic of the accretion history of the galaxy. However, the low stellar mass (relative to the disk) of stellar halos (Merritt et al., 2016) makes them difficult to resolve in cosmological simulations, and their extremely low surface brightness makes them exceptionally difficult to observe. Some of the most heavily studied issues in galaxy formation over the past decades have related to the abundance and luminosity of satellites within the halo of Milky Way (MW)-like galaxies. The “missing satellites” problem (Klypin et al., 1999) points to the significantly larger number of satellite galaxies seen in dark-matter only simulations of MW-like galaxies compared to the observed satellite mass functions of the MW and M31. The “Too-Big-To-Fail” problem (Boylan-Kolchin et al., 2011) heightens this tension by showing that CDM predicts the MW halo should contain satellites much more massive or centrally concentrated (with ) than what has been measured for the kinematics of the brightest MW satellites. Many solutions to these problems have been proposed, from reionization regulating star formation in low-mass dwarfs (Bullock et al., 2000; Gnedin, 2000) to enhanced tidal disruption by the stellar disk (Kelley et al., 2019). The advent of higher-resolution cosmological simulations, using better models for “strong” stellar feedback (e.g. Okamoto et al., 2010; Nickerson et al., 2013; Sawala et al., 2016; Akins et al., 2021) has produced a growing consensus that the issues of satellite abundances around MW-like galaxies is largely solved when the full range of baryonic processes (star formation and feedback primarily) are accounted for. Recently, a comparison between a new survey of stellar halos around MW-mass galaxies and the Illustris-TNG100 cosmological simulations (Merritt et al., 2020) has pointed towards a tension between observed stellar halos and simulated stellar halos. Merritt et al. (2020) has found the stellar halos in Illustris-TNG100 simulated galaxies have significantly higher surface densities at radii compared to observations from Merritt et al. (2016), a problem the authors dub “missing outskirts”.
The most precise observations of stellar halos are those of our own galaxy and of Andromeda (M31). For these two L* galaxies, we have detailed censuses of the positions (e.g. Searle & Zinn, 1978), ages (e.g. Helmi et al., 1999), metallicities (e.g. Ibata et al., 2001), and kinematics (e.g. Yanny et al., 2003) for thousands of individual stars within the stellar halo (now tens of thousands with the advent of Gaia). However, surveys of other galaxies have suggested that both the MW and M31 may have relatively extremal stellar halos, with M31 having an unusually massive, iron-rich stellar halo compared to the MW’s unusually light , iron-poor stellar halo (see Figure 12 of (Harmsen et al., 2017), but note that this result is not seen in the DNGS galaxies examined by Merritt et al. 2016). The MW may also have a more elliptical stellar halo than galaxies with similar stellar mass (D’Souza et al., 2014). Deason et al. (2013) has also concluded that the shapes of the MW and M31 stellar halo profiles suggest a prolonged accretion history for M31 and an accretion history dominated by one or more massive satellites in the MW. Surveys of extragalactic stellar halos have been primarily limited by the low surface brightness of stellar halos, typically 8-10 lower than the stellar disk. Studies of stellar halos around other galaxies have typically relied on either stacking (e.g. D’Souza et al., 2014; Wang et al., 2019) or on deep, “pencil-beam” studies that observe only a small fraction of the covering area of a galaxy’s halo (The GHOSTS Survey (Radburn-Smith et al., 2011), for example, used the Hubble Space Telescope’s Advanced Camera for Surveys to examine the halos along the major and minor axes of 14 nearby disk galaxies). The advent of telephoto array telescopes, such as Dragonfly (Abraham & van Dokkum, 2014) and Huntsman (Horton et al., 2020) provide two critical features that make them ideal instruments for observing stellar halos. The first, a feature of the advanced anti-reflection coatings available in modern high-end photography lenses, is extremely low imaging noise, giving them the ability to probe surface brightnesses below . The second, owing to their construction from consumer/off-the-shelf photography equipment, is a large field of view (), which allows them to cover the entire halo out to nearly a virial radius for most nearby L* galaxies. These new telescope systems have led to a revolution in low surface brightness observations, and have discovered new classes of unusual, low surface brightness galaxies (van Dokkum et al., 2015, 2018).
The Dragonfly Nearby Galaxy Survey (DNGS) (Merritt et al., 2016) imaged 8 nearby, MW-like galaxies (M101, NGC 1042, NGC 1084, NGC 2903, NGC 3351, NGC 3368, NGC 4220, and NGC 4258). These observations probe down to a surface brightness of , measuring the stellar halo profiles and halo mass fractions. In their results, the authors found the stellar halo fractions beyond 5 half-mass radii were detectably lower than predictions for the stellar halo mass from the Aquarius simulations (Cooper et al., 2010), the Eris simulation (Pillepich et al., 2015), and the Millenium II simulation (Cooper et al., 2013). Measuring stellar halo fractions is a somewhat tricky matter, as Sanderson et al. (2018) demonstrated using simulations from the FIRE-2 and ELVIS suites. Because of the steep power-law density profile of stellar halos (with density slopes of to , Font et al. 2011), the choice of inner cut for integrated mass measurements of the stellar halo can have a significant impact on the total stellar halo mass and halo mass fractions: if the surface density has a slope steeper than , most of the mass will be contained in the inner halo. Merritt et al. (2020) sidesteps this issue by comparing the radial profiles of stellar surface brightness and mass surface density of the DNGS galaxies to those of simulated galaxies from the Illustris-TNG project (Pillepich et al., 2018). These results show that the outer stellar halos of simulated galaxies, beyond radii of , are systematically higher in the entire population of simulated galaxies, despite a careful “apples-to-apples” comparison of mock observations to the actual DNGS data.
While sparse, observational data for stellar halos in MW-mass galaxies has still been a useful tool for comparison to semi-analytic models and numerical simulations of galaxy formation. These comparisons have sought to test our predictions on the assembly of stellar halos in the CDM framework. Many early models use analytic or semi-analytic models, combined with “particle tagging” approaches applied to collisionless N-body simulations (e.g. Bullock & Johnston, 2005; Cooper et al., 2010, 2017). In these approaches, dark matter (DM) particles are tagged as carrying stellar mass into the galaxy halo, based on their kinematic and host halo properties (e.g. Cooper et al., 2010). Recently, the improving resolution and physical fidelity of large, cosmological galaxy simulations have allowed the study of stellar halos from self-consistent models of galaxy formation, including both hydrodynamic effects and radiative processes, as well as star formation and stellar feedback (e.g. Font et al., 2011; Pillepich et al., 2014; Sanderson et al., 2018; Monachesi et al., 2019; Obreja et al., 2019; Font et al., 2020). Different simulation studies of stellar halos have all relied on different models for star formation and stellar feedback, a wide range of numerical resolutions, and different simulation volumes. Thus, comparing different models to observations can allow us to tease out the impact these various choices and assumptions have on the assembly of different stellar populations within the galaxy.
Simulation studies of the assembly of the outer stellar halos in MW-mass galaxies have generally converged on a number of properties of the stellar outskirts. Studies examining the stellar halos of the GIMIC (Font et al., 2011), Aquarius (Tissera et al., 2012), Eris (Pillepich et al., 2015), Auriga (Monachesi et al., 2019), and ARTEMIS (Font et al., 2020) simulated galaxies all find that the outer halo is dominated by accreted (ex-situ) stars, while the inner halo is composed of a mix of in-situ and ex-situ stars. This difference manifests itself in distinct changes in the chemical (e.g. Font et al., 2011; Tissera et al., 2012; Pillepich et al., 2014) and kinematic (e.g. Tissera et al., 2013; Cooper et al., 2015) properties as one moves out through the stellar halo. The density profile of the halo may be steeper for the outer halo versus the inner halo(Font et al., 2011; Pillepich et al., 2014; Font et al., 2020), though other studies (Cooper et al., 2015; Thomas et al., 2021) have found a roughly constant slope out to . For the remainder of this paper, we use “stellar halo outskirts” and “outer stellar halo” to refer to the portion of the stellar halo beyond , following the division used by Carollo et al. (2010), Pillepich et al. (2015), and (Merritt et al., 2020).
In this paper, we examine the specific question raised by Merritt et al. (2020): do simulated galaxies systematically overproduce stars in the outskirts of the stellar halo? We specifically examine one critical piece of all modern galaxy formation simulations, namely stellar feedback from core-collapse supernovae (SNe). Using a set of paired simulations of 15 MW-like galaxies, we compare how two different numerical implementations of SNe feedback change the outskirts of the stellar halos. We demonstrate that the surface density and total mass of stellar halo outskirts are highly sensitive to the model of SN feedback used to simulate the galaxy. In particular, we demonstrate that the impact of feedback on stellar halos is much stronger than the impact on the total stellar mass, which owes to the different assembly history of halo stars versus the stars that make up the majority of the stellar mass in the disk of the galaxy.
2 Methods
2.1 Simulations
We compare matched pairs of cosmological zoom-in simulations of 15 MW-like L* galaxies with observations of 8 galaxies from the DNGS. Each of the 15 pairs of galaxies is simulated from the same initial conditions (ICs), derived from the McMaster Unbiased Galaxy Simulations (MUGS) project (Stinson et al., 2006). These simulations use a WMAP3 CDM cosmology with , , , , and (Spergel et al., 2007). The DM resolution of the simulations is per particle, while the initial gas particle mass is . All particles use a uniform softening length of .
The pairs of simulations we compare were run as part of the MUGS and MUGS2 simulation projects (Stinson et al. 2010 and Keller et al. 2016 respectively). They share identical ICs and parameters used in the gravity solution, but feature a number of differences in the hydrodynamic solver and the sub-grid prescription for star formation and feedback. The original MUGS galaxies used a “traditional” pressure-density prescription for Smoothed-Particle Hydrodynamics (SPH) in the code Gasoline, which has subsequently been found to artificially suppress mixing in shearing and turbulent flows (Agertz et al., 2007). MUGS2 is the first set of cosmological simulations produced using the new Gasoline2 code (Wadsley et al., 2017). Gasoline2 includes a treatment for turbulent diffusion (Wadsley et al., 2008), improved time-step calculation (Saitoh & Makino, 2009), and a new treatment for the calculation of forces (Wadsley et al., 2017). While the hydrodynamics improvements in MUGS2 result in a more accurate treatment of the interstellar medium (ISM) and circumgalactic medium (CGM), the primary differences arise due to the difference in sub-grid feedback models between MUGS and MUGS2.
In the original MUGS sample, SN feedback is modelled using a delayed-cooling “blastwave” mechanism (Stinson et al., 2006). This model is designed to prevent numerical overcooling by disabling radiative cooling in feedback-heated gas until the end of the momentum-conserving snowplow phase. Alternatively, in the MUGS2 simulations, SN feedback is modelled using the Keller et al. (2014) “superbubble” model. In this model, radiative cooling is included self-consistently for SN-heated gas by temporarily including a two-phase component within recently heated gas particles. The two isobaric phases each calculate their cooling rates using a separate density and temperature, and mass is evaporated from the cold “shell” phase into the hot “bubble” phase using the classical evaporation rates derived in Cowie & McKee (1977). Once the entirety of a two-phase particle’s cold shell is evaporated, it can continue evaporating neighbours using a stochastic evaporation method described in Keller et al. (2014). The difference in strategy between these two models can be summarized as: “blastwave” feedback seeks to prevent numerical overcooling by disabling cooling for some appropriate time, while “superbubble” feedback prevents it by heating only the correct amount of gas. In Keller et al. (2014) and Keller et al. (2015), we demonstrated that superbubble feedback drives significantly more mass-loaded galactic outflows than the blastwave model, and can reduce the overall star formation rate and bulge fraction in both isolated and cosmological simulations of MW-like galaxies.
We list in table 1 the halo mass , virial radius , stellar mass within the inner of the halo (rather than total stellar mass, in order to match Merritt et al. (2020)), and stellar half-mass radii for each of the galaxies in the MUGS and MUGS2 simulations. As this table shows, below , the MUGS2 galaxies produce significantly less stellar mass within the inner than the MUGS simulations, while above this mass the two simulation sets have similar stellar masses (to within a factor of ). The MUGS2 galaxies above also have a more massive stellar bulge, which in turn lowers their half-mass radius by a factor of . In all instances here, we define the virial radius (and the enclosed virial mass ) as the radius around the halo such that the enclosed density is 200 times the critical density (). In both the MUGS and MUGS2 simulations, halos were found in each of the simulations using the Amiga Halo Finder (AHF; Knollmann & Knebe, 2009). While slight () differences in and arise from the different feedback models used, these differences do not significantly impact the results shown here.
| Galaxy | ||||||||
|---|---|---|---|---|---|---|---|---|
| g7124 | 38.1 | 36.6 | 145 | 143 | 3.46 | 0.5 | 1.37 | 4.72 |
| g5664 | 44.9 | 47.7 | 153 | 157 | 4.15 | 0.9 | 1.57 | 3.81 |
| g8893 | 53.5 | 58.0 | 163 | 167 | 5.73 | 0.7 | 1.82 | 8.18 |
| g1536 | 64.1 | 64.9 | 173 | 174 | 7.95 | 1.8 | 1.74 | 6.53 |
| g21647 | 70.2 | 74.4 | 178 | 181 | 5.81 | 1.5 | 4.25 | 3.02 |
| g422 | 75.7 | 76.2 | 182 | 183 | 4.41 | 1.0 | 2.94 | 7.10 |
| g22437 | 76.1 | 85.2 | 183 | 190 | 6.27 | 9.0 | 1.76 | 0.68 |
| g22795 | 78.0 | 85.2 | 185 | 190 | 6.01 | 10.6 | 1.52 | 0.94 |
| g3021 | 88.7 | 97.8 | 193 | 199 | 8.45 | 3.6 | 3.60 | 4.11 |
| g28547 | 93.6 | 98.5 | 196 | 200 | 5.74 | 1.5 | 53.75 | 6.57 |
| g24334 | 97.3 | 102.2 | 199 | 202 | 6.57 | 2.3 | 6.35 | 5.89 |
| g4145 | 103.1 | 119.5 | 202 | 213 | 8.61 | 15.0 | 2.25 | 1.19 |
| g25271 | 108.7 | 125.5 | 206 | 216 | 9.51 | 15.5 | 1.73 | 1.21 |
| g15784 | 121.3 | 131.1 | 214 | 219 | 9.10 | 12.9 | 2.83 | 1.53 |
| g15807 | 190.3 | 203.2 | 249 | 254 | 12.83 | 20.9 | 4.00 | 1.03 |
2.2 Stellar Surface Density Maps
Merritt et al. (2020) considers a number of potential observational and numerical effects in comparing observations to mock stellar maps from the Illustris-TNG simulations (Pillepich et al., 2018). Simply radially binning star particles will of course not allow a comparison to 2D image maps, and will suffer from discreteness noise in the lower-density regions. Discreteness noise is somewhat less important for the higher baryonic mass resolution MUGS simulations we analyse here ( in TNG100 vs. in MUGS/MUGS2), but for purposes of comparison we will follow the strategy of Merritt et al. (2020). Using the built-in analysis features of pynbody (Pontzen et al., 2013), we generate smoothed 2D column density maps of stellar mass, using a cubic spline kernel, with an adaptive smoothing length set by the distance to the 64th neighbour particle. These methods are designed to mimic the SPH smoothing operations, and produce smoothed maps of quantities comparable to those analysed in Merritt et al. (2020). We use smoothed maps with pixel dimensions of , as is used in Merritt et al. (2020). To further follow Merritt et al. (2020), we centre our galaxies at the deepest point in each halo’s potential well, but do not rotate the galaxies to orient the disk either edge or face on, giving each galaxy an effectively random orientation. For a brief discussion of the (non-) importance of galaxy orientation to our results, see appendix A.
3 Results
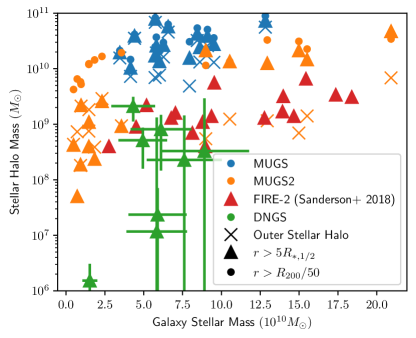
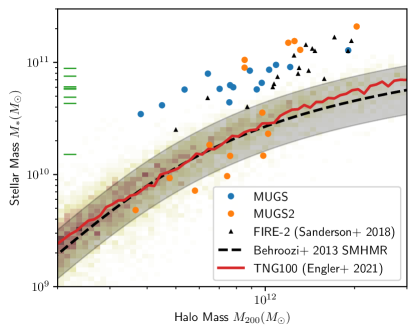
The galaxies in the MUGS/MUGS2 sample roughly span the range of stellar masses probed by DNGS, as is shown in Figure 1. We also show the simulated galaxies studied by Sanderson et al. (2018) from the FIRE-2 simulations (Hopkins et al., 2018a), which span a similar range of stellar and halo masses, and the results from Illustris-TNG100 in the 2D histogram. MUGS, MUGS2, and FIRE-2 all overproduce stars relative to the Behroozi et al. (2013) abundance-matched stellar mass to halo mass relation above halo masses of , likely owing to the absence of active galactic nucleus (AGN) feedback in all three simulation suites (see Keller et al. 2016 for a discussion of this in the context of the MUGS2 simulations). In the MUGS2 sample, we see that the transition from “regulated” to “runaway” at occurs rather sharply (and somewhat stochastically), with some galaxies in this mass range (g3021, g28547, and g24334) falling within the abundance-matched relation, while others at slightly lower mass (g22437 and g22795) overproduce stars. This is due to a combination of the different assembly histories of these galaxies, halo properties (g22437 and g22795 have the lowest spin parameters of the entire MUGS sample, as seen in Table 1 of Keller et al. (2016)), and the stochastic effects shown in Keller et al. (2019) and Genel et al. (2019). The SMHMR for TNG100, on the other hand, has been specifically tuned to match the abundance-matched relation of Behroozi et al. (2013) (see Figure 4 of Pillepich et al. 2018), and thus tracks this relation extremely well. With these samples, we can examine the distinct evolution of the stellar halo in galaxies which overproduce stars in the central disk and bulge (MUGS, MUGS2 above , and FIRE-2), and galaxies which match the abundance matched SMHMR (MUGS2 below and TNG100). As this shows, the significantly more massive stellar halos in TNG100 are not a result of an overall overproduction of stars: TNG100 by construction matches the abundance-matched SMHMR extremely well (as was discussed in Pillepich et al. 2018 and Engler et al. 2021. In the following sections we will see why this is not the case for the MUGS2 sample: galaxies above and below both have significantly less massive stellar halos than their MUGS counterparts.
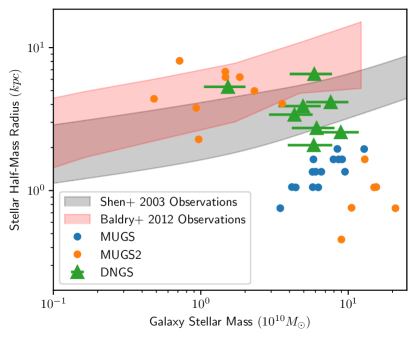
A similar discrepancy between the simulated galaxies and observations can be seen in the size-mass relation shown in Figure 2. In the MUGS2 sample, galaxies with stellar mass below fall within the range of observed stellar half-mass radii from Shen et al. (2003) and Baldry et al. (2012), while galaxies above this mass range all have values of significantly lower than the mean observed values from Shen et al. (2003). The cause of this is the runaway growth of bulge mass that is discussed at length in section 5.2 of Keller et al. (2016), an effect that Dubois et al. (2015) links directly to the onset of AGN feedback. In the “runaway” MUGS2 galaxies, the ultimate reason that both the stellar masses in Figure 1 and the sizes in Figure 2 begin to deviate from the observed relation is star formation occurring primarily in the central bulge.
3.1 The Impact of Feedback in Outer Stellar halos
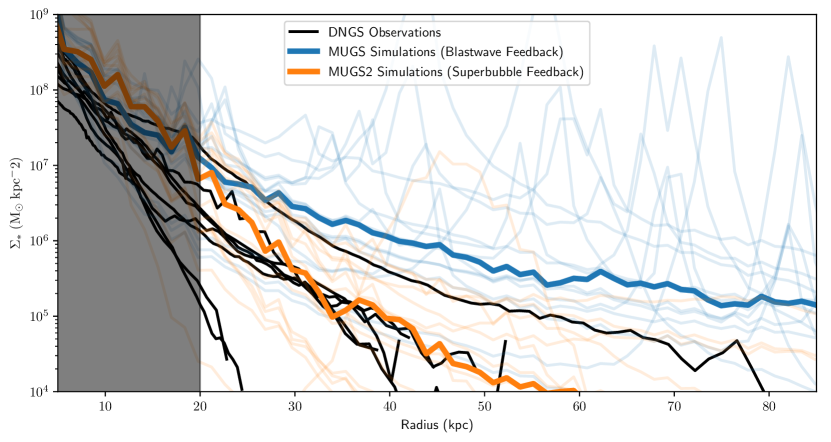
The stellar surface density as a function of radius for the DNGS sample, as well as MUGS and MUGS2 is shown in Figure 3. As can be seen, in all three samples of observed/simulated galaxies there is significant galaxy-to-galaxy variance in the surface density of the outer stellar halo. Comparing these results to Figure 6 of Merritt et al. (2020), the stellar halos of the MUGS galaxies are qualitatively similar to those of the TNG100 sample.
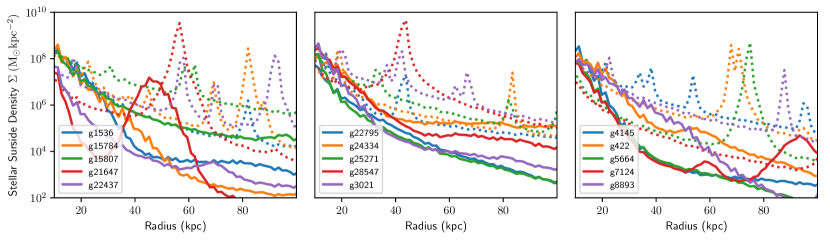
Figure 4 shows the stellar halo in each of the 15 pairs of galaxies from MUGS and MUGS2. Peaks in these profiles correspond to satellites, and as is clear, there are many more massive satellites in the MUGS simulations compared to the MUGS2 simulations. However, the diffuse halo between these satellites also shows, in every galaxy, a markedly lower density in the MUGS2 simulations. This is evidence that the satellites we see in MUGS have not simply accreted with equal mass and then been stripped in the MUGS2 halos, but have accreted with a much lower stellar in MUGS2. The diversity of stellar halos we see in each of these galaxies is a relic of the diverse assembly histories of these simulated L* galaxies. Notably, as we show in Keller et al. (2015) and Keller et al. (2016), superbubble feedback preferentially suppresses star formation at high redshift and in low-mass galaxies, which we examine later here in section 3.2.
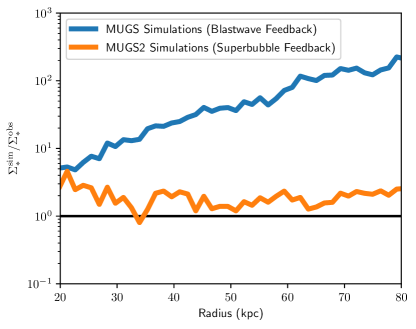
The quantitative difference between the outer stellar halos in the MUGS and MUGS2 simulations is shown clearly in Figure 5. Here, we compare the ratio of the median outer stellar halo surface density from the two simulation suites to the median outer stellar halo surface density from the DNGS observations out to (the edge of the DNGS sample). For the DNGS observations, we fit each of the measured surface density profiles in the outer halo (from ) with a power law, and take the median value of the 8 power-law fits to generate . We apply this fitting because the observed stellar surface density profile does not extend to for all 8 galaxies (only NGC4258 is measured out to , owing to the sensitivity limit of DNGS), and because the profiles have different radii bins. As Figure 5 shows, the surface density profile of the median outer stellar halo in the MUGS2 galaxies matches the median observed outer stellar halo surface density profile, to within a factor of out to . The MUGS galaxies, on the other hand, have stellar surface densities times higher than DNGS at , increasing to times higher at . Even for the galaxies containing comparable total stellar mass, the outer stellar halos have surface densities dex higher in MUGS compared to both MUGS2 and the DNGS observations, as is seen in Figure 4.
The total mass within the stellar halo is difficult to measure in a self-consistent way for both observations and theory (see Sanderson et al. 2018 for a thorough discussion of this topic). The critical issue is that the strong negative slope of the stellar surface density means the choice of inner radius for the stellar halo will have significant impact on the stellar halo mass and the halo fraction. It is especially important to ensure that the inner radius of a region used to select halo stars is large enough that it excludes the outer edge of the galaxy’s stellar disk. As the gas disk can extend much further than the stellar half-light radius (or even ), small amounts of star formation in the edge of the disk can contaminate the population of halo stars with rotationally-supported disk stars. In addition, using the stellar half-mass radius will change the inner edge of the stellar halo for galaxies of equal stellar/halo mass depending on their bulge fraction. Merritt et al. (2020) identifies a tension between simulations and observations in the stellar halo outskirts, beyond , where these issues are largely avoided. With a fixed physical radius (roughly for the halo masses we examine here), we avoid both contamination from disk and bulge stars as well as the bias introduced by measuring the halos from different inner radii. Using a fixed radius is particularly appropriate for this comparison, as each pair of galaxies from the MUGS and MUGS2 simulations share ICs, and therefore should have nearly identical DM accretion histories. In Figure 6, we reproduce the finding of Sanderson et al. (2018) and Merritt et al. (2020) showing the sensitivity of the measured stellar halo mass to the choice of inner radius. The outer stellar halo (shown as crosses) reflects the large difference in stellar surface densities we show in Figure 5, while cuts based on the stellar half-mass radius (, as is used in Merritt et al. 2016) or a small fraction of the virial radius (, as is used in Pillepich et al. 2014) show a much more modest reduction in stellar halo mass for the simulated galaxies with stellar masses above . A major part of this arises not from a change in the stellar halo, but from the reduced stellar half-mass radius that occurs in these larger galaxies: as they become bulge-dominated, the half-mass radius is significantly reduced. As can be seen, measuring the outer halo mass from a constant radius of gives reasonable agreement between the MUGS2 simulated stellar halos and the Merritt et al. (2016) Dragonfly observations. The smallest value of used in Merritt et al. (2016) is , compared to for g22437, the most bulge-dominated galaxy in MUGS2. These results are in good agreement with Figure 8 of Merritt et al. (2020), which also shows that the difference between the observed and simulated stellar halo outskirts are much larger than the difference between the stellar halo mass measured from a smaller radius ( in Merritt et al. 2020).
3.2 How Feedback Shapes Outer Stellar halos
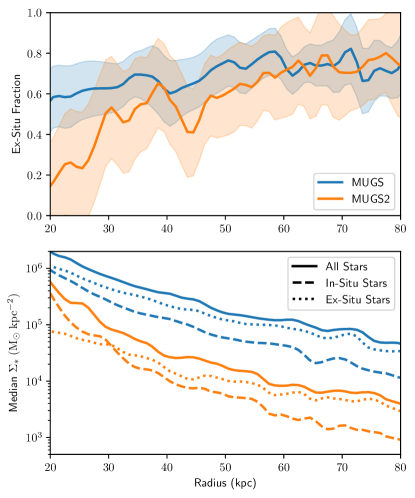
The results we have shown thus far demonstrate that the “superbubble” feedback in MUGS2 produces significantly less massive outer stellar halos compared to the “blastwave” feedback in their equivalent MUGS simulations. This effect appears to be robust to the diverse assembly histories of the galaxies, and even whther or not the total stellar mass of the galaxy in MUGS and MUGS2 is similar. This suggests that the outer stellar halo is a more sensitive probe of stellar feedback than the stellar content of the disk (which dominates the overall stellar mass). In Figure 7, we show how the different models for SN feedback impact the ex-situ and in-situ stellar components of the two samples of simulated galaxies. Previous studies (using both semi-analytic models, e.g. Bullock & Johnston 2005; Cooper et al. 2017 and hydrodynamical simulations, e.g. Font et al. 2011; Pillepich et al. 2015) have found that anywhere from the majority to the totality of the stellar halo is composed of tidal debris from accreted satellites (an ex-situ formation scenario).
In the top panel of Figure 7, we show the radial profile and variance of the ex-situ fraction of stars in the MUGS and MUGS2 outer stellar halos as a function of galactocentric radius. We define ex-situ stars as those stars which are first identified in a halo other than the primary progenitor of the galaxy, and are subsequently accreted by each galaxy. The ex-situ fraction is then the ratio of mass of ex-situ stars to the total stellar mass (both measured within the outer stellar halo). As can be seen in the top panel, the ex-situ fraction has a median of in both MUGS and MUGS2 galaxies beyond . Inside , the picture becomes different for the two populations, with MUGS2 ex-situ fractions dropping to at the beginning of the outer stellar halo. This shows that much of the difference we see is due to a reduction in overall contribution of ex-situ stars, as even a complete elimination of in-situ stars could only reduce the outer stellar halo surface density by at most a factor at , rather than the dex reduction we see. Of course, this also means that a complete reduction of ex-situ stars cannot explain the differences we see. Indeed, as we show in the bottom panel of Figure 7, the surface density of both in-situ and ex-situ stars in the MUGS2 galaxies are reduced by dex beyond a galactocentric radius of . As we would expect from the top panel, the contribution of ex-situ stars are reduced throughout the outer stellar halo in MUGS2. This clearly shows that the lower stellar halo surface densities in the MUGS2 galaxies arise from a reduction in both in-situ and ex-situ halo stars.
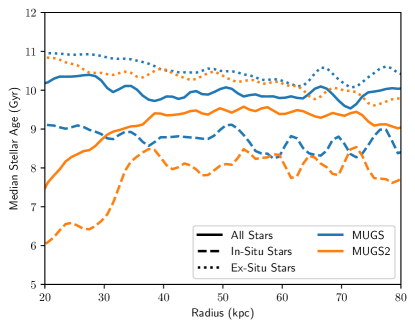
Figure 8 shows how the trends we see in the upper panels relate to the median stellar age profiles of the MUGS and MUGS2 galaxies. For both in-situ and ex-situ stars, the outer stellar halo of both simulated galaxy samples show only slight variation in in median stellar age as a function of galactocentric radius. As we would expect, the accreted ex-situ population is older than the in-situ population for both the MUGS and MUGS2 outer stellar halos. Both the MUGS2 and MUGS ex-situ populations in the outer halo have median ages of , compared to a median age of for the MUGS2 in-situ population and for the MUGS in-situ population. The population of in-situ stars most easily scattered into the outer halo by mergers are those which formed at high redshift, when the merger rate was more frequent and the disk potential was lower.
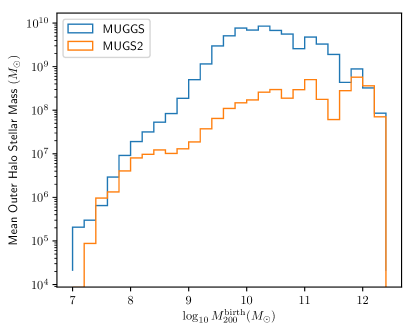
The changes we see in the ex-situ fraction and stellar ages of the outer stellar halos in Figure 7 and Figure 8 point towards a difference in feedback efficiency in lower-mass galaxies. Both ex-situ stars and older in-situ stars are born in lower-mass galaxies than the central galaxy at . In Figure 9, we show the birth galaxy halo mass for all stars within the outer stellar halos of the MUGS and MUGS2 galaxies. We produce a single histogram for all 15 galaxies, normalized by this amount to show the mean stellar mass within the outer stellar halo as a function of birth galaxy mass. Here we see clearly how the two different SN feedback models in MUGS and MUGS2 produce outer stellar halos with different masses, ex-situ fractions, and ages. The “superbubble” feedback model of MUGS2 reduces the contribution to the outer stellar halo from galaxies with . Below this stellar mass range, both feedback models are efficient, and a single star particle can halt the star formation of the progenitor (see Mina et al. 2021 for a recent comparison of these same feedback models in dwarf galaxies, albeit at a somewhat higher galaxy mass range than ). The outer stellar halo contains very little mass from progenitors below . Above , both feedback models become inefficient, and SN will cease to regulate star formation. This effect can be seen in Figure 1, and is discussed at length in (Keller et al., 2016). The bulk of the mass in the MUGS outer stellar halos formed in galaxies with . Superbubble feedback reduces the contribution of from galaxies in this mass range to the outer stellar halo mass by dex. For the galaxies with , the total stellar mass (and stellar mass in the inner ) is a weak discriminant of these two feedback models. By examining the outer stellar halo, we can probe the star formation efficiency in lower mass galaxies, integrated over the assembly history of the entire galaxy.
4 Discussion & Conclusion
We have shown here how the modelling of SN feedback can have a dramatic effect on the outer stellar halos of MW-mass galaxies. We are only able to match the observed stellar surface density profiles from the DNGS when SN feedback is strong for galaxy halo masses . When SN feedback is simulated with a physically-motivated superbubble model (Keller et al., 2014), which takes into account thermal conduction and evaporation and drives much more efficient, buoyant galactic winds (Keller et al., 2020b), the outer stellar halo surface densities are in agreement with the DNGS observations. The MUGS2 galaxies, which include this new model, have outer stellar halos with significantly reduced mass and surface density compared to the older MUGS simulations, even when the galaxy mass becomes large enough that AGN feedback is required to regulate the total stellar mass of the galaxy (Keller et al., 2016). As the outer stellar halo is primarily composed of smaller accreted progenitors and the tidal debris of interactions with the young primary progenitor galaxy, the properties of stellar halo outskirts follow the early history of star formation in the lower-mass progenitors of the final galaxy.
Despite having slightly higher total masses, the outer stellar halo of the MUGS2 galaxies show surface densities dex below those from the MUGS sample. We find that in both simulation samples, the most extended parts of the outer stellar halos are dominated by old ex-situ stars (with ex-situ fractions ), in agreement with past simulation and semi-analytic studies (e.g. Cooper et al., 2013; Tissera et al., 2012; Pillepich et al., 2015).
4.1 A Comparison of Feedback Models
In this paper, we have primarily examined the impact on the stellar halos of simulated, MW-mass galaxies from the MUGS and MUGS-2 simulations. This work is primarily motivated by the findings of Merritt et al. (2020) that simulated stellar halos from Illustris TNG100 produce stellar halos with surface densities 10-100 times higher than observed stellar halos in DNGS. A similar study (Sanderson et al., 2018) compared the total stellar halo mass from DNGS observations to those from the FIRE-2 simulations. Each of these simulation projects relied on different feedback schemes to regulate the growth of stellar and baryonic mass within their galaxies. While TNG100 has been specifically tuned to reproduce the Behroozi et al. (2013) SMHMR (see Figure 1), MUGS, MUGS2, and FIRE-2 instead have applied feedback models designed to reproduce the small-scale behaviour of stellar feedback processes. There are a number of fundamental differences between these four models beyond this, however.
Of these four simulation projects (MUGS, MUGS2, FIRE-2, and TNG100), only TNG100 includes a model for AGN feedback, and only FIRE-2 includes a model for early stellar feedback. The model for AGN feedback in TNG100 seeds black holes in halos that exceed a mass of . This means AGN feedback cannot occur in galaxies below a halo mass of . As we show in Figure 9, the majority of the additional halo stars in MUGS are born in halos with masses near , so a possible explanation for the overly-massive stellar halos in TNG100 is that while AGN feedback contributes significantly to regulating the stellar mass within the inner of MW-mass galaxies, it is unable to regulate star formation in the less massive halos where no black hole has been seeded. The stellar feedback model in TNG100 is an extension of the two-phase ISM model of Springel & Hernquist (2003), along with an updated treatment for hydrodynamically decoupled winds. This model explicitly sets the velocity and direction of winds, as well as their mass, energy, and metal loadings. These quantities are all determined by the local gas metallicity, DM velocity dispersion, and the current Hubble constant . The functional form setting these quantities, as well as the dimensionless parameters may all contribute to the overproduction of halo stars despite producing “correct” central galaxy stellar masses (for example, the TNG wind velocity scales , giving lower outflow velocities at high redshift, when most halo stars are formed).
The stellar feedback models in MUGS, MUGS2, and FIRE-2 all produce outflows emergently, with energy being injected on small scales and driving winds (or not) as a function of the local ISM/CGM environment. All three simulations inject energy from core-collapse supernovae, with similar SN energies, and on similar timescales (Keller & Kruijssen, 2022). However, each relies on a different method to prevent the overcooling of SN-heated gas. MUGS simply delays radiative cooling, using a method described in Stinson et al. (2006). MUGS2 uses the superbubble method described in Keller et al. (2014) to put SN-heated gas into a brief two-phase state, returning it to single-phase through thermal evaporation of the cold phase into the hot. FIRE-2 uses an updated mechanical feedback (Kimm & Cen, 2014; Hopkins et al., 2014) algorithm described in Hopkins et al. (2018b) to partition SN energy into kinetic and thermal fractions determined by the baryonic resolution, local gas density, and metallicity. This algorithm injects the terminal momentum from the end of the pressure-driven snowplow phase in gas with density and metallicity large enough that overcooling will be significant for the resolution of the simulation. In addition to the different treatments for SN feedback, FIRE-2 also includes thermal feedback from stellar winds, photoionization, and radiation pressure. Each of these components may contribute to regulating star formation in low-mass galaxies differently than in high-mass galaxies. A detailed comparison of the resolved stellar halo outskirts in FIRE-2, building off of the work of Sanderson et al. (2018), may be able to see if the same effects we observe in MUGS/MUGS2 occur with the more comprehensive feedback models used in FIRE-2. As we show in Figure 6, the FIRE-2 simulations also appear to have less mass within their stellar halo than MUGS and TNG100, which suggests that the feedback models in FIRE-2 and MUGS2 are both efficient at regulating star formation in the low-mass progenitors of the outer stellar halo.
4.2 Comparison to Other Simulations
The goal of this study is to examine the findings shown in Merritt et al. (2020), which is the first study to comprehensively compare the (non-integrated) stellar halo profiles observed in Merritt et al. (2016) with simulations. The authors of this study a large discrepancy between the outer stellar halos of MW-mass galaxies from the Illustris-TNG100 simulation (Pillepich et al., 2018) and the DNGS observations (Merritt et al., 2016) of outer stellar halos (the “missing outskirts” problem). The major difference between the simulations we examine here and those of TNG100 are the larger population in TNG100. Merritt et al. (2020) samples from a total of 1656 central galaxies with stellar mass , selecting 50 galaxies chosen to match the distribution of stellar mass in DNGS (compared to the 15 galaxy pairs we compare here). In addition to the larger sample size, TNG100 has somewhat lower baryonic resolution than MUGS/MUGS2 ( in MUGS/MUGS2, in TNG100), as well as a significantly different model for gas cooling, star formation, and feedback from both stars and AGN (see Pillepich et al. 2018 for details of the models in TNG100, Stinson et al. 2010 for the models in MUGS, and Keller et al. 2014, 2015 for the models used in MUGS2). The results we present here strongly suggest the differences between the outer stellar halos in MUGS2, MUGS, and TNG100 are primarily a result of these different feedback models, rather than the numerical resolution or sample size.
Of course, Merritt et al. (2020) is not the first study to examine stellar halos through numerical simulation. Both hydrodynamic and collisionless N-body studies have attempted to trace the origin of the stellar halo in the MW and other galaxies. The earliest attempts to study stellar halos through simulation relied on collisionless N-body simulations (e.g. Bullock & Johnston, 2005; Abadi et al., 2006; Cooper et al., 2010, 2013). While N-body simulations are inexpensive compared to full hydrodynamic runs, they must use particle tagging and semi-analytic models to translate the assembly history of DM subhalos into a star formation history and stellar morphology. Cooper et al. (2013) shows that the outer stellar halo is sensitive to the choice of particle tagging parameters (in particular, the fraction of “most bound” DM particles to tag as forming stars). The additional uncertainties introduced by this process have been studied in Bailin et al. (2014), which suggests they may introduce significant systematics (though Cooper et al. 2017 argue that this effect can be mostly mitigated through more careful selection techniques for particle tagging).
Hydrodynamic simulations of stellar halo formation have used both cosmological zooms, as we have used here, as well as studies of large volumes (as is done in Merritt et al. 2020). Most of these focus on the entire stellar halo, with either kinematic (e.g. Cooper et al., 2015), spatial (e.g. Pillepich et al., 2015), or formation history-based (e.g. Sanderson et al., 2018) cuts to divide the central galaxy from the stellar halo. As we have focused on the outer () stellar halo, and specifically its surface density profile, these studies have delved much deeper into the properties of stellar halos. One of the earliest studies, Zolotov et al. (2009), used five SPH zoom-in simulations of MW-mass galaxies using the same blastwave feedback model as MUGS. Like in the MUGS/MUGS2 galaxies we have studied, Zolotov et al. (2009) found that the in-situ component of the stellar halo was concentrated towards the inner halo, and that the ex-situ fraction of the total stellar halo was between (in contrast to the some of the assumptions made in semi-analytic models such as Bullock & Johnston 2005). Tissera et al. (2012) and Tissera et al. (2013) used six simulated MW zooms from the Aquarius suite to study the chemical properties of halo stars based on their binding energy, connecting this to their formation history. More recently, the latest generation of sub-grid modelling for star formation and feedback has produced zoom-in simulations of MW galaxies with exceptional resolution and agreement with observational scaling relations. Simulations from FIRE (Hopkins et al., 2014; Sanderson et al., 2018), the EAGLE-derived ARTEMIS (Font et al., 2020) and E-MOSAICS projects (Pfeffer et al., 2018; Kruijssen et al., 2019; Hughes et al., 2019; Reina-Campos et al., 2020; Keller et al., 2020a), and the Illustris-derived AURIGA project (Monachesi et al., 2019) have studied the formation history, mass, and metallicity properties of stellar halos. All of these studies have found that accreted stars dominate the stellar halo, especially at larger radii, and those which examine larger populations (Monachesi et al., 2019; Hughes et al., 2019; Sanderson et al., 2018) also find a large diversity in the population of stellar halos of different MW-mass galaxies. The E-MOSAICS results (Hughes et al., 2019; Reina-Campos et al., 2020; Keller et al., 2020a) also include a model for globular cluster (GC) formation and evolution, and use these simulated GCs to study the GC population in stellar halos, and compare them to the populations of field stars in the galactic halo. Future simulations that compare different feedback models will allow us to study the co-evolution of stellar halos and halo GCs in a similar fashion to the comparison we have presented here for the overall stellar halos in MUGS and MUGS2. Large-volume simulations have also been used to study the stellar halos of galaxies spanning a mass range much wider than the narrow MW-mass region we have studied here (Font et al., 2011; Pillepich et al., 2014; Cañas et al., 2020). While the sample size and mass ranges probed by these larger-volume simulations exceed what we have shown here, they all are limited by substantially lower resolution than what is capable in the highest-resolution zoom-in simulations. Studies adopting both approaches will be essential to understand the full diversity of stellar halos and the impact of feedback upon them.
4.3 Limitations & Future Work
The primary limitations of this study are in numerical resolution and sample size. The MUGS and MUGS2 galaxies are cosmological zoom-in simulations with baryonic mass resolution of . While this is better than what is achievable in the largest cosmological volumes, the highest-resolution MW-mass zoom simulations are now achieving resolutions of (e.g. Hopkins et al., 2018a). In the outer stellar halo, this resolution effect can be significant. At the lower surface density limits of surveys like DNGS, , our simulated stellar halos are relatively poorly sampled, with a single star particle sampling a projected area of . Probing low-density areas will always be challenging for both observations and simulations, but higher resolution will help to better sample the lowest-density outskirts of the stellar halo and reduce the sampling noise that may occur in lower-resolution studies. The sample of galaxies we study here is also relatively small, especially compared to the population from Illustris-TNG100 studied in Merritt et al. (2020). Given the diversity of outer stellar halo profiles, this is a significant limitation that can only be overcome by simulating larger volumes. Unfortunately, the observational samples are also limited to small size, and so larger samples of simulated galaxies will not allow us to make full statistical comparisons to observations in the near future.
Our results have shown that, as has been seen in observations (Merritt et al., 2016; Harmsen et al., 2017) and simulations (Merritt et al., 2020), the outer stellar halos of MW-mass galaxies exhibit tremendous diversity in their total masses and surface density profiles. We have limited our analysis to the impact of SN feedback models on the stellar mass profiles of the outer stellar halo, but there remains a great deal of information to be studied in the assembly history of the individual MUGS/MUGS2 galaxies, as well as the metallicity and kinematics of the stellar halo. In a future paper (Khanom et al. in prep), we will examine the differences in the satellite luminosity function of the MUGS and MUGS2 galaxies, as well as the co-evolution of the stellar disk, bulge, and halo in these matched sets of zoom-in simulations. We leave as well study of the metallicity and kinematics of their stellar halos to future work.
4.4 Summary
We have reproduced here the analysis of Merritt et al. (2020) which showed that MW-like galaxies drawn from the Illustris-TNG100 simulations have significantly more massive “stellar halo outskirts” (measured outwards from ) relative to observed galaxies from the DNGS survey. We use two sets (MUGS and MUGS2) of 15 simulated galaxies with identical ICs and simulation code, but with different models for stellar feedback by SNe to examine the sensitivity of simulated stellar halo outskirts to the numerical implementation of stellar feedback.
We find that, even for galaxies with comparable total stellar mass, simulated galaxies from MUGS2 produce outer stellar halos with surface densities dex lower than simulated galaxies from the MUGS suite, in excellent agreement with the DNGS observations. We find that both the MUGS and MUGS2 simulations have stellar halo outskirts with large ex-situ fractions, in agreement with past simulation studies. The difference we find between the MUGS and MUGS2 sample arises primarily from the more effective regulation of star formation by stellar feedback in progenitor galaxies with . These results show that the stellar halo outskirts of massive galaxies are sensitive testbeds for stellar feedback, even when the total stellar mass would be regulated by feedback from AGN.
This work shows that the “missing outskirts” problem identified by Merritt et al. (2020) is sensitive to the details of how stellar feedback is modelled in simulations of MW-like galaxies. If a numerical model for SN feedback is able to efficiently regulate star formation in the progenitors of MW-like galaxies, the surface density profiles of the outer stellar halos observed in DNGS can be reproduced.
With growing observational capabilities and the increasing sophistication of numerical simulations, stellar halo outskirts are a promising new frontier for exploring the impact of galaxy assembly, star formation, and stellar feedback in a cosmological environment.
Acknowledgements
BWK would like to thank Allison Merritt for useful discussions and for providing data from DNGS. BWK would also like to thank James Wadsley, Sebastian Trujillo-Gomez, Diederik Kruijssen, and Tessa Klettl for help editing and proofreading this manuscript. BWK gratefully acknowledges funding from the European Research Council (ERC) under the European Union’s Horizon 2020 research and innovation programme via the ERC Starting Grant MUSTANG (grant agreement number 714907).
Appendix A Robustness to Galaxy Orientation
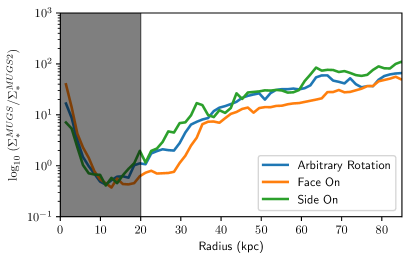
Unfortunately for astrophysicists, galaxies are not spherically symmetrical. The outskirts of a galaxy viewed edge-on will appear much brighter in surface density than one viewed face-on, as we will be looking through a deeper column of stars (of course, this also means that the solid angle covered by the outskirts will be lower, as flux is still conserved). As shown in Elias et al. (2018), this can increase the surface brightness in the outskirts by up to 1.5 magnitudes (an issue also discussed in Merritt et al. 2020). While this will have the most impact in pencil-beam studies aligned along the major and minor axes of the galaxies, it may be of some import here as well. If, for example, the MUGS2 galaxies have more oblate outer stellar halos, orientation will change their observed surface brightness more significantly than for their MUGS equivalent. We have thus repeated the experiment shown by generating mock observed surface density maps for our galaxies rotated to be face-on and edge-on. As we show in Figure 10, the choice of orientation has little impact on the relative effects we study here, altering the relative surface densities in the outer stellar halo by only . Regardless of galaxy orientation, the MUGS galaxies always have times larger surface densities in the outer stellar halo.
References
- Abadi et al. (2006) Abadi, M. G., Navarro, J. F., & Steinmetz, M. 2006, MNRAS, 365, 747, doi: 10.1111/j.1365-2966.2005.09789.x
- Abraham & van Dokkum (2014) Abraham, R. G., & van Dokkum, P. G. 2014, PASP, 126, 55, doi: 10.1086/674875
- Agertz et al. (2007) Agertz, O., Moore, B., Stadel, J., et al. 2007, MNRAS, 380, 963, doi: 10.1111/j.1365-2966.2007.12183.x
- Akins et al. (2021) Akins, H. B., Christensen, C. R., Brooks, A. M., et al. 2021, ApJ, 909, 139, doi: 10.3847/1538-4357/abe2ab
- Bailin et al. (2014) Bailin, J., Bell, E. F., Valluri, M., et al. 2014, ApJ, 783, 95, doi: 10.1088/0004-637X/783/2/95
- Baldry et al. (2012) Baldry, I. K., Driver, S. P., Loveday, J., et al. 2012, MNRAS, 421, 621, doi: 10.1111/j.1365-2966.2012.20340.x
- Behroozi et al. (2013) Behroozi, P. S., Wechsler, R. H., & Conroy, C. 2013, ApJ, 770, 57, doi: 10.1088/0004-637X/770/1/57
- Boylan-Kolchin et al. (2011) Boylan-Kolchin, M., Bullock, J. S., & Kaplinghat, M. 2011, MNRAS, 415, L40, doi: 10.1111/j.1745-3933.2011.01074.x
- Bullock & Johnston (2005) Bullock, J. S., & Johnston, K. V. 2005, ApJ, 635, 931, doi: 10.1086/497422
- Bullock et al. (2000) Bullock, J. S., Kravtsov, A. V., & Weinberg, D. H. 2000, ApJ, 539, 517, doi: 10.1086/309279
- Cañas et al. (2020) Cañas, R., Lagos, C. d. P., Elahi, P. J., et al. 2020, MNRAS, 494, 4314, doi: 10.1093/mnras/staa1027
- Carollo et al. (2010) Carollo, D., Beers, T. C., Chiba, M., et al. 2010, ApJ, 712, 692, doi: 10.1088/0004-637X/712/1/692
- Cooper et al. (2017) Cooper, A. P., Cole, S., Frenk, C. S., Le Bret, T., & Pontzen, A. 2017, MNRAS, 469, 1691, doi: 10.1093/mnras/stx955
- Cooper et al. (2013) Cooper, A. P., D’Souza, R., Kauffmann, G., et al. 2013, MNRAS, 434, 3348, doi: 10.1093/mnras/stt1245
- Cooper et al. (2015) Cooper, A. P., Parry, O. H., Lowing, B., Cole, S., & Frenk, C. 2015, MNRAS, 454, 3185, doi: 10.1093/mnras/stv2057
- Cooper et al. (2010) Cooper, A. P., Cole, S., Frenk, C. S., et al. 2010, MNRAS, 406, 744, doi: 10.1111/j.1365-2966.2010.16740.x
- Cowie & McKee (1977) Cowie, L. L., & McKee, C. F. 1977, ApJ, 211, 135, doi: 10.1086/154911
- Deason et al. (2013) Deason, A. J., Belokurov, V., Evans, N. W., & Johnston, K. V. 2013, ApJ, 763, 113, doi: 10.1088/0004-637X/763/2/113
- D’Souza et al. (2014) D’Souza, R., Kauffman, G., Wang, J., & Vegetti, S. 2014, MNRAS, 443, 1433, doi: 10.1093/mnras/stu1194
- Dubois et al. (2015) Dubois, Y., Volonteri, M., Silk, J., et al. 2015, MNRAS, 452, 1502, doi: 10.1093/mnras/stv1416
- Elias et al. (2018) Elias, L. M., Sales, L. V., Creasey, P., et al. 2018, MNRAS, 479, 4004, doi: 10.1093/mnras/sty1718
- Engler et al. (2021) Engler, C., Pillepich, A., Joshi, G. D., et al. 2021, MNRAS, 500, 3957, doi: 10.1093/mnras/staa3505
- Font et al. (2011) Font, A. S., Benson, A. J., Bower, R. G., et al. 2011, MNRAS, 417, 1260, doi: 10.1111/j.1365-2966.2011.19339.x
- Font et al. (2020) Font, A. S., McCarthy, I. G., Poole-Mckenzie, R., et al. 2020, MNRAS, 498, 1765, doi: 10.1093/mnras/staa2463
- Genel et al. (2019) Genel, S., Bryan, G. L., Springel, V., et al. 2019, ApJ, 871, 21, doi: 10.3847/1538-4357/aaf4bb
- Gnedin (2000) Gnedin, N. Y. 2000, ApJ, 542, 535, doi: 10.1086/317042
- Harmsen et al. (2017) Harmsen, B., Monachesi, A., Bell, E. F., et al. 2017, MNRAS, 466, 1491, doi: 10.1093/mnras/stw2992
- Helmi et al. (1999) Helmi, A., White, S. D. M., de Zeeuw, P. T., & Zhao, H. 1999, Nature, 402, 53, doi: 10.1038/46980
- Hopkins et al. (2014) Hopkins, P. F., Kereš, D., Oñorbe, J., et al. 2014, MNRAS, 445, 581, doi: 10.1093/mnras/stu1738
- Hopkins et al. (2018a) Hopkins, P. F., Wetzel, A., Kereš, D., et al. 2018a, MNRAS, 480, 800, doi: 10.1093/mnras/sty1690
- Hopkins et al. (2018b) —. 2018b, MNRAS, 477, 1578, doi: 10.1093/mnras/sty674
- Horton et al. (2020) Horton, A., Spitler, L., Gee, W., et al. 2020, in Society of Photo-Optical Instrumentation Engineers (SPIE) Conference Series, Vol. 11203, Advances in Optical Astronomical Instrumentation 2019, 1120306, doi: 10.1117/12.2539579
- Hughes et al. (2019) Hughes, M. E., Pfeffer, J., Martig, M., et al. 2019, MNRAS, 482, 2795, doi: 10.1093/mnras/sty2889
- Ibata et al. (2001) Ibata, R., Irwin, M., Lewis, G., Ferguson, A. M. N., & Tanvir, N. 2001, Nature, 412, 49. https://arxiv.org/abs/astro-ph/0107090
- Keller & Kruijssen (2022) Keller, B. W., & Kruijssen, J. M. D. 2022, MNRAS, 512, 199, doi: 10.1093/mnras/stac511
- Keller et al. (2020a) Keller, B. W., Kruijssen, J. M. D., Pfeffer, J., et al. 2020a, MNRAS, 495, 4248, doi: 10.1093/mnras/staa1439
- Keller et al. (2020b) Keller, B. W., Kruijssen, J. M. D., & Wadsley, J. W. 2020b, MNRAS, 493, 2149, doi: 10.1093/mnras/staa380
- Keller et al. (2014) Keller, B. W., Wadsley, J., Benincasa, S. M., & Couchman, H. M. P. 2014, MNRAS, 442, 3013, doi: 10.1093/mnras/stu1058
- Keller et al. (2015) Keller, B. W., Wadsley, J., & Couchman, H. M. P. 2015, MNRAS, 453, 3499, doi: 10.1093/mnras/stv1789
- Keller et al. (2016) —. 2016, MNRAS, 463, 1431, doi: 10.1093/mnras/stw2029
- Keller et al. (2019) Keller, B. W., Wadsley, J. W., Wang, L., & Kruijssen, J. M. D. 2019, MNRAS, 482, 2244, doi: 10.1093/mnras/sty2859
- Kelley et al. (2019) Kelley, T., Bullock, J. S., Garrison-Kimmel, S., et al. 2019, MNRAS, 487, 4409, doi: 10.1093/mnras/stz1553
- Kimm & Cen (2014) Kimm, T., & Cen, R. 2014, ApJ, 788, 121, doi: 10.1088/0004-637X/788/2/121
- Klypin et al. (1999) Klypin, A., Kravtsov, A. V., Valenzuela, O., & Prada, F. 1999, ApJ, 522, 82, doi: 10.1086/307643
- Knollmann & Knebe (2009) Knollmann, S. R., & Knebe, A. 2009, ApJS, 182, 608, doi: 10.1088/0067-0049/182/2/608
- Kruijssen et al. (2019) Kruijssen, J. M. D., Pfeffer, J. L., Crain, R. A., & Bastian, N. 2019, MNRAS, 486, 3134, doi: 10.1093/mnras/stz968
- Merritt et al. (2020) Merritt, A., Pillepich, A., van Dokkum, P., et al. 2020, MNRAS, 495, 4570, doi: 10.1093/mnras/staa1164
- Merritt et al. (2016) Merritt, A., van Dokkum, P., Abraham, R., & Zhang, J. 2016, ApJ, 830, 62, doi: 10.3847/0004-637X/830/2/62
- Mina et al. (2021) Mina, M., Shen, S., Keller, B. W., et al. 2021, A&A, 655, A22, doi: 10.1051/0004-6361/202039420
- Monachesi et al. (2019) Monachesi, A., Gómez, F. A., Grand, R. J. J., et al. 2019, MNRAS, 485, 2589, doi: 10.1093/mnras/stz538
- Nickerson et al. (2013) Nickerson, S., Stinson, G., Couchman, H. M. P., Bailin, J., & Wadsley, J. 2013, MNRAS, 429, 452, doi: 10.1093/mnras/sts348
- Obreja et al. (2019) Obreja, A., Dutton, A. A., Macciò, A. V., et al. 2019, MNRAS, 487, 4424, doi: 10.1093/mnras/stz1563
- Okamoto et al. (2010) Okamoto, T., Frenk, C. S., Jenkins, A., & Theuns, T. 2010, MNRAS, 406, 208, doi: 10.1111/j.1365-2966.2010.16690.x
- Pfeffer et al. (2018) Pfeffer, J., Kruijssen, J. M. D., Crain, R. A., & Bastian, N. 2018, MNRAS, 475, 4309, doi: 10.1093/mnras/stx3124
- Pillepich et al. (2015) Pillepich, A., Madau, P., & Mayer, L. 2015, ApJ, 799, 184, doi: 10.1088/0004-637X/799/2/184
- Pillepich et al. (2014) Pillepich, A., Vogelsberger, M., Deason, A., et al. 2014, MNRAS, 444, 237, doi: 10.1093/mnras/stu1408
- Pillepich et al. (2018) Pillepich, A., Springel, V., Nelson, D., et al. 2018, MNRAS, 473, 4077, doi: 10.1093/mnras/stx2656
- Pontzen et al. (2013) Pontzen, A., Roškar, R., Stinson, G., & Woods, R. 2013, pynbody: N-Body/SPH analysis for python. http://ascl.net/1305.002
- Radburn-Smith et al. (2011) Radburn-Smith, D. J., de Jong, R. S., Seth, A. C., et al. 2011, ApJS, 195, 18, doi: 10.1088/0067-0049/195/2/18
- Reina-Campos et al. (2020) Reina-Campos, M., Hughes, M. E., Kruijssen, J. M. D., et al. 2020, MNRAS, 493, 3422, doi: 10.1093/mnras/staa483
- Saitoh & Makino (2009) Saitoh, T. R., & Makino, J. 2009, ApJ, 697, L99, doi: 10.1088/0004-637X/697/2/L99
- Sanderson et al. (2018) Sanderson, R. E., Garrison-Kimmel, S., Wetzel, A., et al. 2018, ApJ, 869, 12, doi: 10.3847/1538-4357/aaeb33
- Sawala et al. (2016) Sawala, T., Frenk, C. S., Fattahi, A., et al. 2016, MNRAS, 457, 1931, doi: 10.1093/mnras/stw145
- Searle & Zinn (1978) Searle, L., & Zinn, R. 1978, ApJ, 225, 357, doi: 10.1086/156499
- Shen et al. (2003) Shen, S., Mo, H. J., White, S. D. M., et al. 2003, MNRAS, 343, 978, doi: 10.1046/j.1365-8711.2003.06740.x
- Spergel et al. (2007) Spergel, D. N., Bean, R., Doré, O., et al. 2007, ApJS, 170, 377, doi: 10.1086/513700
- Springel & Hernquist (2003) Springel, V., & Hernquist, L. 2003, MNRAS, 339, 289, doi: 10.1046/j.1365-8711.2003.06206.x
- Stinson et al. (2006) Stinson, G., Seth, A., Katz, N., et al. 2006, MNRAS, 373, 1074, doi: 10.1111/j.1365-2966.2006.11097.x
- Stinson et al. (2010) Stinson, G. S., Bailin, J., Couchman, H., et al. 2010, MNRAS, 408, 812, doi: 10.1111/j.1365-2966.2010.17187.x
- Thomas et al. (2021) Thomas, G. F., Martin, N. F., Fattahi, A., et al. 2021, ApJ, 910, 92, doi: 10.3847/1538-4357/abdfd2
- Tissera et al. (2013) Tissera, P. B., Scannapieco, C., Beers, T. C., & Carollo, D. 2013, MNRAS, 432, 3391, doi: 10.1093/mnras/stt691
- Tissera et al. (2012) Tissera, P. B., White, S. D. M., & Scannapieco, C. 2012, MNRAS, 420, 255, doi: 10.1111/j.1365-2966.2011.20028.x
- van Dokkum et al. (2018) van Dokkum, P., Danieli, S., Cohen, Y., et al. 2018, Nature, 555, 629, doi: 10.1038/nature25767
- van Dokkum et al. (2015) van Dokkum, P. G., Abraham, R., Merritt, A., et al. 2015, ApJ, 798, L45, doi: 10.1088/2041-8205/798/2/L45
- Wadsley et al. (2017) Wadsley, J. W., Keller, B. W., & Quinn, T. R. 2017, MNRAS, 471, 2357, doi: 10.1093/mnras/stx1643
- Wadsley et al. (2008) Wadsley, J. W., Veeravalli, G., & Couchman, H. M. P. 2008, MNRAS, 387, 427, doi: 10.1111/j.1365-2966.2008.13260.x
- Wang et al. (2019) Wang, W., Han, J., Sonnenfeld, A., et al. 2019, MNRAS, 487, 1580, doi: 10.1093/mnras/stz1339
- Yanny et al. (2003) Yanny, B., Newberg, H. J., Grebel, E. K., et al. 2003, ApJ, 588, 824, doi: 10.1086/374220
- Zolotov et al. (2009) Zolotov, A., Willman, B., Brooks, A. M., et al. 2009, ApJ, 702, 1058, doi: 10.1088/0004-637X/702/2/1058