The Inner Accretion Flow in the Resurgent Seyfert-1.2 AGN Mrk 817
Abstract
Accretion disks and coronae around massive black holes have been studied extensively, and they are known to be coupled. Over a period of 30 years, however, the X-ray (coronal) flux of Mrk 817 increased by a factor of 40 while its UV (disk) flux remained relatively steady. Recent high-cadence monitoring finds that the X-ray and UV continua in Mrk 817 are also decoupled on time scales of weeks and months. These findings could require mechanical beaming of the innermost accretion flow, and/or an absorber that shields the disk and/or broad line region (BLR) from the X-ray corona. Herein, we report on a 135 ks observation of Mrk 817 obtained with NuSTAR, complemented by simultaneous X-ray coverage via the Neil Gehrels Swift Observatory. The X-ray data strongly prefer a standard relativistic disk reflection model over plausible alternatives. Comparable fits with related models constrain the spin to lie in the range , and the viewing angle to lie between (including statistical errors and small systematic errors related to differences between the models). The spectra also reveal strong evidence of moderately ionized absorption, similar to but likely less extreme than obscuring events in NGC 5548 and NGC 3783. Archival Swift data suggest that the absorption may be variable. Particularly if the column density of this absorber is higher along the plane of the disk, it may intermittently mask or prevent coupling between the central engine, disk, and BLR in Mrk 817.
1. Introduction
Extreme examples of variability in active galactic nuclei (AGN) are increasingly common, thanks to ground-based monitoring and soft and hard X-ray monitoring with Swift (e.g., Frederick et al. 2020, Kaastra et al. 2014). This poses some problems, but also some opportunities. A growing number of AGN are classified as “changing-look” AGN, for instance, and it is important to understand whether these cases represent sudden geometric changes or evolution that is consistent with state transitions in stellar-mass black holes (e.g., Yang et al. 2018). Separately, it is important but difficult to distinguish flares due to regular accretion processes from genuine tidal disruption events (TDEs; see, e.g., Trakhtenbrot et al. 2019, van Velzen et al. 2021). Sources that have undergone an extreme evolution over relatively long time scales, and/or sources that may still exhibit transitional geometrical phases, may offer key insights into those that change rapidly.
Markarian 817 is a nearby Seyfert galaxy (; Strauss & Huchra 1988). Recent work suggests that it should be classified as a Seyfert 1.2 (e.g., Koss et al. 2017). The active nucleus sits within a barred spiral that is seen close to face-on, not atypical of optically selected unobscured Seyferts (e.g., McLeod & Rieke 1995, Knapen et al. 2000). Hubble images show evidence of dust along the bar (Pogge & Martini 2002). The mass of the central black hole in Mrk 817 has been determined using optical reverberation mapping: (Peterson et al. 2004).
Winter et al. (2011) showed that the X-ray flux of Mrk 817 grew by a factor of 40 between 1990 and 2011; however, the UV flux of the source varied by only 2.3 over the same period. This result is difficult to explain in terms of standard disk and corona models, since the disk (seen in UV) is expected to seed a Comptonizing corona (seen in X-rays). Recent monitoring with the Neil Gehrels Swift Observatory confirms and extends this result: the X-ray and UV continuum fluxes are also uncorrelated on time scales of just weeks and days (Morales et al. 2019).
To better understand Mrk 817, it may be instructive to consider broad absorption line quasars (BALQSOs). The force multiplier effects that enable radiation pressure on lines to expel gas at very high speeds are only possible if the gas does not become too highly ionized (e.g., Proga 2003). It now appears that this class is comprised of some cases wherein the intrinsic X-ray flux is extremely low, and other cases wherein the UV flow is shielded from the X-ray corona (Luo et al. 2013, 2014; also see Baskin et al. 2014). In the case of Mrk 817, the corona is no longer faint, but scattering or a shielding geometry may be a plausible means of decoupling the UV and X-ray flux.
Relativistic reflection is often employed to measure black hole spin, but it is also a powerful probe of the innermost accretion flow geometry. In Swift J164457, for instance, a broad but blue-shifted Fe K line likely signals reflection from an outflowing funnel, defined by a thick hyper-Eddington accretion disk (Kara et al. 2016). In less extreme cases, the emissivity profile can indicate whether the corona is point-like or extended (see, e.g., Wilkins & Fabian 2012). Alternatively, if a wind from the inner disk is responsible for dampening feedback between the corona and disk, this may be detected in X-ray absorption.
The NuSTAR observatory (Harrison et al. 2013) has proved to be an extremely effective means of studying both relativistic reflection (Miller et al. 2013a,b; Tomsick et al. 2014, Walton et al. 2014, Zoghbi et al. 2015) and X-ray winds (e.g., King et al. 2014, Nardini et al. 2015). With the goal of understanding the innermost accretion flow in Mrk 817, we obtained a deep observation of Mrk 817 with NuSTAR, complemented by a simultaneous Swift snapshot. Owing to the fact that Mrk 817 was much fainter than other Seyferts in the formative years of X-ray astronomy, our NuSTAR observation represents the first deep exposure of this source with a modern X-ray telescope. The following section details the observations and how the data were reduced. The analysis and results are presented in Section 3. We discuss our results in Section 4.
2. Observations and Data Reduction
The long NuSTAR observation of Mrk 817 started on 18 December 2020, at 04:56:09 UTC (observation 60601007002). The contemporaneous Swift snapshot observation started on 19 December 2020, at 00:46:15 UTC (observation 0008904001). The observations were reduced using the tools in HEASOFT version 28, and the latest corresponding CALDB files as of 4 January 2021.
NuSTAR data products were built from the cleaned FPMA and FPMB event files, using the nuproducts routine. Source events were extracted from circular regions with radii of 120 arc seconds, centered on the source position. Background regions of equivalent size were selected away from the source. After filtering, the net exposure time was 134.7 ks and the average count rate is 0.74 c/s (FPMA and FPMB combined).
Swift XRT products were built from the “photon counting” mode data, owing to the modest flux from Mrk 817. Source events were extracted from a circular region with a radius of 30 pixels, centered on the source; background events were extracted from an equivalent region away from the source. After filtering, the net exposure time is 2.12 ks, and the average count rate is 0.095 c/s.
3. Analysis & Results
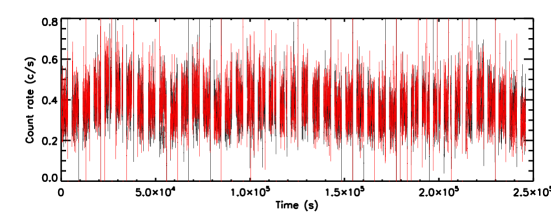
The NuSTAR light curves of Mrk 817 show the variable “flickering” behavior that is typical of Seyferts. There are no strong flares, dips, or overall trends in the data; this is consistent with expectations for a fairly massive black hole not undergoing hyper-Eddington accretion (see Figure 1). We therefore analyzed the time-averaged spectra from the observations. Low-energy differences between the FPMA and FPMB (Madsen et al. 2020) have been resolved in recent CALDB releases, so we combined the time-averaged FPMA and FPMB spectra and responses using the tools addascaspec and addrmf.
The spectra from NuSTAR and Swift have very different levels of sensitivity, and require different binning methods in order to achieve an optimal balance between continuum and line sensitivity. After experimenting with various schemes, we elected to bin the combined NuSTAR spectrum to a minimum signal-to-noise ratio of 20 using the tool ftgrouppha (based on the work of Kaastra & Bleeker 2016). The Swift/XRT spectrum only contains 200 counts, so we simply grouped to require a minimum of 10 counts per bin (following Cash 1979) using the tool grppha. Initial fits with simple power-law models determined that the source is likely only detected out to 50 keV; the NuSTAR spectrum was then fit over the 3–50 keV band. The Swift/XRT spectrum is insensitive above 7 keV, so it was fit over the 0.3–7.0 keV band. The fits minimized the statistic and the F-test was used to evaluate improvements between nested models.
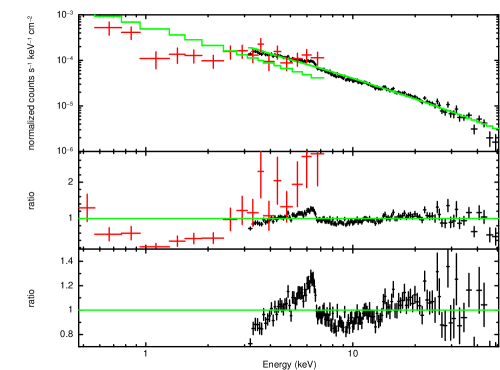
Figure 2 shows the spectra and data/model ratios obtained when the data are jointly fit with a simple power-law model over the full band, allowing the flux normalizations to vary. The resulting fit is unacceptable: for degrees of freedom (). The ratios show strong evidence of a relativistic Fe K emission line and disk reflection, as well as evidence of low-energy absorption. We therefore proceeded to model the spectra in terms of relativistically blurred disk reflection, modified by absorption that may be intrinsic to a disk wind or more distant absorber.
To fit the reflection spectrum, we used relxillD, a variation of the relxill model that allows the density of the disk to vary (e.g., Garcia et al. 2014, Dauser et al. 2016). The key parameters of this model include the inner and outer emissivity indices and the corresponding break radius (with a sign convention given by ), the dimensionless spin of the black hole (), the inclination at which the disk is viewed, the inner and outer radii of the reflector, the systemic redshift, the power-law index of the illuminating spectrum, the log of the ionization parameter of the disk (), the abundance of Fe relative to solar, the log of the number density of the disk, the “reflection fraction” (the relative importance of the reflection and continuum), and the flux normalization of the component. The high-energy cut-off in this model is fixed at keV.
Broadly following theoretical work (Wilkins & Fabian 2012), we constrained the inner emissivity to lie in the range , the outer emissivity to lie in the range , and the break radius to lie within (in units of ). The spin and inclination were allowed to vary freely. The inner disk radius was initially fixed at the innermost stable circular orbit. The outer disk radius was fixed at the maximum value allowed by the model (). The power-law index, ionization, Fe abundance, reflection fraction, and flux normalization were all permitted to vary freely. The reflector density was initially fixed at , the same value assumed in the default version of relxill and the related xillver model.
To model the low-energy absorption, we employed zxipcf (Reeves et al. 2008). This is an absorption model based on executions of XSTAR (e.g., Kallman et al. 2009), which is also the basis of relxill. The key parameters of this component are the absorber column density (), the log of the ionization parameter (), and the velocity shift of the absorber. The maximum allowed redshift was set to that of the host galaxy, but was allowed to vary freely in the other direction (corresponding to outflows in the frame of the host).
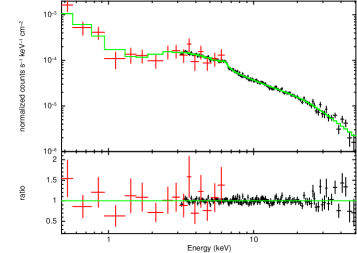
This model achieves an excellent fit to the spectrum, . This is sufficiently close to unity that it strongly implies that no additional model complexity is justified. The measured X-ray flux in the 0.3–50 keV band is ( errors are quoted throughout this work), implying an X-ray luminosity of . Assuming a bolometric correction of (Vasudevan et al. 2009), this translates to , or an Eddington fraction of .
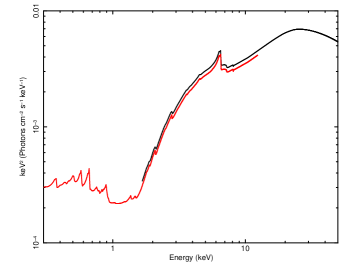
Table 1 lists the results of fits with this model. The fit is shown in Figure 3, alongside the underlying model. The emissivity parameters are fairly standard, and commensurate with expectations if the corona is central and compact, and if the black hole has at least a moderate spin (e.g., Wilkins & Fabian 2012). The spin parameter is measured to be . The upper limit on the spin includes , so maximal spin is not excluded. However, a spin of lies beyond the level of confidence. The inclination of the innermost disk is measured to be very low, degrees. At , the power-law index is within the range observed in samples of Seyferts (Nandra et al. 2007). The Fe abundance is found to be elevated, but it is not strongly constrained, and this inference could be related to the density assumed in the model (see, e.g., Jiang et al. 2019). The reflection fraction is also found to have a standard value, again pointing to a typical innermost accretion flow geometry.
When the spectra are instead fit assuming a reflector density of , the fit statistic is slightly worse (), but it becomes progressively worse at higher densities. In none of these cases does the best-fit iron abundance drop below , however, suggesting that the fit is more sensitive to the abundance than the density. A conservative characterization of our results is that the reflector density is in the range, and the Fe abundance is slightly but not dramatically elevated relative to solar values.
When the relxillD model is replaced with relxilllp, which explicitly assumes a point-like emitter and lamp-post geometry, with prescribed reflection fractions, an inferior fit is achieved (). However, consistent values are measured for the spin of the black hole and the inclination at which the inner disk is viewed (, deg.). The height of the lamp-post is measured to be . Unlike the tests described above, this model is not nested, and it is not clear that the F-statistic is appropriate. However, using the F-test, the relxillD model is only preferred at the 3.8 level of confidence. This could be regarded as tentative evidence that the corona is not an idealized lamp-post, but still compact. We note that it is nominally possible to fit for the cut-off energy with relxilllp, but the data are unable to constrain this parameter well, so we fit with keV fixed.
To evaluate the level at which relativistic reflection is required over distant reflection (from the BLR and/or torus), we replaced the relxill with its basis model, xillver. The parameters of this model are the same as relxill, but it lacks the spin and emissivity parameters that define relativistic blurring. Allowing all of the reflection and absorber parameters to vary, a very poor fit is obtained: . Again, this model is not nested and the F-test is not necessarily appropriate, but the difference in is enormous, indicating that relativistic blurring is required at far more than the level of confidence.
The ionized absorber is strongly required by the spectra, but its parameters are not well constrained; this is unsurprising given the low resolution of the data. Although the fit returns a very high outflow velocity consistent with an “ultra-fast outflow” or UFO (; see, e.g., Tombesi et al. 2010), zero velocity shift is within the 90% confidence errors. Moreover, it is very unlikely that the resolution and sensitivity of the spectra could reliably determine the velocity shift. A conservative interpretation is that the data allow for a UFO, but are consistent with a standard low-velocity absorber.
The significance at which the absorber is required can be evaluated in two ways. First, dividing the best-fit column density by the error suggests a significance of . Second, setting the column density to the minimum allowed by the model () and re-fitting gives for , which is far more than the level of confidence as determined by the F-test.
Significant low-energy absorption was not reported in the XMM-Newton
snapshot observation of Mrk 817 (Winter et al. 2011), nor in the
Swift monitoring exposures (Morales et al. 2019). We therefore
examined various means by which absorption could be falsely implied:
Cross calibration uncertainties between NuSTAR and
Swift could potentially skew the fitting results. However, the
normalization of the relxill component in the Swift/XRT
spectrum is only 7% lower than the NuSTAR spectrum in our model.
Moreover, if the normalizations are instead linked, absorption is even
more strongly required in the fit.
Photon pile-up in CCD detectors leads to artificially hard continua (Davis 2001). To assess whether or not this effect could have created a mismatch in the instrumental continua that falsely implies absorption, we re-reduced the Swift/XRT data accepting only “grade=0” events (single pixel strikes, typically free of pile-up). This spectrum shows no clear differences relative to the standard spectrum. It is therefore unlikely that spectral hardening distortions due to pile-up have artificially created a break in the spectrum that can be fit as absorption.
It is possible that a flux deficit is artificially created by failing to fit the continuum properly at low energy (note that Winter et al. 2011 included a blackbody when modeling the XMM-Newton snapshot observation). We therefore added a disk blackbody component to our model ( keV). A component of this kind is not required by the data, either alone or in combination with the absorber, and it does not serve to diminish the statistical requirement for an absorber.
Instrumental and modeling issues do not appear to create a false signature of absorption in the spectra, so we next examined whether or not prior snapshot observations simply lacked the sensitivity needed to detect significant absorption. We used the Leicester Swift/XRT spectra generator (Evans et al. 2009) to create a summed spectrum of Mrk 817 from all observations taken throughout the mission, with a total exposure of 213.4 ks. Binning to require S/N = 10 and using the same model, a good fit is again achieved when the absorber is included (). The best-fit column density is measured to be . The covering factor is measured to be . When the column density is set to the model minimum (and/or when the covering factor is set to zero), the fit statistic is markedly higher ().
The column and covering factor measured in the summed Swift/XRT monitoring spectrum are lower than measured in the new deep NuSTAR and Swift/XRT snapshot spectra (see Table 2). This indicates that the absorption is likely variable and diluted when measured in the summed monitoring data. These summed Swift/XRT spectrum also permits no determination regarding a velocity shift; however, its variable nature is consistent with the expected properties of a clumpy outflow.
The absorber is most evident in the Swift/XRT band (see Figure 3), but it has an effect even when the NuSTAR spectrum is considered alone. When the absorber column density is set to its minimum and/or when the covering factor is set to zero, the fit is rejected at the level of confidence (, relative to with absorption included). The result is equivalent when the FPMA and FPMB spectra are examined separately, verifying that absorption is not implied owing to a calibration mismatch between the FPMA and FPMB.
As noted by Reynolds et al. (2012), zxipcf samples the gas ionization very coarsely (12 steps over nine orders of magnitude). The data that we have examined lacks the sensitivity and resolution needed to detect individual lines that would permit tight constraints on the ionization parameter of the absorber; however, we checked our results using the warmabs model. This is a publicly available, very high resolution model with tremendous flexibility, also based on XSTAR (see, e.g., Kallman et al. 2014, Miller et al. 2020). To reproduce the partial covering parameter in zxipcf, we constructed the model in the following manner: (where the relxillD parameters are fully linked, and and are constants such that ).
We find that broadly comparable fits () to the NuSTAR and Swift snapshot spectra are obtained using this model, and that the absorption is required as strongly as before. Similar values are found for black hole spin (), inclination ( degrees), and emissivity, with overlapping confidence intervals. This model suggests that the column density could be slightly lower () and that the absorber may be more highly ionized (log); these values are not strongly excluded by the prior model. As before, this alternative model only weakly prefers a high outflow velocity; it also prefers rms velocities as high as . The fit statistic quoted here is for a fit wherein the iron abundance was linked in the absorption and reflection models, finding a value consistent with unity. This suggests that indications of enhanced abundances are likely not robust.
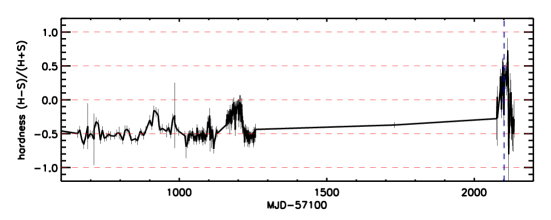
As a final check, we constructed an X-ray hardness curve, using all prior observations of Mrk 817 obtained by Swift. We defined the soft band as 0.3–2.0 keV, the hard band as 2.0–10.0 keV, and the hardness as HS/HS. We used the counts in these bands rather than the flux, in order to avoid any dependence on models. Neutral and low-ionization absorption affects the low energy band, so intervals of enhanced obscuration are marked by heightened hardness. Figure 4 shows that Mrk 817 has recently displayed an unprecedented level of spectral hardness, fully consistent with the enhanced obscuration implied by our spectral fits. These findings echo what may be implicit evidence of strong, variable absorption based on changes in the photon power-law index. Winter et al. (2011) report changes of over a period of years; such variations are more easily understood in terms of a standard corona if aided by variable absorption.
We note that a search for X-ray reverberation from the inner disk finds no clear signal. At least in part, this is likely the result of insufficient sensitivity: the fractional variability () and total counts obtained in the 3–10 keV band () in our NuSTAR exposure are below the values typical of observations wherein reverberation is detected (see, e.g., Figure 1 in Kara et al. 2016). However, if Mrk 817 truly lacks a relativistic reflection signature in the Fe K band of its lag spectrum, it is not unique. The time-averaged spectra of other sources, such as MCG-6-30-15, appear to require relativistic disk reflection but lack the expected signal in the Fe K band of their lag spectra (e.g. Kara et al. 2016b). It is possible that outflows from the innermost disk serve to mute reverberation signatures in the same way that outflows from larger radii wash out reverberation there.
4. Discussion
We have analyzed the first deep X-ray observation of Mrk 817 made with a modern X-ray telescope. The high sensitivity achieved with NuSTAR, in combination with the extended pass band afforded by Swift, reveals that the innermost accretion flow is consistent with a standard compact hard X-ray corona and flat inner accretion disk. This is indicated by the fact that excellent fits to the broadband spectrum are achieved using relativistic disk reflection. Absorption is strongly required in both the NuSTAR spectrum alone and in joint fits. In examining the summed spectrum obtained over years of prior Swift monitoring, there is also evidence of low-energy absorption, but at a reduced level. This likely indicates a variable outflow; this may be the mechanism by which the UV and X-ray flux in Mrk 817 are sometimes decoupled. In this section, we examine these results in more detail and place them into a broader context.
There is no indication of a funneled accretion flow or a corona with unusual properties in Mrk 817. The reflection spectrum is typical; none of the measured model parameters are extreme. A funneled, outflowing inner geometry like that implied in Swift J164457 (e.g., Kara et al. 2016) and some weak emission-line quasars (e.g., Luo et al. 2015) is ruled out. This is unsurprising given that Mrk 817 is sub-Eddington (our best fit model implies with a standard bolometric correction) whereas Swift J164457 was likely in a super- or hyper-Eddington phase when reflection was observed. A corona with emission that is primarily beamed away from the disk is likely disfavored by the reflection fraction; a value well below unity is expected if the corona is beamed away from the disk (Beloborodov 1999, Markoff & Nowak 2005; Miller et al. 2012). For these reasons, it is unlikely that the structure of the disk and corona can account for decoupled UV and X-ray fluxes in Mrk 817.
It is more likely that the absorption found in our spectral fits interferes with disk–coronal coupling in Mrk 817. Even in the sources where reverberation from the optical BLR is best established, there are periods wherein the link is broken. In NGC 5548, for instance, Kaastra et al. (2014) discovered and studied a transient obscuration event (also see Dehghanian et al. 2019). That obscuration lasted for years, and was likely caused by a clumpy gas stream that temporarily intersected our line of sight. The novel obscurer in NGC 5548 had column densities of and low ionization parameters (, and , for each component). Soon thereafter, Mehdipour et al. (2017) reported a variable X-ray and UV obscuring wind in NGC 3783, consistent with clumps at the base of the optical BLR. The two components in the obscuration partially cover the source, have column densities of , and modest ionization parameters (). Unlike the case of NGC 5548, the obscuration in NGC 3783 was observed to last only a month, suggestive of a passing cloud in this source.
At least in terms of its column density and moderate ionization, the low-energy X-ray absorption that we have tentatively discovered in Mrk 817 is similar to the variable obscuring events found in other AGN. The fact that more modest obscuration is required in fits to the summed spectrum from long-term Swift monitoring suggests that the absorption is transient, which is again similar to NGC 5548 and NGC 3783. It is reasonable to speculate, then, that the absorption in Mrk 817 is an outflow and potentially tied to the BLR.
This appears to be confirmed by a simple examination of the gas properties. Taking our estimate of the bolometric luminosity, , and assuming a plausible BLR cloud density of (e.g., Gallo et al. 2021), the ionization parameter formalism () implies the obscuration in Mrk 817 is located at , or . This is fully consistent with the BLR. The filling factor can then be stimated via and our results imply . Low volume filling factors are frequently inferred for the BLR (e.g. Osterbrock 1991, Sneddon & Gaskell 1999), and this is fundamental to the success of reverberation mapping (e.g., Goad et al. 2016).
Disk winds tend to be denser close to the plane of the disk, if only because acceleration causes the gas density to fall. We measured a column density of , for a reflection-derived inclination of degrees. An even higher density along the disk would be even more effective at scattering or shielding interactions between the corona and disk or BLR. During intervals of low obscuration, it may be easier to see the response of the BLR to the central engine, facilitating reverberation measurements and black hole mass constraints. In other intervals, the variable obscuration may serve to screen the disk and/or BLR from the central engine, leading to a decouping of the UV and X-ray flux in Mrk 817.
Although our alternative model gives spin constraints that overlap with our baseline model, it is best to combine the constraints on the spin, and regard as a confidence interval that includes both statistical errors and small systematic errors between related models. If the spin of the black hole in Mrk 817 is indeed moderate, it is consistent with emerging trends for a relatively high black hole mass (; Peterson et al. 2004). Observations tentatively indicate that low-mass Seyferts may generally have high spin values, while higher-mass Seyferts display a broader range of spins, perhaps trending to lower values above (e.g., Reynolds 2021). This tentative finding follows the expectation that spin is more easily changed through accretion when the black hole mass is lower, and that higher black hole masses may be partly influenced by black hole mergers that can drive spins to lower values (see, e.g., Berti & Volonteri 2008, Fiacconi et al. 2018).
We have not detected a reverberation lag in Mrk 817 using NuSTAR. However, a long program with XMM-Newton, or a coordinated program with XMM-Newton and NuSTAR may succeed, particularly if a bright phase of the state is targeted using a monitoring program. In the future, observations with XRISM (Tashiro et al. 2020) and Athena (e.g., Barret et al. 2018, Meidinger et al. 2020) may be able to study reverberation lag spectra in Mrk 817 and a large number of similar sources.
We acknowledge the anonymous referee for several helpful comments that improved this paper. We thank the NuSTAR director, Fiona Harrison, and its lead mission planner, Karl Forster, for executing this observation. Similarly, we thank Brad Cenko and the Swift team for making a supporting snapshot exposure. EK acknowledges financial support from the Centre National d’Etudes Spatiales (CNES). JMM acknowledges helpful discussions with Jeremy Chen and Richard Mushotzky. This work made use of data from NuSTAR, a project led by the California Institute of Technology, managed by the Jet Propulsion Laboratory, and funded by NASA.
References
- (1)
- (2) Arnaud, K., 1996, in ASP Conf. Ser. 101, Astronomical Data Analysis Software Systems V, ed. G. H. Jacoby & J. Barnes (San Francisco, CA: ASP), 17
- (3)
- (4) Barret, D., Lam Trong, T., den Herder, J.-W., Piro, L., Cappi, M., 2018, SPIE, 10699, 1
- (5)
- (6) Baskin, A., Laor, A., & Stern, J., 2014, MNRAS, 445, 3025
- (7)
- (8) Beloborodov, A. M., 1999, ApJ, 510, L123
- (9)
- (10) Berti, E., & Volonteri, M., 2008, ApJ, 684, 822
- (11)
- (12) Cash, W., 1979, ApJ, 228, 939
- (13)
- (14) Dauser, T., Garcia, J., Walton, D. J., Eikmann, W., Kallman, T., McClintock, J., Wilms, J., 2016, A&A, 590, 76
- (15)
- (16) Davis, J., 2001, ApJ, 562, 575
- (17)
- (18) Dehghanian, M., Ferland, G. J., Peterson, B., M., Kriss, G. A., Korista, K. T., et al., 2019, ApJ, 882, L30
- (19)
- (20) Evans, P. A., Beardmore, A. P., Page, K. L., Osborne, P. T., Willingale, R., et al., 2009, MNRAS, 397, 1177
- (21)
- (22) Fiacconi, D., Sijacki, D., Pringle, J. E., 2018, MNRAS, 477, 3807
- (23)
- (24) Frederick, S., Gezari, S., Graham, M. J., Sollerman, J., van Velzen, S., et al., 2021, ApJ, subm., arxiv:2010:08554
- (25)
- (26) Gallo, L., Gonzalez, A. G., & Miller, J. M., 2021, ApJ, in press, arxiv: 2101.05433
- (27)
- (28) Garcia, J., Dauser, T., Lohfink, A., Kallman, T., Steiner, J., McClintock, J., Brenneman, L., Wilms, J., Eikmann, W., Reynolds, C., Tombesi, F., 2014, ApJ, 782, 76
- (29)
- (30) Goad, M., Korista, K. T., De Rosa, G., Kriss, G. A., Edelson, R., et al., 2016, ApJ, 824, 11
- (31)
- (32) Harrison, F. A., Craig, W. W., Christensen, F. E., Hailey, C. J., Zhang, W., et al., 2013, ApJ, 770, 103
- (33)
- (34) Jiang, J., Fabian, A., Dauser, T., Gallo, L., Garcia, J., et al., 2019, MNRAS, 489, 3436
- (35)
- (36) Kaastra, J. S., & Bleeker, J. A. M., 2016, A&A, 587, 151
- (37)
- (38) Kaastra, J. S., Kriss, G. A., Cappi, M., Mehdipour, M., Petrucci, P.-O., et al., 2014, Science, 345, 64
- (39)
- (40) Kallman, T. R., Bautista, M. A., Gorely, S., Mendoza, C., Miller, J. M., Palmeri, P., Quinet, P., Raymond, J., 2009, ApJ, 701, 865
- (41)
- (42) Kallman, T., R., Evans, D. A., Marshall, H., Canizares, C., Longinotti, A., Nowak, M. A., Schulz, N., 2014, ApJ, 780, 121
- (43)
- (44) Kara, E., Alston, W. N., Fabian, A. C., Cackett, E. M., Uttley, P., Reynolds, C. S., Zoghbi, A., 2016, MNRAS, 462, 511
- (45)
- (46) Kara, E., Miller, J. M., Reynolds, C. S., Dai, L., 2016, Nature, 535, 388
- (47)
- (48) Kara, E., Miller, J. M.,
- (49)
- (50) King, A. L., Walton, D. J., Miller, J. M., Didier, B., Boggs, S., et al., 2014, ApJ, 784, L2
- (51)
- (52) Knapen, J. H., Schlosman, I., & Peletier, R. F., 2000, ApJ, 529, 93
- (53)
- (54) Koss, M., Trakhtenbrot, B., Ricci, C., Lamperti, I., Oh, K., et al., 2017, ApJ, 850, 74
- (55)
- (56) Luo, B., Brandt, W. N., Alexander, D. M., Harrison, F. A., Stern, D., et al., 2013, ApJ, 772, 153
- (57)
- (58) Luo, B., Brandt, W. N., Alexander, F. A., Stern, D., Teng, S. H., et al., 2014, ApJ, 794, 70
- (59)
- (60) Luo, B., Brandt, W. N., Hall, P. B., Wu, J., Anderson, S. F., et al., 2015, ApJ, 805, 122
- (61)
- (62) Madsen, K., Grefenstette, B. W., Pike, S., Miyasaka, H., Brightman, M., Forster, K., Harrison, F. A., 2020, arxiv:2005.00569
- (63)
- (64) Markoff, S., & Nowak, M., 2004, ApJ, 609, 972
- (65)
- (66) Markoff, S., Nowak, M., & Wilms, J., 2005, ApJ, 635, 1203
- (67)
- (68) McLeod, K. K., & Rieke, G. H., 1995, ApJ, 441, 96
- (69)
- (70) Mehdipour, M., Kaastra, J. S., Kriss, G. A., Arav, N., Behar, E., et al., 2017, A&A, 607, 28
- (71)
- (72) Meidinger, R., Albrecht, S., Beitler, C., Bonholzer, M., Emberger, V., Frank, J., et al., 2020, SPIC, 11444, 0
- (73)
- (74) Miller, J. M., Pooley, G. G., Fabian, A. C., Nowak, M. A., Reis, R., C., Cackett, E. M., Pottschmidt, K., & Wilms, J., 2012, ApJ, 757, 11
- (75)
- (76) Miller, J. M., Parker, M. L., Fuerst, F., Bachetti, M., Barret, D., et al., 2013, ApJ, 779, L2
- (77)
- (78) Miller, J. M., Parker, M. L., Fuerst, F., Bachetti, M., Harrison, F. A., et al., 2013, ApJ, 775, L45
- (79)
- (80) Miller, J. M., Zoghbi, A., Raymond, J., Balakrishnan, M., Brenneman, L., et al., 2020, ApJ, 904, 30
- (81)
- (82) Morales, A., Miller, J. M., Cackett, E., Reynolds, M., Zoghbi, A., 2019, ApJ, 870, 54
- (83)
- (84) Nandra, K., O’Neill, P. M., George, I. M., Reeves, J., 2007, MNRAS, 382, 194
- (85)
- (86) Nardini, E., Reeves, J. N., Gofford, J., Harrison, F. A., Risaliti, G., et al., 2015, Science, 347, 860
- (87)
- (88) Osterbrock, D. E., 1991, Reports on Physics, 54, 579
- (89)
- (90) Peterson, B., Ferrarese, L., Gilbert, K. M., Kaspi, S., Malkan, M. A., et al., 2004, ApJ, 613, 682
- (91)
- (92) Pogge, R. W., & Martini, P., 2002, ApJ, 569, 624
- (93)
- (94) Proga, D., 2003, ApJ, 585, 406
- (95)
- (96) Reeves, J., Done, C., Pounds, K., Terashima, Y., Hayashida, K., 2008, MNRAS, 385, L108
- (97)
- (98) Reynolds, C., 2021, ARA&A, in press, arxiv:2011.08948
- (99)
- (100) Reynolds, C., Brenneman, L., Lohfink, A., Trippem, M., Miller, J. M., Fabian, A. C., Nowak, M. A., 2012, ApJ, 755, 88
- (101)
- (102) Snedden, S. A., & Gaskell, M., 1999, ApJ, 521, L91
- (103)
- (104) Strauss, M. A., & Huchra, J., 1988, AJ, 95, 1602
- (105)
- (106) Tashiro, M., Maejima, H., Toda, K., Kelley, R., Reichnthal, L., 2020, SPIE, 11444, 22
- (107)
- (108) Tombesi, F., Cappi, M., Reeves, J. N., Palumbo, G. G., Yaqoob, T., Braito, V., Dadina, M., 2010, A&A, 521, 57
- (109)
- (110) Tomsick, J. A., Nowak, M. A., Parker, M. L., Miller, J. M., et al., 2014, ApJ, 780, 78
- (111)
- (112) Trakhtenbrot, B., Arcavi, I., Ricci, C., Tachella, S., Stern, D., et al., 2019, Nature Astronomy, 3, 242
- (113)
- (114) van Velzen, S., Gezari, S., Hammerstein, E., Roth, N., Frederick, S., et al., 2021, ApJ, submitted, arxiv:2001.01409
- (115)
- (116) Vasudevan, R. V., Mushotzky, R. F., Winter, L. M., Fabian, A. C., 2009, MNRAS, 399, 1553
- (117)
- (118) Walton, D. J, Risaliti, G., Harrison, F. A., Fabian, A. C., Miller, J. M., et al., 2014, ApJ, 799, 76
- (119)
- (120) Wilkins, D., & Fabian, A. C., 2012, MNRAS, 424, 1284
- (121)
- (122) Winter, L. M., Danforth, C., Vasudevan, R., Brandt, W. N., Scott, J., et al., 2011, ApJ, 728, 28
- (123)
- (124) Yang, Q., Wu, X.-B., Fan, X., Jiang, L., Shangguan, J., et al., 2018, ApJ, 862, 109
- (125)
- (126) Zoghbi, A., Miller, J. M., & Cackett, E., 2019, ApJ, 84, 26
- (127)
- (128) Zoghbi, A., Miller, J. M., Walton, D. J., Harrison, F. A., Fabian, A. C., 2015, ApJ, 799, L24
- (129)
| Component | log n | log | AFe | |||||||||
|---|---|---|---|---|---|---|---|---|---|---|---|---|
| () | () | deg. | () | |||||||||
| relxillD | 15.0* | 7(3) | 2.6(1) | 150.1/141 | ||||||||
| log | ||||||||||||
| () | ||||||||||||
| zxipcf |