Remarkably high mass and high velocity dispersion of molecular gas associated with a regular, absorption-selected type-I quasar
We present 3-mm observations of the quasar J00151842 at with the NOrthern Extended Millimeter Array (NOEMA). Our data reveals molecular gas, traced via a Gaussian CO(3-2) line, with a remarkably large velocity dispersion ( ) and corresponding to a total molecular mass , depending on the adopted
CO-to-H2 conversion factor .
Assuming the 3-mm continuum emission is thermal, we derive a dust mass of the order of .
J00151842 is located in the molecular gas-rich region in the IR vs CO line luminosity diagram, in-between the main locus of main-sequence and sub-millimetre galaxies and that of most other active galactic nuclei (AGNs) targeted so far for CO measurements.
While the large velocity dispersion of the CO line suggests a merging system,
J00151842 is observed to be a regular, only very moderately dust-reddened () type-I quasar from its UV-optical spectrum, from which we infer a mass of the super-massive black hole be around .
We suggest that J00151842 is observed at a galaxy evolutionary stage where a massive merger has brought
significant amounts of gas towards an actively accreting super-massive black hole (quasar).
While the host still contains a large amount of dust and molecular gas with high velocity dispersion,
the quasar has already cleared the way towards the observer, likely through powerful outflows as recently revealed by optical observations of the same object.
High angular resolution observations of this and similar systems should help determining better the respective importance of evolution and orientation in the appearance of quasars and their host galaxies and have the potential to investigate early feedback and star-formation processes in galaxies in their quasar phases.
Key Words.:
Radio lines: galaxies – galaxies: active – galaxies: evolution – quasars: individual: SDSS J001514.82184212.341 Introduction
There is accumulating evidence for a strong link between the evolution of massive galaxies and the super-massive black hole (SMBH) that they generally host in their centre (e.g. Heckman et al., 2004). When matter is accreted onto the disc surrounding the SMBH, enormous amounts of energy can be released through radiation (or relativistic jets), triggering the so-called galactic nuclear activity. Major mergers have been proposed as an efficient mechanism to make the matter lose most of its angular momentum and fall down to the inner regions of the galaxy in a relatively short time scale (e.g. Silk & Rees 1998; Volonteri et al. 2003; Springel et al. 2005, but see Miki et al. 2021). At the same time, merging systems are known to induce intense star-formation activity through compression of the gas. In fact, starburst galaxies and luminous unobscured active nuclei (quasars) are possibly the same systems observed at different stages of the galaxy-SMBH co-evolution (Hopkins et al., 2008). In the rapid SMBH growth phase, huge amounts of dust and molecules are brought to the galaxy centre, and the SMBH activity remains heavily obscured. Bright, unobscured quasars would then correspond to a later phase, when the SMBH have almost fully assembled and are radiating close to their Eddington limit. The energy released could then be sufficient to significantly clear dust and gas from the entire galaxy through powerful winds. Such a feedback mechanism could be responsible for quenching star formation in the host (e.g. Zubovas & King, 2012; Pontzen et al., 2017; Terrazas et al., 2020), although the observed large-scale outflows may not necessarily arise from propagation of energy from the accretion disc to the interstellar medium (Fabian, 2012; Veilleux et al., 2017), i.e. powered by AGN activity, but could also result from the intense star-formation activity or tidal ejection during the merging phase (e.g. Puglisi et al., 2021).
Since cold molecular gas is expected to support both the star-formation and the growth of the SMBHs, large efforts have been devoted to study the properties of this phase (e.g. Omont et al., 1996; Barvainis et al., 1997; Lewis et al., 2002; Bertoldi et al., 2003; Riechers et al., 2006; Weiß et al., 2007; Wang et al., 2010; Salomé et al., 2012, among many other works). In particular, many observing campaigns aimed at detecting the CO emission lines and constrain the molecular reservoirs of galaxies to investigate the evolutionary sequence between starburst (SB) galaxies and quasars, as well as AGN feedback (either positive or negative) on star-formation in the host (e.g. Weiß et al., 2012; Nesvadba et al., 2020). The studies have mostly focused on the bright end of the infra-red luminosity distribution and showed that luminous quasars generally have low ratio of molecular gas masses to star-formation rates (SFR) (e.g. Bischetti et al., 2021), while starburst galaxies have much larger molecular masses to SFR ratios, supporting the evolutionary paradigm. Several studies have also searched for CO emission in obscured quasars, i.e. possibly at the short-lived intermediate stage between the SB and optically-bright quasar phase (e.g. Polletta et al. 2011, Brusa et al. 2015), but differences with luminous quasars seem to appear only for Compton-thick cases, more likely associated to the initial steps of the blow-out phase (Perna et al., 2018).
On the other hand, according to the AGN unification scheme (Antonucci, 1993), a given AGN appears obscured or not depending on its orientation with respect to the observer, i.e. whether the line of sight crosses large amounts of dust in the circum-nuclear region or not. It is therefore not absolutely clear how much the appearance of a system depends on its evolutionary stage and its orientation. It is also possible that the disc of the host galaxy also contributes significantly to obscuring the nuclear region (e.g. Gkini et al., 2021).
Recently, Noterdaeme et al. (2019) uncovered a population of unobscured quasars in the Sloan Digital Sky Survey (SDSS York et al., 2000) featuring strong H2 absorption lines at the quasar redshift in its optical spectrum. Detailed spectroscopic investigations of one of them, SDSS J001514.82184212.34 (hereafter J00151842) with X-shooter on the Very Large Telescope, suggested that the absorption system belongs to a galactic-scale multi-phase outflow, which is also revealed by spatially resolved [O iii] and Ly- emission (Noterdaeme et al., 2021). In this Letter, we present the detection of strong and remarkably broad CO(3-2) emission with the NOrthern Extended Millimeter Array (NOEMA) in this quasar. We discuss these exceptional characteristics for an otherwise apparently regular quasar and suggest that the orientation of this system allows us to observe early AGN feedback during or after a merger phase.
2 Observations
Observations were carried out with the NOrthern Extended Millimeter Array (NOEMA) and the PolyFIX correlator in the 3-mm band in May and June, 2020. The CO(3-2) line at is redshifted at the 95.234 GHz frequency. We observed in D-configuration, with 10 antennas on 23 and 29 May, and 9 antennas on June 3. On May 23rd, the weather conditions were good and stable and we obtained 2.4 h of integration. On May 29th, most of the data was flagged because of poor weather, leaving 0.8 h of integration. On June 3rd, the weather was fine, providing us 4.9 h of integration time. Calibration was done using 5 sources, 3C345, 3C454.3, 0007+171, 2010+723 and MWC349. The absolute flux calibration is accurate at the 10% level. The data were calibrated with the CLIC package and mapped with the MAPPING package in the GILDAS software111http://www.iram.fr/IRAMFR/GILDAS/. Using CLARK cleaning in natural weighting, the compact D configuration provided a beam of 3937, with a PA of 69∘ for the CO(3-2) line and the upper sideband continuum and 5145, with a PA of 125∘ for the lower sideband continuum. The continuum was also computed with the wider 7.7 GHz upper side band, with a beam of 3934, with a PA of .
The quasar was observed in dual polarisation mode in 4 basebands, with 3.9 GHz total bandwidth per baseband, distributed in lower and upper sidebands distant by 15.5 GHz. The CO(3-2) line was observed in the upper side-band, and no other line was detected in the rest of the basebands (upper and lower), which were used to estimate the continuum level. The velocity resolution was initially 2 MHz 6.29 . The spectra were then smoothed to 38.13 MHz (120 ) to build channel maps. The final cube is 128128 pixels with 0785 per pixel in the plane of the sky, and has 80 channels of 120 width. The noise level is 175 Jy/beam in 120 channels for the line and 14 Jy/beam for the continuum.
3 Results
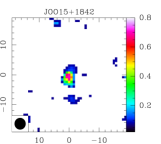
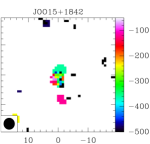
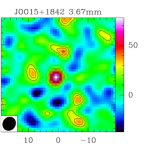
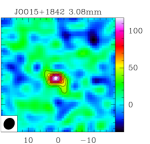
Fig. 1 presents the CO(3-2) integrated map, the velocity dispersion map, and the continuum maps in the two sidebands. The moments of the line cube have been taken above a threshold of 3 in 120 km/s channels, corresponding to an integrated level of 0.063 Jy/beam km/s.
 |
 |
 |
 |
3.1 CO(3-2) emission
The CO(3-2) emission is clearly detected in the integrated map, but the source remains unresolved, given the large beam size of 4″, i.e. corresponding to 32 kpc at the quasar’s redshift. The one moment map of Fig. 1 presents a possible East-West velocity gradient, when the outflowing gas has likely a North-South direction projected on the sky (Noterdaeme et al., 2021).
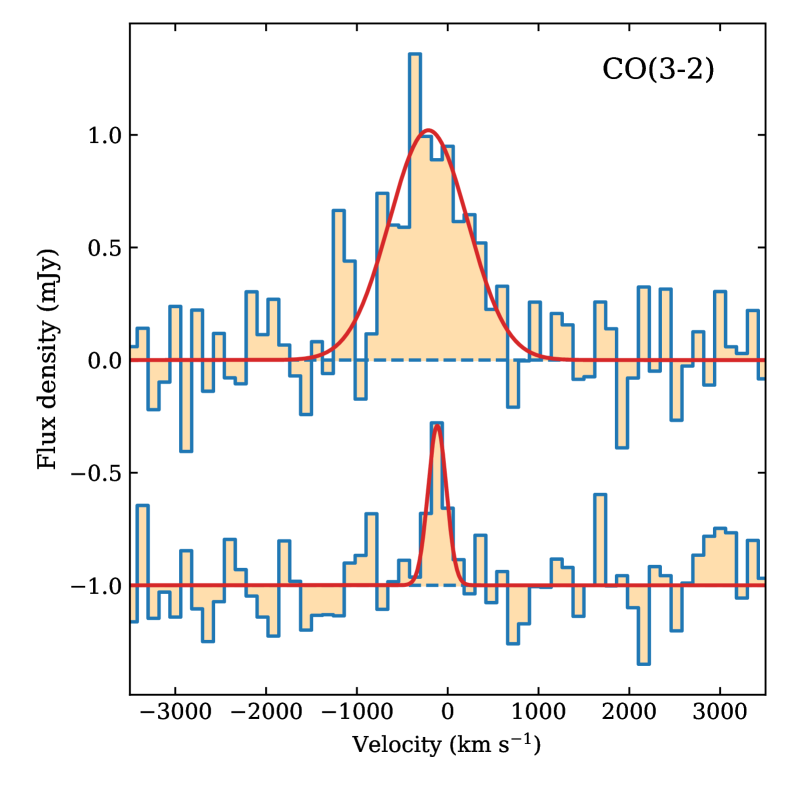
In Fig. 2, we present the 3mm spectrum extracted at the position of the quasar. We fitted the CO(3-2) line with a Gaussian function, yielding a total integrated flux Jy , and a central velocity with respect to the systemic redshift222, inferred with uncertainty from the narrow [O iii] emission.. Such shift, if real, may be due to blending of CO lines in a complex system. We converted the flux to luminosity following Solomon & Vanden Bout (2005) and obtained K km s-1 pc2. To estimate the mass of molecular gas from the CO line luminosity, we assumed a typical CO spectral line energy distribution for quasars and took the CO(3-2)/CO(1-0) intensity ratio from Carilli & Walter (2013), consistent with observations of AGN host galaxies at (Sharon et al., 2016). The CO-to-H2 conversion factor depends on the average conditions in the molecular gas which we do not know. We hence obtain a conservative range assuming (as generally adopted for quasars Walter et al. 2003, e.g.; Wang et al. 2010, e.g.; Bolatto et al. 2013, e.g.) and (standard value).
Finally, we also note a possible structure about 8″(60 kpc at ) southwards of the quasar in both the zero and one moment maps. This could be due to a gas-rich companion galaxy not seen in the optical. The corresponding extracted spectrum has Jy , and . This corresponds to a molecular mass of 2.8, assuming the same as above and the standard . Deeper observations with higher spatial resolution are necessary to better unveil the quasar and its environment.
3.2 Continuum 3 mm emission and FIR luminosity
We detect the 3 mm continuum emission at the position of the quasar on the map with a flux density, determined by fitting uv visibilities, of 6514 Jy and 10414 Jy for the lower (81.76 GHz or 3.67 mm) and upper (97.24 GHz or 3.08 mm) sidebands, respectively. The flux density is varying with frequency as a power-law with slope of with , i.e. consistent with dust emission, with a dust opacity varying as , with albeit with a large () statistical uncertainty333This clearly dominates over systematics since the relative flux calibration of the basebands (USB,LSB) of NOEMA is very good (Neri et al., 2020).. Following Carniani et al. (2017, their Eq. 2), but assuming a dust temperature in the range 40-80 K and within the range obtained above, we infer a dust mass of , within a factor of two, assuming thermal emission only.
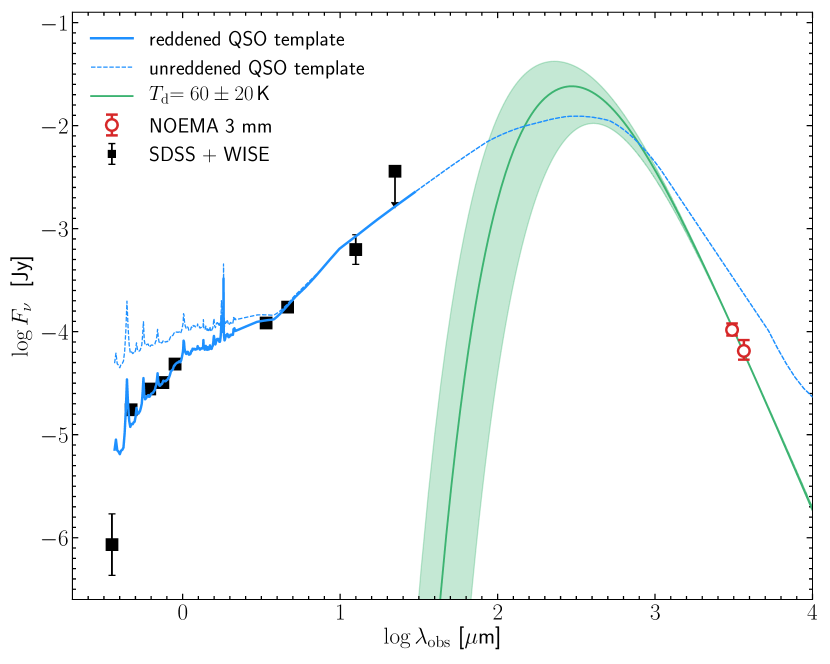
We constrained the AGN spectral energy distribution (SED) from the fluxes measured in SDSS and Wide-field Infrared Survey Explorer (WISE, Wright et al., 2010) filters444The -band is not considered at it is affected by Ly- forest and H2 absorption. W4 provides an upper limit. The quasar presents only 0.25 V-mag variability according to the Catalina Sky Survey (Drake et al., 2009), consistent with the long-term variability of other quasars (Hook et al., 1994)., using the template by Polletta et al. (2007), only moderately reddened by dust (, consistent with derived from the X-shooter spectrum and template, Noterdaeme et al. 2021), see Fig. 3. Based on this template, the intrinsic bolometric luminosity is found to be . We note that the relative contribution of the host galaxy is probably different than predicted by this template which over-predicts the 3 mm continuum emission. We fitted this emission using a modified black-body emission law (see e.g. Eq. 2 from Rangwala et al., 2011), as expected for reprocessed cold dust emission. Using standard values for power law slope (, consistent with our constraint) and normalisation point of the frequency dependence of the effective optical depth ( THz), and assuming a dust temperature K, we get a total IR luminosity associated with the host . We caution however that this estimate is very uncertain in the absence of measurements at m to constrain and . Assuming in the range 40-80 K results in about one order of magnitude uncertainty of . We also note that if a merging/companion galaxy contributes to this IR luminosity (Bischetti et al., 2021), then the value could be considered as an upper-limit to the IR luminosity of the quasar host alone.
4 Discussion and conclusions
In order to maximise the chances of detection, the vast majority of AGNs observed so far in CO lines have been selected for being among the brightest objects, in particular at millimetre or infra-red wavelengths (e.g. Coppin et al. 2008; Wang et al. 2010; Simpson et al. 2012; Wang et al. 2013; Feruglio et al. 2014; Wang et al. 2016; Fan et al. 2019; Banerji et al. 2021). For example, WISE has played an important role in selecting these hyperluminous objects, in combination (e.g. Bischetti et al., 2017) or not (Fan et al., 2018) with photometry from the SDSS. Other works focused on possibly less luminous objects, but still preferentially dust-obscured (e.g. Polletta et al., 2011; Banerji et al., 2017; Kakkad et al., 2017; Perna et al., 2018), radio-loud (e.g. Willott et al., 2007) or on the highest redshifts detected in [C II]158m (e.g. Venemans et al., 2017). In turn, J00151842 is not particularly bright, with e.g. -band magnitude in only the second brightest quartile of SDSS quasars at the same redshift, and only moderately reddened (). It has also 3 mag fainter WISE magnitudes than those of WISSH quasars (Bischetti et al., 2017).
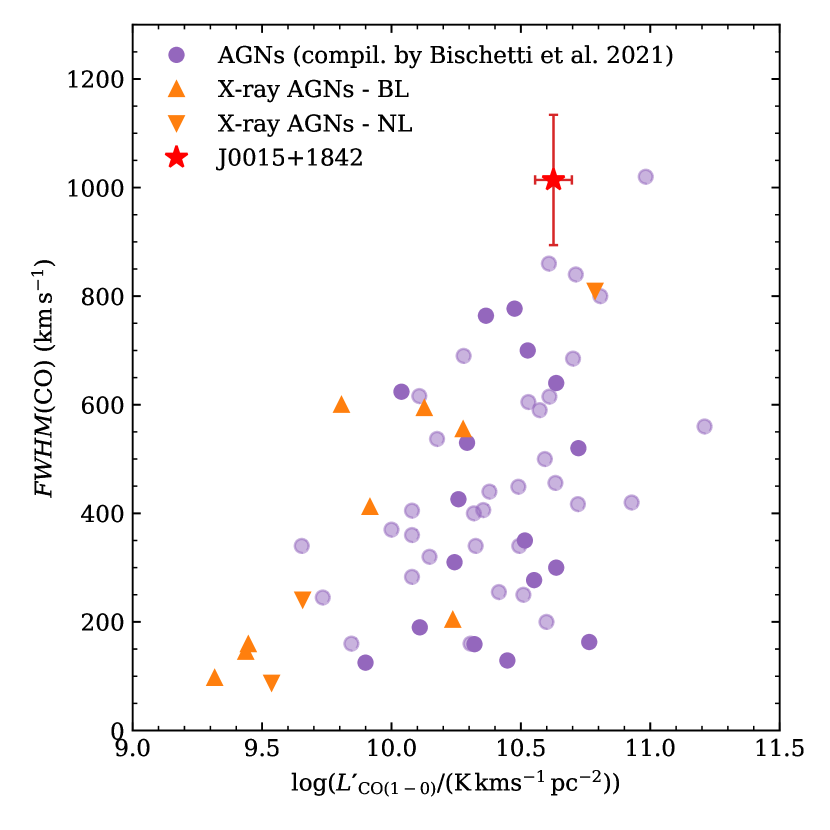
In Fig. 4, we compare the width and luminosity of the detected CO line with those seen in other AGNs from the literature. We use the compilation of unlensed AGNs by Bischetti et al. (2021) and retrieved the line widths from the original detection publications. In a few cases where several spectrally resolved components were reported, we considered conservatively the widest one. To avoid systematics related to the assumption of CO-to-H2 conversion factor, we compare directly the CO line luminosity instead of the H2 mass. This compilation also includes the sample by Circosta et al. (2021) who recently performed a X-ray selection of both type I and type II AGNs with a range of bolometric luminosities, independently on their mm or IR emission. This more homogeneous sample also presents the advantage of being observed all in the CO(3-2) line, so that direct comparison can be made with J00151842 regardless of the assumption of the excitation correction. We therefore distinguish this sample from other AGNs in Figs. 4 and 5.
Both the luminosity and the line width of J00151842 are remarkably high, and the width measured here, is well above the vast majority of other measurements in the compiled sample, only equated by the powerful obscured quasar SWIRE J022513-043419 that has (Polletta et al., 2011). Like J00151842, the latter object also presents extended [O iii] emission that may trace outflowing gas (Nesvadba et al., 2011).
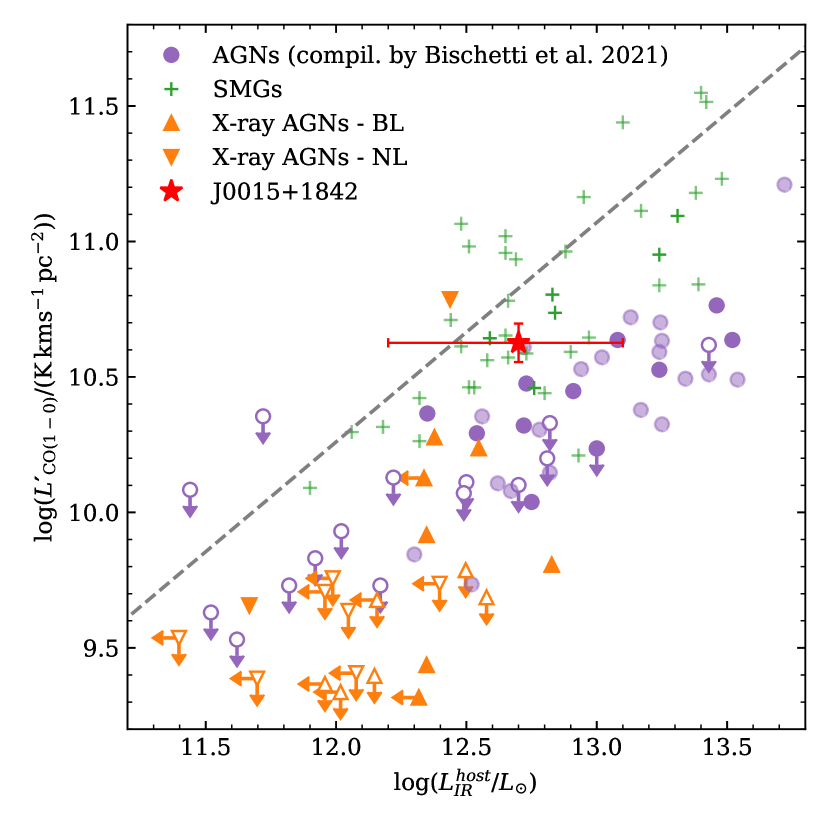
We compare the CO content of J00151842 with other AGNs as a function of the IR luminosity in Fig. 5, using the same compilation as previously, but restricted to systems for which Bischetti et al. (2021) consider the IR measurement to be reasonably reliable (their section 6.2). We also add sub-millimetre galaxies (SMGs) to the comparison. The IR luminosity, integrated over the range m, is generally considered as a proxy of dust emission related to star formation in the host, once the AGN contribution has been removed. The IR-to-CO luminosity ratio is then a widely used proxy for star-formation efficiency. Remarkably, the high CO-line luminosity of J00151842 is similar to that of the most luminous AGNs in IR. However, with its likely lower cold dust emission, J00151842 is located closer to the region populated by MS galaxies and SMGs, and with molecular content well above that of most X-ray selected AGNs. The only AGN in the sample of Circosta et al. (2021) with similar CO luminosity is cid_1253 (COSMOS J100130.56+021842.6) with and . This object is a merger, hosting a narrow-line (type II) AGN, while J00151842 is a regular quasar with broad emission lines (type I).
According to the evolutionary scheme, major mergers of gas-rich galaxies trigger starburst activity and bring a significant amount of matter towards the nuclear regions, initiating the build up of the supermassive black hole. These objects would mostly appear first as obscured AGNs, with star-formation efficiencies much higher than in main sequence galaxies, then transition to optically bright systems with low gas fractions. Indeed, the presence of powerful multiphase galactic-scale outflows show that AGNs are capable of removing large amounts of gas from their host galaxies. As recently discussed by Perna et al. (2018), neither the evolutionary sequence nor orientation effects with respect to obscuring medium alone are able to explain the observed SFEs in obscured and unobscured AGNs.
J00151842 is bringing an important piece to this puzzle. The exceptionally broad Gaussian profile of the CO line in J00151842 suggests a recent or ongoing merger, with a very significant amount of molecular gas and dust. However, the line of sight to the active nucleus is only very moderately reddened and the presence of broad emission lines corresponds to a regular type-I quasar powered by a highly accreting super-massive black hole with Eddington ratio555 and is obtained from the width of the C iv (or H-) line and the rest-frame continuum luminosity at 1350 Å (H- luminosity) using the calibration by Vestergaard & Peterson (2006). .
From the analysis of ionised emission lines together with absorption from H2, Noterdaeme et al. (2021) suggest that a multi-phase outflow is observed oriented almost towards the observer. This could provide a natural explanation to the low extinction along the line of sight. J00151842 supports then a picture in which feedback processes can start early in the evolutionary sequence, with outflows clearing the view towards the nuclear region at least in some directions, while a large amount of molecular gas is still available in the host. In addition, although requiring confirmation, the star-formation efficiency may not have yet reached a level as high as seen in other, possibly more evolved, quasars. Measuring the flux density at 1 mm would help measuring better the IR luminosity and host SFR of J00151842 and similar sources.
If, as suggested by Noterdaeme et al. (2021), the presence of proximate H2 absorbers and leaking Ly- emission provide an efficient way to identify multi-phase outflows in regular quasars, then observations of CO emission in a sample of them could bring further clues to constrain the relative importance of orientation and evolutionary sequence in the appearance of quasars. Deep observations at high angular resolution should allow one to confirm or not the derived configurations and enable detailed investigation of early feedback mechanisms in more regular quasars than those usually targeted for millimetre studies.
Acknowledgements.
We thank the referee for insightful comments that helped improving the presentation of our results. We warmly thank Manuela Bischetti for kindly proving us with her compilation of CO and IR measurements for AGNs and SMGs and Pierre Cox for advises about NOEMA observations. This work is based on observations carried out under project number S20BZ (PI Noterdaeme) with the IRAM NOEMA Interferometer. IRAM is supported by INSU/CNRS (France), MPG (Germany) and IGN (Spain). We are grateful to the IRAM staff for help with the data processing. The research leading to these results has received support from the French Agence Nationale de la Recherche under ANR grant 17-CE31-0011-01/project “HIH2” and from the French-Russian Collaborative Programme 1845. SB was supported by RSF grant 18-12-00301. The Cosmic Dawn Center is funded by the Danish National Research Foundation under grant No. 140.References
- Antonucci (1993) Antonucci, R. 1993, ARA&A, 31, 473
- Banerji et al. (2017) Banerji, M., Carilli, C. L., Jones, G., et al. 2017, MNRAS, 465, 4390
- Banerji et al. (2021) Banerji, M., Jones, G. C., Carniani, S., DeGraf, C., & Wagg, J. 2021, arXiv e-prints, arXiv:2103.10174
- Barvainis et al. (1997) Barvainis, R., Maloney, P., Antonucci, R., & Alloin, D. 1997, ApJ, 484, 695
- Bertoldi et al. (2003) Bertoldi, F., Cox, P., Neri, R., et al. 2003, A&A, 409, L47
- Bischetti et al. (2021) Bischetti, M., Feruglio, C., Piconcelli, E., et al. 2021, A&A, 645, A33
- Bischetti et al. (2017) Bischetti, M., Piconcelli, E., Vietri, G., et al. 2017, A&A, 598, A122
- Bolatto et al. (2013) Bolatto, A. D., Wolfire, M., & Leroy, A. K. 2013, ARA&A, 51, 207
- Brusa et al. (2015) Brusa, M., Feruglio, C., Cresci, G., et al. 2015, A&A, 578, A11
- Carilli & Walter (2013) Carilli, C. L. & Walter, F. 2013, ARA&A, 51, 105
- Carniani et al. (2017) Carniani, S., Marconi, A., Maiolino, R., et al. 2017, A&A, 605, A105
- Circosta et al. (2021) Circosta, C., Mainieri, V., Lamperti, I., et al. 2021, A&A, 646, A96
- Coppin et al. (2008) Coppin, K. E. K., Swinbank, A. M., Neri, R., et al. 2008, MNRAS, 389, 45
- Drake et al. (2009) Drake, A. J., Djorgovski, S. G., Mahabal, A., et al. 2009, ApJ, 696, 870
- Fabian (2012) Fabian, A. C. 2012, ARA&A, 50, 455
- Fan et al. (2018) Fan, L., Knudsen, K. K., Fogasy, J., & Drouart, G. 2018, ApJ, 856, L5
- Fan et al. (2019) Fan, L., Knudsen, K. K., Han, Y., & Tan, Q.-h. 2019, ApJ, 887, 74
- Feruglio et al. (2014) Feruglio, C., Bongiorno, A., Fiore, F., et al. 2014, A&A, 565, A91
- Gkini et al. (2021) Gkini, A., Plionis, M., Chira, M., & Koulouridis, E. 2021, arXiv e-prints, arXiv:2101.01481
- Heckman et al. (2004) Heckman, T. M., Kauffmann, G., Brinchmann, J., et al. 2004, ApJ, 613, 109
- Hook et al. (1994) Hook, I. M., McMahon, R. G., Boyle, B. J., & Irwin, M. J. 1994, MNRAS, 268, 305
- Hopkins et al. (2008) Hopkins, P. F., Hernquist, L., Cox, T. J., & Kereš, D. 2008, ApJS, 175, 356
- Kakkad et al. (2017) Kakkad, D., Mainieri, V., Brusa, M., et al. 2017, MNRAS, 468, 4205
- Lewis et al. (2002) Lewis, G. F., Carilli, C., Papadopoulos, P., & Ivison, R. J. 2002, MNRAS, 330, L15
- Miki et al. (2021) Miki, Y., Mori, M., & Kawaguchi, T. 2021, Nature Astronomy [arXiv:2012.05700]
- Neri et al. (2020) Neri, R., Cox, P., Omont, A., et al. 2020, A&A, 635, A7
- Nesvadba et al. (2020) Nesvadba, N. P. H., Bicknell, G. V., Mukherjee, D., & Wagner, A. Y. 2020, A&A, 639, L13
- Nesvadba et al. (2011) Nesvadba, N. P. H., Polletta, M., Lehnert, M. D., et al. 2011, MNRAS, 415, 2359
- Noterdaeme et al. (2021) Noterdaeme, P., Balashev, S., Krogager, J. K., et al. 2021, A&A, 646, A108
- Noterdaeme et al. (2019) Noterdaeme, P., Balashev, S., Krogager, J. K., et al. 2019, A&A, 627, A32
- Omont et al. (1996) Omont, A., Petitjean, P., Guilloteau, S., et al. 1996, Nature, 382, 428
- Perna et al. (2018) Perna, M., Sargent, M. T., Brusa, M., et al. 2018, A&A, 619, A90
- Polletta et al. (2011) Polletta, M., Nesvadba, N. P. H., Neri, R., et al. 2011, A&A, 533, A20
- Polletta et al. (2007) Polletta, M., Tajer, M., Maraschi, L., et al. 2007, ApJ, 663, 81
- Pontzen et al. (2017) Pontzen, A., Tremmel, M., Roth, N., et al. 2017, MNRAS, 465, 547
- Puglisi et al. (2021) Puglisi, A., Daddi, E., Brusa, M., et al. 2021, Nature Astronomy [arXiv:2101.04021]
- Rangwala et al. (2011) Rangwala, N., Maloney, P. R., Glenn, J., et al. 2011, ApJ, 743, 94
- Riechers et al. (2006) Riechers, D. A., Walter, F., Carilli, C. L., et al. 2006, ApJ, 650, 604
- Salomé et al. (2012) Salomé, P., Guélin, M., Downes, D., et al. 2012, A&A, 545, A57
- Sargent et al. (2014) Sargent, M. T., Daddi, E., Béthermin, M., et al. 2014, ApJ, 793, 19
- Sharon et al. (2016) Sharon, C. E., Riechers, D. A., Hodge, J., et al. 2016, ApJ, 827, 18
- Silk & Rees (1998) Silk, J. & Rees, M. J. 1998, A&A, 331, L1
- Simpson et al. (2012) Simpson, J. M., Smail, I., Swinbank, A. M., et al. 2012, MNRAS, 426, 3201
- Solomon & Vanden Bout (2005) Solomon, P. M. & Vanden Bout, P. A. 2005, ARA&A, 43, 677
- Springel et al. (2005) Springel, V., Di Matteo, T., & Hernquist, L. 2005, ApJ, 620, L79
- Terrazas et al. (2020) Terrazas, B. A., Bell, E. F., Pillepich, A., et al. 2020, MNRAS, 493, 1888
- Veilleux et al. (2017) Veilleux, S., Bolatto, A., Tombesi, F., et al. 2017, ApJ, 843, 18
- Venemans et al. (2017) Venemans, B. P., Walter, F., Decarli, R., et al. 2017, ApJ, 845, 154
- Vestergaard & Peterson (2006) Vestergaard, M. & Peterson, B. M. 2006, ApJ, 641, 689
- Volonteri et al. (2003) Volonteri, M., Haardt, F., & Madau, P. 2003, ApJ, 582, 559
- Walter et al. (2003) Walter, F., Bertoldi, F., Carilli, C., et al. 2003, Nature, 424, 406
- Wang et al. (2010) Wang, R., Carilli, C. L., Neri, R., et al. 2010, ApJ, 714, 699
- Wang et al. (2013) Wang, R., Wagg, J., Carilli, C. L., et al. 2013, ApJ, 773, 44
- Wang et al. (2016) Wang, R., Wu, X.-B., Neri, R., et al. 2016, ApJ, 830, 53
- Weiß et al. (2007) Weiß, A., Downes, D., Neri, R., et al. 2007, A&A, 467, 955
- Weiß et al. (2012) Weiß, A., Walter, F., Downes, D., et al. 2012, ApJ, 753, 102
- Willott et al. (2007) Willott, C. J., Martínez-Sansigre, A., & Rawlings, S. 2007, AJ, 133, 564
- Wright et al. (2010) Wright, E. L., Eisenhardt, P. R. M., Mainzer, A. K., et al. 2010, AJ, 140, 1868
- York et al. (2000) York, D. G., Adelman, J., Anderson, Jr., J. E., et al. 2000, AJ, 120, 1579
- Zubovas & King (2012) Zubovas, K. & King, A. 2012, ApJ, 745, L34