Large Orbital Magnetic Moment and Strong Perpendicular Magnetic Anisotropy in Heavily Intercalated FexTiS2
Abstract
Titanium disulfide TiS2, which is a member of layered transition-metal dichalcogenides with the 1T-CdI2-type crystal structure, is known to exhibit a wide variety of magnetism through intercalating various kinds of transition-metal atoms of different concentrations. Among them, Fe-intercalated titanium disulfide FexTiS2 is known to be ferromagnetic with strong perpendicular magnetic anisotropy (PMA) and large coercive fields (). In order to study the microscopic origin of the magnetism of this compound, we have performed X-ray absorption spectroscopy (XAS) and X-ray magnetic circular dichroism (XMCD) measurements on single crystals of heavily intercalated FexTiS2 (). The grown single crystals showed a strong PMA with a large of . XAS and XMCD spectra showed that Fe is fully in the valence states of 2+ and that Ti is in an itinerant electronic state, indicating electron transfer from the intercalated Fe atoms to the host TiS2 bands. The Fe2+ ions were shown to have a large orbital magnetic moment of , to which, combined with the spin-orbit interaction and the trigonal crystal field, we attribute the strong magnetic anisotropy of FexTiS2.
keywords:
American Chemical Society, LaTeXDepartment of Applied Physics, Tokyo University of Science, Tokyo, Japan \phone+81(3)-5876-1717 \alsoaffiliationLaboratory of Pohang Emergent Materials, Pohang Accelerator Laboratory, Pohang, Korea \alsoaffiliationThe Institute for Solid State Physics, The University of Tokyo, Kashiwa, Japan \alsoaffiliationMax Planck POSTECH/Korea Research Initiative, Pohang University of Science and Technology, Pohang, Korea \alsoaffiliationLaboratory of Pohang Emergent Materials, Pohang Accelerator Laboratory, Pohang, Korea \alsoaffiliationDepartment of Applied Physics, Waseda University, Tokyo, Japan \abbreviationsIR,NMR,UV
1 Introduction
Ferromagnetism in systems where the distance between transition-metal atoms is unusually long has attracted strong interest of researchers. Typical systems are diluted ferromagnetic semiconductors such as Ga1-xMnxAs 1 and double perovskites such as Sr2FeMoO6 2, where hybridization between the relatively localized orbitals of the transition-metal atoms and the itinerant, more extended orbitals plays the crucial role.
Recently, there has been keen interest in transition-metal dichalcogenides (TMDs) as a family of two-dimensional materials due to their novel physical properties 3, 4, 5, 6. TMDs have stacked crystal structures in which two-dimensional AX2 layers consisting of triangular lattices of the transition-metal atoms A sandwiched by the chalcogen atoms X are coupled with each other through weak van der Waals forces. In these compounds, one can intercalate other transition-metal atoms M into the van der Waals gaps. The intercalated compounds, MxAX2, are known to exhibit a wide variety of structural, magnetic, and transport properties, including paramagnetic, ferromagnetic (FM), antiferromagnetic (AFM), and spin-glass behaviors and magneto-transport, depending on the host compound, the intercalated atom M, and its concentration 7, 8, 9, 10. Titanium disulfide TiS2 is one of the TMDs with the 1T-CdI2-type layered crystal structure, where the Ti atom is surrounded by six S atoms octahedrally. Extensive studies on the structural 11, transport 12, 13, and magnetic properties 9, 10, 14 of MxTiS2 have been made so far. Among the transition-metal intercalated titanium disulfides, the Fe-intercalated compound FexTiS2 has been found to be FM in an exceptionally wide range of Fe concentrations . 9, 10, 15, 14, 16. Moreover, the FM FexTiS2 has been shown to exhibit strong perpendicular magnetic anisotropy (PMA) with a large coercive field () of 9, 10, 15, 14, 16. It has also been reported that this FM state exhibits spin-glass-like behaviors, called the “cluster-glass” state, observed by ac susceptibility measurements 9, 16, magnetotransport measurements 17, and neutron scattering 18. Effects of the ordering of the intercalated Fe atoms, observed by transmission electron microscopy 19, 17, are also thought to be important in order to explain the dependence of the magnetic phases.
In an attempt to understand the origin of the diverse magnetic properties of these intercalated compounds MxTiS2 from the viewpoint of electronic structures, first-principles calculations 20, 21, 22 and photoemission spectroscopy 23, 24, 25, 26, 27, 22, 28 studies have been performed so far. The importance of hybridization between the guest transition-metal atoms and the host TiS2 has been pointed out based on the first-principles calculations 20, 21, 22. Magnetic coupling between the guest transition-metal atoms thus deduced is mapped onto the Ruderman-Kittel-Kasuya-Yosida (RKKY) model, and is used to explain the complex magnetic phases as a function of the concentration 29, 30. As for the magnetism of FexTiS2, X-ray absorption spectroscopy (XAS) and X-ray magnetic circular dichroism (XMCD) measurements for have also been performed 27. Systematic changes in the spectral line shapes as functions of for both the Fe and the Ti absorption edges have been observed 27. The presence of a large orbital magnetic moment of Fe observed by XMCD has also been pointed out 27. However, the relationship between the observed large orbital magnetic moment and the strong PMA has not been discussed in sufficient detail. In addition, the magnetism of FexTiS2 at higher ’s is more interesting because it has higher FM transition temperatures and coercive fields than that at lower ’s 9, 10. Therefore, spectroscopic studies on heavily intercalated FexTiS2 crystals have been desired.
In the present study, we have performed XAS and XMCD experiments on single crystals of heavily intercalated FexTiS2 (). The grown single crystals showed a strong PMA with a large of . XAS and XMCD spectra indicate electron transfer from the intercalated Fe atoms to the TiS2 host. The Fe2+ ions are shown to have a large orbital magnetic moment of , which would be associated with the strong magnetic anisotropy of FexTiS2.
2 Methods
FexTiS2 single crystals with were grown by the typical chemical vapor deposition method. First, stoichiometric mixed powder with an I2 transport agent in evacuated quartz tubes was heated at 500 K for 24 h to prevent the explosion of the ampule. Then, the sealed ampule was heated at 1173 K for 2 weeks with a temperature difference of 50 K between the both ends of the ampule. Detailed methods for the sample preparation are described in Ref. 31. The crystallinity of the sample was checked by X-ray diffraction (XRD) using the X’Pert Pro diffractometer from PANalytical. The conventional - method in the specular geometry was adopted. The X-ray source was the Cu line (wavelength ) and the operation voltage and current of the X-ray tube were 40 kV and 30 mA, respectively. The stoichiometry of the crystals was checked by energy dispersive X-ray (EDX) spectroscopy equipped with a scanning electron microscope (SEM). The magnetic properties of the grown crystals were measured using the superconducting quantum interference device magnetometry.
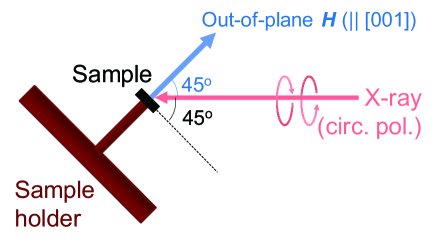
The XAS and XMCD spectra at the Fe () and Ti edges were measured using a vector-magnet XMCD measurement apparatus 32, 33 installed at beamline BL-16A of Photon Factory, High Energy Accelerator Research Organization (KEK-PF). The samples were cleaved in situ prior to measurements. Figure 1 schematically describes the experimental geometry of the XMCD measurements. The vacuum was maintained at Pa during the entirety of the measurements. The samples were cooled down to K without a magnetic field. The magnetic field was then applied parallel to the -axis of the samples with the X-ray incident angle of 45∘. The maximum magnetic field was 1 T. XAS signals were collected in the total electron yield mode.
From the measured XAS and XMCD spectra, the orbital () and spin () magnetic moments of Fe were deduced using the XMCD sum rules 34, 35. The explicit forms of the XMCD sume rules are given as follows: 34, 35
| (1) | |||||
| (2) |
where and are the XAS spectra for the right- and left-circular polarizations, respectively, () are the absorption peaks corresponding to the Fe () transition, is the photon energy, is the number of electrons in the transition-metal 3 band, and and are given in the unit of measure of . , which is the nominal number of electrons in an Fe2+ ion, was assumed in the present study. In the original references 34, 35, the denominator is the sum of three XAS spectra, (where is the XAS spectra for the linear polarization along the X-ray incident direction), which were approximated by here. In order to apply the sum rules to measured spectra, a continuum background was subtracted from the raw XAS spectra as follows: First, a polygonal line bent at the XAS peak position was subtracted so that the pre-edge and the post-edge regions became horizontal. Then, a smoothed two-step background was subtracted, which is composed of two arctangent functions with relative heights of centered at the peak positions of the and edges. We note that the arbitrariness of these background subtraction procedures causes systematic errors of – in the integrated XAS intensities. In Eq. (2), the spectra have been divided into the - and -edge regions at . It is known that, when using the sum rules, the division of the XAS and XMCD spectra into the and edges at a certain energy may result in the underestimation of 36, 37. The presence of an additional term called the magnetic dipole term 34, 38, 39, which has been omitted in Eq. (2), may also cause some systematic errors in . According to Ref. 37, the magnitude of the systematic errors of due to the incomplete - separation and the magnetic dipole term are estimated to be about % and %, respectively, in the case of an Fe2+ ion. Hereafter, only the statistical errors of and are presented.
The spectral line shapes of the XAS and XMCD spectra were analyzed based on the configuration-interaction (CI) cluster model 40 using the XTLS 8.5 package 40. We assumed an [FeS6]10- cluster (i.e., divalent Fe) with symmetry, i.e., the FeS6 octahedron is slightly elongated or shrunk along a trigonal axis. The following parameters were adjusted in order to obtain the best-fit spectra: (Coulomb energy between two Fe valence electrons), (Coulomb energy between the Fe electron and the Fe core electron), (charge-transfer energy), (Slater-Koster parameters), (octahedral crystal field), (trigonal crystal field), and (molecular field). Spin-orbit interaction (SOI) and the Slater integrals were estimated from atomic Hartree-Fock calculations. For the Slater integrals, 80% of the values deduced from the atomic Hartree-Fock calculation were used. In the CI calculation, the ground state was assumed to be a linear combination of the , , and configurations, where is a ligand hole.
3 Results and Discussion
3.1 Sample Characterization
Figure 2 shows the XRD profile of an FexTiS2 () single crystal. Sharp Bragg peaks along the [001] direction are clearly observed, confirming the layered structure of the grown crystal. From the obtained XRD profile, the out-of-plane lattice parameter has been estimated to be 0.572 nm, close to the value obtained in the previous study for FexTiS2 with 11.

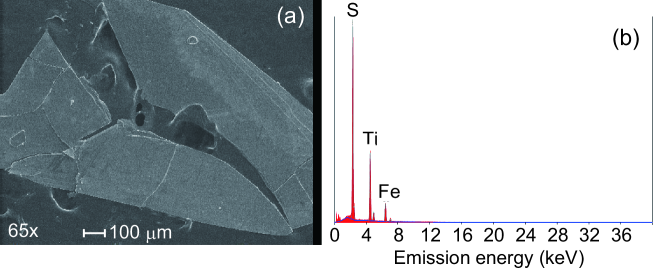
Figure 3(a) shows the SEM image of the FexTiS2 single crystal on a carbon tape. The typical sample diameter is 0.5–1 mm. Regions with flat surfaces can be seen with typical sizes of a few hundred micrometers squared. The EDX spectrum of the crystal is shown in Fig. 3(b). From the spectral intensities, the atomic ratio of each element has been estimated to be , which corresponds to the chemical formula Fe0.432Ti0.968S2. This confirms that more Fe atoms are intercalated in the present FexTiS2 crystal than those in the previous XMCD study (), 27 although the Fe concentration is slightly lower than the nominal value .
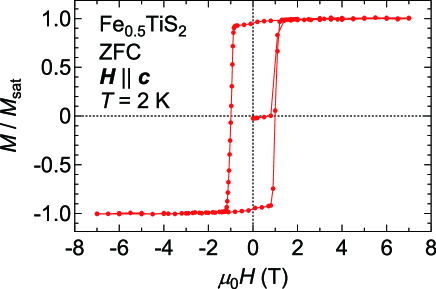
From the temperature dependence of the magnetization, the Curie temperature of the crystal has been estimated to be . Figure 4 shows the zero-field cooled (ZFC) magnetization curve of the FexTiS2 single crystal measured at 2 K with an applied magnetic field parallel to the -axis (trigonal axis) up to T. In the initial magnetization process, a sudden jump in the magnetization is observed around , suggesting a transition from the AFM to FM states. After magnetic saturation, a clear rectangular hysteresis loop is observed with a coercive field of . The obtained is similar to those of polycrystalline FexTiS2 with () and single-crystalline Fe0.33TiS2 reported in the previous study 10. The large hysteresis loop suggests that the crystal exhibits a strong PMA with the magnetic easy axis along the -axis. We note that quantitative estimate of the saturation magnetization from the raw magnetization curve is difficult due to a large uncertainty of the sample mass. We have, therefore, plotted the magnetization curve normalized by in Fig. 4. We shall deduce the values of and the uniaxial magnetic anisotropy energy (MAE) by the XMCD measurements afterward.
3.2 X-ray Magnetic Circular Dichroism Spectroscopy
Figure 5(a) shows the helicity-averaged XAS spectra of the FexTiS2 single crystal at the Fe () absorption edges. The XAS spectra of divalent and trivalent iron oxides and metallic iron are also shown as references 41, 42. The overall spectral line shape of Fe0.5TiS2 is similar to that of FeO. Especially, the small shoulder around is characteristic of divalent Fe, showing that the iron atom is essentially in the Fe2+ valence state. Reflecting the large hybridization strength of sulfides and high electrical conductivity compared to oxides, the XAS spectrum of Fe0.5TiS2 shows broader absorption peaks and more extended high-energy tails than that of FeO. One may think that the XAS spectrum of Fe0.5TiS2 is also similar to that of the Fe metal. As indicated in Fig. 5(a) by arrows, however, the XAS spectra of Fe0.5TiS2 and FeO have several multiplet structures in common, while they are absent in the XAS spectrum of metallic Fe reflecting its itinerant electronic structures. This indicates that the amount of possible metallic iron clusters, if any, is small in the present Fe0.5TiS2 crystal. The difference of the peak positions of the multiplet structures between Fe0.5TiS2 and FeO is probably due to the different hybridization strength and crystal-field splitting between oxides and sulfides.
In Fig. 5(b), the helicity-averaged XAS spectra of the FexTiS2 single crystal at the Ti absorption edges are compared with those of FexTiS2 () 27, 43 and titanium oxides 44. The spectral line shape of the present Fe0.5TiS2 crystal is close to those of FexTiS2 with 27. One can see that, as increases, the absorption peaks become broader and the energy splitting between the two principal peaks in each of the and edges become systematically smaller. The shoulder structures around and in the present XAS spectra are more diffuse than those for , confirming that a larger amount of Fe atoms are intercalated in the present sample than in the previous ones. These spectral changes with increasing are considered to be due to electron doping from the intercalated Fe atoms into the TiS2 host. As can be seen from the figure, the spectral line shapes of FexTiS2 with cannot be described as a superposition of the Ti4+ and Ti3+ valence states. This implies that the electrons doped from Fe into TiS2 do not lead to a mixed-valence state consisting of the Ti4+ and Ti3+ ionic states, but have rather itinerant character.
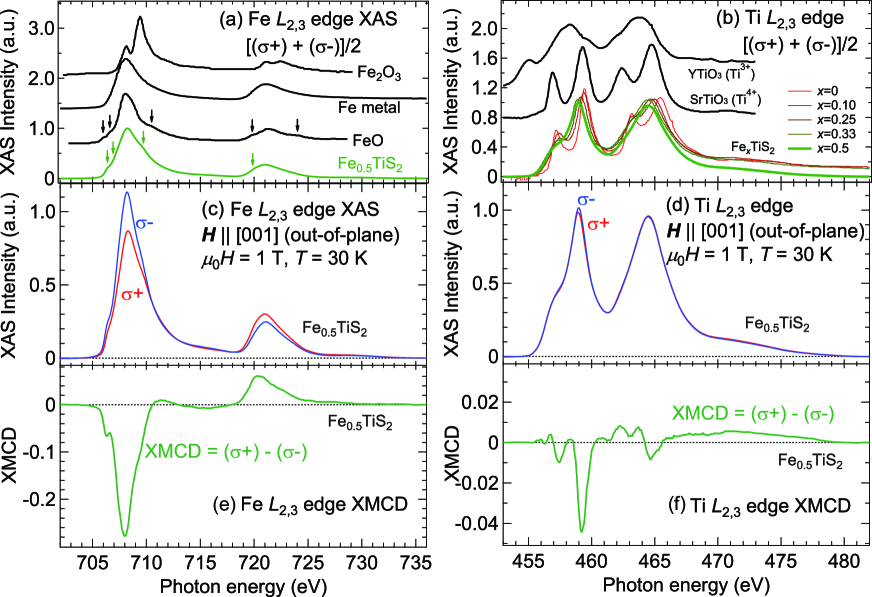
Figures 5(c)–5(f) show the helicity-dependent XAS spectra and the XMCD spectra at the Fe and Ti edges. The XMCD spectra in Figs. 5(e) and 5(f) clearly show that not only Fe but also Ti exhibits finite XMCD signals. This suggests that the observed ferromagnetism is not due to magnetic impurities such as metallic iron or iron compounds but due to the intrinsic properties of the Fe0.5TiS2 crystal. First-principle calculations 20, 21 show that the band structure of the transition-metal-intercalated TiS2 is significantly modified from that of the nonintercalated TiS2 through hybridization between the intercalated atoms and the host compound. In the case of Fe intercalation, the down-spin Fe 3 states hybridize with the Ti 3 states to form spin-polarized bands near the Fermi level 20. As a result, Ti exhibits small but finite spin polarization 20. The present XMCD result is qualitatively consistent with this calculation.
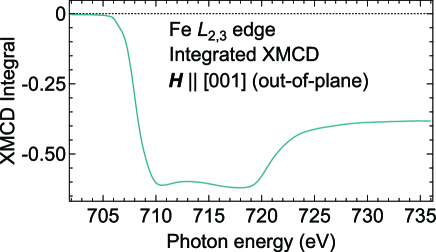
Using the XMCD sum rules 34, 35, we have deduced the spin () and orbital magnetic moments () of Fe. We note that the of Ti cannot be deduced from the spin sum rule due to the too small spin-orbit splitting of the Ti core levels, making the decomposition of the XMCD spectrum into the and components impossible 34, 36, 37. We also note that the of Ti, which is obtained by integrating the entire XMCD spectrum, was below the detection limit () of the present experiment. Considering that the magnetization is 45∘ off from the X-ray incident direction, the obtained magnetic moments have been divided by in order to correct this effect. As shown in Fig. 6, the integral of the Fe XMCD spectrum has a large negative end value, suggesting that Fe has a large parallel to the spin magnetic moment. The results of the sum rule yield and . The obtained is consistent with the values deduced from the first-principle calculations: for and for 20. The large may be due to the degeneracy of the electron orbitals in the Fe2+ valence state and the partially filled level in a relatively weak crystal fields for the intercalated Fe atoms.
From the and values deduced by using the XMCD sum rule, one can deduce the uniaxial magnetic anisotropy energy based on the Stoner-Wohlfarth model, 45 in which one assumes uniaxial magnetic anisotropy and the coherent rotation of the magnetic domain. According to the model, the coercive field is equal to , where is the saturation magnetization calculated as the sum of and . From this relationship, the uniaxial MAE for the present FexTiS2 single crystal is estimated to be or (note that is defined positive for materials with PMA).
3.3 CI Cluster-Model Calculation
In order to explain the observed large of Fe and the strong PMA of and , we calculated the XAS and XMCD spectra at the Fe edges using the CI cluster model. An [FeS6]-10 cluster with weak trigonal distortion ( symmetry) was employed. In the present calculation, we first optimized the parameters , , , , and in the symmetry (i.e., ) so that the calculated spectra well reproduce the experimental ones (for the definitions of and , see the inset of Fig. 7(b)) . The best-fit result was obtained with the parameter values listed in Table 1. The obtained parameter values are comparable to those deduced from the photoemission spectroscopy of Fe0.33TiS2 46. We then optimized the values of and so that they reproduce the experimental and , respectively. has been calculated as the total energy difference between two spin configurations, and . Figure 7(a) shows the dependence of the calculated spin magnetic moment . We note that modifying the values of only resulted in the change in the XMCD intensity, without any variation in the characteristic spectral line shapes (not shown here). By comparing the calculated with the experimental value, has been estimated to be . Figure 7(b) shows the dependence of the calculated magnetic anisotropy energy . It can be seen that the experimental can be reproduced by only a slight change in of . The calculated Fe XAS and XMCD spectra are shown in Figs. 7(c) and 7(d) for and . The calculated spectra well reproduce the experimental spectral features. It can also be seen that the spectral line shapes and the XMCD intensities are nearly insensitive to , although such a small magnitude of can induce appreciable magnetic anisotropy as shown below.
| 2.5 eV | 5.0 eV | 6.3 eV | -0.8 eV | 0.7 eV |

3.4 Discussion: Origin of the Strong PMA
The microscopic origin of the strong PMA of Fe-intercalated TMDs is discussed by Parkin and Friend 7 based on the atomic multiplet model in an octahedral crystal field with a trigonal distortion. Here, we summarize their discussion and apply it to the present system. An Fe2+ ion with electron configuration octahedrally coordinated by six anions has the ground state, which is triply degenerate in the orbital part () and quintuply degenerate in the spin part (). (Note that the multielectron state should be distinguished from the one-electron state .) . The orbital triplet is isomorphic to the substates of orbital angular momentum . In order to represent this orbital triplet, an effective orbital angular momentum operator is introduced. Using , the Hamiltonian of the system can be written as follows:
| (3) |
where the first, second, and third terms represent the energies of the trigonal crystal field , SOI of the electrons , and the Zeeman effect by the molecular field (in the unit of measure of eV) originating from exchange interactions, respectively. Note that we have replaced the Zeeman term due to the external magnetic field , which is originally introduced by Parkin and Friend 7, by that due to the molecular field because we consider the FM state instead of the paramagnetic one. They have treated the first two terms as the primary terms and the Zeeman term as perturbation and have shown that the energy corrections for the out-of-plane and in-plane magnetic fields are of the first and second orders in , respectively, resulting in the anisotropy of the -factor. However, our cluster-model calculation shows that . We, therefore, treat the role of as perturbation to SOI and in order to explain the magnetic anisotropy of FM FexTiS2.
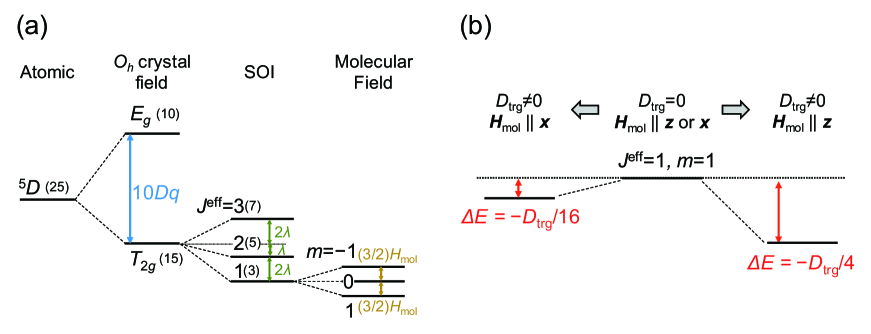
Figure 8(a) schematically describes the energy diagram of an Fe2+ ion based on this model. The ground state under the octahedral crystal field is split into three levels of by SOI, where is the effective total angular momentum. Since is 1 order of magnitude larger than the thermal energy , only the level has to be considered. The level is then Zeeman-split into three sublevels of , where is the magnetic quantum number for . The magnetic anisotropy energy can be deduced by calculating the difference of the perturbation energy of in the cases of out-of-plane () and in-plane molecular fields (). The ground state is expressed as follows in the cases of () and ():
where the terms can be written using the eigenstates of and (denoted as ) as
Thus, the perturbation energies due to the trigonal crystal field for the out-of-plane and in-plane fields can be calculated as and , respectively, to the first order of . This energy shift is schematically described in Fig. 8(b). This energy difference can be regarded as the origin of the PMA in the present system. We stress that this is a first-order perturbation effect, which is the reason why such a small magnitude of can give rise to the considerable magnitude of the magnetic anisotropy energy. The present result is consistent with the dependence of shown in Fig. 7(b), in which is nearly proportional to when the crystal field is weak.
The present XMCD results show that there exists a large unquenched orbital moment of the intercalated Fe atom () in Fe0.5TiS2, which is considered to originate from the above-mentioned effective orbital angular momentum in the state. The ratio of the orbital to spin angular momentum () is calculated to be . According to the previous XMCD measurements for FexTiS2 with 27, the values of are deduced to be and for and , respectively. The value obtained for in the present study is out of this decreasing tendency with increasing . Although the mechanism for this dependence of is not clear at present, hybridization effects between guest Fe and host TiS2, which have not been taken into account in the above discussion, might be relevant. We note that similar dependence has also been observed in the strength of the coercive field of FexTiS2 9, 10. We expect that the complex dependence of can be explained by the magnitude of the unquenched orbital magnetic moment of the intercalated Fe2+ ions.
4 Conclusion
We have performed XAS and XMCD experiments on single crystals of heavily intercalated FexTiS2 () in order to discuss the microscopic origin of the strong PMA and large of this compound. We have confirmed that the grown single crystal showed a large of and strong PMA with a magnetic anisotropy energy of . From the XMCD result, the Fe2+ ions are shown to have a large orbital magnetic moment of . The strong magnetic anisotropy of FexTiS2 is attributed to the large orbital moment combined with the spin-orbit interaction and the trigonal crystal field.
A.F. and S.W.C. would like to thank D. D. Sarma for long-standing collaboration on a variety of interesting transition-metal compounds and for stimulating interaction during the last many decades. We thank Kenta Amemiya and Masako Sakamaki for valuable technical support at KEK-PF. This work was supported by Grants-in-Aid for Scientific Research from the JSPS (15H02109, 15K17696, 19K03741, and 20K14416). J.W.K. and S.W.C. were supported by the National Science Foundation (NSF) under Grant No. DMR-1629059. C.J.W. and S.W.C. partially were supported by the National Research Foundation of Korea (NRF) funded by the Ministry of Science and ICT(No. 2016K1A4A4A01922028 and No. 2020M3H4A2084417). Y.X.W. acknowledges support from Advanced Leading Graduate Course for Photon Science (ALPS) at the University of Tokyo. A.F. is an adjunct member of Center for Spintronics Research Network (CSRN), the University of Tokyo, under Spintronics Research Network of Japan (Spin-RNJ). The experiment was done under the approval of the Photon Factory Program Advisory Committee (Proposal No. 2016S2-005, No. 2016G066, and No. 2019G622).
The authors declare no competing financial interest.
References
- Mahadevan et al. 2004 Mahadevan, P.; Zunger, A.; Sarma, D. D. Unusual directional dependence of exchange energies in GaAs diluted with Mn: Is the RKKY description relevant? Phys. Rev. Lett. 2004, 93, 177201
- Sarma et al. 2000 Sarma, D. D.; Mahadevan, P.; Saha-Dasgupta, T.; Ray, S.; Kumar, A. Electronic structure of . Phys. Rev. Lett. 2000, 85, 2549–2552
- Lee et al. 2016 Lee, J. Y.; Shin, J. H.; Lee, G. H.; Lee, C. H. Two-dimensional semiconductor optoelectronics based on van der Waals heterostructures. Nanomaterials (Basel) 2016, 6, 193
- Choi et al. 2017 Choi, W.; Choudhary, N.; Han, G. H.; Park, J.; Akinwande, D.; Lee, Y. H. Recent development of two-dimensional transition metal dichalcogenides and their applications. Mater. Today 2017, 20, 116–130
- Manzeli et al. 2017 Manzeli, S.; Ovchinnikov, D.; Pasquier, D.; Yazyev, O.; Kis, A. 2D transition metal dichalcogenides. Nat. Rev. Mater. 2017, 2, 17033
- Pal et al. 2017 Pal, B.; Singh, A.; G., S.; Mahale, P.; Kumar, A.; Thirupathaiah, S.; Sezen, H.; Amati, M.; Gregoratti, L.; Waghmare, U. V. et al. Chemically exfoliated layers: Spectroscopic evidence for the semiconducting nature of the dominant trigonal metastable phase. Phys. Rev. B 2017, 96, 195426
- Parkin and Friend 1980 Parkin, S. S. P.; Friend, R. H. 3d transition-metal intercalates of the niobium and tantalum dichalcogenides. I. Magnetic properties. Philos. Mag. B 1980, 41, 65–93
- Parkin and Friend 1980 Parkin, S. S. P.; Friend, R. H. 3d transition-metal intercalates of the niobium and tantalum dichalcogenides. II. Transport properties. Philos. Mag. B 1980, 41, 95–112
- Inoue et al. 1985 Inoue, M.; Matsumoto, M.; Negishi, H.; Sakai, H. Low field ac magnetic susceptibility measurements of intercalation compounds MxTiS2 (M3d transition metals). J. Magn. Magn. Mater. 1985, 53, 131–138
- Negishi et al. 1987 Negishi, H.; Shoube, A.; Takahashi, H.; Ueda, Y.; Sasaki, M.; Inoue, M. Magnetic properties of intercalation compounds MxTiS2 (M = 3d transition metal). J. Magn. Magn. Mater. 1987, 67, 179–186
- Inoue and Negishi 1986 Inoue, M.; Negishi, H. Interlayer spacing of 3d transition-metal intercalates of 1T-CdI2-type TiS2. J. Phys. Chem. 1986, 90, 235–238
- Koyano et al. 1986 Koyano, M.; Negishi, H.; Ueda, Y.; Sasaki, M.; Inoue, M. Electrical resistivity and thermoelectric power of intercalation compounds MxTiS2 (MMn, Fe, Co, and Ni). Phys. Status Solidi B 1986, 138, 357–363
- Inoue et al. 1986 Inoue, M.; Koyano, M.; Negishi, H.; Ueda, Y. Electronic properties of intercalation compound FexTiS2. J. Phys. Soc. Jpn. 1986, 55, 1400–1401
- Negishi et al. 1988 Negishi, H.; Koyano, M.; Inoue, M.; Sakakibara, T.; Goto, T. High field magnetization of 3d transition metal intercalates MxTiS2 (M3d metals). J. Magn. Magn. Mater. 1988, 74, 27–30
- Yoshioka and Tazuke 1985 Yoshioka, T.; Tazuke, Y. Magnetic properties of FexTiS2 system. J. Phys. Soc. Jpn. 1985, 54, 2088–2091
- Negishi et al. 1988 Negishi, H.; Ōhara, S.; Koyano, M.; Inoue, M.; Sakakibara, T.; Goto, T. Anisotropic spin-glass and cluster-glass of layered FexTiS2 crystals. J. Phys. Soc. Jpn. 1988, 57, 4083–4085
- Choe et al. 2019 Choe, J.; Lee, K.; Huang, C.-L.; Trivedi, N.; Morosan, E. Magnetotransport in Fe-intercalated : Comparison between and Ta. Phys. Rev. B 2019, 99, 064420
- Kuroiwa et al. 2000 Kuroiwa, Y.; Honda, H.; Noda, Y. Neutron magnetic scattering of intercalation compounds FexTiS2. Mol. Cryst. Liq. Cryst. Sci. Technol., Sect. A 2000, 341, 15–20
- Chiew et al. 2020 Chiew, Y. L.; Miyata, M.; Koyano, M.; Oshima, Y. Ordering of intercalated Fe atoms in FexTiS2 structures clarified using transmission electron microscopy. J. Phys. Soc. Jpn. 2020, 89, 074601
- Suzuki et al. 1987 Suzuki, N.; Yamasaki, T.; Motizuki, K. Electronic band structures of intercalation compounds of 3d transition metals with TiS2. J. Magn. Magn. Mater. 1987, 70, 64–66
- Suzuki et al. 1989 Suzuki, N.; Yamasaki, T.; Motizuki, K. Electronic band structures and bond orders of M1/3TiS2 (MMn, Fe, Co, Ni). J. Phys. Soc. Jpn. 1989, 58, 3280–3289
- Martinez et al. 2002 Martinez, H.; Tison, Y.; Baraille, I.; Loudet, M.; Gonbeau, D. Experimental (XPS/STM) and theoretical (FLAPW) studies of model systems M1/4TiS2 (MFe, Co, Ni): influence of the inserted metal. J. Electron. Spectrosc. Relat. Phenom. 2002, 125, 181–196
- Ueda et al. 1986 Ueda, Y.; Negishi, H.; Koyano, M.; Inoue, M.; Soda, K.; Sakamoto, H.; Suga, S. Resonant photoemission studies of 3 transition metal intercalates of TiS2. Solid State Commun. 1986, 57, 839–842
- Ueda et al. 1987 Ueda, Y.; Fukushima, K.; Negishi, H.; Inoue, M.; Taniguchi, M.; Suga, S. Photoemission studies on intercalation compounds of MxTiS2 (M3d transition metals). J. Phys. Soc. Jpn. 1987, 56, 2471–2476
- Fujimori et al. 1988 Fujimori, A.; Suga, S.; Negishi, H.; Inoue, M. X-ray photoemission and Auger-electron spectroscopic study of the electronic structure of intercalation compounds (M=Mn, Fe, Co, and Ni). Phys. Rev. B 1988, 38, 3676–3689
- Suga 2000 Suga, S. Angle-resolved, resonance-and inverse-photoemission studies of transition metal intercalated TiS2. Mol. Cryst. Liq. Cryst. Sci. Technol., Sect. A 2000, 341, 9–14
- Yamasaki et al. 2002 Yamasaki, A.; Imada, S.; Sekiyama, A.; Suga, S.; Matsushita, T.; Muro, T.; Saitoh, Y.; Negishi, H.; Sasaki, M. Angle-resolved photoemission spectroscopy and magnetic circular dichroism in Fe-intercalated TiS2. Surf. Rev. Lett. 2002, 9, 961–966
- Suga et al. 2015 Suga, S.; Tusche, C.; ichiro Matsushita, Y.; Ellguth, M.; Irizawa, A.; Kirschner, J. Momentum microscopy of the layered semiconductor TiS2 and Ni intercalated Ni1/3TiS2. New J. Phys. 2015, 17, 083010
- Tazuke et al. 2005 Tazuke, Y.; Ohta, Y.; Miyamoto, S. Exchange interactions in FexTiS2. J. Phys. Soc. Jpn. 2005, 74, 2644–2645
- Tazuke et al. 2006 Tazuke, Y.; Miyashita, T.; Nakano, H.; Sasaki, R. Magnetic properties of MxTiSe2 (MMn, Fe, Co). Phys. Status Solidi C 2006, 3, 2787–2790
- Lévy 1979 Lévy, F., Ed. Intercalated Layered Materials; D. Reidel Publishing Company: Dordrecht, Holland, 1979
- Furuse et al. 2013 Furuse, M.; Okano, M.; Fuchino, S.; Uchida, A.; Fujihira, J.; Fujihira, S.; Kadono, T.; Fujimori, A.; Koide, T. HTS vector magnet for magnetic circular dichroism measurement. IEEE Trans. Appl. Supercond. 2013, 23, 4100704
- Shibata et al. 2018 Shibata, G.; Kitamura, M.; Minohara, M.; Yoshimatsu, K.; Kadono, T.; Ishigami, K.; Harano, T.; Takahashi, Y.; Sakamoto, S.; Nonaka, Y. et al. Anisotropic spin-density distribution and magnetic anisotropy of strained La1-xSrxMnO3 thin films: angle-dependent x-ray magnetic circular dichroism. npj Quantum Mater. 2018, 3, 3
- Carra et al. 1993 Carra, P.; Thole, B. T.; Altarelli, M.; Wang, X. X-ray circular dichroism and local magnetic fields. Phys. Rev. Lett. 1993, 70, 694–697
- Thole et al. 1992 Thole, B. T.; Carra, P.; Sette, F.; van der Laan, G. X-ray circular dichroism as a probe of orbital magnetization. Phys. Rev. Lett. 1992, 68, 1943–1946
- Teramura et al. 1996 Teramura, Y.; Tanaka, A.; Jo, T. Effect of Coulomb interaction on the x-ray magnetic circular dichroism spin sum rule in 3 transition elements. J. Phys. Soc. Jpn. 1996, 65, 1053–1055
- Piamonteze et al. 2009 Piamonteze, C.; Miedema, P.; de Groot, F. M. F. Accuracy of the spin sum rule in XMCD for the transition-metal edges from manganese to copper. Phys. Rev. B 2009, 80, 184410
- Stöhr and König 1995 Stöhr, J.; König, H. Determination of spin- and orbital-moment anisotropies in transition metals by angle-dependent x-ray magnetic circular dichroism. Phys. Rev. Lett. 1995, 75, 3748–3751
- Dürr and van der Laan 1996 Dürr, H. A.; van der Laan, G. Magnetic circular x-ray dichroism in transverse geometry: Importance of noncollinear ground state moments. Phys. Rev. B 1996, 54, R760–R763
- Tanaka and Jo 1994 Tanaka, A.; Jo, T. Resonant 3, 3 and 3 photoemission in transition metal oxides predicted at 2 threshold. J. Phys. Soc. Jpn. 1994, 63, 2788–2807
- Regan et al. 2001 Regan, T. J.; Ohldag, H.; Stamm, C.; Nolting, F.; Lüning, J.; Stöhr, J.; White, R. L. Chemical effects at metal/oxide interfaces studied by x-ray-absorption spectroscopy. Phys. Rev. B 2001, 64, 214422
- Chen et al. 1995 Chen, C. T.; Idzerda, Y. U.; Lin, H.-J.; Smith, N. V.; Meigs, G.; Chaban, E.; Ho, G. H.; Pellegrin, E.; Sette, F. Experimental confirmation of the x-ray magnetic circular dichroism sum rules for iron and cobalt. Phys. Rev. Lett. 1995, 75, 152–155
- Kimura et al. 1993 Kimura, A.; Suga, S.; Matsushita, T.; Imada, S.; Shino, N.; Saitoh, Y.; Shigeoka, H.; Daimon, H.; Kinoshita, T.; Kakizaki, A. et al. Electronic structure of Ni intercalated TiS2 probed by angle resolved and 2 core resonance photoemission as well as by 2 core absorption spectroscopy. Jpn. J. Appl. Phys. 1993, 32, 255–257
- Cao et al. 2016 Cao, Y.; Liu, X.; Kareev, M.; Choudhury, D.; Middey, S.; Meyers, D.; Kim, J.-W.; Ryan, P.; Freeland, J.; Chakhalian, J. Engineered Mott ground state in a LaTiO3+δ/LaNiO3 heterostructure. Nat. Commun. 2016, 7, 10418
- Stoner and Wohlfarth 1948 Stoner, E. C.; Wohlfarth, E. P. A mechanism of magnetic hysteresis in heterogeneous alloys. Philos. Trans. R. Soc., A 1948, 240, 599–642
- Bocquet et al. 1992 Bocquet, A. E.; Mizokawa, T.; Saitoh, T.; Namatame, H.; Fujimori, A. Electronic structure of 3-transition-metal compounds by analysis of the 2 core-level photoemission spectra. Phys. Rev. B 1992, 46, 3771–3784