New experimental Reaction Rate for Massive Star and Type-Ia Supernova models
Abstract
The reaction has been identified as having a significant impact on the nucleosynthesis of several nuclei between Ne and Ti in type-Ia supernovae, and of 23Na and 26Al in massive stars. The reaction has been subjected to renewed experimental interest recently, motivated by high uncertainties in early experimental data and in the statistical Hauser-Feshbach models used in reaction rate compilations. Early experiments were affected by target deterioration issues and unquantifiable uncertainties. Three new independent measurements instead are utilizing inverse kinematics and Rutherford scattering monitoring to resolve this. In this work we present directly measured angular distributions of the emitted protons to eliminate a discrepancy in the assumptions made in the recent reaction rate measurements, which results in cross sections differing by a factor of 3. We derive a new combined experimental reaction rate for the reaction with a total uncertainty of 30% at relevant temperatures.Using our new rate, the 26Al and 23Na production uncertainty is reduced to within 8%. In comparison, using the factor of 10 uncertainty previously recommended by the rate compilation STARLIB, 26Al and 23Na production was changing by more than a factor of 2. In type-Ia supernova conditions, the impact on production of 23Na is constrained to within 15%.
1 Introduction
The reaction rate has been the subject of a number of nuclear astrophysics studies in the last decade. During carbon fusion in massive stars, 23Na is produced directly by one of the main fusion channels, 12CCNa. Sodium made in this phase will provide the bulk of the sodium ejected by core-collapse supernovae, which are an important source of sodium in the Universe (e.g., Timmes et al., 1995; Woosley et al., 2002; Kobayashi et al., 2011; Pignatari et al., 2016; Sukhbold et al., 2016; Limongi & Chieffi, 2003; Chieffi & Limongi, 2013). In these conditions, the 23Na(p,)20Ne is the main destruction channel for 23Na. However, among other reactions is also fully activated and needs to be considered to calculate stellar abundances. For instance, Iliadis et al. (2011) showed that a factor of 10 increase in the reaction rate would increase the 26Al production by a factor of 3, acting as a source of protons for the 25MgAl reaction. 26Al is a key radioisotope for astronomy. Its decay signature has been measured in the interstellar-medium by -ray telescopes COMPTEL (Chen et al., 1995) and INTEGRAL (Diehl et al., 2013), and its abundance derived from meteoritic material is used as a fundamental diagnostic to study the formation of the solar system (Lugaro et al., 2018, and references therein). The reaction has also been identified as affecting the production of 21Ne, 23Na, 26Mg, 29Si, 43Ca and 47Ti, in type-Ia supernovae (Bravo & Martínez-Pinedo, 2012), with most of the abundances changing by a factor of 0.12 – 2 when the reaction rate is increased or decreased by a factor of 10, and with 26Mg and 43Ca changing by over a factor of 2. The impact on 23Na has also been identified in the deflagration-detonation transition supernova (DDT-SN) model of Parikh et al. (2013a), where an increase of the rate by a factor of 10 yields a change in abundance by a factor of 0.47.
The reaction has been subjected to renewed experimental interest recently, due to identified weaknesses in early experimental data and uncertainties in the application of statistical Hauser-Feshbach models (Iliadis et al., 2011; Parikh et al., 2013b). There now exist three new independent measurements of the reaction cross-section utilizing novel techniques to solve the issues of early experiments. Two of these experiments (Almaraz-Calderon et al., 2015; Tomlinson et al., 2015) are only capable of detecting a small angular range of the emitted protons, necessitating an assumption on the variation of the reaction’s cross-section with respect to angle (angular distribution) in order to calculate a total cross-section for astrophysical purposes. The two measurements assumed different distributions. The third measurement (Howard et al., 2015) has sufficient angular coverage to directly measure the angular distribution of the protons. In the present paper we show that when corrected for the angular distributions presented, these measurements are all consistent to within 30% with one another in the energy range MeV.
The angular distributions have been obtained from the data taken at Aarhus University (Howard et al., 2015), which can be applied to the other data sets to eliminate angular distribution assumptions, reducing systematic uncertainties on their cross-section measurement, and ensuring consistency across the three measurements. These new angular-distribution-corrected measurements have been combined to obtain a new recommended experimental astrophysical reaction rate, with a significantly reduced uncertainty. The impact of this rate has been modeled in massive stars and type-Ia supernova.
2 Experimental History
A schematic of the reaction is shown in figure 1: a 23Na ion reacts with an particle (4He) producing a compound 27Al nucleus in an excited state. This excited compound nucleus rapidly decays into 26Mg by emitting a proton. If 26Mg is produced in its ground state the protons are called protons, and if in its first excited state protons.
The earliest measurement of the reaction was by Kuperus (1964) who measured individual resonance strengths () of narrow resonances between MeV, producing 26Mg in its ground state ( protons). This was followed up by Whitmire & Davids (1974) who measured resonance strengths producing 26Mg in its first excited state ( protons) as well as the ground state. They additionally calculated a reaction rate based on their data. Because Whitmire & Davids did not reassess the resonance strengths at the energies already published by Kuperus, the combined work which incorporates both and cross-sections (derived from the published resonance strengths) will be treated as one data set in the subsequent discussion. Both experiments were in forward kinematics, impinging a 4He beam on a NaCl target.
The experiments involved observation of individual resonances, and therefore the targets used were thin (g/cm2) and measurements were taken with small increases in beam energy. Thus, the beam current of the incoming particles was fairly high ( nA) in order to collect sufficient statistics. This unfortunately led to degradation of the targets due to heating of the target and the low melting point of NaCl of C. This effect was discussed by Whitmire & Davids (1974), but was not quantified, leading to a large systematic uncertainty in the data. Subsequently reaction rate compilations such as REACLIB (Cybert et al., 2010) therefore used cross-sections and reaction rates predicted from statistical Hauser-Feshbach (HF) models.
A detailed sensitivity study of 26Al production was performed in 2011 by Iliadis et al. (2011), which identified the reaction as having a significant effect on 26Al production in massive star models (a factor of 10 in the rate affects 26Al production by a factor of 3). The experimental limitations and reliance on statistical models were also highlighted, including limitations on the applicability of HF to low-mass, alpha-induced, reactions such as the rate (Mohr, 2015). A comparison of HF to experimental reaction rates by Parikh et al. (2013b) noted a large number of values which exceed the traditional factor of 2 reliability of HF. Based on the study, further experimental work was strongly advised.
The first modern measurement on the reaction was performed by Almaraz-Calderon et al. (2014, 2015) at Argonne National Laboratory (ANL) near Chicago, USA. This measurement was performed in inverse kinematics, utilizing a 23Na beam and a cryogenic 4He gas target. The use of inverse kinematics avoided the problems of target deterioration observed by Kuperus and Whitmire & Davids. Due to the nature of the experimental setup only protons emitted at angles of were measured. In order to obtain a full cross-section, the angular distribution of the protons was assumed to be the same as the 27Al(a,p)30Si reaction. The initial results indicated cross-sections much higher than expected from Kuperus and Whitmire & Davids or HF models, but these data were subsequently re-analyzed producing cross-sections consistent with the HF cross-sections.
Three additional experiments on the reaction were performed soon after the first result, the first, by Howard et al. (2015) at Aarhus University in Denmark, in forward kinematics. By utilizing a much lower beam intensity ( ppA) than Kuperus and Whitmire & Davids while also monitoring Rutherford scattered alpha particles to monitor target deterioration, the large source of uncertainty from the target stoichiometry was eliminated. This experiment was also able to directly measure the proton angular distributions, which are presented in the next section.
The second experiment, by Tomlinson et al. (2015), was performed in inverse kinematics at TRIUMF in Canada. This experiment had a very similar experimental set-up to that of Almaraz-Calderon et al. (2014), but with a room-temperature target and a broader angular coverage and assuming an isotropic angular distribution. Both Howard et al. (2015) and Tomlinson et al. (2015) measured cross-sections consistent with those of the NON-SMOKER HF model (Rauscher & Thielemann, 2000).
The third experiment was performed by Avila et al. (2016a), also at ANL. This measurement utilised an active target measurement to directly measure the total cross-section of the reaction, in inverse kinematics, covering an energy range of MeV in the centre-of-mass frame. The cross-sections of this experiment were also consistent with those of NON-SMOKER.
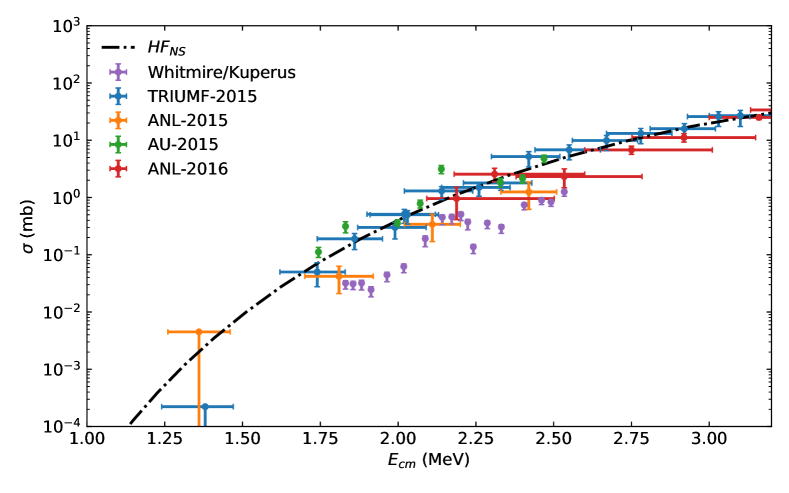
The published cross-sections for the five data sets are shown in figure 2. All four recent measurements of the reaction have reasonably consistent results, with Tomlinson et al. (2015) and Howard et al. (2015) agreeing within 50%. The data from Almaraz-Calderon et al. (2015) can be seen to be systematically lower by a factor 2.5 from the other two data sets. The newly analyzed angular distribution data from AU-2015 can be applied to TRIUMF-2015 and ANL-2015 to eliminate the discrepancy between the three data sets, as detailed in the following.
3 Experimental Angular Distributions
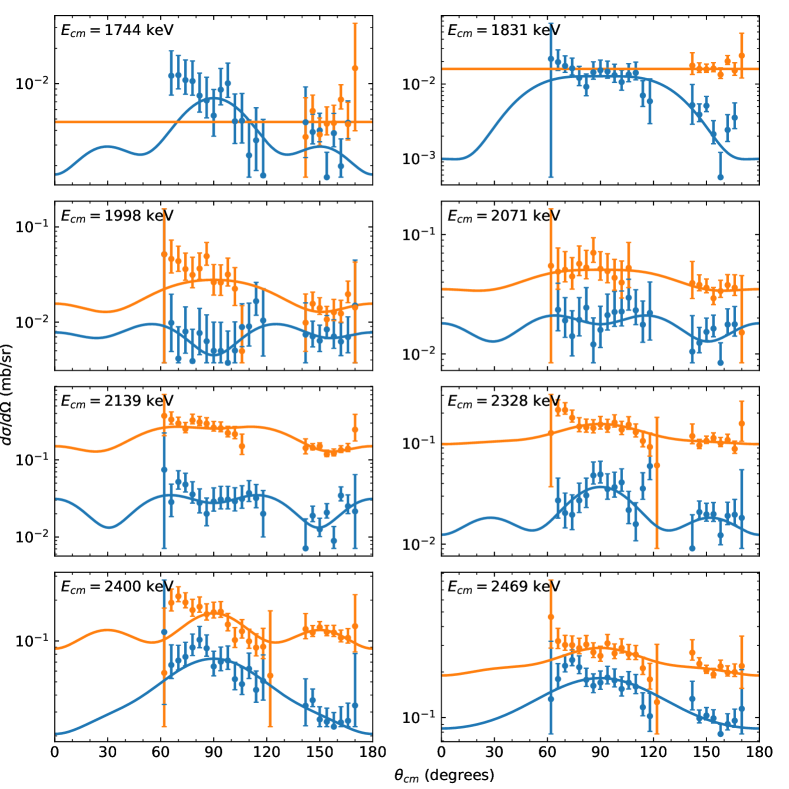
The angular distributions of the emitted protons produced by the reaction were measured at Aarhus University, Denmark as part of the direct measurement of the cross-sections, and the experimental set-up is described in detail by Howard et al. (2015). The detector array comprises of two detectors covering the laboratory angular range of . Protons are unambiguously identified at MeV, while protons below this energy were only measured at .
For the higher-energy measurements a full angular distribution was obtained by fitting a sum of the first four even Legendre polynomials:
| (1) |
which can then be integrated over all angles to obtain a total cross-section. These distributions are symmetric around , which is expected for a reaction involving an intermediate compound nucleus, but a conservative uncertainty of 20% was introduced nevertheless. For the lowest energies where the protons could only be measured at high angles, an isotropic distribution was assumed. This adds a systematic uncertainty of 30% to the cross-sections at MeV. A full account of the uncertainty budget is detailed by Howard et al. (2015).
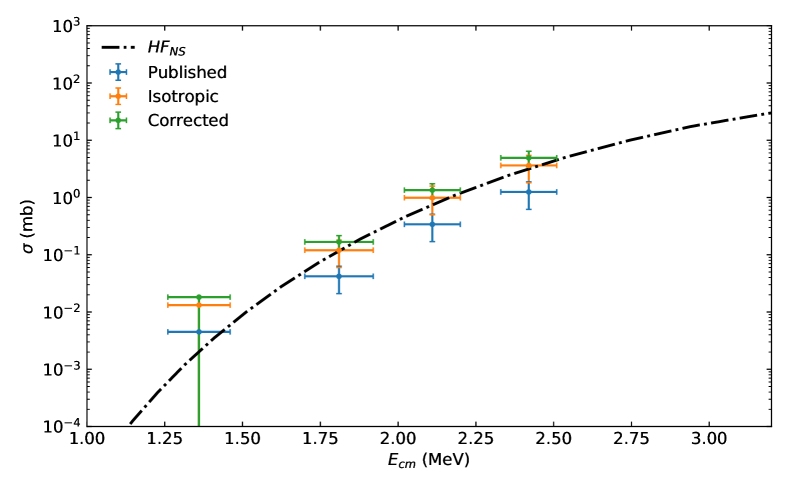
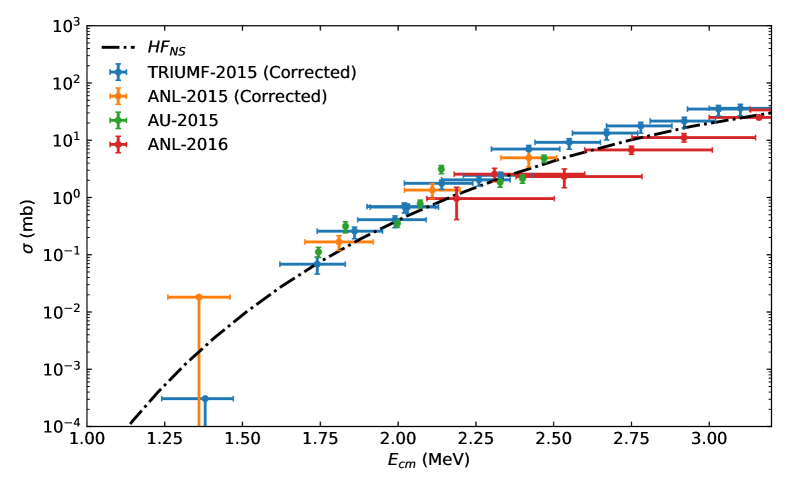
All energies were additionally fitted to isotropic distributions using only the high-angle data. This allows evaluation of the systematic uncertainty on the low-energy points discussed above, and application of the distributions from the Howard data to the TRIUMF-2015 and ANL-2015 data, by applying the ratio of measured to isotropic cross-sections to their isotropic cross-sections. For ANL-2015 the total cross-sections were calculated from their differential cross-sections, rather than applying the angular distribution assumed in the paper (Almaraz-Calderon et al., 2015), a comparison of the effect of the different angular distributions for ANL-2015 is shown in figure 3. All evaluated cross-sections using the measured distributions () and the cross-sections assuming an isotropic distribution () are shown in table 1, where it can be seen that on average the cross-sections are 30% higher than under an isotropic approximation. Although the angular distribution impact should depend on the incident beam energy, the thick targets employed by all the measurements averages out these effects. This can be noted by the cross-section impact having no significant energy dependence, with the exception of the point at keV. This factor of 4.88 increase at keV is due to a strong resonance at keV producing a nearly pure distribution which drops off strongly at angles above . The angular distributions are shown in figure 4. For the subsequent analysis an energy-independent increase of 30% over the isotropic assumption is used to correct the data from ANL-2015 and TRIUMF-2015.
| (keV) | (mb) | (mb) | (mb) | (mb) | ||
|---|---|---|---|---|---|---|
| 1744 | 0.05(1) | 0.04 | 1.5(4) | — | — | |
| 1831 | 0.11(2) | 0.02 | 4.9(14) | — | — | |
| 1998 | 0.09(2) | 0.09 | 1.1(2) | 0.17 | 1.6(3) | |
| 2071 | 0.22(4) | 0.17 | 1.3(3) | 0.43 | 1.3(3) | |
| 2139 | 0.34(7) | 0.20 | 1.7(4) | 1.69 | 1.7(4) | |
| 2328 | 0.28(6) | 0.22 | 1.2(3) | 1.30 | 1.2(3) | |
| 2400 | 0.62(12) | 0.34 | 1.8(4) | 1.45 | 1.0(2) | |
| 2469 | 1.76(35) | 1.19 | 1.5(3) | 2.61 | 1.2(2) |
4 Experimental Reaction Rate
With the three recent cross-section measurements we obtain a new experimental reaction rate which can be used in preference to the Hauser-Feshbach (HF) reaction rate, removing the uncertainties associated with the models. Before combining the three measurements, we apply the angular distributions discussed above to Almaraz-Calderon et al. (2015) and Tomlinson et al. (2015), reducing uncertainties associated with the assumptions of angular distributions. These corrections result in a increase over the isotropic distribution assumed by Tomlinson et al. (2015), and a increase
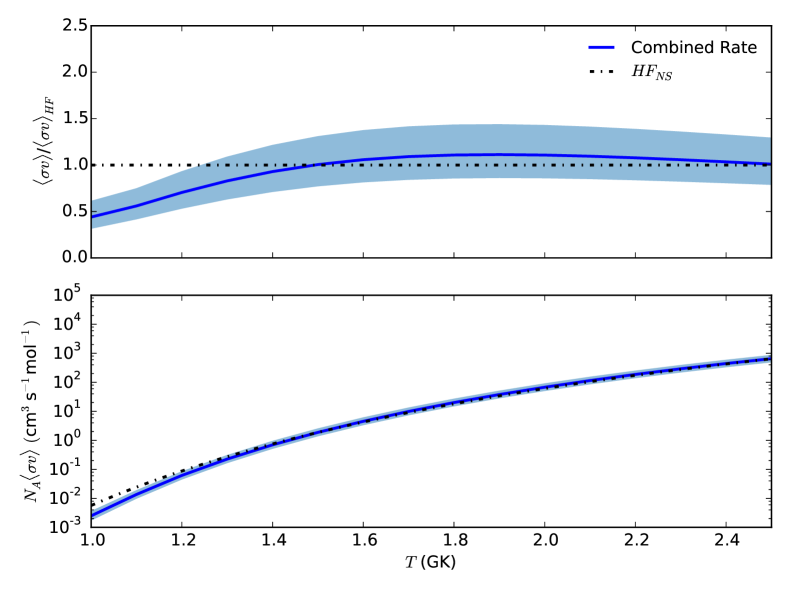
Each of the cross-sections was then integrated to obtain a reaction rate using exp2rate (Rauscher, 2003). This code takes as input center-of-mass energies (), their cross sections (, and the associated cross-section uncertainties. It then converts these cross sections into astrophysical factors before numerically integrating to obtain the reaction rate with errors. The reaction rate is given tabulated over a range of temperatures. These three individual tabulated rates are then combined by taking a weighted average of the three. Combining the rates in this way avoids issues with the different cross-section energies measured in the three experiments. For the data point at MeV, only the more constrained limit by TRIUMF-2015 is taken into account, being used for the upper limit and recommended reaction rate, and a cross-section of 0 at this energy is used for the lower limit of the combined reaction rate. The new experimental reaction rate and its uncertainty is shown in figure 6, and tabulated in table 2 The rate agrees within uncertainty with the HF predicted rate, but deviates to below the HF rate as temperatures under 1.2 GK, due to the upper-limit of the TRIUMF-2015 data point at MeV.
| (GK) | Recommended Rate | Lower Limit | Upper Limit |
|---|---|---|---|
For most astrophysical models, a large reaction database such as REACLIB (Cybert et al., 2010) is used. In these databases the reaction rates are stored as coefficients to the function:
| (2) |
which accurately captures the temperature dependence of most reaction rates. The combined tabulated reaction rates were fitted using the Computation Infrastructure for Nuclear Astrophysics (CINA) system (Smith et al., 2004), and the coefficients for equation 2 are tabulated in table 3
| Recommended Rate | Lower Limit | Upper Limit | |
|---|---|---|---|
| - | |||
| - | |||
| Recommended Rate | Lower Limit | Upper Limit | |
|---|---|---|---|
The reaction rate for the reverse reaction 26MgNa can also be related to the reaction rate, and thus can also be computed from the experimental data and the partition functions (), which are tabulated by Rauscher & Thielemann (2000). This reverse rate was also fitted to equation 2 using CINA. The coefficients are tabulated in 4, with the unspecified coefficients unchanged from 3.
5 Astrophysical Impact
The impact of this new experimental rate in the C-burning convective shell is investigated using the NuGrid nucleosynthesis post-processing toolkit (Pignatari & Herwig, 2012). An extended network of reaction rates is used at given stellar conditions, following consistently the production and destruction of isotopic abundances over time. For a detailed description of the nuclear reaction network and reaction rates used, we refer to Pignatari et al. (2016). Iliadis et al. (2011) performed the sensitivity study of the rate in two massive star models of initial mass and , respectively. Therefore, we selected two massive-star models of the same mass from the Pignatari et al. (2016) stellar set. The stellar structure is produced by GENEC (Eggenberger et al., 2008), with initial metallicity . For this work, we used the software ppn to investigate the variation of isotopic abundances in single trajectories extracted from C-burning regions of the star.
The trajectories (, as a function of time) and initial abundances were taken from the deepest area of the C-burning convective shell. For the star, we extracted the trajectory at mass coordinate , between 1.3 and 0.12 years before collapse.
The temperature ranges from GK and the density g cm-3. With this trajectory we used a network of 1100 isotopes with changes made solely to the reaction and its inverse, the rest of the network setup was identical to that used by Pignatari et al. (2016).
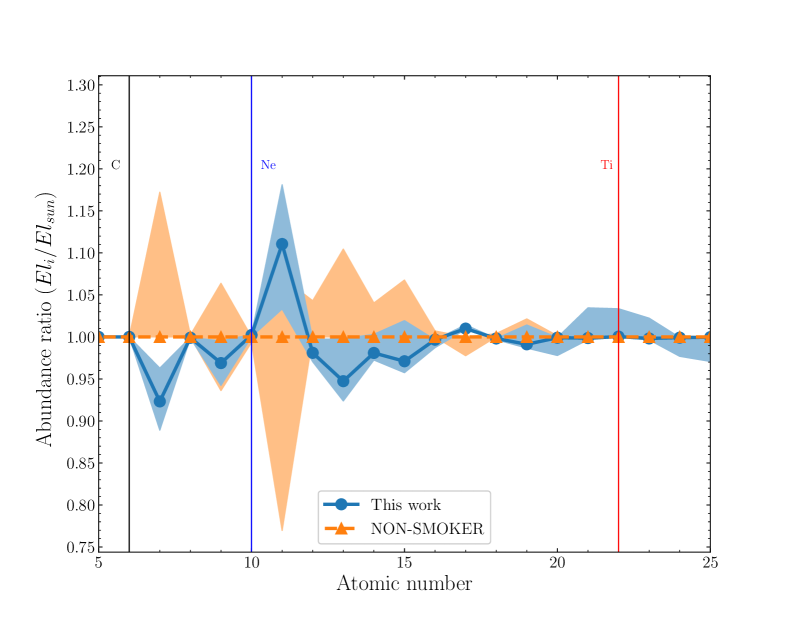
For the impact of the new rate, ppn simulations are presented for eight rates: the original REACLIB rate, factors of 2 and 10 increase and decrease as upper and lower limits, the new experiment rate, and the upper and lower limits for this rate. The absolute differences of elemental abundances for elements with compared to REACLIB is small, as would be expected with the similar cross-sections, and so the data are plotted relative to REACLIB in figure 7, with the shaded regions corresponding to the uncertainty of the rates.
The uncertainty on the REACLIB rates is generally expected to be anywhere from a factor of 2 to 10. STARLIB, which provides uncertainties on all the rates, gives a factor of 10 uncertainty on the rate (Sallaska et al., 2013). These uncertainties correspond to a change in 26Al of (+27%,-14%) for a factor of 2 and (+128%,-29%) for a factor of 10, and a change in 23Na of (+17%,-23%) for a factor of 2 and (+34%,-70%) for a factor of 10. In contrast, the uncertainties on the present experimental rate produce a change in both 26Al and 23Na of (+7%,-7%). In general the uncertainties on the abundances of the elements is constrained to within 5% with the experimental rate, compared to approximately 20% with the NON-SMOKER rates. The impact on intermediate-mass elements is negligible. However it should be noted that the largest contribution to the 26Al yield comes from explosive burning and the H-burning shells in massive stars, and so the contribution of the C convective shell to the total yield is negligible (Limongi & Chieffi, 2006)
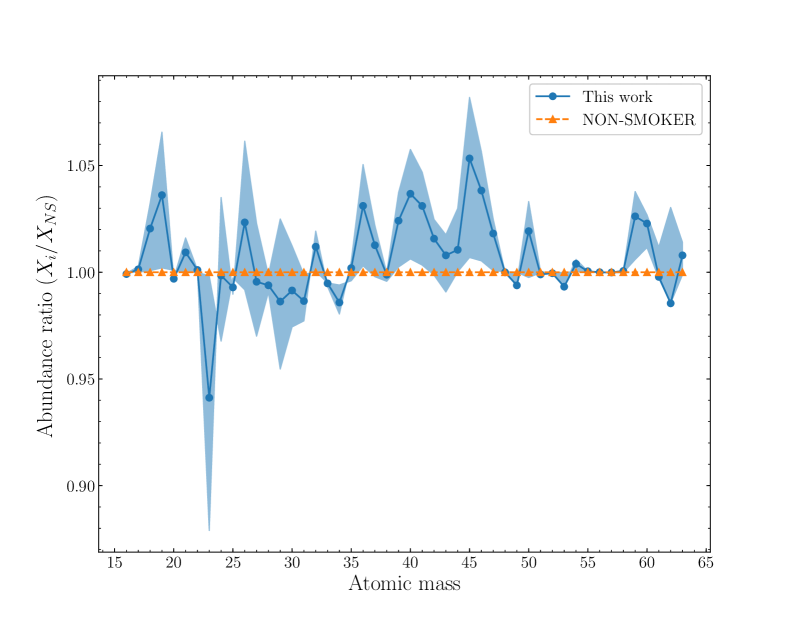
The impact of our new rate was also examined using a 2D Chandrasekhar-mass deflagration-to-detonation transition type Ia supernova explosion model (Parikh et al., 2013a). As shown in fig 8, the 23Na variation due to the uncertainty of our rate is within 15%, and within 5% for all other species.
6 Summary
A new combined experimental reaction rate for the reaction has been calculated from three recent independent measurements (Almaraz-Calderon et al., 2015; Howard et al., 2015; Tomlinson et al., 2015), and utilizing directly measured angular distributions for the observed cross-section to reduce systematic uncertainty. Impact on astrophysical scenarios has been evaluated in the carbon-burning convective-shell in massive stars, and in type-Ia supernovae. The rate is found to be in good agreement with the statistical reaction rate previously used, but the uncertainty has been reduced from greater than a factor of 2 to 30%. This uncertainty is dominated by uncertainties on the differential cross-section measurements themselves, and a conservative assumption on front-back asymmetry in the angular distributions which was not possible to observe. The abundance of 23Na is increased by a factor of 1.1, and 26Al is unchanged from HF predictions. Both abundances are constrained to within 7%, this is compared to to an uncertainty of (+128%,-29%) for 23Na, and (+34%,-70%) for 26Al, using the factor of 10 uncertainty given by STARLIB (Sallaska et al., 2013). While the overall yield of 26Al has not been impacted by this work, the uncertainty on the rate has been significantly reduced.
References
- Almaraz-Calderon et al. (2014) Almaraz-Calderon, S., Bertone, P. F., Alcorta, M., et al. 2014, Phys. Rev. Lett., 112, 152701. http://journals.aps.org/prl/abstract/10.1103/PhysRevLett.112.152701
- Almaraz-Calderon et al. (2015) —. 2015, Phys. Rev. Lett., 115, 179901. http://link.aps.org/doi/10.1103/PhysRevLett.115.179901
- Avila et al. (2016a) Avila, M. L., Rehm, K. E., Almaraz-Calderon, S., et al. 2016a, Phys. Rev. C, 94, 065804. https://link.aps.org/doi/10.1103/PhysRevC.94.065804
- Avila et al. (2016b) —. 2016b, Phys. Rev. C, 94, 065804. https://link.aps.org/doi/10.1103/PhysRevC.94.065804
- Bravo & Martínez-Pinedo (2012) Bravo, E., & Martínez-Pinedo, G. 2012, Phys. Rev. C, 85, 55805. http://link.aps.org/doi/10.1103/PhysRevC.85.055805
- Chen et al. (1995) Chen, W., Gehrels, N., & Diehl, R. 1995, Astrophys. J., 440, L57. http://adsabs.harvard.edu/doi/10.1086/187760
- Chieffi & Limongi (2013) Chieffi, A., & Limongi, M. 2013, The Astrophysical Journal, 764, 21
- Cybert et al. (2010) Cybert, R. H., Amthor, A. M., Ferguson, R., et al. 2010, Astrophys. J. Suppl. Ser., 189, 240. http://stacks.iop.org/0067-0049/189/i=1/a=240
- Diehl et al. (2013) Diehl, R., Alexander, F., Krause, M., et al. 2013, Proc. Sci., arXiv:1307.4190. http://arxiv.org/abs/1307.4190
- Eggenberger et al. (2008) Eggenberger, P., Meynet, G., Maeder, A., et al. 2008, Astrophys. Space Sci., 316, 43. http://link.springer.com/10.1007/s10509-007-9511-y
- Howard et al. (2015) Howard, A. M., Munch, M., Fynbo, H. O. U., et al. 2015, Phys. Rev. Lett., 115, 052701. http://journals.aps.org/prl/abstract/10.1103/PhysRevLett.115.052701
- Iliadis et al. (2011) Iliadis, C., Champagne, A., Chieffi, A., & Limongi, M. 2011, Astrophys. J. Suppl. Ser., 193, 16. http://iopscience.iop.org/0067-0049/193/1/16/article/
- Kobayashi et al. (2011) Kobayashi, C., Karakas, A. I., & Umeda, H. 2011, Monthly Notices of the Royal Astronomical Society, 414, 3231. https://doi.org/10.1111/j.1365-2966.2011.18621.x
- Kuperus (1964) Kuperus, J. 1964, Physica, 30, 2253. http://www.sciencedirect.com/science/article/pii/0031891464900527
- Limongi & Chieffi (2003) Limongi, M., & Chieffi, A. 2003, ApJ, 592, 404
- Limongi & Chieffi (2006) Limongi, M., & Chieffi, A. 2006, Astrophys. J., 647, 63. http://stacks.iop.org/0004-637X/647/i=1/a=483http://arxiv.org/abs/astro-ph/0604297
- Lugaro et al. (2018) Lugaro, M., Ott, U., & Kereszturi, Á. 2018, Progress in Particle and Nuclear Physics, 102, 1
- Mohr (2015) Mohr, P. 2015, Eur. Phys. J. A, 51, doi:10.1140/epja/i2015-15056-5. http://dx.doi.org/10.1140/epja/i2015-15056-5
- Parikh et al. (2013a) Parikh, A., José, J., Seitenzahl, I. R., & Röpke, F. K. 2013a, A&A, 557, A3. https://www.aanda.org/articles/aa/pdf/2013/09/aa21518-13.pdf
- Parikh et al. (2013b) Parikh, A., José, J., Sala, G., & Iliadis, C. 2013b, Progress in Particle and Nuclear Physics, 69, 225 . http://www.sciencedirect.com/science/article/pii/S0146641012001354
- Pignatari & Herwig (2012) Pignatari, M., & Herwig, F. 2012, Nucl. Phys. News, 22, 18. http://dx.doi.org/10.1080/10619127.2012.710142
- Pignatari et al. (2016) Pignatari, M., Herwig, F., Hirschi, R., et al. 2016, Astrophys. J. Suppl. Ser., 225, 24. http://iopscience.iop.org/article/10.3847/0067-0049/225/2/24/pdf
- Rauscher (2003) Rauscher, T. 2003, exp2rate, , . http://download.nucastro.org/codes/exp2rate.f90
- Rauscher & Thielemann (2000) Rauscher, T., & Thielemann, F.-K. 2000, At. Data Nucl. Data Tables, 75, 1. http://www.sciencedirect.com/science/article/pii/S0092640X00908349http://linkinghub.elsevier.com/retrieve/pii/S0092640X00908349
- Sallaska et al. (2013) Sallaska, A. L., Iliadis, C., Champange, A. E., et al. 2013, The Astrophysical Journal Supplement Series, 207, 18. https://doi.org/10.1088/0067-0049/207/1/18
- Smith et al. (2004) Smith, M., Lingerfelt, E., Nesaraja, C., & Smith, C. 2004, Computation Infrastructure for Nuclear Astrophysics, nucastrodata. http://www.nucastrodata.org/infrastructure.html
- Sukhbold et al. (2016) Sukhbold, T., Ertl, T., Woosley, S. E., Brown, J. M., & Janka, H. T. 2016, ApJ, 821, 38
- Timmes et al. (1995) Timmes, F. X., Woosley, S. E., & Weaver, T. A. 1995, Astrophys. J. Suppl. Ser., 98, 617. http://adsabs.harvard.edu/doi/10.1086/192172
- Tomlinson et al. (2015) Tomlinson, J. R., Fallis, J., Laird, A. M., et al. 2015, Phys. Rev. Lett., 115, 052702. http://journals.aps.org/prl/abstract/10.1103/PhysRevLett.115.052702
- Whitmire & Davids (1974) Whitmire, D. P., & Davids, C. N. 1974, Phys. Rev. C, 9, 996. http://link.aps.org/doi/10.1103/PhysRevC.9.996
- Woosley et al. (2002) Woosley, S. E., Heger, A., & Weaver, T. A. 2002, Reviews of Modern Physics, 74, 1015