Spatially inhomogeneous superconductivity in UTe2
Abstract
Newly-discovered superconductor UTe2 is a strong contender for a topological spin-triplet state wherein a multi-component order parameter arises from two nearly-degenerate superconducting states. A key issue is whether both of these states intrinsically exist at ambient pressure. Through thermal expansion and calorimetry, we show that UTe2 at ambient conditions exhibits two detectable transitions only in some samples, and the size of the thermal expansion jump at each transition varies when the measurement is performed in different regions of the sample. This result indicates that the two transitions arise from two spatially separated regions that are inhomogeneously mixed throughout the volume of the sample, each with a discrete superconducting transition temperature (Tc). Notably, samples with higher Tc only show a single transition at ambient pressure. Above 0.3 GPa, however, two transitions are invariably observed in ac calorimetry. Our results not only point to a nearly vertical line in the pressure-temperature phase diagram but also provide a unified scenario for the sample dependence of UTe2.
UTe2 is a recently discovered superconductor that exhibits many intriguing properties. Even though UTe2 does not exhibit long-range magnetic order above 25 mK, initial reports placed UTe2 as a new example of a spin-triplet superconductor due to an upper critical field (Hc2) exceeding 30 T and scaling of the magnetization indicating proximity to a ferromagnetic quantum critical point [1, 2, 3]. Importantly, superconductivity in UTe2 may be topological. Asymmetric tunneling was observed across step edges in scanning tunneling microscopy, consistent with chiral superconductivity [4]. Polar Kerr effect measurements combined with theoretical modelling revealed that the superconducting order parameter breaks time-reversal symmetry and is likely to contain Weyl nodes [5]. More recently, magnetic penetration depth measurements revealed temperature scaling consistent with a multi-component spin-triplet state [6].
UTe2 also exhibits striking phase diagrams as a function of applied pressure and magnetic fields. For instance, re-entrant superconductivity is observed for field applied in the orthorhombic plane, whereas a metamagnetic transition occurs near 30 T for fields parallel to the axis [7, 8, 9]. Under pressure, UTe2 remains equally puzzling, and a complete agreement between the many reports has yet to be reached. One common aspect is the existence of multiple superconducting transitions under pressures above about 0.3 GPa [10, 11, 12, 13, 14]. One superconducting transition (Tc1) reaches a maximum of about 3 K at a pressure near 1.2 GPa, and a second superconducting transition (Tc2) is suppressed monotonically with pressure. Above 1.2 GPa, Tc1 is rapidly suppressed and a new non-superconducting ordered phase emerges. Though this phase was initially thought to be the ferromagnetic state responsible for fluctuations leading to spin-triplet superconductivity at zero pressure, more recent reports argue for antiferromagnetic order under pressure due to the presence of two magnetic phase transitions as a function of temperature and their suppression as a function of all applied field directions [13, 14]. Magnetic susceptibility and magnetization measurement under pressure provided further support for antiferromagnetic order above 1.2 GPa [15]. Neutron measurements found that inelastic scattering is dominated by incommensurate spin fluctuations [16, 17] in spite of muon spin resonance and nuclear magnetic resonance experiments arguing for ferromagnetic fluctuations [3, 18]. It was later argued that antiferromagnetic fluctuations may be responsible for superconductivity in UTe2 [19].
A key point of contention is the low-pressure region of the phase diagram. Whether two superconducting transitions exist at ambient pressure or inhomogeneities drive a split transition remains an open question. On one hand, two nearby transitions were observed in heat capacity by Hayes et al, and the Kerr effect sets in only at temperatures below the lower temperature transition [5]. On the other hand, a composition dependence study argued that the highest quality samples only show a single transition in heat capacity [20]. A two-component order parameter, however, is necessary for the proposed Weyl superconductivity and non-zero Kerr effect. Because of the orthorhombic structure of UTe2, there is no underlying symmetry argument for the existence of a two-component order parameter, and the existence of two nearby transitions would therefore be accidental.
Here, we report thermal expansion, magnetostriction, and heat capacity measurements on a number of UTe2 samples obtained from separate growths to show that growth conditions may lead to two discrete transitions arising from an unusual form of sample inhomogeneity. In this case, we find clear evidence for two nearby transitions in heat capacity measurements, which are accompanied by jumps in the thermal expansion coefficient. The relative size of these jumps varies as the measurement is performed on different volumes of the sample, either via thermal expansion or calorimetry measurements. Importantly, samples with higher Tc only show a single transition at ambient pressure, but all samples measured under applied pressure show at least two detectable superconducting transitions above a threshold pressure. In samples that show multiple transitions at ambient pressure, a reevaluation of the initial pressure work found that the two transitions at ambient pressure have the same pressure dependence (see erratum to Ref. [14]).
Though we cannot unambiguously rule out the possibility of a multi-component order parameter at ambient pressure for samples with higher Tc, our results show no evidence for a second thermodynamic transition below 0.3 GPa. Because all irreducible representations in UTe2 are one-dimensional, there are only two possibilities for such a scenario: (1) both the transition temperatures and hydrostatic pressure dependence of the two transitions are accidentally degenerate, or (2) the lower temperature transition has zero entropy up to 0.3 GPa at which point it can be observed in thermodynamic measurements. Such unlikely scenarios require exceptional fine tuning, which leaves us with the possibility of a nearly vertical line in the pressure-temperature phase diagram.
Samples of UTe2 were grown using the vapor transport method [1, 20]. About twenty batches were grown, and representative samples from many different batches were used in this study. Samples grown at higher temperatures (i.e., 1060∘C-1000∘C gradient, sample 2) were more likely to show a split transition than samples grown at lower temperatures (e.g., 950∘C-860∘C gradient, sample 1). Heat capacity measurements were performed down to 3He temperatures using the quasi-adiabatic relaxation technique. Thermal expansion and magnetostriction measurements were performed using a capacitance dilatometer described in Ref. [21] in both 4He and adiabatic demagnetization cryostats. All thermal expansion measurements were performed using a slow continuous temperature ramp, whereas all magnetostriction measurements were performed by stabilizing the field to avoid the influence of eddy currents. Thermal expansion data were corrected by performing a background subtraction of the cell effect under identical thermal conditions. Ac calorimetry measurements [22] were performed in a piston clamp pressure cell. Samples with the same number (1A/1B and 2A/2B) came from the same batch and showed similar zero-pressure heat capacity data.
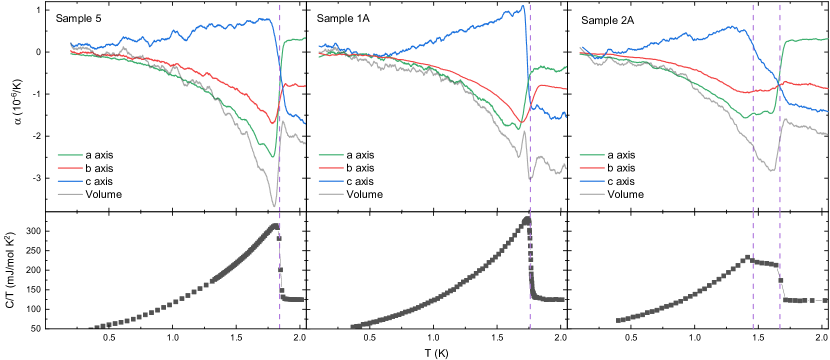
Figure 1 shows a comparison of thermal expansion and heat capacity between three samples grown under different conditions (for additional samples see Supplemental Fig. S1). Sample 5 and sample 1A show a single transition at K and K, respectively. Sample 2A shows two transitions at K and K. The difference between these samples highlights the key role of growth conditions on the ambient pressure properties of UTe2.
Importantly, even samples with similar Tc may have different properties. For instance, samples 5 and 1A have similar heat capacity behavior; however, sample 1A has an unusual negative thermal expansion along the axis above Tc. Of all the samples measured, sample 1A is the only sample that has for . As will be discussed below, this may indicate a reduced effect of -axis magnetic fluctuations in this sample.
Volume thermal expansion can be used to determine the pressure dependence of a second order phase transition through the Ehrenfest relation:
| (1) |
Here, is pressure, is the jump in volume thermal expansion at the phase transition, and is the jump in heat capacity. Because is always positive, the sign of the pressure dependence is determined by the sign of the jump in volume thermal expansion. Due to slight temperature offsets when measuring thermal expansion along different axes, volume thermal expansion jumps were calculated by summing the linear thermal expansion jumps at each phase transition rather than from the volume data. The results are tabulated in Supplemental Table S1. Using this relation, sample 5 is expected to have a pressure dependence of approximately = K/GPa. This suppression rate agrees well with the pressure dependence of Tc determined from pressure-dependent ac calorimetry measurements (approximately K/GPa for P 0.3 GPa). In contrast, the Ehrenfest relation underestimates the pressure dependence of due to the unusual -axis behavior of sample 1A ( K/GPa).
Now we turn to the double transition in sample 2A. Using the data from Fig. 1, Ehrenfest predicts opposite pressure dependence for the two transitions. The lower transition has = K/GPa and the higher transition has = K/GPa. This pressure dependence is most likely incorrect. It was recently shown that for samples with two transitions at ambient pressure, the transitions actually have identical pressure dependence (see erratum to Ref. [14]). The reason for this inconsistency is that the quasi-adiabatic heat capacity measurement probes the entire volume of the sample, but the thermal expansion fixture used here will only probe a local volume of the sample when the sample is measured along its thinnest axis. For sample 2A, the axis has a thickness of 300–360 m compared to 2635 m and 680 m for the and axes, respectively.
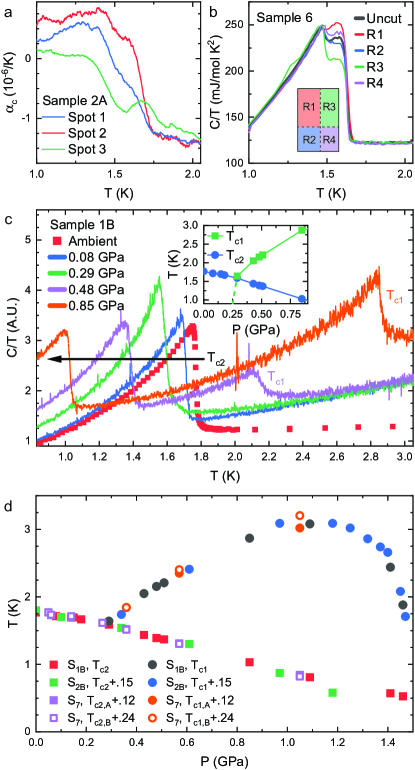
To further unveil this issue, Fig. 2(a) shows the -axis thermal expansion measured on multiple spots of sample 2A. Spot 1 is the same location that was measured in Fig. 1. Compared to spot 1, spot 2 has a larger contribution from the higher-temperature transition and a much smaller contribution from the lower temperature transition. Spot 3 has the opposite weighting between the two transitions. As a result, the pressure dependence determined from Ehrenfest completely changes based on which location on the sample is used to perform the calculation. Spot 2 is the only location that predicts a negative pressure dependence for both transitions, in agreement with pressure-dependent ac calorimetry data [14].
The inhomogeneity of the double transition feature is further demonstrated by the heat capacity measurements shown in Fig. 2(b). Here, a sample showing two transitions was cut into four quadrants. The heat capacity of each quadrant was then measured individually. Remarkably, at temperatures outside the transition region, all four pieces have the same heat capacity. Near the transition, however, there is a clear difference in the weighting between the two transitions. Of the four regions, R3 has the largest percentage of the volume containing the lower temperature transition.

The reason for the presence of exactly two transitions remains unknown, but our results indicate that the double transition feature at ambient pressure stems from sample inhomogeneity. Under pressure, however, the two transitions that appear for pressures above 0.3 GPa are an intrinsic feature of UTe2 observed in all samples measured by multiple groups [10, 11, 12, 13, 14]. To confirm this, we performed pressure-dependent ac calorimetry measurements on a sample showing only a single transition at ambient pressure (sample 1B). The individual heat capacity curves from these measurements are shown in Fig. 2(c), and the pressure-temperature phase diagram is summarized in the inset. Similar to all other samples measured under pressure , sample 1B shows clear evidence for two superconducting transitions as pressure is increased beyond 0.3 GPa. We note that a pressure-temperature phase diagram in which three second order phase transition lines meet at a single point is not thermodynamically allowed except in very unique circumstances [23, 10], and the dashed line in the inset of Fig. 2(c) is meant to represent this missing transition. Such a tetracritical point has been extensively investigated in UPt3 [24].
Remarkably, although samples may have different Tc at ambient pressure, all samples follow the exact same pressure-temperature phase diagram, as shown in Fig. 2(d). This unified diagram is obtained by simply shifting Tc vertically to match a common value at zero pressure (i.e., 1.8 K). This suggests that the main effect of disorder is to suppress Tc and cause a split transition in some samples. This also reinforces that the splitting of the transition at 0.3 GPa is an intrinsic feature as it is observed in all samples measured to-date.
Thermal expansion to higher temperatures can provide information about the relevant energy scales in the system. Figure 3 shows the linear thermal expansion for sample 2A measured up to 200 K. At high temperatures, the thermal expansion is typically dominated by phonons. Because the non-magnetic analogue ThTe2 has been reported to have a different crystal structure from UTe2 [25], it is not possible to subtract an independently determined phonon background. Nonetheless, all three thermal expansion contributions become negative below 30 K indicating a regime wherein the phonon contribution is no longer relevant. Negative thermal expansion is typically attributed to the Kondo effect, and this temperature is consistent with the Kondo temperature (20–26 K) extracted from scanning tunneling spectroscopy measurements [4]. Expansion along the a-axis shows a third energy scale, switching again from negative to positive at 11 K. This is likely due to the presence of strong magnetic fluctuations along the axis, in agreement with previous reports [1, 3, 18]. While samples 2–5 all exhibit positive thermal expansion along the axis just above the highest temperature superconducting transition, sample 1A has negative thermal expansion along . This may point to a difference in the strength or type of magnetic fluctuations along the axis that is also influenced by differences in growth conditions.
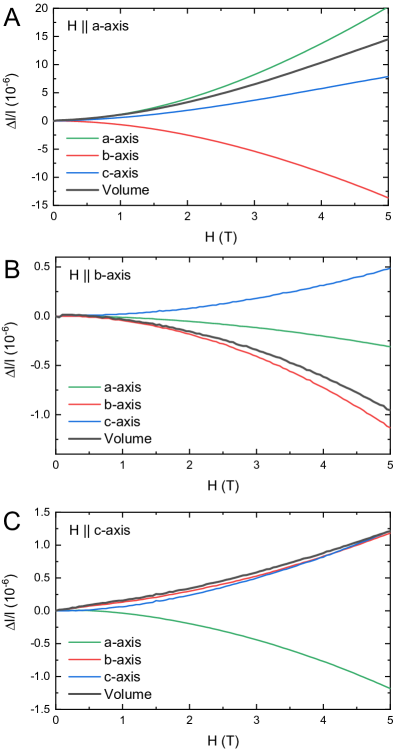
Figure 4 shows the longitudinal and transverse magnetostriction measured at 2 K on sample 3 along the principal crystallographic directions. Note that the response for fields parallel to the axis is an order of magnitude larger than along the other axes. This means that even a small field component parallel to the axis will significantly affect measurements when applying field along other directions. For longitudinal measurements, the sample was aligned to less than one degree using Laue diffraction. For transverse measurements, the rotation of the sample in the dilatometer cell was performed manually so the alignment errors may be up to five degrees and introduce an error in measurements for fields perpendicular to the a-axis.
Volume magnetostriction can be used to determine the pressure dependence of the magnetic susceptibility via Maxwell’s relation [26]:
| (2) |
At ambient pressure, the axis is the easy magnetic axis and the axis is the hard magnetic axis [1]. Importantly, the volume magnetostriction for fields parallel to the axis indicates a relatively large negative pressure dependence of the axis susceptibility. This is consistent with a recent tight-binding model for UTe2, which found a large initial decrease in susceptibility along the axis coupled with a change in the fluctuations from ferromagnetic to antiferromagnetic [27]. Further, the volume increase for fields along the axis taken with the decrease for fields along the axis suggests the possibility that the hard magnetic axis changes from the axis to axis. This has previously been claimed based on the fact that Hc2 becomes largest along the axis near 1.5 GPa [12]. More recently, it was experimentally confirmed via susceptibility measurements under pressure [15]. The magnetic interactions at high pressure are quite different from those at low pressure, which explains the emergence of two magnetic transitions and antiferromagnetic order. In fact, the axis becomes the easy axis in the magnetically ordered state [15]. We also highlight the possibility that samples from different batches may exhibit different magnetic properties even at ambient pressure. This follows from the fact that sample 1A has a different sign of just above Tc2 compared to samples 2–4, as noted above. Thus, it is critical to fully characterize each single crystal of UTe2.
In conclusion, the combination of thermal expansion and heat capacity shows evidence for two superconducting transitions at ambient pressure only in some UTe2 samples. Our results indicate that the double transition is due to different Tc’s in spatially separated volumes of the sample that are inhomogenously distributed. This in turn implies that these two transitions do not arise from a multi-component order parameter. If UTe2 possesses a multi-component order parameter at ambient pressure, it must be detected through other means, as evidence for two transitions in thermodynamic data is misleading in this material. Nonetheless, all samples measured to-date show clear evidence for a splitting of Tc under pressure, which strongly suggests that this feature is intrinsic. Our magnetostriction data also agree with recent theoretical and experimental work that argues for a change in the nature of the magnetic interactions under pressure. Our results reveal that subtleties in sample growth play a large role in both superconductivity and magnetic fluctuations in UTe2. Detecting the lower temperature transition for pressures below 0.3 GPa will play a major role in illuminating the nature of the superconducting state at ambient pressure. The origin of the sample dependence in UTe2 may be related to structural changes, strain, or stoichiometry variations, and this topic also needs to be further investigated in the near future.
Acknowledgements.
We would like to thank N. Harrison, M. Jaime, and R. M. Fernandes for useful discussions as well as L. Gonzales for assistance running experiments. Thermal expansion and magnetostriction measurements were supported by the U.S. Department of Energy, Office of Basic Energy Sciences, Division of Materials Science and Engineering project “Quantum Fluctuations in Narrow-Band Systems.” Sample synthesis at Los Alamos was performed with support from the U.S. Department of Energy, Office of Science, National Quantum Information Science Research Centers, Quantum Science Center. Pressure-dependent measurements were supported by the Laboratory Directed Research and Development program 20210064DR. C. Stevens and A. Huxley acknowledge support from UK-EPSRC grant EP/P013686/1. F.B. Santos was supported by FAPESP under grants No. 2016/11565-7 and 2018/20546-1.References
- Ran et al. [2019a] S. Ran, C. Eckberg, Q.-P. Ding, Y. Furukawa, T. Metz, S. R. Saha, I.-L. Liu, M. Zic, H. Kim, J. Paglione, and N. P. Butch, Nearly ferromagnetic spin-triplet superconductivity, Science 365, 684 (2019a).
- Aoki et al. [2019] D. Aoki, A. Nakamura, F. Honda, D. Li, Y. Homma, Y. Shimizu, Y. J. Sato, G. Knebel, J.-P. Brison, A. Pourret, D. Braithwaite, G. Lapertot, Q. Niu, M. Vališka, H. Harima, and J. Flouquet, Unconventional Superconductivity in Heavy Fermion UTe2, J. Phys. Soc. Japan 88, 043702 (2019), arXiv:1903.02410 .
- Sundar et al. [2019] S. Sundar, S. Gheidi, K. Akintola, A. M. Cote, S. R. Dunsiger, S. Ran, N. P. Butch, S. R. Saha, J. Paglione, and J. E. Sonier, Coexistence of ferromagnetic fluctuations and superconductivity in the actinide superconductor UTe2, Phys. Rev. B 100, 140502 (2019), arXiv:1905.06901 .
- Jiao et al. [2020] L. Jiao, S. Howard, S. Ran, Z. Wang, J. O. Rodriguez, M. Sigrist, Z. Wang, N. P. Butch, and V. Madhavan, Chiral superconductivity in heavy-fermion metal UTe2, Nature 579, 523 (2020), arXiv:1908.02846 .
- Hayes et al. [2021] I. M. Hayes, D. S. Wei, T. Metz, J. Zhang, Y. S. Eo, S. Ran, S. R. Saha, J. Collini, N. P. Butch, D. F. Agterberg, A. Kapitulnik, and J. Paglione, Multicomponent superconducting order parameter in UTe 2, Science , eabb0272 (2021), arXiv:2002.02539 .
- Ishihara et al. [2021] K. Ishihara, M. Roppongi, M. Kobayashi, Y. Mizukami, H. Sakai, Y. Haga, K. Hashimoto, and T. Shibauchi, Chiral superconductivity in UTe2 probed by anisotropic low-energy excitations, arXiv , 1 (2021), arXiv:2105.13721 .
- Ran et al. [2019b] S. Ran, I.-L. Liu, Y. S. Eo, D. J. Campbell, P. M. Neves, W. T. Fuhrman, S. R. Saha, C. Eckberg, H. Kim, D. Graf, F. Balakirev, J. Singleton, J. Paglione, and N. P. Butch, Extreme magnetic field-boosted superconductivity, Nat. Phys. 15, 1250 (2019b), arXiv:1905.04343 .
- Knebel et al. [2019] G. Knebel, W. Knafo, A. Pourret, Q. Niu, M. Vališka, D. Braithwaite, G. Lapertot, M. Nardone, A. Zitouni, S. Mishra, I. Sheikin, G. Seyfarth, J.-P. Brison, D. Aoki, and J. Flouquet, Field-Reentrant Superconductivity Close to a Metamagnetic Transition in the Heavy-Fermion Superconductor UTe2, J. Phys. Soc. Japan 88, 063707 (2019), arXiv:1905.05181 .
- Knafo et al. [2020] W. Knafo, M. Nardone, M. Valiska, A. Zitouni, G. Lapertot, D. Aoki, G. Knebel, and D. Braithwaite, Comparison of two superconducting phases induced by a magnetic field in UTe2, arXiv (2020), arXiv:2007.06009 .
- Braithwaite et al. [2019] D. Braithwaite, M. Vališka, G. Knebel, G. Lapertot, J.-P. Brison, A. Pourret, M. E. Zhitomirsky, J. Flouquet, F. Honda, and D. Aoki, Multiple superconducting phases in a nearly ferromagnetic system, Commun. Phys. 2, 147 (2019).
- Ran et al. [2020] S. Ran, H. Kim, I.-L. Liu, S. R. Saha, I. Hayes, T. Metz, Y. S. Eo, J. Paglione, and N. P. Butch, Enhancement and reentrance of spin triplet superconductivity in UTe2 under pressure, Phys. Rev. B 101, 140503 (2020), arXiv:1909.06932 .
- Knebel et al. [2020] G. Knebel, M. Kimata, M. Vališka, F. Honda, D. Li, D. Braithwaite, G. Lapertot, W. Knafo, A. Pourret, Y. J. Sato, Y. Shimizu, T. Kihara, J.-P. Brison, J. Flouquet, and D. Aoki, Anisotropy of the Upper Critical Field in the Heavy-Fermion Superconductor UTe 2 under Pressure, J. Phys. Soc. Japan 89, 053707 (2020), arXiv:2003.08728 .
- Aoki et al. [2020] D. Aoki, F. Honda, G. Knebel, D. Braithwaite, A. Nakamura, D. Li, Y. Homma, Y. Shimizu, Y. J. Sato, J.-P. Brison, and J. Flouquet, Multiple Superconducting Phases and Unusual Enhancement of the Upper Critical Field in UTe2, J. Phys. Soc. Japan 89, 053705 (2020), arXiv:2003.09782 .
- Thomas et al. [2020] S. M. Thomas, F. B. Santos, M. H. Christensen, T. Asaba, F. Ronning, J. D. Thompson, E. D. Bauer, R. M. Fernandes, G. Fabbris, and P. F. S. Rosa, Evidence for a pressure-induced antiferromagnetic quantum critical point in intermediate-valence UTe 2, Sci. Adv. 6, eabc8709 (2020), arXiv:2005.01659 .
- Li et al. [2021] D. Li, A. Nakamura, F. Honda, Y. J. Sato, Y. Homma, Y. Shimizu, J. Ishizuka, Y. Yanase, G. Knebel, J. Flouquet, and D. Aoki, Magnetic Properties under Pressure in Novel Spin-Triplet Superconductor UTe2, J. Phys. Soc. Japan 90, 073703 (2021), arXiv:2105.08593 .
- Duan et al. [2020] C. Duan, K. Sasmal, M. B. Maple, A. Podlesnyak, J.-X. Zhu, Q. Si, and P. Dai, Incommensurate Spin Fluctuations in the Spin-Triplet Superconductor Candidate UTe2, Phys. Rev. Lett. 125, 237003 (2020), arXiv:2008.12377 .
- Knafo et al. [2021] W. Knafo, G. Knebel, P. Steffens, K. Kaneko, A. Rosuel, J. P. Brison, J. Flouquet, D. Aoki, G. Lapertot, and S. Raymond, Low-dimensional antiferromagnetic fluctuations in the heavy-fermion paramagnetic ladder UTe$_2$, arXiv (2021), arXiv:2106.13087 .
- Tokunaga et al. [2019] Y. Tokunaga, H. Sakai, S. Kambe, T. Hattori, N. Higa, G. Nakamine, S. Kitagawa, K. Ishida, A. Nakamura, Y. Shimizu, Y. Homma, D. X. Li, F. Honda, and D. Aoki, 125Te-NMR study on a single crystal of heavy fermion superconductor Ute2, J. Phys. Soc. Japan 88, 073701 (2019), arXiv:1906.01303 .
- Duan et al. [2021] C. Duan, R. E. Baumbach, A. Podlesnyak, Y. Deng, C. Moir, A. J. Breindel, M. B. Maple, and P. Dai, Resonance from antiferromagnetic spin fluctuations for spin-triplet superconductivity in UTe$_2$, arXiv (2021), arXiv:2106.14424 .
- Cairns et al. [2020] L. P. Cairns, C. Stevens, C. O’Neill, and A. Huxley, Composition Dependence of the Superconducting Properties of UTe2, J. Phys. Condens. Matter , 0 (2020).
- Schmiedeshoff et al. [2006] G. M. Schmiedeshoff, A. W. Lounsbury, D. J. Luna, S. J. Tracy, A. J. Schramm, S. W. Tozer, V. F. Correa, S. T. Hannahs, T. P. Murphy, E. C. Palm, A. H. Lacerda, S. L. Bud’Ko, P. C. Canfield, J. L. Smith, J. C. Lashley, and J. C. Cooley, Versatile and compact capacitive dilatometer, Rev. Sci. Instrum. 77, 10.1063/1.2403088 (2006), arXiv:0610396 [cond-mat] .
- Sullivan and Seidel [1968] P. F. Sullivan and G. Seidel, Steady-State, ac-Temperature Calorimetry, Phys. Rev. 173, 679 (1968).
- Yip et al. [1991] S. K. Yip, T. Li, and P. Kumar, Thermodynamic considerations and the phase diagram of superconducting UPt3, Phys. Rev. B 43, 2742 (1991).
- Sauls [1994] J. Sauls, The order parameter for the superconducting phases of UPt 3, Adv. Phys. 43, 113 (1994).
- Koscielski et al. [2012] L. A. Koscielski, E. Ringe, R. P. Van Duyne, D. E. Ellis, and J. A. Ibers, Single-Crystal Structures, Optical Absorptions, and Electronic Distributions of Thorium Oxychalcogenides ThOQ (Q = S, Se, Te), Inorg. Chem. 51, 8112 (2012).
- Fawcett [1970] E. Fawcett, Magnetostriction of Paramagnetic Transition Metals. I. Group 4 - Ti and Zr; Group 5 - V, Nb, and Ta; Group 6 - Mo and W, Phys. Rev. B 2, 1604 (1970).
- Ishizuka and Yanase [2020] J. Ishizuka and Y. Yanase, A Periodic Anderson Model for Magnetism and Superconductivity in UTe2, arXiv 2, 1 (2020), arXiv:2008.01945 .