ALMA–IRDC II. First high-angular resolution measurements of the 14N/15N ratio in a large sample of infrared-dark cloud cores
Abstract
The 14N/15N ratio in molecules exhibits a large variation in star-forming regions, especially when measured from N2H+ isotopologues. However, there are only a few studies performed at high-angular resolution. We present the first interferometric survey of the 14N/15N ratio in N2H+ obtained with Atacama Large Millimeter Array observations towards four infrared-dark clouds harbouring 3 mm continuum cores associated with different physical properties. We detect N15NH+ (1–0) in of the cores, depending on the host cloud. The 14N/15N values measured towards the millimeter continuum cores range from a minimum of up to a maximum of . The spread of values is narrower than that found in any previous single-dish survey of high-mass star-forming regions, and than that obtained using the total power data only. This suggests that the 14N/15N ratio is on average higher in the diffuse gaseous envelope of the cores, and stresses the need for high-angular resolution maps to measure correctly the 14N/15N ratio in dense cores embedded in IRDCs. The average 14N/15N ratio of is also lower than the interstellar value at the Galactocentric distance of the clouds (), although the sensitivity of our observations does not allow us to unveil 14N/15N ratios higher than . No clear trend is found between the 14N/15N ratio and the core physical properties. We find only a tentative positive trend between 14N/15N and H2 column density. However, firmer conclusions can be drawn only with higher sensitivity measurements.
keywords:
Stars: formation – ISM: clouds – ISM: molecules – Radio lines: ISM1 Introduction
Nitrogen, the fifth most abundant element in the universe, has two stable isotopes: 14N and 15N. In the Solar System, the nitrogen isotopic fraction, 14N/15N, shows variations of an order of magnitude, from in carbonaceous chondrites (Bonal et al. 2010) to in comets (Bockelée-Morvan et al. 2008, Manfroid et al. 2009, Shinnaka et al. 2016), up to in the atmosphere of Jupiter (Fouchet et al. 2004) and in the Solar wind (, Marty et al. 2010). The latter, in particular, is believed to represent the proto-Solar nebula (PSN) value (Füri & Marty 2015). This indicates an enrichment in 15N in pristine Solar System small bodies, but the causes of this enrichment, and in particular its relation with the chemical evolution of the PSN, are not yet understood.
In the past, a popular explanation for the 15N enrichment has been the isotopic exchange reactions occurring at low temperatures (Terzieva & Herbst 2000, Rodgers & Charnley 2008), similar to those at the origin of molecular deuterium enrichment in cold dense cores (e.g. Ceccarelli et al. 2014 and references in there). This explanation has been challenged by theoretical works which have excluded low temperature reactions as the main way to enhance 15N in molecular species (e.g. Wirström et al. 2012, Roueff et al. 2015, Wirström & Charnley 2018, Loison et al. 2019), and have also excluded significant nitrogen fractionation (both 15N enrichment and depletion) in the most abundant molecules during the chemical evolution of a star-forming core. Significant variations in nitrogen fractionation are theoretically predicted only in extragalactic environments strongly affected by high fluxes of cosmic rays (Viti et al. 2019). However, these predictions are at odds with the large variations of 14N/15N measured in star-forming cores. In fact, in low-mass pre-stellar cores the 14N/15N ratio measured from N2H+ varies from (Daniel et al. 2013, 2016) to (Bizzocchi et al. 2013, Redaelli et al. 2018, De Simone et al. 2018, Furuya et al. 2018), namely up to more than twice the PSN value, indicating a depletion rather than an enrichment of 15N. This depletion has been proposed to be due to the transition from atomic to molecular nitrogen in the earlier evolutionary stage of the cores by Furuya & Aikawa (2018), although their models are not able to reach the antifractionation levels measured in pre-stellar cores. Some works (Loison et al. 2019, Hily-Blant et al. 2020) propose that only a different dissociative recombination rate for N2H+ and N15NH+ could solve the problem and reconcile observations with chemical models, although it is hard to understand what could cause the different rate for the two species. On the other hand, in CN and HCN the 14N/15N ratio seems more consistent with the PSN value (Hily-Blant et al. 2013a, 2013b). In protoplanetary disks, the 14N/15N is found to be (Guzmán et al. 2017) from observations of HCN isotopologues, while in TW Hya from CN is (Hily-Blant et al. 2017), i.e. in between the PSN and the cometary values. Overall, these findings suggest a high variability of the 14N/15N ratio, which depends on both the evolutionary stage of the source and the molecule observed.
Besides low-mass star-forming cores, a growing observational effort has been devoted to the study of the 14N/15N ratio in high-mass star-forming regions, based on the evidence that the Sun was likely born in a crowded stellar cluster including stars more massive than M⊙ (e.g. Adams 2010, Pfalzner et al. 2015, Lichtenberg et al. 2019). Traces of the interaction between these stars and the primordial Solar System are recorded in meteoritic material, where anomalous high abundances of daughter species of Short-Lived Radionucleides (SLRs), produced by nearby high-mass stars and ejected during the early evolution of the Solar System, are measured (e.g. Portegies Zwart et al. 2018). Therefore, the birthplaces of massive stars and clusters are ideal targets to investigate the relation between the 15N enrichment in pristine Solar System material and its birth environment.
Even in this case, single-dish surveys of massive star-forming regions indicate large variations in the 14N/15N ratio. The highest variability is found, again, in N2H+ (, Fontani et al. 2015), while values distributed in between the cometary values and the PSN one are found in CN, HCN, and HNC (Adande & Ziurys 2012, Fontani et al. 2015, Zeng et al. 2017, Colzi et al. 2018a, 2018b). The previous studies also suggest that the evolution does not seem to play a role, in agreement with the predictions of models (e.g. Roueff et al. 2015), although they cannot predict the broad measured range of isotopic ratios. However, the observations mentioned above were obtained with single-dish telescopes, thus providing average values of the 14N/15N ratio on linear scales of pc, which can contain gas with different conditions, due to the inner physical and chemical complexity of high-mass star-forming cores. Hence, these observations could miss the presence of spots enriched (or depleted) in 15N on linear scales pc, i.e. smaller than the telescope beam.
The few follow up observations performed at high-angular resolution have indeed suggested that local gradients in the 14N/15N ratio can be found at smaller linear scales: Colzi et al. (2019) have observed the high-mass protocluster IRAS 05358+3543 with a linear resolution of pc, or au, and found that the 14N/15N ratio in N2H+ shows an enhancement of a factor (from to ) going from the inner dense core region to the diffuse, pc-scale, envelope, and interpreted these results as the consequence of selective photodissociation (Heays et al. 2014, Lee et al. 2021). The latter mechanism, due to self-shielding of 14N2, for N2H+ predicts a decrease of the 14N/15N ratio in regions exposed to external UV irradiation, as indeed found by Colzi et al. (2019). On the other hand, in embedded, not irradiated regions, the 14N/15N ratio in N2H+ should not change, and this has been recently confirmed by observations with linear resolution of au of the protocluster OMC–2 FIR4, which have revealed a constant 14N/15N in the embedded protocluster cores (Fontani et al. 2020). However, these are, at present, the only two studies performed at high-angular resolution in high-mass star-forming regions, and the results need to be corroborated by similar studies both towards other sources and in different molecules.
When investigating the birthplace of massive stars, infrared-dark clouds (IRDCs) are certainly ideal targets. IRDCs are cold ( K, Pillai et al. 2006), dense ( cm-3) and highly-extinguished ( mag and cm-2, Butler & Tan 2009, 2012) molecular clouds, first observed in extinction against the bright mid-IR Galactic background (Perault et al. 1996, Egan et al. 1998). Despite their importance for star-formation, they have been poorly investigated so far in nitrogen fractionation. Zeng et al. (2017) measured with the IRAM-30m telescope the 14N/15N towards cores belonging to four IRDCs from HCN and HNC, and found once more a large variability (14N/15N in HCN and in HNC), with the lowest values belonging to the lowest density regions. But, again, these are average values over pc linear scales that encompass gas with different physical and chemical properties. Moreover, these measurements also depend on the 13C/12C ratio, which has been found to be affected by physical conditions as well as time evolution (Colzi et al. 2020).
In this paper, we present the first interferometric study of the 14N/15N ratio towards a large sample of IRDC cores in N2H+ at high-angular resolution. The 14N/15N ratio is derived from observations of N2H+ and N15NH+ (1–0) towards the dense cores of four clouds in which the physical and chemical structure has already been extensively studied at various wavelengths, from the mid-infrared to the sub-millimeter (Butler & Tan 2009, 2012, Hernandez et al. 2011, Jiménez-Serra et al. 2014, Henshaw et al. 2014, Barnes et al. 2016), both with single-dish telescopes and interferometers, allowing us to put in relation the 14N/15N ratios with the core properties. In particular, because each core is classified as starless or star-forming within each cloud, we are also able to compare the 14N/15N ratios with the presence/absence of protostellar activity. Observations and data reduction are described in Sect. 2. The results are shown in Sect. 3, and discussed in Sect. 4. The main findings of this work, and the implications for follow-up studies are presented in Sect. 5.
2 Observations and data reduction
Observations have been performed with the Atacama Large Millimeter Array (ALMA) towards the sample of IRDCs described in Barnes et al. in prep. (hereafter paper I). The project IDs are 2017.1.00687.S and 2018.1.00850.S (PI: A.T. Barnes). We refer to that work for the complete source sample description and for any observational detail. In this paper we analyse only the four IRDCs detected in N15NH+ (1–0) listed in Table 1, in which we also give some source properties, as well as important observational parameters (angular resolution, spectral resolution, 1 rms noise in the final clean cubes). Spectroscopic parameters of the two lines analysed, i.e. N2H+ and N15NH+(1–0), are reported in Table 2, together with relevant observational parameters (i.e. sensitivity and spectral/angular resolution). Calibration, imaging, and deconvolution of the interferometric data were performed with the Common Astronomy Software Calibration (casa) package111CASA is developed by an international consortium of scientists based at the National Radio Astronomical Observatory (NRAO), the European Southern Observatory (ESO), the National Astronomical Observatory of Japan (NAOJ), the Academia Sinica Institute of Astronomy and Astrophysics (ASIAA), the CSIRO division for Astronomy and Space Science (CASS), and the Netherlands Institute for Radio Astronomy (ASTRON) under the guidance of NRAO. See https://casa.nrao.edu (McMullin et al. 2007), using the casa-pipeline (version: 5.4.0-70). Continuum subtraction was performed by taking the line-free channels around the lines in each individual spectral window (the results of the pipeline were checked), and subtracted from the data directly in the (u,v)-domain. The maximum recoverable scale was set by the size of the smallest 7m baseline of 8.9 m, which corresponds to ′′ at 93.2 GHz. Therefore, complementary total power observations were taken to recover the zero-spacing for the molecular lines. These single-dish observations were also reduced using the casa-pipeline tool (version: 5.4.0-70). The 12m, 7m, and total power observations were combined using the feather function in casa (version 4.7.0) with the default parameter set (i.e. effective dish size, single-dish scaling, and low-pass filtering of the single-dish observations). Clean cubes extracted around the lines of interest were then converted into fits format and further analysed with packages of the gildas222https://www.iram.fr/IRAMFR/GILDAS/ software. In particular, the spectra of N2H+ and N15NH+(1–0) were extracted with mapping, and analysed in the way described in Sect. 3 with class.
| cloud | ID | R.A. (J2000) | Dec. (J2000) | (a) | 1 | ||||||||
|---|---|---|---|---|---|---|---|---|---|---|---|---|---|
| km s-1 | kpc | km s-1 | ′′ | mJy beam-1 | |||||||||
| N2H+ | N15NH+ | N2H+ | N15NH+ | N2H+ | N15NH+ | ||||||||
| C | G028.37+00.07 | 18:42:50.03 | –04:03:23.4 | 78 | 5.0 | 3.5′′′′ | 3.5′′′′ | ||||||
| D | G028.53–00.25 | 18:44:16.94 | –03:59:40.8 | 86 | 5.7 | 3.8′′′′ | 3.8′′′′ | ||||||
| F | G034.43+00.24 | 18:53:18.43 | +01:27:13.5 | 57 | 3.7 | 3.9′′′′ | 4.0′′′′ | ||||||
| H | G035.39–00.33 | 18:57:09.42 | +02:08:05.4 | 43 | 2.9 | 3.4′′′′ | 3.4′′′′ | ||||||
(a) the spectral resolution of the clean cubes corresponds to twice the channel spacing ();
| transition | hyperfine | (a) | (a) | (a) | |
|---|---|---|---|---|---|
| component | MHz | K | s-1 | ||
| N2H+ (1–0) | F | 93171.88(a) | 4.47 | 9 | 3.63 |
| F | 93173.70(a) | 15 | |||
| F | 93176.13(a) | 3 | |||
| N15NH+ 1–0 | F | 91204.26(b) | 4.33 | 3 | 3.40 |
| F | 91205.99(b) | 5 | |||
| F | 91208.52(b) | 1 |
3 Results
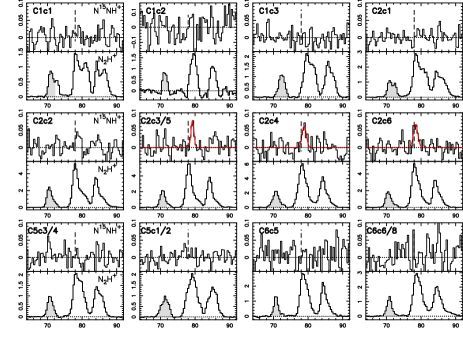
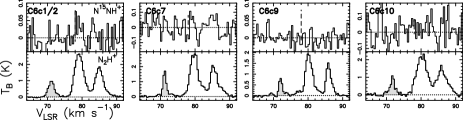
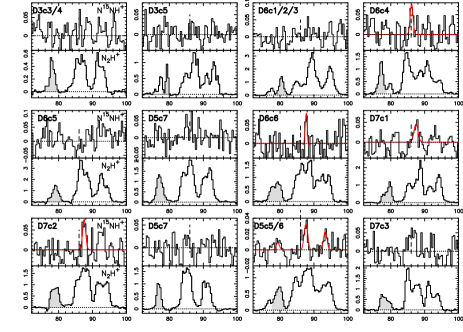
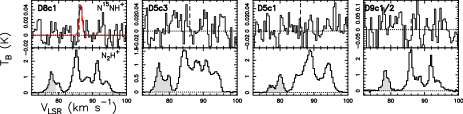
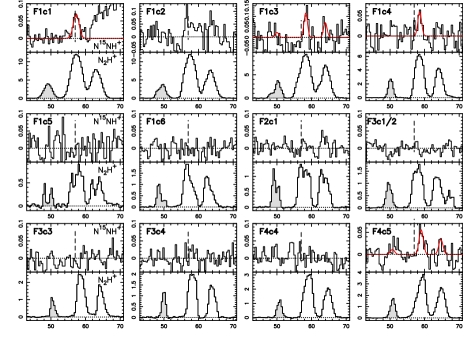
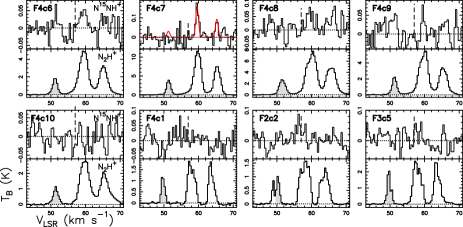
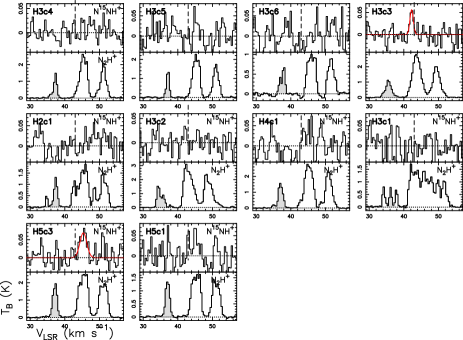
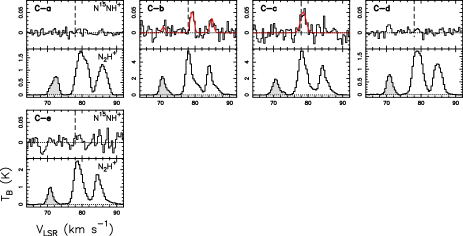
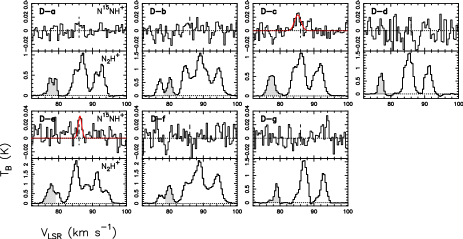
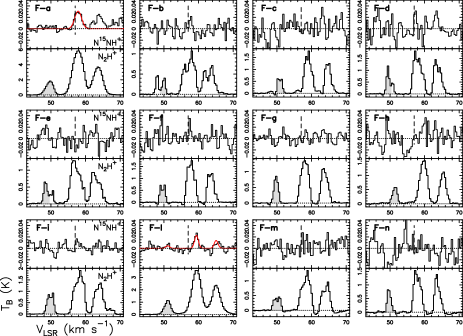
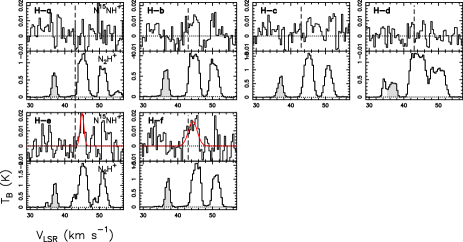
The N15NH+(1–0) has been detected towards several positions in the four clouds in Table 1 with signal-to-noise ratio in the range . The N2H+(1–0) line was clearly detected with excellent signal to noise () in all clouds (see Figs. A-1 – A-4) after smoothing to a uniform spectral resolution of km s-1. Due to the faintness of the N15NH+ lines, we do not show integrated maps of the N15NH+ emission.
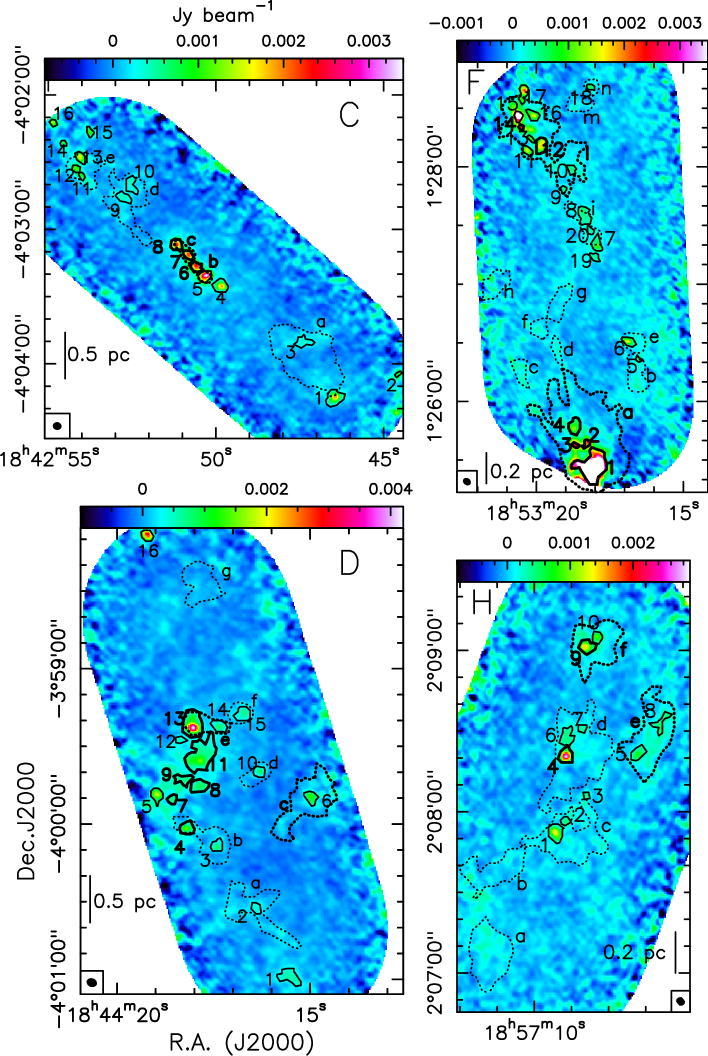
The faintness of the N15NH+ emission, and the large angular extension and morphological complexity of the target clouds, suggested us to focus the 14N/15N analysis first on the 3 mm continuum sources identified in each IRDC using the 2D dendrogram method (Rosolowsky et al. 2008). The parameter set and method for determination of the continuum dendrogram structure is described in Paper I. The continuum sources are shown in Fig. 1. We point out that the choice of the input parameters in the dendrogram analysis does not significantly affect the identification of the cores as demonstrated in paper I. These sources are well characterised from the dynamical and evolutionary point of view, and hence will allow us to discuss the 14N/15N ratio based on the core properties in Sect. 4. In particular, the cores have been classified as starless or star-forming based on the identification of an infrared source inside the core boundaries (paper I).
We also extracted and analysed spectra from the N2H+ intensity peaks to derive the 14N/15N ratio towards these peaks. These have been identified here by conducting the dendrogram analysis on the (2D) integrated intensity maps of N2H+ (see paper I). The following set of parameters are used for determination of the dendrogram structure: min_value = 30 4.5 K kms (the minimum intensity considered in the analysis); min_delta = 30 (the minimum spacing between isocontours); min_pix = 3 beam 150 pixels (the minimum number of pixels contained within a structure). Given the complex and extended morphology of the N2H+ emission, more stringent dendrogram criteria were imposed compared to the continuum. This parameter set produced a simplistic dendrogram hierarchy, which was preferred as this work focuses on the detection and analysis of the weak 15N emission, as opposed to a rigorous classification of the structures seen in N2H+ emission.
For simplicity, in the following we will call "cores" the N2H+ intensity peaks identified in this way as well. These N2H+ cores are typically larger (i.e. more diffuse) than the continuum cores, due to the difference in dendrogram parameters. The N2H+ emission morphology is shown in Fig. 2, in which we plot for each cloud the peak intensity of the N2H+(1–0) line superimposed on the mass (H2) surface density map, , obtained from combined Spitzer near- and mid-infrared extinction maps (Kainulainen & Tan 2013): overall, the morphology matches well the N2H+ emission peak in Cloud C, F, and H, even though the peaks of the two tracers coincide relatively well only in Cloud C, while in cloud H and F some N2H+ peaks are not coincident with the peaks. This apparent disagreement between the N2H+(1–0) intensity peak and peaks, especially in Cloud D and partly also in Cloud H and F, could be due to several causes affecting the N2H+ line profile in the regions with high extinction. Indeed, as we will discuss in Sect. 3.1.3, the N2H+ spectra show a very complex profile suggestive of multiple velocity components, self-absorption, and high-optical depth effects, in particular towards Cloud D and H.
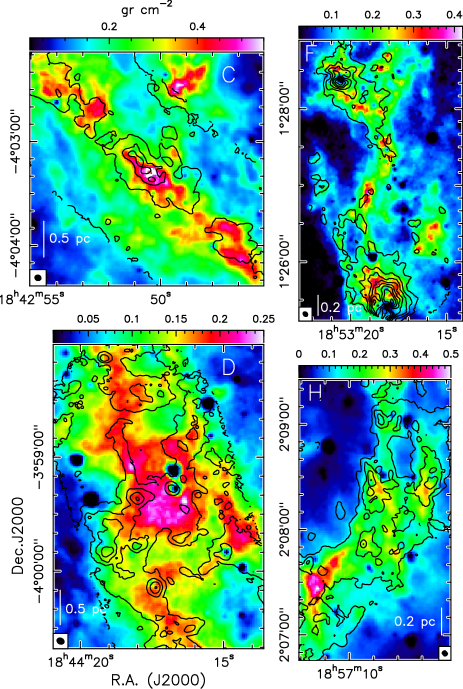
The contours used for the extraction of the spectra are shown in Fig. 1, where we can note that several continuum cores are superimposed, or totally included, in the N2H+ cores. However, the N2H+ cores are usually more extended, and in some cases they are not detected in the 3 mm continuum, and vice-versa. A similar feature was found by Di Francesco et al. (2004) in Oph A, and interpreted as being due to the fact that N2H+ (1–0) is tracing the cold gas better than the dust continuum emission, which is biased toward warm regions. Therefore, our "double" analysis allows us to investigate if the 14N/15N ratios change from the compact continuum cores to the more diffuse N2H+ ones.
We will present first the results of the data analysis of the spectra extracted from the continuum cores in Sect. 3.1, and then we will show those obtained from the N2H+ cores in Sect. 3.2, also comparing the two results.
3.1 Spectra towards the 3 mm continuum cores
3.1.1 Extraction of the spectra and line detection
We extracted N15NH+(1–0) spectra from the continuum sources identified in paper I, and detected significant emission towards three cores in Cloud C (), six cores in Cloud D (), six cores in Cloud F (), and two cores in Cloud H (). The contours used for the extraction of the spectra are shown in Fig. 1, where we highlight the cores detected in N15NH+. The integrated flux density, , of each spectrum has been converted to brightness temperature units via the formula:
| (1) |
where is the rest frequency of the transition (see Table 2) and is the observed angular equivalent diameter (i.e. the diameter of the equivalent circle) of each core (paper I). Therefore, is an average brightness temperature over the angular surface of each core. We stress that Eq.(1) is valid also for non-spherical sources as long as is the source equivalent angular diameter. Following the same approach, we will have extracted and analysed spectra from the N2H+ cores, which will be discussed in Sect. 3.2
The spectra in units are shown in Figs. A-1 – A-4. The N15NH+ emission is preferentially detected towards cores with strong continuum emission (cores C2c3/5, C2c4, C2c6 in Cloud C; core D7c3 in Cloud D; Cores F1c1, F1c2, F1c3, F4c5, F4c7 in Cloud F; cores H3c3 and H5c3 in Cloud H), and are usually located in the central part of the cloud, with the exception of the cores in Cloud F, located at the southern and northern edge of the cloud (Fig. 1).
3.1.2 Line fits: N15NH+ (1–0)
The N15NH+ (1–0) line possesses hyperfine structure due to the nuclear spin of the 14N nucleus, which splits the transition in three components well separated in frequency, with the strongest one at the centre of the spectrum, and two fainter satellites. The frequencies of the components and relevant spectroscopic parameters are given in Table 2. In all but four cores, D5c5/6/7, F1C3, F4c5, and F4c7, the hyperfine structure cannot be fitted because the satellites are undetected. Therefore, the main components have been fitted with a single Gaussian, except in the four cores mentioned above, for which we have fitted simultaneously all components using the CLASS software (method hfs in CLASS): the method considers that the velocity separation of the components is fixed to the laboratory values, and that all components have the same excitation temperature () and the same line full width at half maximum (FWHM).
By fitting a single Gaussian to the lines in which only the main hyperfine component is detected, we are underestimating the total line integrated area. To compute the total column density we have appropriately derived the total integrated intensity from our partial estimates as explained in Sect. 3.1.4.
3.1.3 Line fits: N2H+(1–0)
The N2H+ (1–0) has also hyperfine structure with 15 components, of which seven are resolved in velocity in quiescent cores (see e.g. Caselli et al. 1995). However, in many observed spectra, including ours, the line widths are much larger than the separation in velocity of the components, which are thus grouped in three spectral features (Figs. A-1 – A-4). Moreover, the profile is often complex and difficult to fit even considering the hyperfine structure. Such complexity can be attributed to multiple velocity components, known to be present in the targets (e.g. Henshaw et al. 2013, 2014; Barnes et al. 2018), and/or to optical depth effects and self-absorption.
Let us discuss now in detail the profiles of the N2H+ (1–0) lines in each cloud. We examine in particular the spectra of the cores also detected in N15NH+ (1–0), from which we will compute the 14N/15N ratios:
-
-
Cloud C: all spectra show a main component centred at (or very close to) the systemic velocity of the cloud ( km s-1), and a fainter red-shifted emission, most apparent in, e.g., C1c1, C2c1 and C2c2 (Fig. A-1). The red-shifted emission is also clearly apparent in the three cores detected in N15NH+, i.e. C2c3/5, C2c4, and C2c6. In particular, in C2c3/5 and C2c4 the central velocity of the main component is displaced by km s-1 with respect to the N15NH+ (1–0) line peak, suggesting that self-absorption could cause the asymmetric profile of N2H+(1–0). Moreover, the FWHM of the N15NH+ (1–0) lines are narrower that those of N2H+(1–0), which again could be due either to self-absorption in the main isotopologue line, or to multiple overlapping velocity features, undetected in N15NH+ (1–0) because too faint. To understand which of these two phenomena produces more likely the observed line features in N2H+ and N15NH+, we have first performed a fit with two velocity components in N2H+, which gives good results in the three cores. Then, we have compared the N15NH+ line velocity peak with that of the two candidate velocity features in the isolated hyperfine component F of N2H+(1–0): we found that the peak of the strongest velocity feature in N2H+ coincides within the uncertainties with the N15NH+ velocity peak, favouring, for N2H+(1–0), the multiple velocity component hypothesis with respect to self-absorption;
-
-
Cloud D: this is the cloud with the most complex spectral features. Fits to the line profiles even including multiple velocity components and high optical depths provide high residuals in the six cores detected in N15NH+, i.e. D6c4, D6c6, D7c1, D7c2, D5c5/6, and D8c1. As for Cloud C, the displacement of km s-1 or more between the peaks of the N15NH+ (1–0) and the velocity peak of the main component of N2H+(1–0) suggests that self-absorption can be important. But multiple velocity components, undetected in N15NH+ (1–0), cloud also contribute to the total line profile. As for Cloud C, we have compared the peak velocity of N15NH+(1–0) with the possible velocity features in the F component of N2H+(1–0), and found that in three cases, i.e. D6c6, D7c1, and D7c2, the peak velocity of the N15NH+(1–0) sits in between the peaks of the two velocity feature candidates seen in N2H+ (see Fig. A-2). Therefore, in these cores the N2H+ asymmetric line profile is likely due to self-absorption. In the other three cores, i.e. D6c4, D5c5/6, and D8c1, the profile may be due to two velocity features;
-
-
Cloud F: The lines can be fitted with a single velocity component in all spectra except that in F1c5, F1c6, F2c1, and F2c2, where there seem to be at least two velocity components (Fig. A-3). Among the five cores detected in N15NH+ (1–0), i.e. F1c1, F1c2, F1c3, F1c4, F4c5 and F4c7, only F1c2 and F1c3 show hints of a secondary blue-shifted velocity feature. However, in both cases the N15NH+ line peaks sits neither in between the possible two velocity features nor on one of them precisely, and hence one cannot establish which is the (main) cause of the asymmetric profile in N2H+. Nevertheless, these possible secondary velocity features contribute to the integrated intensity by less than (A-3), and hence does not affect strongly the integrated intensity estimate;
-
-
Cloud H: the line profiles are very different among the various cores (A-4), going from single velocity components with moderate (H3c3) or high (H5c3, H5c1) optical depth, to multiple velocity features (H2c1, H4c1, H3c1). Again, the profile of the isolated F hyperfine component is the least affected, and is well fitted by a single Gaussian in the two cores detected in N15NH+, i.e. H3c3 and H5c3.
3.1.4 Derivation of the total column densities
The complexity of the N2H+(1–0) line profiles, clearly seen in the spectra of Figs. A-1 – A-4, and described in Sect. 3.1.3, makes it difficult to obtain fits with low residuals. Therefore, we have estimated the N2H+ total column density, (N2H+), from the integrated intensity of the hyperfine component F, which is well separated in velocity from the others and intrinsically the faintest one, and hence potentially the least affected by optical depth effects, self-absorption, or contribution of secondary faint velocity features. This was then converted to the total integrated intensity of the line by multiplying it by 9, which is the relative strength of the sum of all components with respect to the F one (see Table 2). Then, the total column density was calculated from the total integrated intensity using Eq. (A4) of Caselli et al. (2002), which assumes optically thin emission and same (and constant) excitation temperature, , for all rotational transitions (and all hyperfine components within each transition).
Obviously, this simplified approach provides column density estimates that need to be taken with caution, because the spectra of N2H+ in some cases show hints of multiple velocity features and/or self-absorption also in the F component (see Figs. A-1 – A-4), as discussed in Sect. 3.1.3. In particular, when we could determine that the profile is due to multiple velocity features, we have integrated only the strongest velocity component, (e.g. the three cores in Cloud C, or D6c4, D5c5/6 and D8c1 in cloudD, see Sect. 3.1.3); when the line profile was attributed more likely to self-absorption (e.g. in the cores D6c6, D7c1 and D7c2), we have integrated the whole component, bearing in mind that this will provide a lower limit on (N2H+), and hence a lower limit on the associated 14N/15N as well. In cores undetected in N15NH+, one cannot establish if the line profile of N2H+ is most likely due to multiple velocity components or to self-absorption, except in the cases in which velocity features well-separated in velocity are found (e.g. in H2c1 and H3c1). In the latter case, we have performed a fit assuming multiple velocity features, identified the strongest one (even in case of large residuals), and taken the integrated intensity of this velocity feature only.
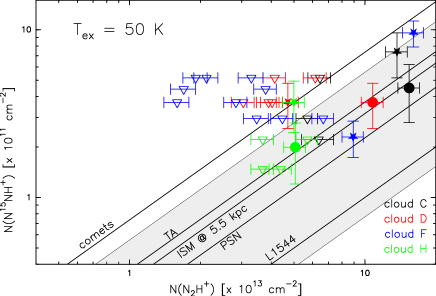
Because the adopted approach does not allow to estimate the excitation temperature, , we have assumed a range of which can be considered typical or reasonable for IRDC cores, i.e. K. This temperature range includes the dust temperature estimates obtained from Herschel for all clouds (see paper I), and the kinetic temperature estimates obtained in Cloud H ( K, Sokolov et al. 2017). The corresponding range of values for (N2H+) is cm-2 at = 10 K, and cm-2 at = 50 K. The results are shown in Table LABEL:tab:columns.
For N15NH+, we have followed the same method as that used for the N2H+ lines: for the spectra in which the main hyperfine component only is detected, i.e. the F one (see Table 2), we have estimated the total integrated intensity by dividing the integral of this component for its relative strength (i.e. , Table 2). The approach is appropriate for optically thin lines. We note that we cannot measure directly the optical depth of the lines because we detected the hyperfine structure only towards two cores, and even in these cases the measured is very uncertain (error on larger than ). However, the assumption of optically thin lines is justified by the faint emission and the non-detection of the satellites, and supported by direct measurements in protostellar cores in which of N15NH+(1–0) is comparable to or smaller than (e.g. towards OMC–2 FIR4, Fontani et al. 2020). As excitation temperature, we have used the same one assumed for N2H+.
We find (N15NH+) in the range cm-2 at = 10 K, and cm-2 at = 50 K. We point out that even though the assumed temperature affects the column densities of N2H+ and N15NH+, it does not affect at all the 14N/15N ratio, as we will see in Sect. 4.1.
Finally, in the cores undetected in N15NH+, we have evaluated the upper limit on (N15NH+) from the upper limit on the integrated intensity, estimated through:
| (2) |
which expresses the integral in velocity of a Gaussian line with peak intensity given by the rms in the spectrum. The factor 0.555, which is the relative strength of the F hyperfine component, is introduced to convert the upper limit of this component to the upper limit of the total one. The assumed FWHM is the mean value measured from the N15NH+ lines detected in each cloud.
The N2H+ and N15NH+ column densities have been calculated assuming that N2H+ and N15NH+ (1–0) have the same based on the assumption that the two transitions have very similar critical densities, and hence similar excitation conditions. However, let us discuss this assumption better. Based on a non-LTE analysis, Hily-Blant et al. (2013a) found differences in for lines with the same quantum numbers of the different isotopologues of HCN. But these differences are in all (but one) cases below , indicating that a significantly different for lines with the same quantum numbers is unlikely for isotopologues of the same species. Regarding the possibility that different hyperfine components of the same isotopologue can have a different , Daniel et al. (2006) showed that high optical depths in N2H+ (1–0) could indeed cause deviations from the line profile expected when each component has the same excitation temperature. However, both theoretical (Daniel et al. 2006) and observational (Caselli et al. 1995) works show that of the component analysed in our work, i.e. the F one, would deviate from the local thermodynamic equilibrium value by 10-15 at most even in the high optical depth case, and only at H2 volume densities below cm-3 (see Fig. 6 in Daniel et al. 2006). In our cores, the average H2 volume density is cm3, or when using the background subtracted mass cm3 (paper I), for which the predicted deviations from the equilibrium is negligible (Fig. 6 in Daniel et al. 2006). Therefore we are confident that hyperfine anomalies are not affecting significantly the of the analysed component.
3.2 Spectra towards the N2H+ cores
For completeness, we have extracted and analysed the spectra associated with the cores identified through the N2H+ emission. These were obtained with the dendrogram analysis like the 3 mm continuum cores in paper I, and are shown in Fig. 1, labelled following a method similar to the one used in paper I for the continuum cores: we identify the closer core in Butler & Tan (2012), to which we add the label "n2hp", followed by a sequential number in case more than one core can be associated with the same Butler & Tan (2012) core. Most of these cores are more extended than the continuum ones, which are included in the N2H+ contours especially in clouds C, D and H. Therefore, this analysis allows us to investigate if the N15NH+ emission is more extended, or, to say it in another way, "detectable" also away from the continuum cores. The method adopted to extract the spectra from these cores, convert them from flux density to unit, fit them, and derive the column densities, are identical to those described in Sect. 3.1.
In Fig. 1 we highlight the cores in which N15NH+ has been detected with signal-to-noise ratio . In Cloud C, the two detected cores, C2-n2hp-1 and C2-n2hp-2, include the continuum cores already detected in N15NH+, i.e. C2c3/5, C2c4, and C2c6; therefore, we have not found "new" detections. The same result is found in Cloud F, in which again N15NH+(1–0) is detected only towards the two cores (F1-n2hp-1 and F4-n2hp-1) that include in their contours all the continuum cores already detected in this line. In Cloud D, we have detected N15NH+ towards D5-n2hp-1 and D7-n2hp-1: D7-n2hp-1 includes the already detected continuum core D8c1, while D5-n2hp-1 contains the undetected continuum core D5c7, but D5-n2hp-1 is much more extended than D5c7. Hence, in this case the N15NH+ emission arises from the diffuse envelope of D5c7. Apart from this case, overall in clouds C, D, and F the detections in the continuum and N2H+ cores are always consistent.
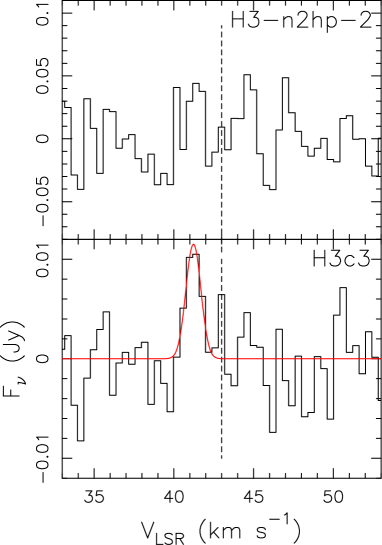
The case of Cloud H is more complicated. In this cloud we detect N15NH+ towards two cores: H2-n2hp-1, which includes the much more compact undetected continuum cores H2c1 and H3c1, and H5-n2hp-1, which includes the continuum core H5c3, detected in N15NH+. Hence, the detection in H2-n2hp-1 is due to emission in the extended envelopes of H2c1 and H3c1, as in D5-n2hp-1. There is also a peculiar case: H3-n2hp-2, which is undetected in N15NH+ but includes the compact continuum core H3c3 detected in N15NH+. Therefore, the non-detection in H3-n2hp-2 appears inconsistent at first glance with the detection towards H3c3. In this latter, N15NH+ (1–0) is displaced by km s-1 from the systemic velocity of the cloud (see Fig. 3). This detection could hence be doubtful. However, a displacement of about 1 km s-1 is seen also in the N2H+ (1–0) line (see Fig. A-4). Furthermore, and most importantly, the noise in the H3-n2hp-2 spectrum is about 5 times higher than that in the H3c3 one (see Fig. 3), and the hint of a possible line under the noise level is apparent in H3-n2hp-2 as well. Therefore, we conclude that the detection of N15NH+ towards H3c3, detected with signal-to-noise of 5, is real.
In summary, N15NH+ (1–0) has been detected towards N2H+ cores not previously detected in continuum cores only in two sources, D5-n2hp-1 and H2-n2hp-1. This result suggests that, overall, the N15NH+ emission seems to be fainter in the more diffuse N2H+ cores than in the compact continuum cores. We will discuss further this finding in Sects. 4.1 and 4.2.
The N2H+ and N15NH+ column densities have been computed adopting the same approach described in Sect. 3.1.4. Among the cores that show complex line profiles in N2H+(1–0), D7-n2hp-1 is the only one in which the profile can be attributed to self-absorption based on the comparison between the velocity peak of N15NH+ and the F hyperfine component of N2H+. The results are shown in Table 4. For N2H+, we find in the range cm-2 when is K, and cm-2 when is K. For N15NH+, we find in the range cm-2 when is K, and cm-2 when is K. In Table 4 we also list the N2D+ cores identified in Kong et al. (2017) which can be associated with the N2H+ cores. A few of them are indeed associated, but unfortunately only 4 of those are also detected in N15NH+, and thus the statistics is too low to discuss possible relations between nitrogen and deuterium fractionation.
| source | N2H+ | N15NH+ | |||||||
|---|---|---|---|---|---|---|---|---|---|
| 14N/15N | ID | ||||||||
| K km s-1 | cm-2 | cm-2 | K km s-1 | cm-2 | cm-2 | ||||
| = 10 K | = 50 K | = 10 K | = 50 K | ||||||
| C1c1 | 13.8(0.2) | 1.9(0.2) | 5.4(0.6) | 1 | |||||
| C1c2 | 11.2(0.1) | 1.5(0.2) | 4.4(0.5) | 2 | |||||
| C1c3 | 21.4(0.3) | 2.9(0.3) | 8.4(1.0) | 3 | |||||
| C2c1 | 25.2(0.2) | 3.4(0.4) | 9.9(1.1) | 4 | |||||
| C2c2 | 42.6(0.2) | 5.7(0.6) | 16.7(1.8) | 5 | |||||
| C2c3/5 | 37.6(0.3) | 5.1(0.6) | 14.8(1.6) | 0.15(0.03) | 2.1(0.7) | 6(2) | 6 | ||
| C2c4 | 46.7(0.3) | 6.3(0.7) | 18(2) | 0.17(0.05) | 2.4(0.9) | 7(3) | 7 | ||
| C2c6 | 34.8(0.2) | 4.7(0.5) | 13.7(1.5) | 0.19(0.04) | 2.6(0.9) | 8(3) | 8 | ||
| C5c3/4 | 17.2(0.2) | 2.3(0.3) | 6.8(0.7) | 9 | |||||
| C5c1/2 | 21.1(0.3) | 2.8(0.3) | 8.3(0.9) | 10 | |||||
| C6c5 | 16.9(0.3) | 2.3(0.3) | 6.7(0.8) | 11 | |||||
| C6c6/8 | 20.7(0.4) | 2.8(0.3) | 8.1(1.0) | 12 | |||||
| C6c1/2 | 19.0(0.3) | 2.6(0.3) | 7.5(0.9) | 13 | |||||
| C6c7 | 19.0(0.5) | 2.6(0.3) | 7.5(0.9) | 14 | |||||
| C6c9 | 9.5(0.5) | 1.3(0.2) | 3.8(0.6) | 15 | |||||
| C6c10 | 15.7(0.7) | 2.1(0.3) | 6.2(0.9) | 16 | |||||
| D3c3/4 | 8.1(0.3) | 1.1(0.14) | 3.2(0.4) | 1 | |||||
| D3c5 | 6.8(0.2) | 0.9(0.14) | 2.7(0.3) | 2 | |||||
| D6c1/2/3 | 20.3(0.2) | 2.7(0.3) | 8.0(0.9) | 3 | |||||
| D6c4 | 18.8(0.3) | 2.5(0.3) | 7.4(0.9) | 0.15(0.05) | 2.0(0.9) | 6(3) | 4 | ||
| D6c5 | 29.2(0.4) | 3.9(0.4) | 11.5(1.3) | 5 | |||||
| D5c7 | 26.4(0.4) | 3.6(0.4) | 10.4(1.2) | 6 | |||||
| D6c6 | 24.0(0.5) | 3.2(0.4) | 9.5(1.1) | 0.10(0.05) | 1.4(0.8) | 4(2) | 7 | ||
| D7c1 | 21.2(0.2) | 2.9(0.3) | 8.4(0.9) | 0.12(0.04) | 1.7(0.7) | 5(2) | 8 | ||
| D7c2 | 21.6(0.2) | 2.9(0.3) | 8.5(0.9) | 0.16(0.05) | 2.2(0.9) | 6(3) | 9 | ||
| D5c7 | 14.2(0.2) | 1.9(0.2) | 5.6(0.6) | 10 | |||||
| D5c5/6 | 16.6(0.1) | 2.2(0.2) | 6.5(0.7) | 0.09(0.04) | 1.3(0.7) | 4(2) | 11 | ||
| D7c3 | 17.2(0.3) | 2.3(0.3) | 6.8(0.8) | 12 | |||||
| D8c1 | 28.9(0.1) | 3.9(0.4) | 11.4(1.2) | 0.10(0.02) | 1.4(0.4) | 4.0(1.3) | 13 | ||
| D5c3 | 27.0(0.2) | 3.6(0.4) | 10.6(1.2) | 14 | |||||
| D5c1 | 19.3(0.2) | 2.6(0.3) | 7.6(0.8) | 15 | |||||
| D9c1/2 | 21.8(0.6) | 2.9(0.4) | 8.6(1.1) | 16 | |||||
| F1c1 | 104.2(0.3) | 14.0(1.4) | 41(4) | 0.26(0.03) | 3.6(0.8) | 11(2) | 1 | ||
| F1c2 | 89.6(0.5) | 12.1(1.3) | 35(4) | 0.21(0.06) | 3.0(1.1) | 9(3) | 2 | ||
| F1c3 | 74.7(0.5) | 10.1(1.1) | 29(3) | 0.47(0.09) | 7(2) | 19(6) | 3 | ||
| F1c4 | 39.8(0.2) | 5.4(0.6) | 15.7(1.6) | 0.14(0.04) | 2.0(0.8) | 6(2) | 4 | ||
| F1c5 | 6.1(0.3) | 0.8(0.12) | 2.4(0.4) | 5 | |||||
| F1c6 | 14.6(0.2) | 2.0(0.2) | 5.7(0.7) | 6 | |||||
| F2c1 | 17.7(0.2) | 2.4(0.3) | 7.0(0.8) | 7 | |||||
| F3c1/2 | 17.4(0.1) | 2.3(0.3) | 6.8(0.7) | 8 | |||||
| F3c3 | 13.4(0.3) | 1.8(0.2) | 5.3(0.6) | 9 | |||||
| F3c4 | 14.1(0.2) | 1.9(0.2) | 5.6(0.6) | 10 | |||||
| F4c4 | 18.2(0.2) | 2.5(0.3) | 7.2(0.8) | 11 | |||||
| F4c5 | 25.8(0.2) | 3.5(0.4) | 10.2(1.1) | 0.14(0.05) | 2.0(0.8) | 6(2) | 12 | ||
| F4c6 | 29.1(0.3) | 3.9(0.4) | 11.4(1.3) | 13 | |||||
| F4c7 | 52.8(0.3) | 7.1(0.8) | 21(2) | 0.27(0.7) | 3.8(1.4) | 11(4) | 14 | ||
| F4c8 | 55.3(0.3) | 7.4(0.8) | 22(2) | 15 | |||||
| F4c9 | 35.0(0.3) | 4.7(0.5) | 13.8(1.5) | 16 | |||||
| F4c10 | 17.6(0.4) | 2.4(0.3) | 6.9(0.8) | 17 | |||||
| F4c1 | 13.0(0.2) | 1.7(0.2) | 5.1(0.6) | 18 | |||||
| F2c2 | 8.0(0.2) | 1.1(0.13) | 3.2(0.4) | 19 | |||||
| F3c5 | 19.4(0.3) | 2.6(0.3) | 7.6(0.8) | 20 | |||||
| H3c4 | 15.4(0.2) | 2.1(0.2) | 6.1(0.7) | 1 | |||||
| H3c5 | 12.6(0.3) | 1.7(0.2) | 5.0(0.6) | 2 | |||||
| H3c6 | 8.6(0.3) | 1.2(0.15) | 3.4(0.4) | 3 | |||||
| H3c3 | 20.7(0.3) | 2.8(0.3) | 8.1(0.9) | 0.12(0.03) | 1.7(0.6) | 5.1(1.8) | 4 | ||
| H2c1 | 13.6(0.3) | 1.8(0.2) | 5.3(0.6) | 5 | |||||
| H3c2 | 24.0(0.2) | 3.2(0.4) | 9.5(1.0) | 6 | |||||
| H4c1 | 21.3(0.2) | 2.9(0.3) | 8.4(0.9) | 7 | |||||
| H3c1 | 17.2(0.3) | 2.3(0.3) | 6.8(0.7) | 8 | |||||
| H5c3 | 26.1(0.2) | 3.5(0.4) | 10.3(1.1) | 0.31(0.06) | 4.3(1.3) | 13(4) | 9 | ||
| H5c1 | 18.1(0.3) | 2.4(0.3) | 7.1(0.8) | 10 | |||||
| source | N2H+ | N15NH+ | ||||||||
| 14N/15N (a) | ID | N2D+ | ||||||||
| K km s-1 | cm-2 | cm-2 | K km s-1 | cm-2 | cm-2 | |||||
| = 10 K | = 50 K | = 10 K | = 50 K | |||||||
| C1-n2hp-1 | 1.8(0.1) | 2.2(0.3) | 6.4(1.0) | a | C1N | |||||
| C2-n2hp-1 | 4.36(0.02) | 5.3(0.6) | 15.0(1.6) | 0.10(0.03) | 1.5(0.6) | 4.5(1.7) | 350(190) | b | C2C | |
| C2-n2hp-2 | 3.87(0.02) | 4.7(0.5) | 13.7(1.4) | 0.10(0.02) | 2.5(0.8) | 7(2) | 190(80) | c | C2A/B | |
| C5-n2hp-1 | 1.61(0.01) | 2.0(0.2) | 5.7(0.6) | d | C5A | |||||
| C6-n2hp-1 | 1.82(0.02) | 2.2(0.3) | 6.4(0.7) | e | ||||||
| D3-n2hp-1 | 1.14(0.01) | 1.4(0.2) | 4.0(0.4) | a | ||||||
| D6-n2hp-1 | 1.10(0.01) | 1.3(0.2) | 3.9(0.4) | b | ||||||
| D5-n2hp-1 | 1.33(0.01) | 1.6(0.2) | 4.0(0.4) | 0.05(0.01) | 1.3(0.4) | 3.7(1.1) | 130(60) | c | ||
| D5-n2hp-2 | 1.17(0.01) | 1.4(0.2) | 4.1(0.5) | d | ||||||
| D7-n2hp-1 | 3.05(0.02) | 3.7(0.4) | 10.8(1.2) | 0.05(0.01) | 1.3(0.4) | 3.7(1.1) | 290(120) | e | ||
| D5-n2hp-3 | 1.74(0.02) | 2.1(0.3) | 6.2(0.7) | f | ||||||
| D9-n2hp-1 | 0.86(0.01) | 1.0(0.1) | 3.0(0.3) | g | ||||||
| F1-n2hp-1 | 4.55(0.01) | 5.5(0.6) | 16.1(1.6) | 0.13(0.01) | 3.3(0.6) | 9.6(1.7) | 170(50) | a | ||
| F1-n2hp-2 | 0.45(0.01) | 0.55(0.07) | 1.6(0.2) | b | F1 | |||||
| F1-n2hp-3 | 0.54(0.01) | 0.65(0.08) | 1.9(0.2) | c | ||||||
| F1-n2hp-4 | 1.07(0.01) | 1.3(0.2) | 3.8(0.4) | d | ||||||
| F1-n2hp-5 | 0.80(0.01) | 1.0(0.1) | 2.8(0.3) | e | ||||||
| F2-n2hp-1 | 0.60(0.01) | 0.73(0.08) | 2.1(0.3) | f | ||||||
| F2-n2hp-2 | 1.26(0.01) | 1.5(0.2) | 4.5(0.5) | g | F2 | |||||
| F2-n2hp-3 | 0.93(0.02) | 1.1(0.2) | 3.3(0.4) | h | ||||||
| F3-n2hp-1 | 1.88(0.01) | 2.3(0.3) | 6.7(0.7) | i | ||||||
| F4-n2hp-1 | 2.52(0.01) | 3.1(0.4) | 8.9(0.9) | 0.056(0.008) | 0.8(0.2) | 2.3(0.6) | 390(140) | l | ||
| F4-n2hp-2 | 0.48(0.01) | 0.58(0.07) | 1.7(0.2) | m | ||||||
| F4-n2hp-3 | 0.98(0.02) | 1.2(0.2) | 3.5(0.4) | n | ||||||
| H1-n2hp-1 | 1.04(0.01) | 1.3(0.2) | 3.7(0.4) | a | ||||||
| H1-n2hp-2 | 1.61(0.01) | 2.0(0.2) | 5.7(0.6) | b | H1A | |||||
| H3-n2hp-1 | 1.24(0.01) | 1.5(0.2) | 4.4(0.5) | c | ||||||
| H3-n2hp-2 | 1.04(0.01) | 1.3(0.2) | 3.7(0.4) | d | H3A | |||||
| H2-n2hp-1 | 1.43(0.01) | 1.7(0.2) | 5.1(0.6) | 0.027(0.008) | 0.7(0.3) | 2.0(0.8) | 260(130) | e | H2A/B/C/D/E/G | |
| H5-n2hp-1 | 1.41(0.01) | 1.7(0.2) | 5.0(0.5) | 0.05(0.012) | 1.3(0.4) | 3.7(1.3) | 140(60) | f | H5A | |
(a) derived from the column densities estimated assuming = 10 K, but the ratios are identical when using = 50 K.
4 Discussion
4.1 14N/15N ratios in the continuum cores
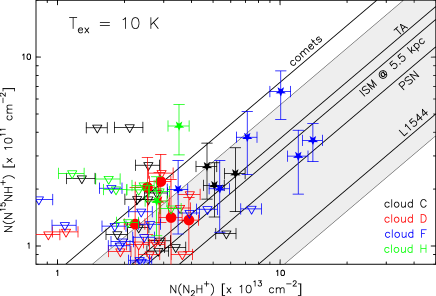
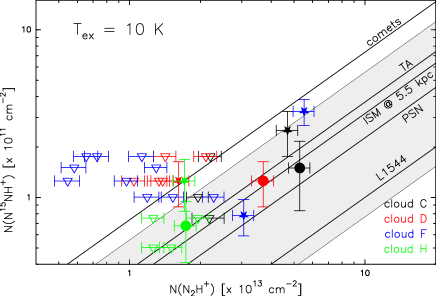
In Fig. 4 we plot (N15NH+) against (N2H+) computed for the continuum cores. Their ratios, 14N/15N (shown in Table LABEL:tab:columns), are in between and , with little statistically significant differences among the clouds: the average 14N/15N is for Cloud C, for Cloud D, 260 for Cloud F, and 120 for Cloud H. The cores have also been divided in Fig. 4 in two groups: starless or star-forming, based on the absence or presence, respectively, of an embedded infrared emission. This classification was made in paper I, and we will discuss the 14N/15N in the two groups in Sect. 4.3.
Inspection of Fig. 4 indicates:
- •
-
•
(2) an average 14N/15N of , very similar to the terrestrial one (Marty et al. 2009). Assuming Galactocentric distances for the four clouds in between and kpc (Zeng et al. 2017), the present-day 14N/15N ratio of the ISM at the Galactocentric distance of the sources is , estimated from the trend derived by Colzi et al. (2019, see their Eqs. 5 and 6) from HCN and HNC isotopologues. Hence, the average 14N/15N ratio measured in this work is times smaller than the ISM value at the Galactocentric distance of the sources;
-
•
(3) in two cores, i.e. D6c4 and H5c3, we measure 14N/15N ratios around 100, i.e. lower by a factor with respect to the local ISM value, and comparable to (or slightly smaller than) the cometary values.
In Fig. 4 we highlight the difference with the single-dish survey of Fontani et al. (2015), in which the measured range of 14N/15N from N2H+ isotopologues is , namely twice wider than ours and hence with a higher average value. A wider range in 14N/15N was also measured in HCN and HNC towards the IRDC cores studied by Zeng et al. (2017) with a single-dish. Also, the two cores D6c4 and H5c3 have among the lowest 14N/15N ratios ever measured in N2H+, and similar to the values obtained by Colzi et al. (2019) towards IRAS 05358+3543. This would indicate that the smaller spatial scales probed by the ALMA interferometer can identify spots with lower 14N/15N values much better than single-dish observations can.
To investigate more in detail the influence of the diffuse gas surrounding the dense cores on the measured 14N/15N, we have derived the 14N/15N ratios towards the cores detected in N15NH+ from the total power data only. We have extracted and analysed the total power spectra following the same approach described in Sects. 3.1.1 and 3.1.4. The only difference is that in Eq. 1 we used the telescope full width at half maximum to convert from flux density to main beam temperature units. The half power beam width of the total power data is ′′ for both N15NH+ and N2H+ (1–0), so that the spectra extracted from one position can contain the contribution of nearby cores. Therefore, in case of cores separated by less than half of the beam width, i.e. ′′, we have extracted only one single-dish spectrum. The results are shown in Table 5. In all cores except F1c1, which is the most extended one, the beam-averaged 14N/15N ratios are larger by a factor than those obtained in the embedded cores at higher angular resolution. This result strengthens our conclusion that in the diffuse envelope of the cores the isotopic ratio tends to be larger, as predicted by the selective photodissociation scenario, and also stresses the need for high-angular resolution data to derive correct values of the 14N/15N ratio and accurately measure the 15N fractionation in the cores embedded within the IRDC.
| source | N2H+ | N15NH+ | ||||||
| 14N/15N | ||||||||
| K km s-1 | cm-2 | cm-2 | K km s-1 | cm-2 | cm-2 | |||
| = 10 K | = 50 K | = 10 K | = 50 K | |||||
| C2c4 | 34.5(0.2) | 4.2(0.4) | 12.2(1.3) | 0.33(0.03) | 8.3(1.6) | 24(5) | 500(150) | |
| D6c4 | 26.7(0.2) | 3.2(0.3) | 9.5(1.0) | 0.35(0.03) | 8.8(1.6) | 26(5) | 370(100) | |
| D8c1 | 30.5(0.2) | 3.7(0.4) | 10.8(1.2) | 0.45(0.05) | 11(2) | 33(7) | 330(100) | |
| F1c1 | 67.9(0.2) | 8.2(0.8) | 24(3) | 0.78(0.09) | 20(4) | 60(12) | 420(130) | |
| F4c7 | 21.8(0.2) | 2.6(0.3) | 7.7(0.8) | 0.27(0.04) | 6.8(1.7) | 20(5) | 390(140) | |
| H3c3 | 16.8(0.2) | 2.0(0.2) | 6.0(0.7) | 0.28(0.04) | 7.0(1.7) | 21(5) | 290(100) | |
| H5c3 | 14.0(0.2) | 1.7(0.2) | 5.0(0.6) | 0.24(0.04) | 6.0(1.6) | 18(5) | 280(100) | |
However, as one can see in Fig. 4, all lower limits on 14N/15N are below , and the maximum measured 14N/15N ratios are and towards F1c1 and F2c2, respectively. This means that our interferometric observations are not sensitive to N15NH+ emission in cores with 14N/15N higher than , and hence we cannot conclude if the narrower range of isotopic ratios measured in this work depends also on our limited sensitivity. Another caveat on the 14N/15N ratios arises from the possible non negligible optical depth of the F component of N2H+(1–0), which could lead us to underestimate (N2H+) and, from this, the 14N/15N ratio. This comment applies especially to core H5c3, which has the lowest 14N/15N ratio (). The fit to the hyperfine structure of this line provides an optical depth of the main component , and hence of the F component would be (Fig. A-4). This would introduce a correction in the N2H+ column density, and hence the 14N/15N would become , still about a factor 2 smaller than the ISM value at the Galactocentric distance of the source.
4.2 14N/15N ratios in the N2H+ cores
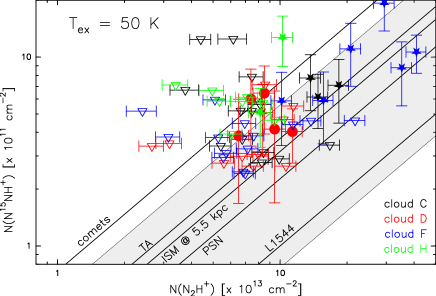
Let us now analyse the 14N/15N ratio towards the N2H+ cores. The N2H+ and N15NH+ column densities are listed in Table 4, and shown in Fig. 5: the range of 14N/15N is , consistent with the one found in the continuum cores (compare Fig. 4 and Fig. 5). For the N2H+ cores encompassing continuum cores, all 14N/15N are consistent among them within the uncertainties, or slightly higher (about a factor , like in C–b, F–l and H–f), which indicates that the 14N/15N ratio in the core envelopes is either similar to or higher than that measured in their embedded dense continuum cores.
Overall, the non-detection of N15NH+ in N2H+ cores without continuum cores, and the fact that the 14N/15N ratios in the N2H+ cores is (almost) never smaller than the values measured in their embedded 3 mm continuum cores suggests that the 14N/15N ratio tends to be higher in the more extended and diffuse gas. This result is in agreement with the high-angular resolution study of Colzi et al. (2019) towards the high-mass protocluster IRAS 05358+3543: in this source, the authors show that in the individual star-forming cores the 14N/15N ratio is lower by a factor two than in the extended, diffuse envelope. Colzi et al. (2019) concluded that this could be due to selective photodissociation (Heays et al. 2014, Lee et al. 2021). This mechanism would act like this: because UV photons cause photodissociation of 14N15N, the progenitor of N15NH+, but not of the self-shielded 14N2, the progenitor of N2H+, one would expect a decrease of the N15NH+ abundance with respect to N2H+ in the external layers exposed to external interstellar UV photons (and hence an increase of the 14N/15N ratio). However, care needs to be taken in this interpretation because most upper limits are comparable to the measured 14N/15N in the detected cores, and hence to show that the 14N/15N ratio is higher in the external, more diffuse part of the dense cores, higher sensitivity measurements of the N15NH+ column densities are needed.
An interesting exception is F1-n2hp-1: its 14N/15N ratio is , while those of the four 3 mm continuum cores embedded in it vary from to . Only F1c3 has a 14N/15N very similar to that of F1-n2hp-1 (150 against 170, respectively), while the others, F1c1, F1c2, and F1c4, have ratios higher by a factor . Hence, in these cases the 14N/15N ratio associated with the diffuse envelope of the continuum cores has a lower 14N/15N, at odds with selective photodissociation if the UV photons are produced by an external field. A possible explanation still consistent with the selective photodissociation scenario is that internal UV photons are produced by the protostar(s) embedded in F1c1 instead of by an external UV field, and hence in this case the N15NH+ abundance is expected to be lower (and hence the 14N/15N ratio to be higher) in the dense protostellar core than in the envelope. Also, F1-n2hp-1 is very extended (Fig. 1) and in principle can include gas not only associated with the external envelope of F1c1, F2c2, F2c3, and F2c4, but also with other gaseous components having possibly different (and unknown) physical properties.
4.3 Relation between 14N/15N and star-formation activity
As stated in Sect. 4.1, in paper I the 3 mm continuum cores have been classified as starless or star-forming based on the absence or presence, respectively, of infrared emission. We can check if the measured 14N/15N ratios changes with the presence/absence of star-formation activity within the cores. In Fig. 4, we indicate with different symbols the starless and star-forming cores. Among the 13 detections, we find five starless and 12 star-forming cores, respectively. The average 14N/15N ratio is slightly lower () in the starless cores than in the protostellar objects (). However, given the large dispersions, we confirm overall the result suggested by previous works (Fontani et al. 2015, Zeng et al. 2017, Colzi et al. 2018a, 2018b): time does not seem to play a role in the enrichment, or depletion, of 15N in N2H+.
Interestingly, the 14N/15N ratio in starless cores seems slightly lower on average than the values typically measured towards well known pre-stellar cores (e.g., by Bizzocchi et al. 2013, Redaelli et al. 2018). However, again care needs to be taken in the interpretation of this result. In fact, first the nature of our starless cores could not be "pre–stellar" but just starless or star-forming in a very early stage of star-formation activity; second, some cores are extended and could contain smaller fragments in different evolutionary stages. For example, a core considered as starless could encompass smaller fragments already star-forming undetected in the IR images (see e.g. Liu et al. 2018). Therefore, in summary the results confirm the previous claim that evolution does not seem to play a role in the fractionation of nitrogen, but observations at higher sensitivity and angular resolution are needed to confirm or deny this conclusion.
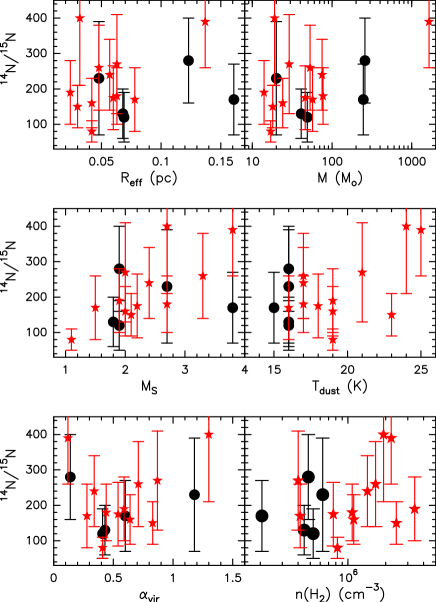
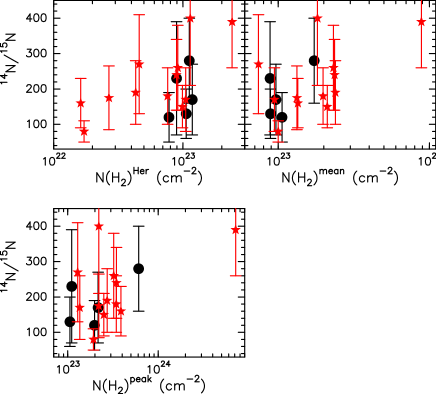
4.4 Relation between 14N/15N and core properties
In Figs. 6 and 7, we compare the 14N/15N ratios in the 17 continuum cores detected in N15NH+ with some physical properties that were derived in paper I, namely: radius (), gas mass (), dust temperature (, used to compute ), sonic Mach number (), virial parameter (), H2 volume density (), and H2 column density (). This latter was derived in three ways: from the Herschel data (), from the 3 mm continuum mean flux density () and from the 3 mm continuum peak flux density (). For quantities that in paper I have been derived from background subtracted and non-subtracted data, such as the mass and the H2 volume density, we have adopted the non-subtracted data. The parameters derived from the Herschel maps (i.e. and ) were obtained by resampling the Herschel maps to the higher resolution of the ALMA data via a bilinear interpolation. The methods used to derive each parameter are described in paper I.
| core | 14N/15N (a) | () | ()Her | ()mean | ()peak | |||||
| pc | M⊙ | K | cm-3 | cm-2 | ||||||
| starless cores | ||||||||||
| D6c4 | 120 | 0.069 | 49 | 16 | 1.9 | 0.41 | 5.28 | 0.78 | 1.06 | 1.98 |
| D6c6 | 230 | 0.048 | 20 | 16 | 2.7 | 1.18 | 6.29 | 0.89 | 0.88 | 1.11 |
| D7c2 | 130 | 0.068 | 41 | 16 | 1.8 | 0.43 | 4.48 | 1.06 | 0.89 | 1.06 |
| D5c5/6 | 170 | 0.161 | 247 | 15 | 3.8 | 0.60 | 2.06 | 1.18 | 0.97 | 2.17 |
| D8c1 | 280 | 0.123 | 259 | 16 | 1.9 | 0.14 | 4.83 | 1.12 | 1.73 | 6.08 |
| star-forming cores | ||||||||||
| C2c3/5 | 240 | 0.057 | 75 | 17 | 2.4 | 0.34 | 14.3 | 0.89 | 2.36 | 3.46 |
| C2c4 | 260 | 0.048 | 53 | 17 | 3.3 | 0.71 | 16.6 | 0.91 | 2.32 | 3.23 |
| C2c6 | 180 | 0.063 | 77 | 17 | 2.7 | 0.44 | 10.8 | 0.76 | 1.98 | 3.44 |
| D7c1 | 170 | 0.078 | 57 | 16 | 1.5 | 0.28 | 4.16 | 1.05 | 0.94 | 1.36 |
| F1c1 | 390 | 0.137 | 1650 | 25 | 3.8 | 0.12 | 22.1 | 2.40 | 8.85 | 71.6 |
| F1c2 | 400 | 0.032 | 19 | 24 | 2.7 | 1.30 | 19.2 | 1.14 | 1.82 | 2.21 |
| F1c3 | 150 | 0.030 | 18 | 23 | 2.1 | 0.83 | 24.3 | 0.99 | 2.11 | 2.51 |
| F1c4 | 270 | 0.063 | 29 | 21 | 2.0 | 0.87 | 4.01 | 0.46 | 0.74 | 1.29 |
| F4c5 | 175 | 0.060 | 46 | 18 | 2.2 | 0.54 | 7.64 | 0.27 | 1.33 | 2.21 |
| F4c7 | 190 | 0.024 | 14 | 19 | 1.9 | 0.59 | 34.0 | 0.43 | 2.39 | 2.73 |
| H3c3 | 160 | 0.042 | 24 | 19 | 2.0 | 0.64 | 11.1 | 0.16 | 1.35 | 3.88 |
| H5c3 | 80 | 0.042 | 17 | 19 | 1.1 | 0.41 | 8.24 | 0.17 | 1.00 | 1.93 |
(a) from Table LABEL:tab:columns;
Inspection of Figs. 6 and 7 suggests that, overall, there are no strong and clear (anti-)correlations between the 14N/15N ratio and the analysed core properties. However, non-parametric statistical tests suggest very tentative positive correlations with the H2 column density derived from the 3 mm continuum (in Fig. 7). The Pearson’s correlation coefficient is: with (value 0.001); with (value 0.007); with (value 0.01).
We speculate that the positive correlations between the 14N/15N ratios and the core column densities could again be the consequence of the selective photodissociation mechanism, already invoked in Sect. 4.2. In fact, the higher 14N/15N average ratio could be due to a larger amount of gas along the line of sight in the core envelope, more exposed to external UV photons responsible for the photodissociation of the 14N15N molecule (the parent species of N15NH+) but not of the self-shielded 14N2 (parent species of N2H+), thus causing an increase in the 14N/15N ratio. If we analyse only the star-forming cores, however, we find a tentative positive correlation between 14N/15N and the sonic Mach number (, value 0.004). A tentative difference in , although not statistically significant, was found in paper I between starless and star-forming cores, with the star-forming cores being associated with larger . A very tentative one can be also found between 14N/15N and (, value 0.04). Because both parameters are usually associated with gas in a more advanced stage of star-formation activity, these tentative correlations could indicate that more evolved cores may be associated with higher 14N/15N ratios. However, all trends are strongly influenced by sources F1c1 and F1c2 (Figs. 6 and 7). Moreover, most N15NH+ lines are detected with a signal to noise ratio in between 3 and 5, and hence any trend that can be found from the plots in Figs. 6 and 7 must be taken with caution.
Overall, the fact that we find either no or little correlation between 14N/15N and core properties confirm the chemical models of Roueff et al. (2015) and Loison et al. (2019), in which enrichment in 15N is always very low or even negligible for all species formed in the gas phase like N2H+. In Loison et al. (2019), a significant 15N enrichment is possible if the gas temperature is below K, due to a possibly different exothermicity of the formation reactions of N2H+ and N15NH+, not yet experimentally measured (see also Hily-Blant et al. 2020). However, the temperature of our cores at the scales studied by us is always above K, in agreement with the lack of 15N enrichment, although the temperature measurement is taken over an angular scale (i.e. the Herschel beam) larger than that of the individual cores. Therefore, in quiescent cores the temperature could be lower on smaller scales, as discussed in paper I.
5 Conclusions
We have derived the 14N/15N ratio from the N2H+ and N15NH+ (1–0) lines in a sample of four well-studied IRDCs. The observations, performed with ALMA, represent the first interferometric survey of the 14N/15N ratio in cores embedded in IRDCs. The main results are summarised below:
-
•
among the 3 mm continuum cores embedded in each IRDC and identified in paper I, we detect 17 out of 62 cores in N15NH+;
-
•
the 14N/15N values derived from the column density ratio (N2H+)/(N15NH+) in all studied regions are in the range , which roughly goes from the cometary values to the ISM value at the Galactocentric distance of the targets;
-
•
the 14N/15N ratios are smaller on average than those found in previous single-dish studies, in which ratios even exceeding are found, suggesting that the 14N/15N ratio in the cores is smaller than that in their associated envelope, in agreement with the selective photodissociation scenario. The conclusion is strongly supported by the fact that the 14N/15N ratios obtained using the total power data only towards the detected cores are on average a factor 1.5–3 higher. This also highlights the need for high-angular resolution measurements to measure accurately the 14N/15N ratio in dense cores within IRDCs. However, the sensitivity of our observations likely does not allow us to derive 14N/15N ratios higher than at small scales. Therefore, higher sensitivity measurements will be absolutely required to confirm, or deny, this finding;
-
•
the average 14N/15N ratios in the four clouds (230, 180, 260, 120), are marginally lower (by a factor ) than the present-day Galactic value at the Galactocentric distance of the clouds ();
-
•
We find tentative positive trends between 14N/15N and H2 column density of the cores. Among the star-forming clouds only, we also find a tentative positive trend between 14N/15N and both the sonic Mach number and the dust temperature. We speculate that this can be due to the selective photodissociation mechanisms, which tends to decrease the N15NH+ abundance, and hence to increase the 14N/15N ratio) in cores more exposed to UV photons. The source of these photons is probably external for cores with higher column density, independent on the evolutionary stage of the core. However, due to the fact that the correlations proposed are faint, and that most N15NH+ lines are detected at a significance level of rms in the spectra, any conclusion that can be drawn from these trends must be taken with caution.
Acknowledgments.
We would like to thank the anonymous referee for their constructive feedback on the manuscript. FF is grateful to Laura Colzi for a very useful discussion. This paper makes use of the following ALMA data: ADS/JAO.ALMA#2017.1.00687.S & ADS/JAO.ALMA#2018.1.00850.S. ALMA is a partnership of ESO (representing its member states), NSF (USA) and NINS (Japan), together with NRC (Canada), MOST and ASIAA (Taiwan), and KASI (Republic of Korea), in cooperation with the Republic of Chile. The Joint ALMA Observatory is operated by ESO, AUI/NRAO and NAOJ. I.J.-S. has received partial support from the Spanish FEDER (project number ESP2017-86582-C4-1-R) and the Ministry of Science and Innovation through project number PID2019-105552RB-C41. ATB would like to acknowledge funding from the European Research Council (ERC) under the European Union Horizon 2020 research and innovation programme (grant agreement No.726384/Empire).
Data availability
Data used within this work will be shared on reasonable request to the corresponding author.
References
- Adams (2010) Adams, F.C. 2010, ARA&A, 48, 47
- Adande & Ziurys (2012) Adande, G.R. & Ziurys, L.M. 2012, ApJ, 744, 194
- Barnes et al. (2016) Barnes, A.T., Kong, S., Tan, J.C., Henshaw, J.D., Caselli, P., Jiménez-Serra, I., Fontani, F. 2016, MNRAS, 458, 1990
- Barnes et al. (2018) Barnes, A.T., Henshaw, J.D., Caselli, P., Jiménez-Serra, I., Tan, J.C., Fontani, F., Pon, A., Ragan, S. 2018, MNRAS, 475, 5268
- Bizzocchi et al. (2013) Bizzocchi, L., Caselli, P., Leonardo, E., Dore, L. 2013, A&A, 555, 109
- Bockelée-Morvan et al. (2008) Bockelée-Morvan, D., Biver, N., Jehin, E., et al. 2008, ApJ, 679, L49
- Bonal et al. (2010) Bonal, L., Huss, G.R., Krot, A.N. et al. 2010, Geochim. Cosmochim. Acta, 74, 6590
- Butler & Tan (2009) Butler M. J. & Tan J. C., 2009, ApJ, 696, 484
- Butler & Tan (2012) Butler M. J. & Tan J. C., 2012, ApJ, 754, 5
- Caselli et al. (1995) Caselli, P., Myers, P.C., Thaddeus, P. 1995, ApJ, 455, L77
- Caselli et al. (2002) Caselli, P., Walmsley, C.M., Zucconi, A., Tafalla, M., Dore, L., Myers, P.C. 2002, ApJ, 565, 344
- Caselli & Ceccarelli (2012) Caselli, P. & Ceccarelli, C. 2012, A&ARv, 20, 56
- Ceccarelli et al. (2014) Ceccarelli, C., Caselli P., Bockelée-Morvan D., Mousis O., Pizzarello S., Robert F., Semenov D. 2014, Beuther H., Klessen R. S., Dullemond C. P., Henning Th., Protostars and Planets VI, Univ. Arizona Press, Tucson, p. 859
- Colzi et al. (2018a) Colzi, L., Fontani, F., Rivilla, V.M., Sánchez-Monge, Á., Testi, L., Beltrán, M. T., Caselli, P. 2018a, MNRAS, 478, 3693
- Colzi et al. (2018b) Colzi, L., Fontani, F., Caselli, P., Ceccarelli, C., Hily-Blant, P., Bizzocchi, L. 2018b, A&A, 609, 129
- Colzi et al. (2019) Colzi, L., Fontani, F., Caselli, P., Leurini, S., Bizzocchi, L., Quaia, G. 2019, MNRAS, 485, 5543
- Colzi et al. (2020) Colzi, L., Sipilä, O., Roueff, E., Caselli, P., Fontani, F. 2020, A&A, 640, 51
- Crapsi et al. (2005) Crapsi, A., Caselli, P., Walmsley, C.M., Myers, P.C., Tafalla, M., Lee, C.W., Bourke, T.L. 2005, ApJ, 619, 379
- Daniel et al. (2013) Daniel, F., Gérin, M., Roueff, E., Cernicharo, J., Marcelino, N., Lique, F., Lis, D.C., et al. 2013, A&A, 560, A3
- Daniel et al. (2016) Daniel, F., Faure, A., Pagani, L., Lique, F., Gérin, M., Lis, D., Hily-Blant, P., et al. 2016, A&A, 592, 45
- Daniel et al. (2006) Daniel, F., Cernicharo, J., Dubernet, M.-L. 2006, ApJ, 648, 461
- De Simone et al. (2018) De Simone, M., Fontani, F., Codella, C., Ceccarelli, C., Lefloch, B., et al. 2018, MNRAS, 476, 1982
- Di Francesco et al. (2004) Di Francesco, J., André, Ph., Myers, P.C. 2004, ApJ, 617, 425
- Dore et al. (2009) Dore, L., Bizzocchi, L., Degli Esposti, C., Tinti, F. 2009, A&A, 496, 275
- Egan et al. (1998) Egan M.P., Shipman R.F., Price S.D., Carey S.J., Clark F.O., Cohen M., 1998, ApJL, 494, L199
- Endres et al. (2016) Endres, C.P., Schlemmer, S., Schilke, P., Stutzki, J., Müller, H.S.P. 2016, J.Mol.Spec., 327, 95
- Favre et al. (2018) Favre, C., Ceccarelli, C., López-Sepulcre, A., Fontani, F., Neri, R., Manigand, S., Kama, M., et al. 2018, ApJ, 859, 136
- Fontani et al. (2015) Fontani F., Busquet, G., Palau, A., Caselli, P., Sánchez-Monge, Á., Tan, J.C., Audard, M. 2015, A&A, 575, 87
- Fontani et al. (2017) Fontani, F., Ceccarelli, C., Favre, C., Caselli, P., Neri, R. et al. 2017, A&A. 605, 57
- Fontani et al. (2020) Fontani, F., Quaia, G., Ceccarelli, C., Colzi, L., López-Sepulcre, A., Favre, C., Kahane, C. et al. 2020, MNRAS, 493, 3412
- Fouchet et al. (2004) Fouchet, T., Irwin, P.G.J., Parrish, P., Calcutt, S.B., Taylor, F.W., Nixon, C.A., Owen, T. 2004, Icarus, 172, 50
- Friesen & Pineda et al. (2017) Friesen, R.K., Pineda, J.E., Rosolowsky, E., Alves, F., Chacón-Tanarro, A., et al. 2017, ApJ, 843, 63
- Füri & Marty (2015) Füri, E. & Marty, B. 2015, NatGe, 8, 515
- Furuya & Aikawa (2018) Furuya, K. & Aikawa, Y. 2018, ApJ, 857, 105
- Furuya et al. (2018) Furuya, K., Watanabe, Y., Sakai, T., Aikawa, Y., Yamamoto, S. 2018, A&A, 615, L16
- Gerin et al. (2001) Gerin, M., Pearson, J.C., Roueff, E., Falgarone, E., Phillips, T.G. 2001, ApJ, 551, L193
- Guzmán et al. (2017) Guzmán, V.V., Öberg, K.I., Huang, J., Loomis, R., Qi, C. 2017, ApJ, 836, 30
- Hartogh et al. (2011) Hartogh, P., Lis, D.C., Bockelée-Morvan, D., de Val-Borro, M., Biver, N. et al. 2011, Nature, 478, 218
- Heays et al. (2014) Heays, A. N., Visser, R., Gredel, R., et al. 2014,A&A,562, A61
- Henshaw et al. (2013) Henshaw, J.D., Caselli, P., Fontani, F., Jiménez-Serra, I., Tan, J.C., Hernandez, A.K. 2013, MNRAS, 428, 3425
- Henshaw et al. (2014) Henshaw, J.D., Caselli, P., Fontani, F., Jiménez-Serra, I., & Tan, J.C. 2014, MNRAS, 440, 2860
- Hernandez et al. (2011) Hernandez, A.K., Tan, J.C., Caselli, P., Butler, M.J., Jiménez-Serra, I., Fontani, F., Barnes, P. 2011, ApJ, 738, 11
- Hily-Blant et al. (2013a) Hily-Blant, P., Bonal, L., Faure, A., Quirico, E. 2013a, Icarus, 223, 582
- Hily-Blant et al. (2013b) Hily-Blant, P., Pineau des Forêts, G., Faure, A., Le Gal, R., Padovani, M. 2013b, A&A, 557, 65
- Hily-Blant et al. (2017) Hily-Blant, P., Magalhaes, V., Kastner, J., Faure, A., Forveille, T., Qi, C. 2017, A&A, 603, L6
- Hily-Blant et al. (2020) Hily-Blant, P., Pineau des Forêts, G., Faure, A., Flower, D.R. 2020, A&A, 643, 76
- Jiménez-Serra et al. (2014) Jiménez-Serra, I., Caselli, P., Fontani, F., Tan, J.C., Henshaw, J.D., Kainulainen, J., Hernandez, A.K. 2014, MNRAS, 439, 1996
- Kahane et al. (2018) Kahane, C., Jaber Al-Edhari, A., Ceccarelli, C., López-Sepulcre, A., Fontani, F., Kama, M. 2018, ApJ, 852, 130
- Kainulainen & Tan (2013) Kainulainen, J. & Tan, J.C. 2013, A&A, 549, A53
- Kong et al. (2017) Kong, S., Tan, J.C., Caselli, P., Fontani, F., Liu, M., Butler, M.J. 2017, ApJ, 834, 193
- Kounkel et al. (2017) Kounkel, M., Hartmann, L., Loinard, L., Ortiz-León, G.N., Mioduszewski, A.J., Rodríguez, L.F., Dzib, S.A., et al. 2017, ApJ, 834, 142
- Lee et al. (2021) Lee, S., Nomura, H., Furuya, K., Lee, J.-E. 2021, ApJ, 908, 82L
- Lichtenberg et al. (2019) Lichtenberg, T., Golabek, G.J., Burn, R., Meyer, M.R., Alibert, Y., Gerya, T.V., Mordasini, C. 2019, NatAs, 3, 307
- Liu et al. (2018) Liu, M., Tan, J.C., Cheng, Y., Kong, S. 2018, ApJ, 862, 105
- Loison et al. (2019) Loison, J.C., Wakelam, V., Gratier, P., Hickson, K.M. 2019, MNRAS, 484, 2747
- López-Sepulcre et al. (2013) López-Sepulcre, A., Taquet, V., Sánchez-Monge, Á., et al. 2013, A&A, 556, A62
- Manfroid et al. (2009) Manfroid, J., Jehin, E., Hutsemékers, D., Cochran, A., Zucconi, J.-M., Arpigny, C., Schulz, R., et al. 2009, A&A, 503, 613
- Marty et al. (2009) Marty, B., Zimmermann, L. & Burnard, P.G. 2009, Geochim. Cosmochim. Acta, 73, 842
- Marty et al. (2010) Marty, B., Zimmermann, L., Burnard, P.G., Wieler, R., Heber, V.S., Burnett, D.L., Wiens, R.C., Bochsler, P. 2010, GeCoA, 74, 340
- Matrajt et al. (2012) Matrajt, G., Messenger, S., Brownlee, D., Joswiak, D. 2012, M&PS, 47, 525
- McMullin et al. (2007) McMullin, J.P., Waters, B., Schiebel, D., Young, W., Golap, K. 2007, ASCP, 376, 127
- Mezger et al. (1990) Mezger, P. G., Zylka, R., & Wink, J. E. 1990, A&A, 228, 95
- Nittler et al. (2018) Nittler, L.R., Alexander, C.M.O’D., Davidson, J., Riebe, M.E.I., Stroud, R.M., Wang, J. 2018, GeCoA, 226, 107
- Osorio et al. (2017) Osorio, M., Díaz-Rodríguez, A.K., Anglada, G., Megeath, S.T., Rodríguez, L.F., Tobin, J.J., Stutz, A.M., et al. 2017, ApJ, 840, 36
- Owen et al. (2001) Owen, T., Mahaffy, P.R., Niemann, H.B., Atreya, S., Wong, M. 2001, ApJ, 553, L77
- Perault et al. (1996) Perault M., Omont, A., Simon, G., Seguin, P., Ojha, D., Blommaert, J., Felli, M. et al., 1996, A&A, 315, L165
- Pfalzner et al. (2015) Pfalzner, S., Davies, M.B., Gounelle, M., Johansen, A., Münker, C., Lacerda, P., Portegies Zwart, S., et al. 2015, Phys. Scr., 90, 068001
- Pillai et al. (2006) Pillai T., Wyrowski F., Menten K.M., Krügel E., 2006, A&A, 447, 929
- Portegies Zwart et al. (2018) Portegies Zwart, S., Pelupessy, I., van Elteren, A., Wijnen, T.P.G., Lugaro, M. et al. 2018, A&A 616, A85
- Redaelli et al. (2018) Redaelli, E., Bizzocchi, L., Caselli, P., Harju, J., Chacón-Tanarro, A., Leonardo, E., Dore, L. 2018, A&A, 617, 7
- Rivilla et al. (2016) Rivilla, V.M., Fontani, F., Beltrán, M.T., Vasyunin, A., Caselli, P., Martín-Pintado, J., Cesaroni, R. 2016, ApJ, 826, 2
- Rodgers & Charnley (2008) Rodgers, S.D. & Charnley, S.B. 2008, MNRAS, 385, L48
- Rosolowsky et al. (2008) Rosolowsky, E.W., Pineda, J.E., Kauffmann, J., Goodman, A.A. 2008, ApJ, 679, 1338
- Roueff et al. (2015) Roueff, E., Loison, J.C. & Hickson, K.M. 2015, A&A, 576, 99
- Shimajiri et al. (2008) Shimajiri, Y., Takahashi, S., Takakuwa, S., Saito, M., Kawabe, R. 2008, ApJ, 683, 255
- Shinnaka et al. (2016) Shinnaka, Y., Kawakita, H., Jehin, E., Decock, A., Hutsemékers, D., Manfroid, J., Arai, A. 2016, MNRAS, 462, 195
- Sokolov et al. (2017) Sokolov, V., Wang, K., Pineda, J.E., Caselli, P., Henshaw, J.D., Tan, J.C., Fontani, F., et al. 2017, A&A, 606, 133
- Terzieva & Herbst (2000) Terzieva, R. & Herbst, E. 2000, MNRAS, 317, 563
- Visser et al. (2018) Visser, R., Bruderer, S., Cazzoletti, P., Facchini, S., Heays, A.N., van Dishoeck, E.F. 2018, A&A, 615, 75
- Viti et al. (2019) Viti, S., Fontani, F., Jiménez-Serra, I., Holdship, J. 2019, MNRAS, 486, 4805
- Wirström et al. (2012) Wirström, E.S., Charnley, S.B., Cordiner, M.A., Milam, S.N. 2012, ApJ, 757, L11
- Wirström & Charnley (2018) Wirström, E.S. & Charnley, S.B. 2018, MNRAS, 474, 3720
- Womack et al. (1992) Womack, M., Ziurys, L.M., Wyckoff, S. 1992, ApJ, 387, 417
- Zeng et al. (2017) Zeng, S., Jiménez-Serra, I., Cosentino, G., Viti, S., Barnes, A.T., Henshaw, J.D., et al. 2017, A&A, 603, 22
Appendix A: Spectra.
We show in this appendix the spectra extracted from the contours illustrated in Fig. 1.