Predicting the Behavior of Dealers in Over-The-Counter Corporate Bond Markets
1. Introduction
Over-the-counter (OTC) refers to the process of trading (buying and selling) securities that are not listed on a public exchange such as the New York Stock Exchange. Understanding the trading activities of OTC dealers is crucial for market participants, and for regulators, to better understand and monitor this largely opaque and complex market. Our dataset is the OTC market in US corporate bonds. The large number of bonds, low volume, and the lack of transparency and information exchange in OTC markets increase the role and importance of the dealers.
While there has been significant research around corporate bonds, most of the research has used econometric models.There is limited research on studying dealer behavior using machine learning methods. Our objective is to predict the future behavior of individual dealers with respect to a bond. We create the trading history of each dealer, and we use that history to create input/output training data samples. Each input training sample represents the trades of a dealer within an input interval and the output sample represents their trades during the subsequent output interval. Then, given the input interval of a test sample, the model will predict the dealer’s trading behavior in the output interval of that test sample.
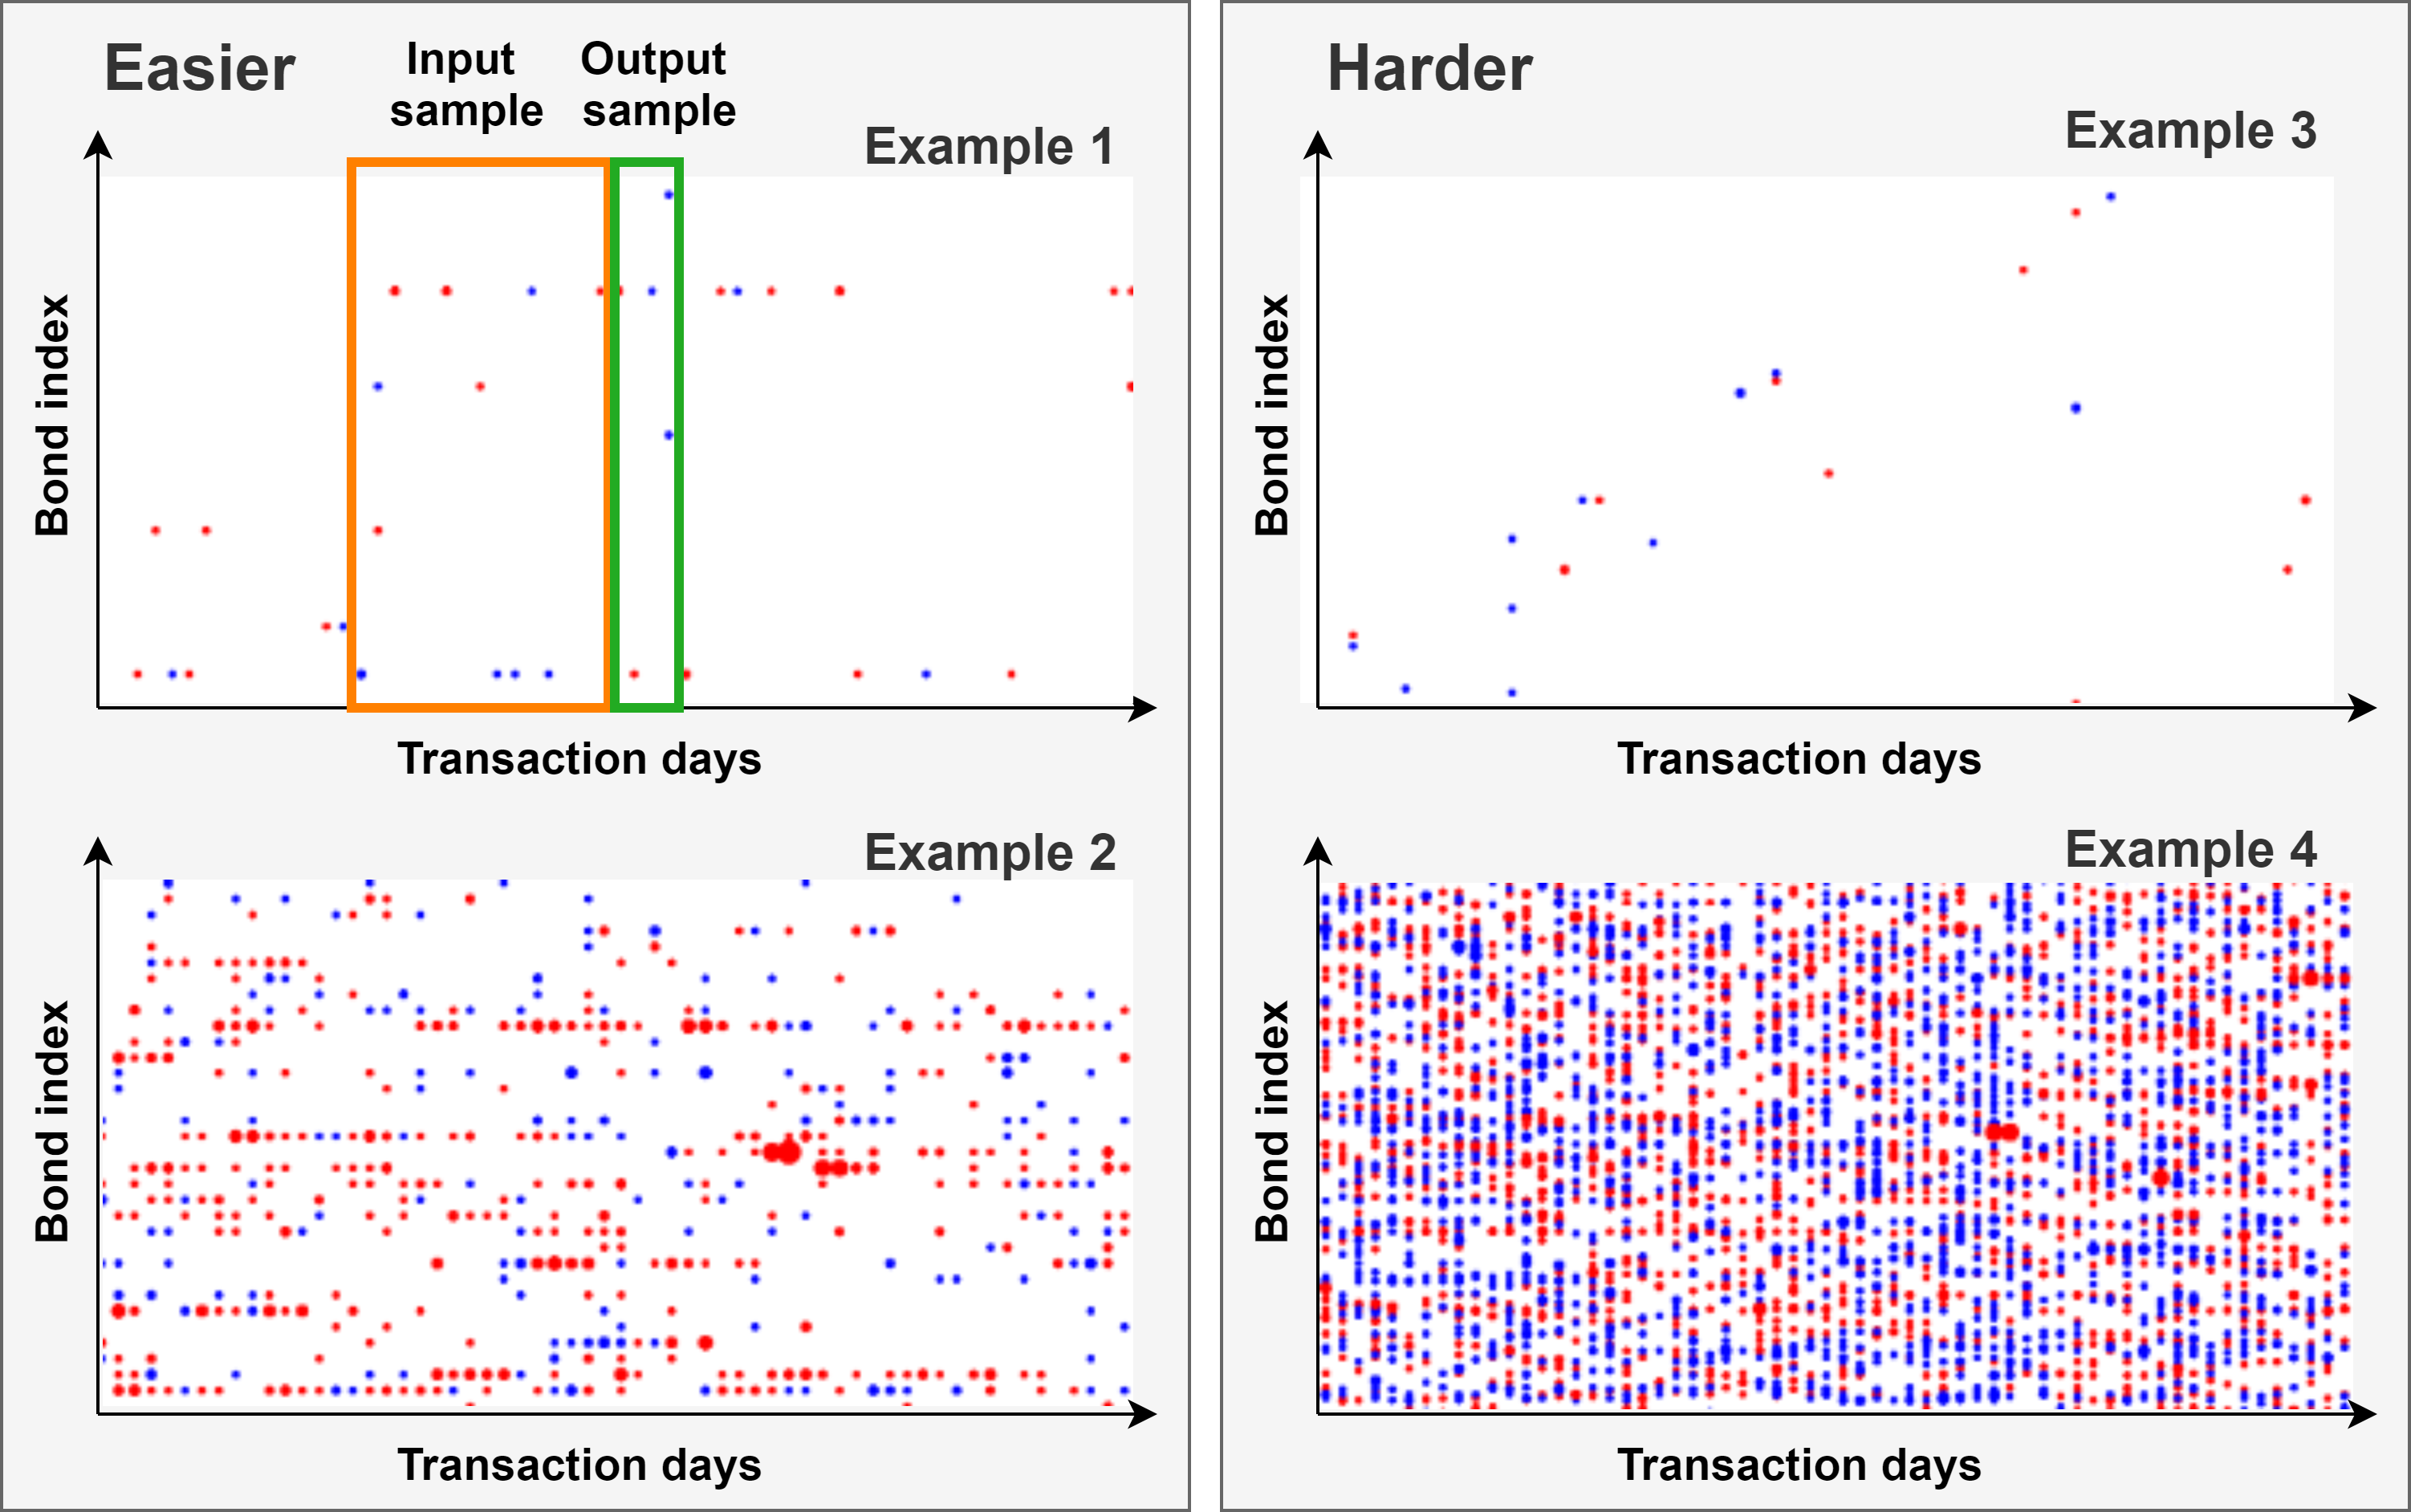
We use the example trading activity for four dealers in Figure 1 to illustrate when prediction may be accurate, and when prediction may be difficult. The Y-axis represents the index of the bond vocabulary and the X-axis represents time. A blue dot represents a buy action while a red one represents a sell; each horizontal line of red and blue dots represents a dealer’s history with respect to a bond. The orange frame represents the input and the green frame represents the corresponding output, for a training or test data sample. Dealers in Examples 1 and 2 may be easier to predict. The repeated dots across horizontal lines indicate repeated buy and sell actions over time for a bond; such patterns may be learned. Examples 3 and 4 may be harder to predict. Example 3 includes only a few trades and the dealer does not seem to repeat trades for a bond along each horizontal line. The history of Example 4 is dense and it may be difficult to extract relevant patterns.
2. Dataset and Representation
Our dataset represents the OTC market in US corporate bonds. FINRA TRACE provides granular data at the level of the individual dealer. The TRACE academic version includes the following items: date, time, the CUSIP (identifier of the bond), and the identity of the reporting party and the counterparty. The reporting party is a dealer while the counterparty may be a client or a dealer. Dealer identities are provided as an anonymized value. The identity of the client is not revealed.
We consider the TRACE data from 01/01/2015 to 12/31/2015. We use a protocol from (Xue, 2018) to filter bonds, and the Dick-Nielsen procedure (Dick-Nielsen, 2014) to delete cancellations and corrections. There are 2.8M inter-dealer transactions, 1.7M dealer-buy-from-client transactions and 2.3M dealer-sell-to-client transactions. The distinct count of dealers is 1.2K and the count of distinct bonds is 12K.
We observe that the data is unbalanced. There are many dealers with low activity and a few very active dealers; consequently, there is insufficient history for prediction for many dealers. There is also an imbalance in the trading activity over the bonds; this is not shown in the figure. We, therefore, apply some additional filtering to create a subset of dealers and bonds that has sufficient history for prediction.
Ideally, a prediction model should be personalized for each dealer, or more typically all the dealers associated with a trading desk, so that we can better understand the diversity of dealer behavior. Given the limited size of the time-series data set with at most 249 trading days in 2015, the model is very likely to over-fit the training data, in particular for the less active dealers. The other extreme is to combine all of the history over all dealers. An alternative approach is to create clusters of dealers so that we avoid over-fitting while attempting to build more personalized models; We use a set of features that are computed over the entire training interval to create four clusters.
3. Prediction Models
We first summarize the characteristics of various neural networks. Then, inspired by the ReZero Transformer, we propose our Pointwise-Product ReZero (PPRZ) Transformer.
3.1. Models
Fully-Connected Neural Network (FC):
For simplicity, we use the three-layers FC networks as our baseline.
There are two variations for the input of FC. One is , which sums over the time-series input data, the other is , which concatenates the input sequence.
RNN Based Models:
An RNN based model is a time-series non-linear function that recursively calculates a sequence of hidden states by converting a sequence of vectors. We apply a Long Short-Term Memory (LSTM) based model (Gers et al., 1999) and a Bidirectional LSTM (BiLSTM) based models (Graves and Schmidhuber, 2005).
Transformer Based Models:
A Transformer (Vaswani et al., 2017) is good at recognizing patterns of time-series data by leveraging positional encoding, Self-Attention Mechanism, and Multi-Head Attention Mechanism. In this paper, We evaluate a Vanilla Transformer (Vaswani et al., 2017) and a ReZero Transformer (Bachlechner et al., 2020). The difference between a Vanilla Transformer and a ReZero Transformer is that the Layer Normalization (Ba et al., 2016) is replaced with the ReZero.
3.2. Modification to the ReZero Transformer
Inspired by (Bachlechner et al., 2020), we propose the Pointwise-Product ReZero (PPRZ) Transformer model. In addition, we propose a Co-Trading Embeddings (CTE) to take advantage of distributed representations. We use the ’tanh’ function for all activation functions and apply a mean square loss to perform multi-label classification.
Pointwise-Product ReZero Transformer (PPRZ Transformer):
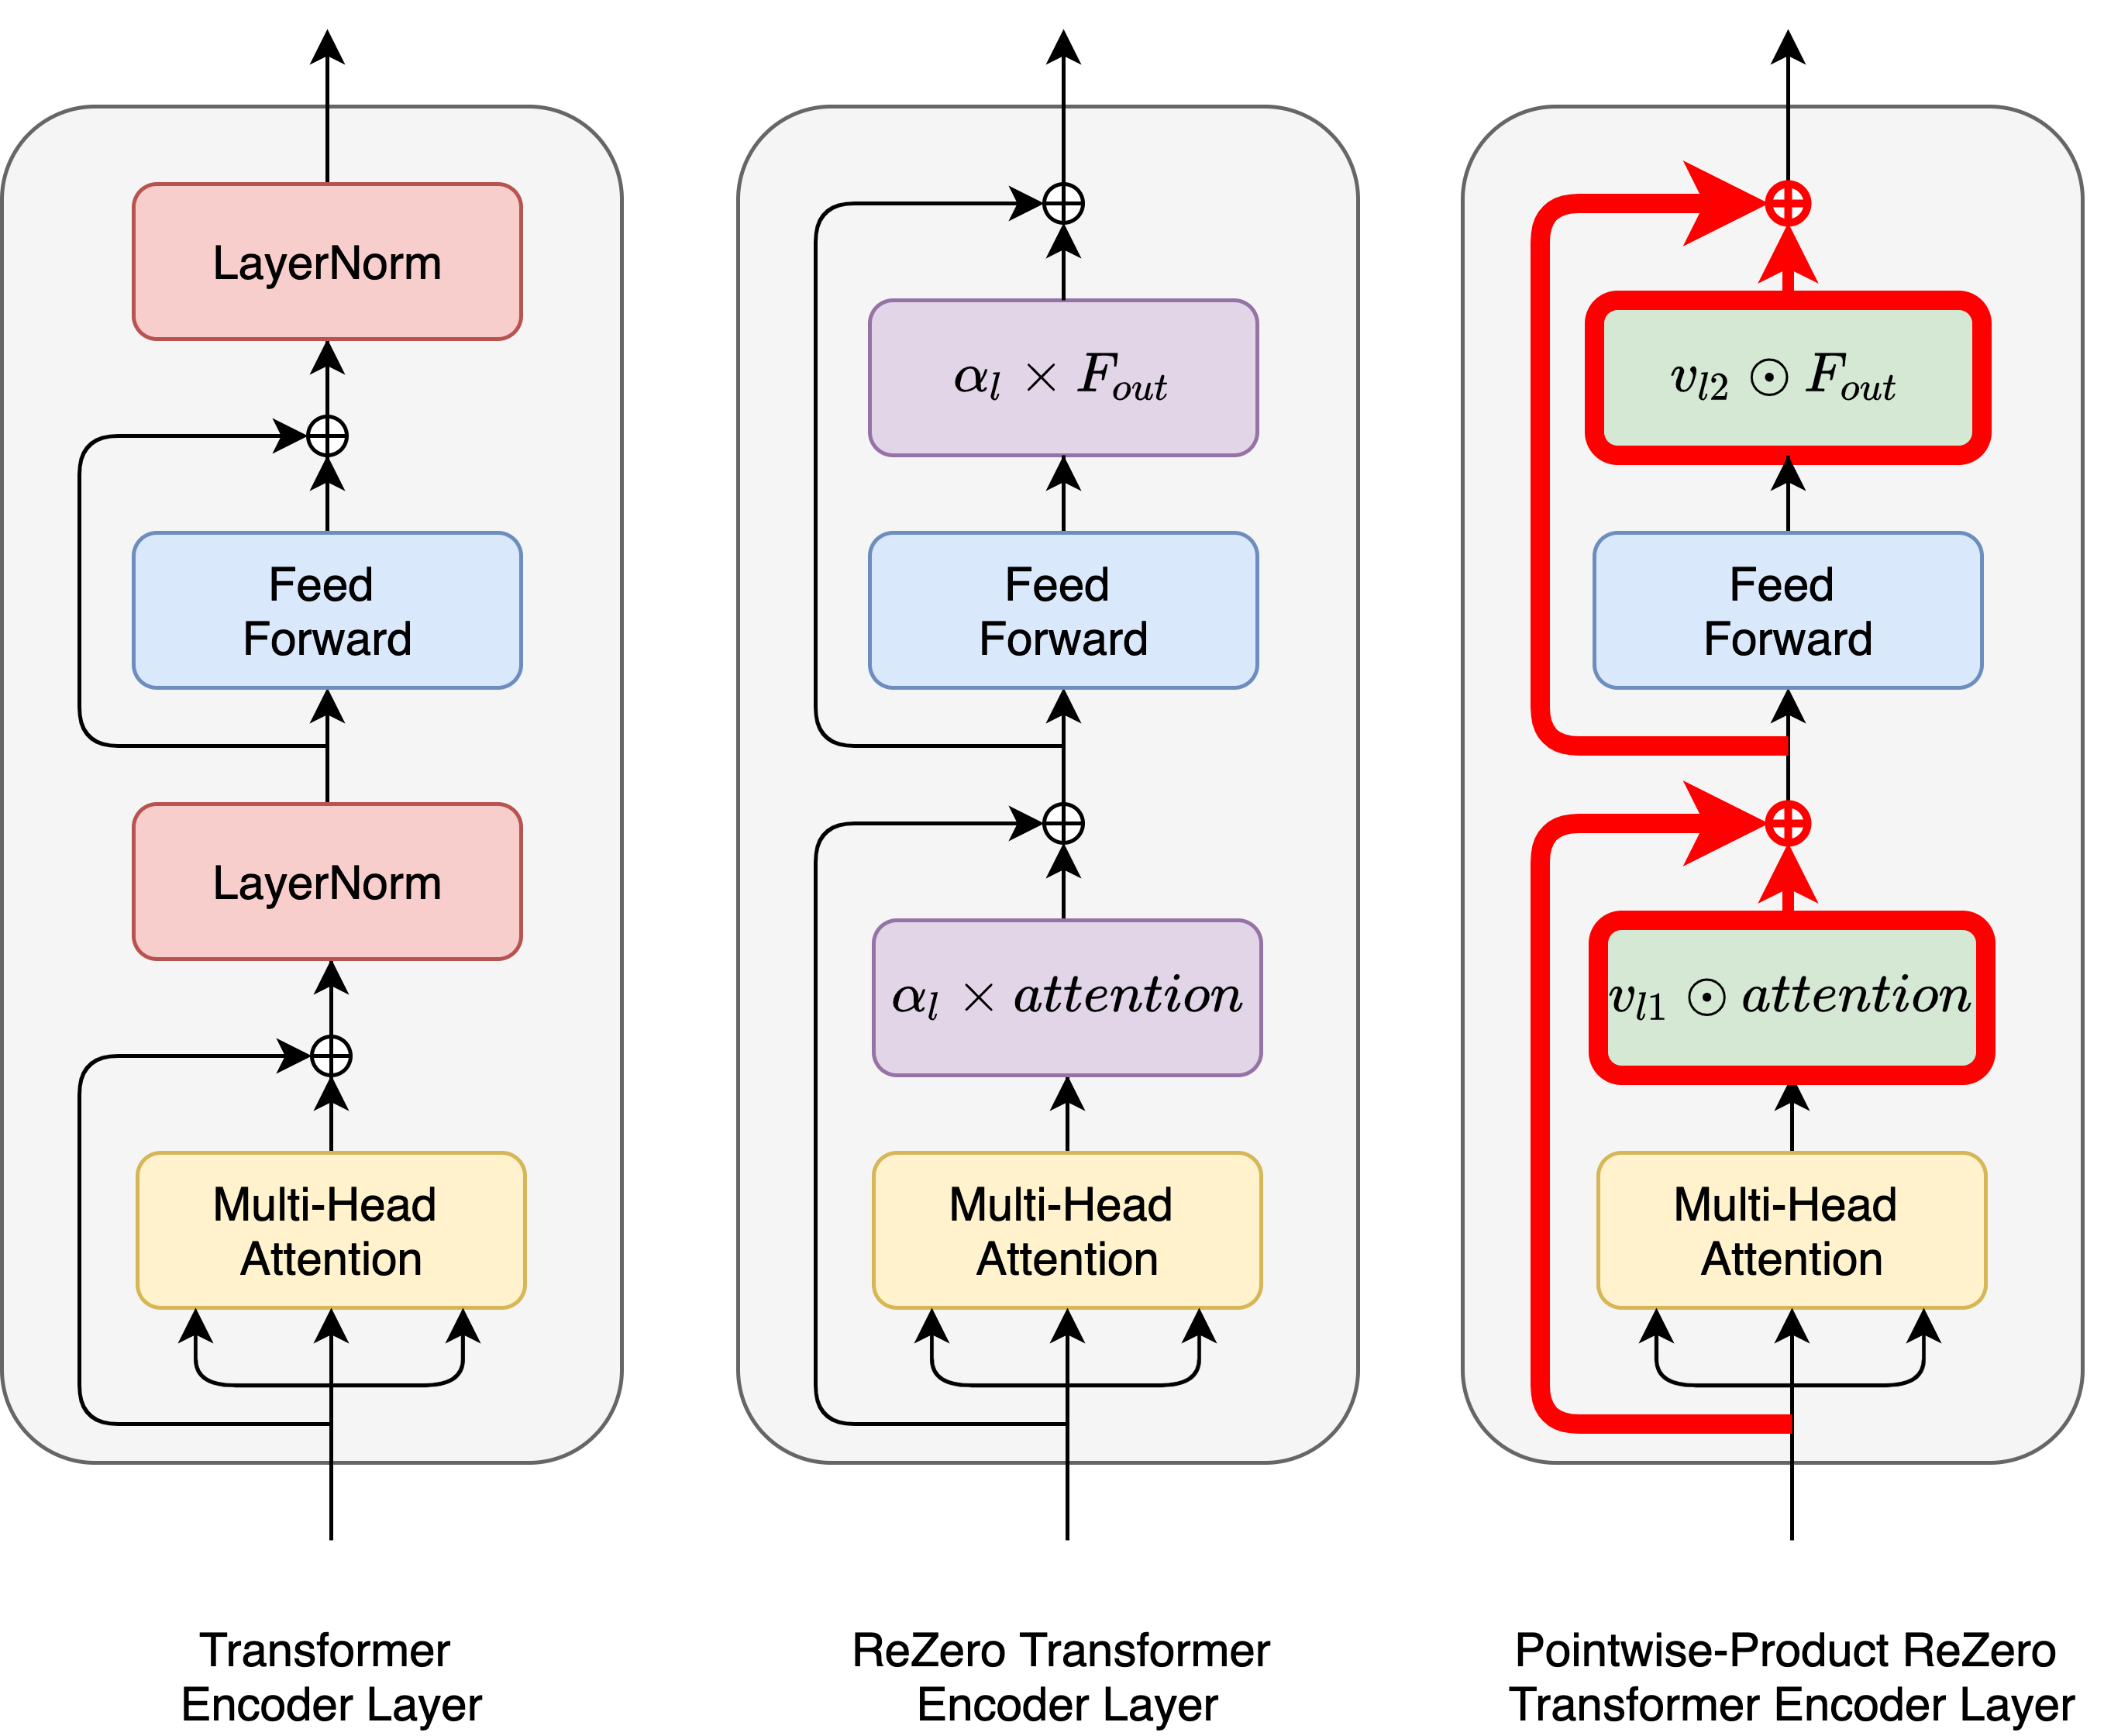
Figure 2 illustrates the key changes to the PPRZ Transformer model. We replace the Layer Normalization of the Transformer. Normalization aims to reduce ’covariate shift’ (Ioffe and Szegedy, 2015) by ensuring that signals have a zero mean and unit variance as they propagate through a network. From the definition of the ReZero in section 3.1, we observe that by using a scalar multiplier , it may be difficult to reduce covariate shift. To improve on the normalization effect, the PPRZ will replace the scalar and the multiplier operator.
Let and be the input and the output of the layer respectively where is the last dimension. Let be a dimension trainable vector and be a pointwise product. Then PPRZ is defined as . Since is is a trainable vector, it can be adjusted for each element of . Our experiment results show that the output signal of the PPRZ Transformer is closer to a zero mean and unit variance, in comparison to the output signal of the ReZero Transformer.
Co-Trading Embedding (CTE):
We first create a trainable embedding of dimensions for each bond and then sum over all the traded bonds in day. We label it as CTE since it captures features reflecting the co-trading of groups of bonds, by the same dealer. Following the weight sharing movement in (Press and Wolf, 2016), the CTE layer is shared between the encoder and the decoder of all Transformer based models.
4. Experiments and Summary
4.1. Setup
Data: As discussed earlier, we considered the 200 most active dealers, and we filtered out the most active bonds.
Train/Test: We used 90% of the data as training data, this is the interval prior to November 25. Each training and test sample comprises an input of days and an output of days. We vary from 5 to 10 to 15 days, to provide a diversity of training patterns.
Models: We consider the following three variants for the granularity of dealers and training data for the models:
-
•
Individual: We use each individual dealer’s transaction history to train a personalized model for the dealer.
-
•
Cluster: We combine the transaction history of all the dealers within a cluster to train the model. We illustrated the range of dealer behavior in Figure LABEL:fig:dealer_discrepancy and considered properties used for clustering in Section LABEL:subsec:clustering.
-
•
Single: We train a single model on the combined transaction history of the 200 dealers.
Metrics: We evaluate our models using precision, recall, and the F1 score.
4.2. Results
We first compare the accuracy of prediction using the F1 score for the eight variants, and for four clusters. We then use the best model () to compare the training data variants of ’Individual’, ’Cluster’, and ’Single’.
| F1 score | least | less | more | most | avg |
|---|---|---|---|---|---|
| 42.8 | 43.8 | 41.6 | 52.6 | 44.1 | |
| 81.7 | 72.6 | 57.8 | 54.2 | 68.3 | |
| 88.8 | 76.2 | 64.9 | 56.9 | 73.7 | |
| 87.8 | 81.3 | 72.2 | 61.2 | 77.7 | |
| 91.7 | 81.7 | 68.8 | 61.2 | 77.9 | |
| 91.7 | 83.6 | 70.7 | 58.8 | 78.7 | |
| 86.5 | 84.1 | 74.9 | 55.1 | 78.3 | |
| 93.0 | 88.3 | 76.1 | 60.1 | 82.3 |
F1 Score for Model Variants:
Table 1 reports on the F1 score for four clusters. The model exhibits the least accuracy of prediction across all four clusters. This is not surprising since summarizes the time-series training input , and is unable to benefit from the time-series. This is reflected in the improved accuracy of over ; it utilizes a concatenation of the time-series training input but it cannot benefit from the ordering. The other six models are able to utilize the full information of the time-series of the training data input and show significant performance improvement. This confirms the importance of the time dimension on the models.
The models based on a Transformer typically achieve a higher F1 score, in comparison to LSTM and BiLSTM. We believe that the attention mechanism in the Transformer-based models is better able to exploit temporal patterns as well as the importance of more recent information, in the models. Further, the Transformer with the layer, performs better than the one without the layer, . We speculate that the layer can capture co-trading relationships and reduce the impact of sparse input, in the less active clusters, leading to an improvement for these clusters.
Finally, our proposed PPRZ Transformer is able to outperform all of the other models, for all of the clusters, except the cluster with the most active dealers. We note that for this most active cluster, the most accurate performance is from the BiLSTM model. This suggests that while the embedding provides an advantage for the less active clusters, this advantage is not observed in the most active clusters with sufficient training data.
Comparison of ’Individual’, ’Cluster’, and ’Single’ Training Variants:
From our preliminary experiments which report on the results of our PPRZ Transformer, for the most active cluster, the ’Individual’ variant has the best performance. One reason is that the similarity among those most active dealers is low so that the clustering for them is ineffective for prediction. Those most active dealers trade numerous of bonds in a day. In addition to popular bonds, they trade bonds in various domains, and they share fewer commonalities in trading those bonds with other dealers. For the other three clusters, the ’Cluster’ models have the best performance, followed by the ’Single’ variant; the ’Individual’ variant has the worst performance. For the least active dealers, those dealers may share more commonalities with each other, or the bonds they trade are more susceptible to the same issues. Besides, dealers from the same cluster share the same vocabulary, thus different dealers could adjust the vocabulary and make the model more robust. Overall, the ’Cluster’ level models are more effective for predicting the trading actions than the ’Individual’ and ’Single’ level models.
4.3. Conclusion
We compare the performance of a range of deep learning models and we propose an extension, Pointwise-Product ReZero (PPRZ) Transformer. We demonstrate that the PPRZ Transformer has improved prediction accuracy. There is significant variance in the level of activity of dealers; we thus considered three variants of ’Individual’, ’Cluster’, and ’Single’, to group the training data of the dealers.
Acknowledgements.
We acknowledge the support of NSF Grant OIA 1937153 and JP Morgan AI Faculty Research Award 19051422.References
- (1)
- Ba et al. (2016) Jimmy Lei Ba, Jamie Ryan Kiros, and Geoffrey E Hinton. 2016. Layer normalization. arXiv preprint arXiv:1607.06450 (2016).
- Bachlechner et al. (2020) Thomas Bachlechner, Bodhisattwa Prasad Majumder, Huanru Henry Mao, Garrison W Cottrell, and Julian McAuley. 2020. ReZero is All You Need: Fast Convergence at Large Depth. arXiv preprint arXiv:2003.04887 (2020).
- Dick-Nielsen (2014) Jens Dick-Nielsen. 2014. How to Clean Enhanced TRACE Data. Available at SSRN: https://ssrn.com/abstract=2337908 (2014).
- Gers et al. (1999) Felix A Gers, Jürgen Schmidhuber, and Fred Cummins. 1999. Learning to forget: Continual prediction with LSTM. (1999).
- Graves and Schmidhuber (2005) Alex Graves and Jürgen Schmidhuber. 2005. Framewise phoneme classification with bidirectional LSTM and other neural network architectures. Neural networks 18, 5-6 (2005), 602–610.
- Ioffe and Szegedy (2015) Sergey Ioffe and Christian Szegedy. 2015. Batch normalization: Accelerating deep network training by reducing internal covariate shift. arXiv preprint arXiv:1502.03167 (2015).
- Press and Wolf (2016) Ofir Press and Lior Wolf. 2016. Using the output embedding to improve language models. arXiv preprint arXiv:1608.05859 (2016).
- Vaswani et al. (2017) Ashish Vaswani, Noam Shazeer, Niki Parmar, Jakob Uszkoreit, Llion Jones, Aidan N Gomez, Łukasz Kaiser, and Illia Polosukhin. 2017. Attention is all you need. In Advances in neural information processing systems. 5998–6008.
- Xue (2018) Jinming Xue. 2018. Two-Sided OTC Dealer Network. University of Maryland Smith School of Business Technical Report (2018).