Synthesis of boron carbide from its elements up to 13 GPa
Abstract
The formation of boron carbide under high pressures and from elemental reactants has been studied and optimum parameters have been determined by varying the (P, T, reactants) conditions. To this end, stoichiometric mixtures of commercial rhombohedral boron and amorphous glassy carbon have been subjected to temperatures ranging from 1473 K to 2473 K at pressures of 2 GPa, 5 GPa and 13 GPa. Similar syntheses have been repeated for mixtures of boron and graphite, and amorphous boron and amorphous carbon at 2 GPa and 5 GPa. The carbon concentration of boron carbide is shown to be affected by pressure at which it is synthesised from elements, and we propose pressure as a means to control the carbon content. The formation temperature is shown to be affected by the pressure and the choice of the reactants. The effect of temperature cycling on the formation temperature has also been studied. The formation of boron as an intermediate phase is seen at 5 GPa before the formation of boron carbide.
I Introduction
Boron carbide is a widely used ceramic with applications ranging from abrasives to defense purposes like safety armours and bullet-proof jackets Caretti et al. (2008). These applications depend on its mechanical properties such as high hardness Herrmann et al. (2013) - its Vickers hardness is 38 GPa, a specific density as low as 2.52 g/cc Roy et al. (2006), and high chemical stability Caretti et al. (2008); Kakiage et al. (2012); Thévenot (1990).
Industrially, boron carbide is formed through carbothermic or magnesiothermic reactions Roy et al. (2006); Suri et al. (2010); Alizadeh et al. (2006), since these processes are the most viable ones economically. However, the final product obtained through these processes contains impurities. In wide contrast, producing boron carbide from elements -boron and carbon of the highest purity- results in products of the highest purity too Suri et al. (2010). Therefore, the synthesis of boron carbide from its elements is a very important process when the purity of the final product is of primary importance.
Numerous studies have been performed on the synthesis of boron carbide with various reactants at ambient pressure or at low pressures (<50 MPa) with the hot pressing technique Thévenot (1990); Gosset (2020). Hot pressing results in the formation of dense boron carbide powders by mixing fine and pure powders of rhombohedral boron and graphite under a pressure smaller than 50 MPa and high temperatures. There have been several studies on the properties of boron carbide crystals at high pressures Yan et al. (2009); Fujii et al. (2010); Mukhanov et al. (2012); Dera et al. (2014); Hushur et al. (2016). However, only one study has reported the synthesis of crystalline boron carbide without disorder at 8 GPa, but the synthesis reactants were not mentioned Mondal et al. (2016). Boron carbide single crystal nanoparticles have also been synthesised in vacuum Chen et al. (2004) and single crystalline boron carbide nanobelts have been synthesised using chemical vapour deposition (CVD) at atmospheric pressure Li-Hong et al. (2008).
So far, only one study has recorded the synthesis parameters of boron carbide from boron and carbon at the GigaPascal (GPa) range of pressure Chakraborti et al. (2020). However, this study was performed with limited (P, T, reactants) conditions. Also, an intermediate phase was mentioned in this paper but not identified. In particular, the reactants were either rhombohedral boron and amorphous carbon or rhombohedral boron and graphite. One of the main purposes of the current work is to fill the gap. Consequently, a systematic study of the formation of boron carbide at high pressure has been performed up to 13 GPa in order to fix the optimum parameters for synthesis. In the present work, the first objective is to identify the intermediate phase(s) that precede the formation of boron carbide and thus compete with the formation of boron carbide - this is observed at 5 GPa, but not at 2 GPa. The second objective is to find out the optimal conditions of pressure, temperature and reactants to form boron carbide. The direct synthesis from the elements avoids the formation of ternary products, which simplifies the characterisation process Anselmi-Tamburini et al. (2005).
In the present work, the optimum (P, T, reactants) parameters of the synthesis of boron carbide from elements (boron and carbon) have been analysed for 2 GPa and 5 GPa for three combination of reactants: a) rhombohedral boron and amorphous carbon, b) rhombohedral boron and graphite and c) amorphous boron and amorphous carbon using the Paris-Edinburgh press. Moreover, the synthesis temperature at 13 GPa has been studied using, as reactant mixture, rhombohedral boron and amorphous carbon using a different press with respect to Ref. Chakraborti et al. (2020): a multi-anvil cell. The syntheses have also been studied in situ at the SOLEIL Synchrotron for the first time.
II Materials and methods
II.1 Synthesis conditions at 2 and 5 GPa
The methodology of the synthesis experiments done in the Paris-Edinburgh press at 2 and 5 GPa has been discussed in an earlier work Chakraborti et al. (2020). Additional experiments have been performed in the current work at 2 GPa and 5 GPa using the same methodology starting with a reactant mixture of amorphous boron (Pavezyum, purity >98.5 %, particle size <250nm) and glassy amorphous carbon (Sigma-Aldrich, purity 99.95 % trace metals basis, particle size 2 – 20 microns).
Some in situ experiments were also performed in the PSICHE beamline of the SOLEIL synchrotron. The in situ experiments not only help us to confirm the results obtained from in situ syntheses but are also critical for understanding the mechanism of the synthesis, especially when the intermediate phase forms. This is the first time in situ synthesis of boron carbide from elements have been done, since the low atomic number of boron and carbon and hence the lower scattering by these elements poses a challenge.
For these in situ experiments, the samples were subjected to the desired pressure and then the temperature was slowly increased. At each step of the temperature increase, a diffractrogram of the sample centre was produced using the white synchrotron beam in order to understand the evolution of the reactants into the final product in real time. The white beam has an energy range of 15 - 80 keV. and it is focused to a size of 25 m (in the vertical direction) on the sample, collimated to 50 m in the horizontal direction. The diffractograms were taken at various sample positions in order to ensure the homogeneity of the reactions.
Energy dispersive X-ray diffraction (EDXRD) is the usual configuration used for large volume press (LVP) experiments in the PSICHE beamline. The EDXRD is complemented by the CAESAR system. The PSICHE beamline in SOLEIL synchrotron is the only synchrotron in Europe to provide the CAESAR facility, originally proposed by Wang et al. Wang et al. (2004). Whereas EDXRD is advantageous in large volume press experiments in synchrotron environments because of its rapid acquisition time, background and waste signal removing efficiency, and high efficiency in working with limited sample volume and aperture, it has numerous disadvantages as well. The principal among these disadvantages are the complex corrections for intensity required for the Rietveld refinement and the presence of detector artifacts. 1D in situ ADXRD techniques can be used to overcome these shortcomings, but they require a special Soller slits system to remove the signal from the sample environment [88]. Thus, the combination of the complementary ADXRD and EDXRD in one system, as done in CAESAR, overcomes their respective drawbacks. The CAESAR system provides access to a higher Q range and peaks intensities are well resolved which makes the data collected suitable for structural refinement.
For all EDXRD as well as CAESAR measurements, rotating Ge solid-state detector is used. Three collimating slits are also present: one is positioned before the press and the other two are positioned between the press and the detector.
The EDXRD diffractograms were each taken for 2 minutes each. The data obtained with the synchrotron radiation has been converted to Cu K in order to facilitate the treatment and analysis of the data and to compare these in situ data to the ex situ results.
II.2 Synthesis conditions at 13 GPa
Two syntheses at 13 GPa were also performed using a mixture of crystalline boron (Prolabo, purity 99.9% , particle size 1-10 microns) and glassy amorphous carbon which have been mixed in a hard mortar and pestle for 5 minutes in the stoichiometric ratio of 4:1. Both the in situ and ex situ experiments were performed using the DIA module of the multi-anvil press Liebermann (2011). A pressure of 130.5 GPa was attained on both cases over a span of 8 hours.
II.2.1 Application of (P,T) conditions in the in situ experiments at 13 GPa
The in situ experiment was performed in the PSICHE beamline of the SOLEIL synchrotron.
For the in situ experiment, the reactant mixture was put in the set-up (set-up 1) shown in figure 1. Pressure was estimated using MgO as a pressure calibrant Dewaele et al. (2000); Tange et al. (2009).
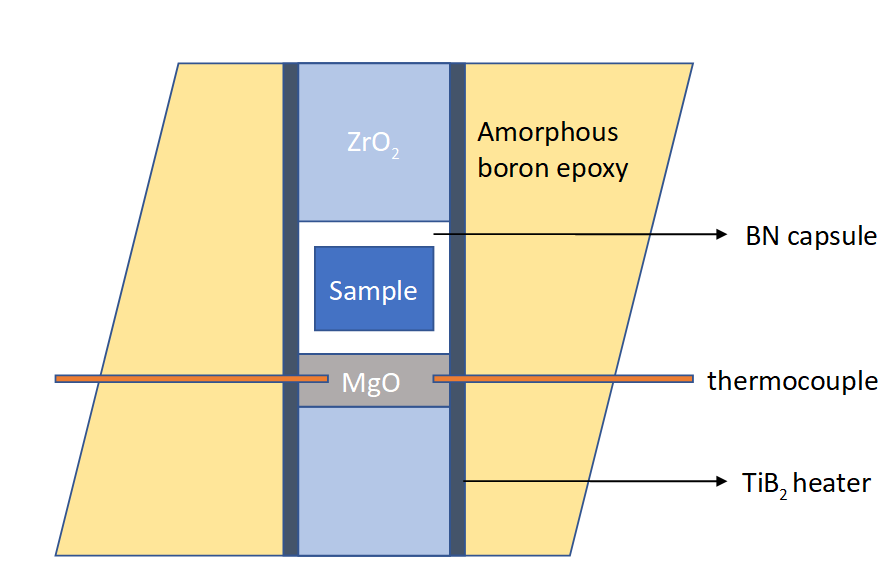
The temperature for the in situ experiment was not increased uniformly (i.e at a constant rate) to the final dwell temperature, as was done in the case of the other experiments. Instead, a thermal cycling was applied in order to observe its effects. The temperature was increased to a specific value for around 3 minutes, the EDXRD pattern was recorded in the center of the sample, and in the following step, the temperature was dropped to 300 K. Next, the temperature was raised to the next higher value and the same process was repeated. The upper limit of the temperature that was attained in each successive cycle has been recorded in table 1. After the final quenching to 300 K, the sample was then decompressed slowly over 4 hours. Finally, a diffractogram was taken using the CAESAR system.
| Cycle | Lower Temp. | Higher Temp. |
|---|---|---|
| 1 | 300 K | 875 K |
| 2 | 300 K | 1170 K |
| 3 | 300 K | 1360 K |
| 4 | 300 K | 1670 K |
| 5 | 300 K | 1912 K |
| 6 | 300 K | 2430 K |
II.2.2 Application of (P,T) conditions in the ex situ experiments at 13 GPa
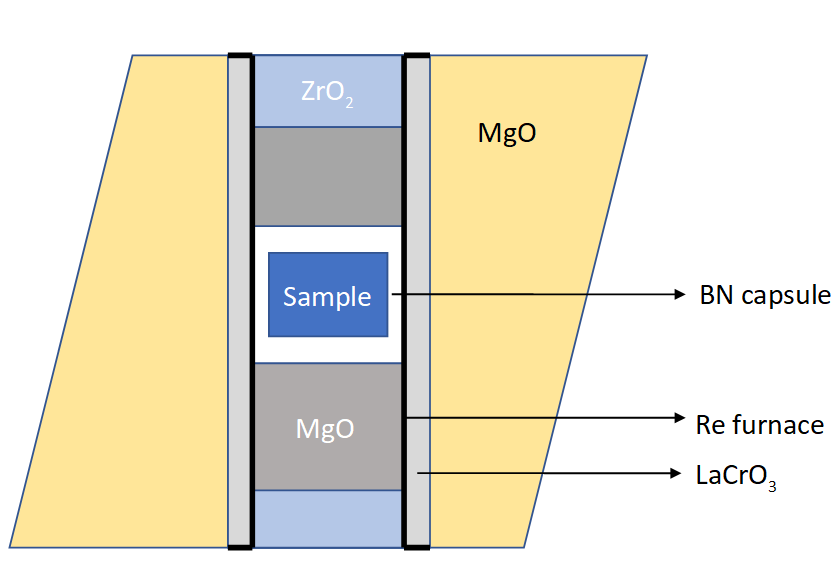
For the ex situ experiment, a different type of set up was used (set-up 2), as shown in figure 2. The main differences are the use of rhenium foil as the heater and LaCrO3 sleeve as a thermal insulator. The metal heater enables us to have a larger sample volume compared to set-up 1, which is important for subsequent ex situ characterisation. The temperature was raised slowly and constantly at a rate of 2 K/s. Temperature was measured using a type C thermocouple (W 5 % Re/ W 26 % Re) with an error of evaluation of 20 K. Then, the sample was subjected to a dwell time of 30 minutes to the ex situ sample: no thermal cycling was performed on this sample.
Pressure was fixed at 13 GPa by using a calibration curve determined beforehand, with an error of evaluation of 0.2 GPa.
After the dwell time of 30 minutes, the sample was quenched rapidly by removing the electrical power. The decompression was done slowly over the span of 4 hours. The sample was then recovered carefully and subjected to characterisation by ex situ X-ray diffraction.
III Results
III.1 Ex situ and in situ diffraction at 2 and 5 GPa
We define the synthesis temperature as the lowest temperature where we observe the formation of boron carbide. The optimal temperature, on the other hand, is defined as the lowest observed temperature at which boron carbide is the prominent product.
Further syntheses performed in this work has confirmed the preliminary results of our previous work Chakraborti et al. (2020) to find out the synthesis temperatures and optimal temperatures of boron carbide at 2 and 5 GPa using reactant mixtures of a) boron and amorphous carbon, and b) boron and graphite. Moreover, in the current work, we have further expanded the scope of the study by using other reactants (amorphous boron), higher pressure values, temperature cycling as well as in situ syntheses. The results have been tabulated in table 2.
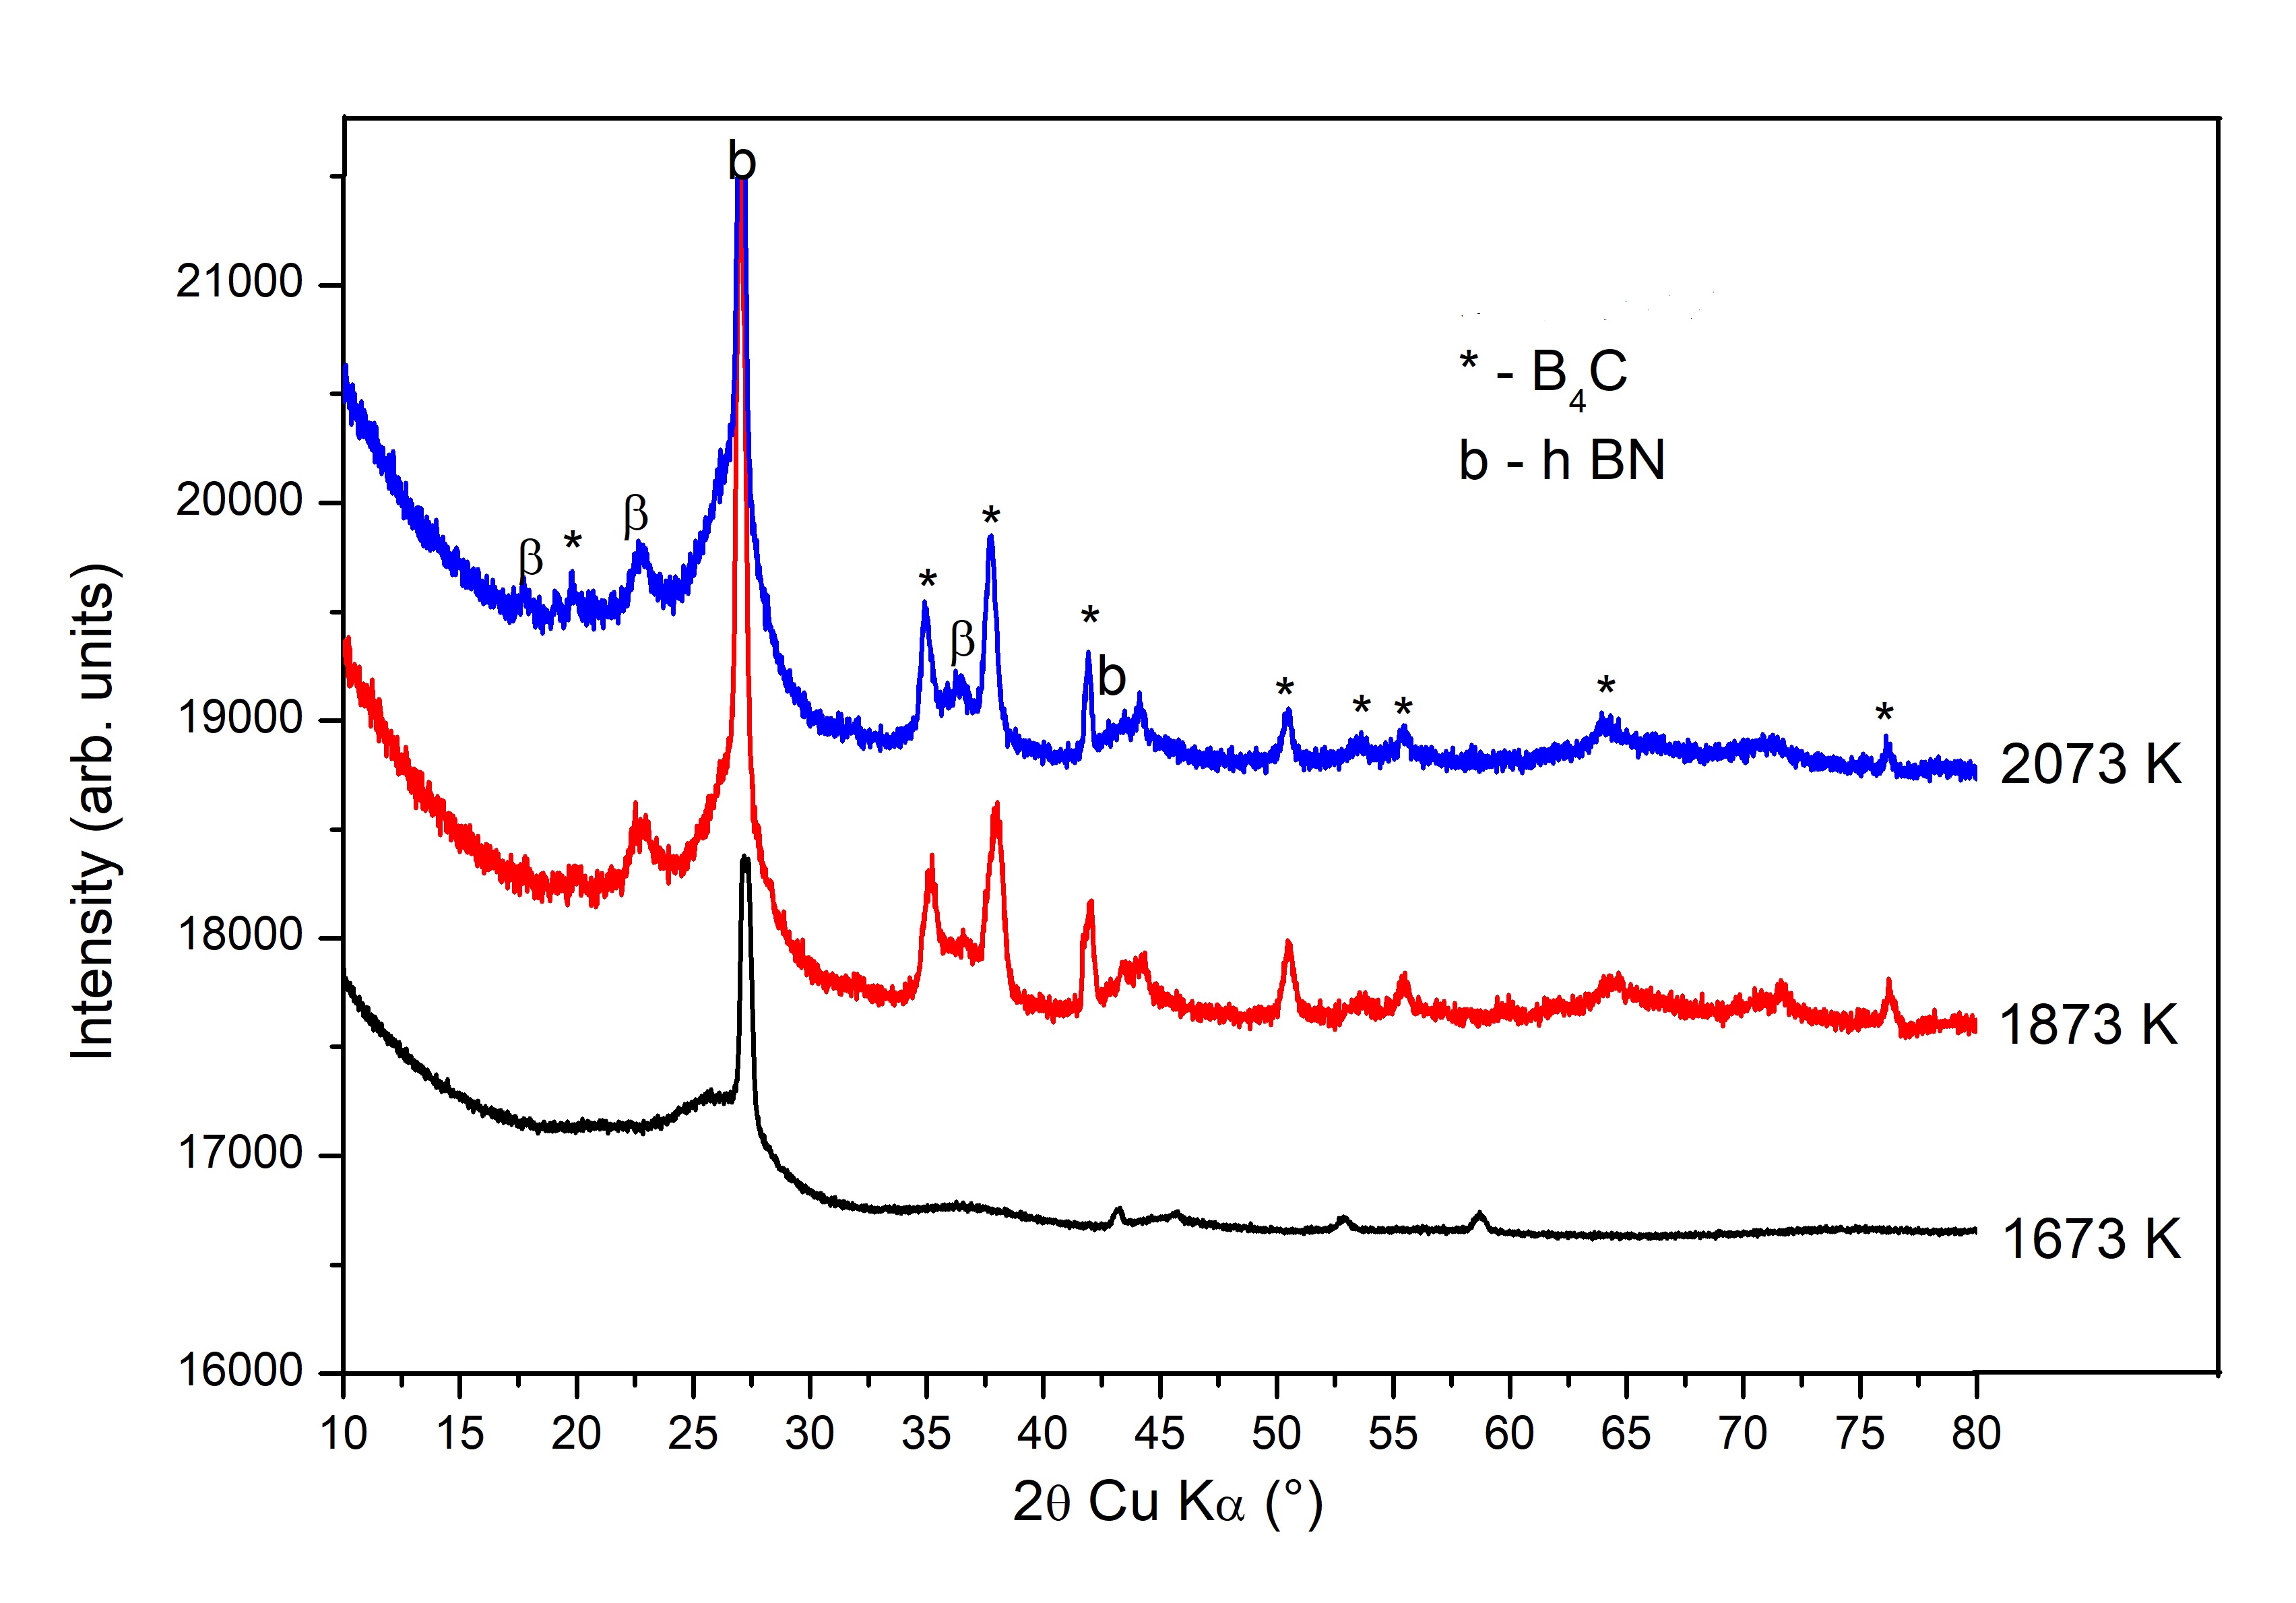
In the current work, the mixture of amorphous boron and amorphous carbon have been subjected to a pressure of 2 0.2 GPa and 5 0.2 GPa respectively. At 2 GPa, the synthesis temperature of boron carbide is 1873 20 K. In figure 3, we report the XRD pattern showing the synthesis of boron carbide from amorphous boron and amorphous carbon at 2 GPa.
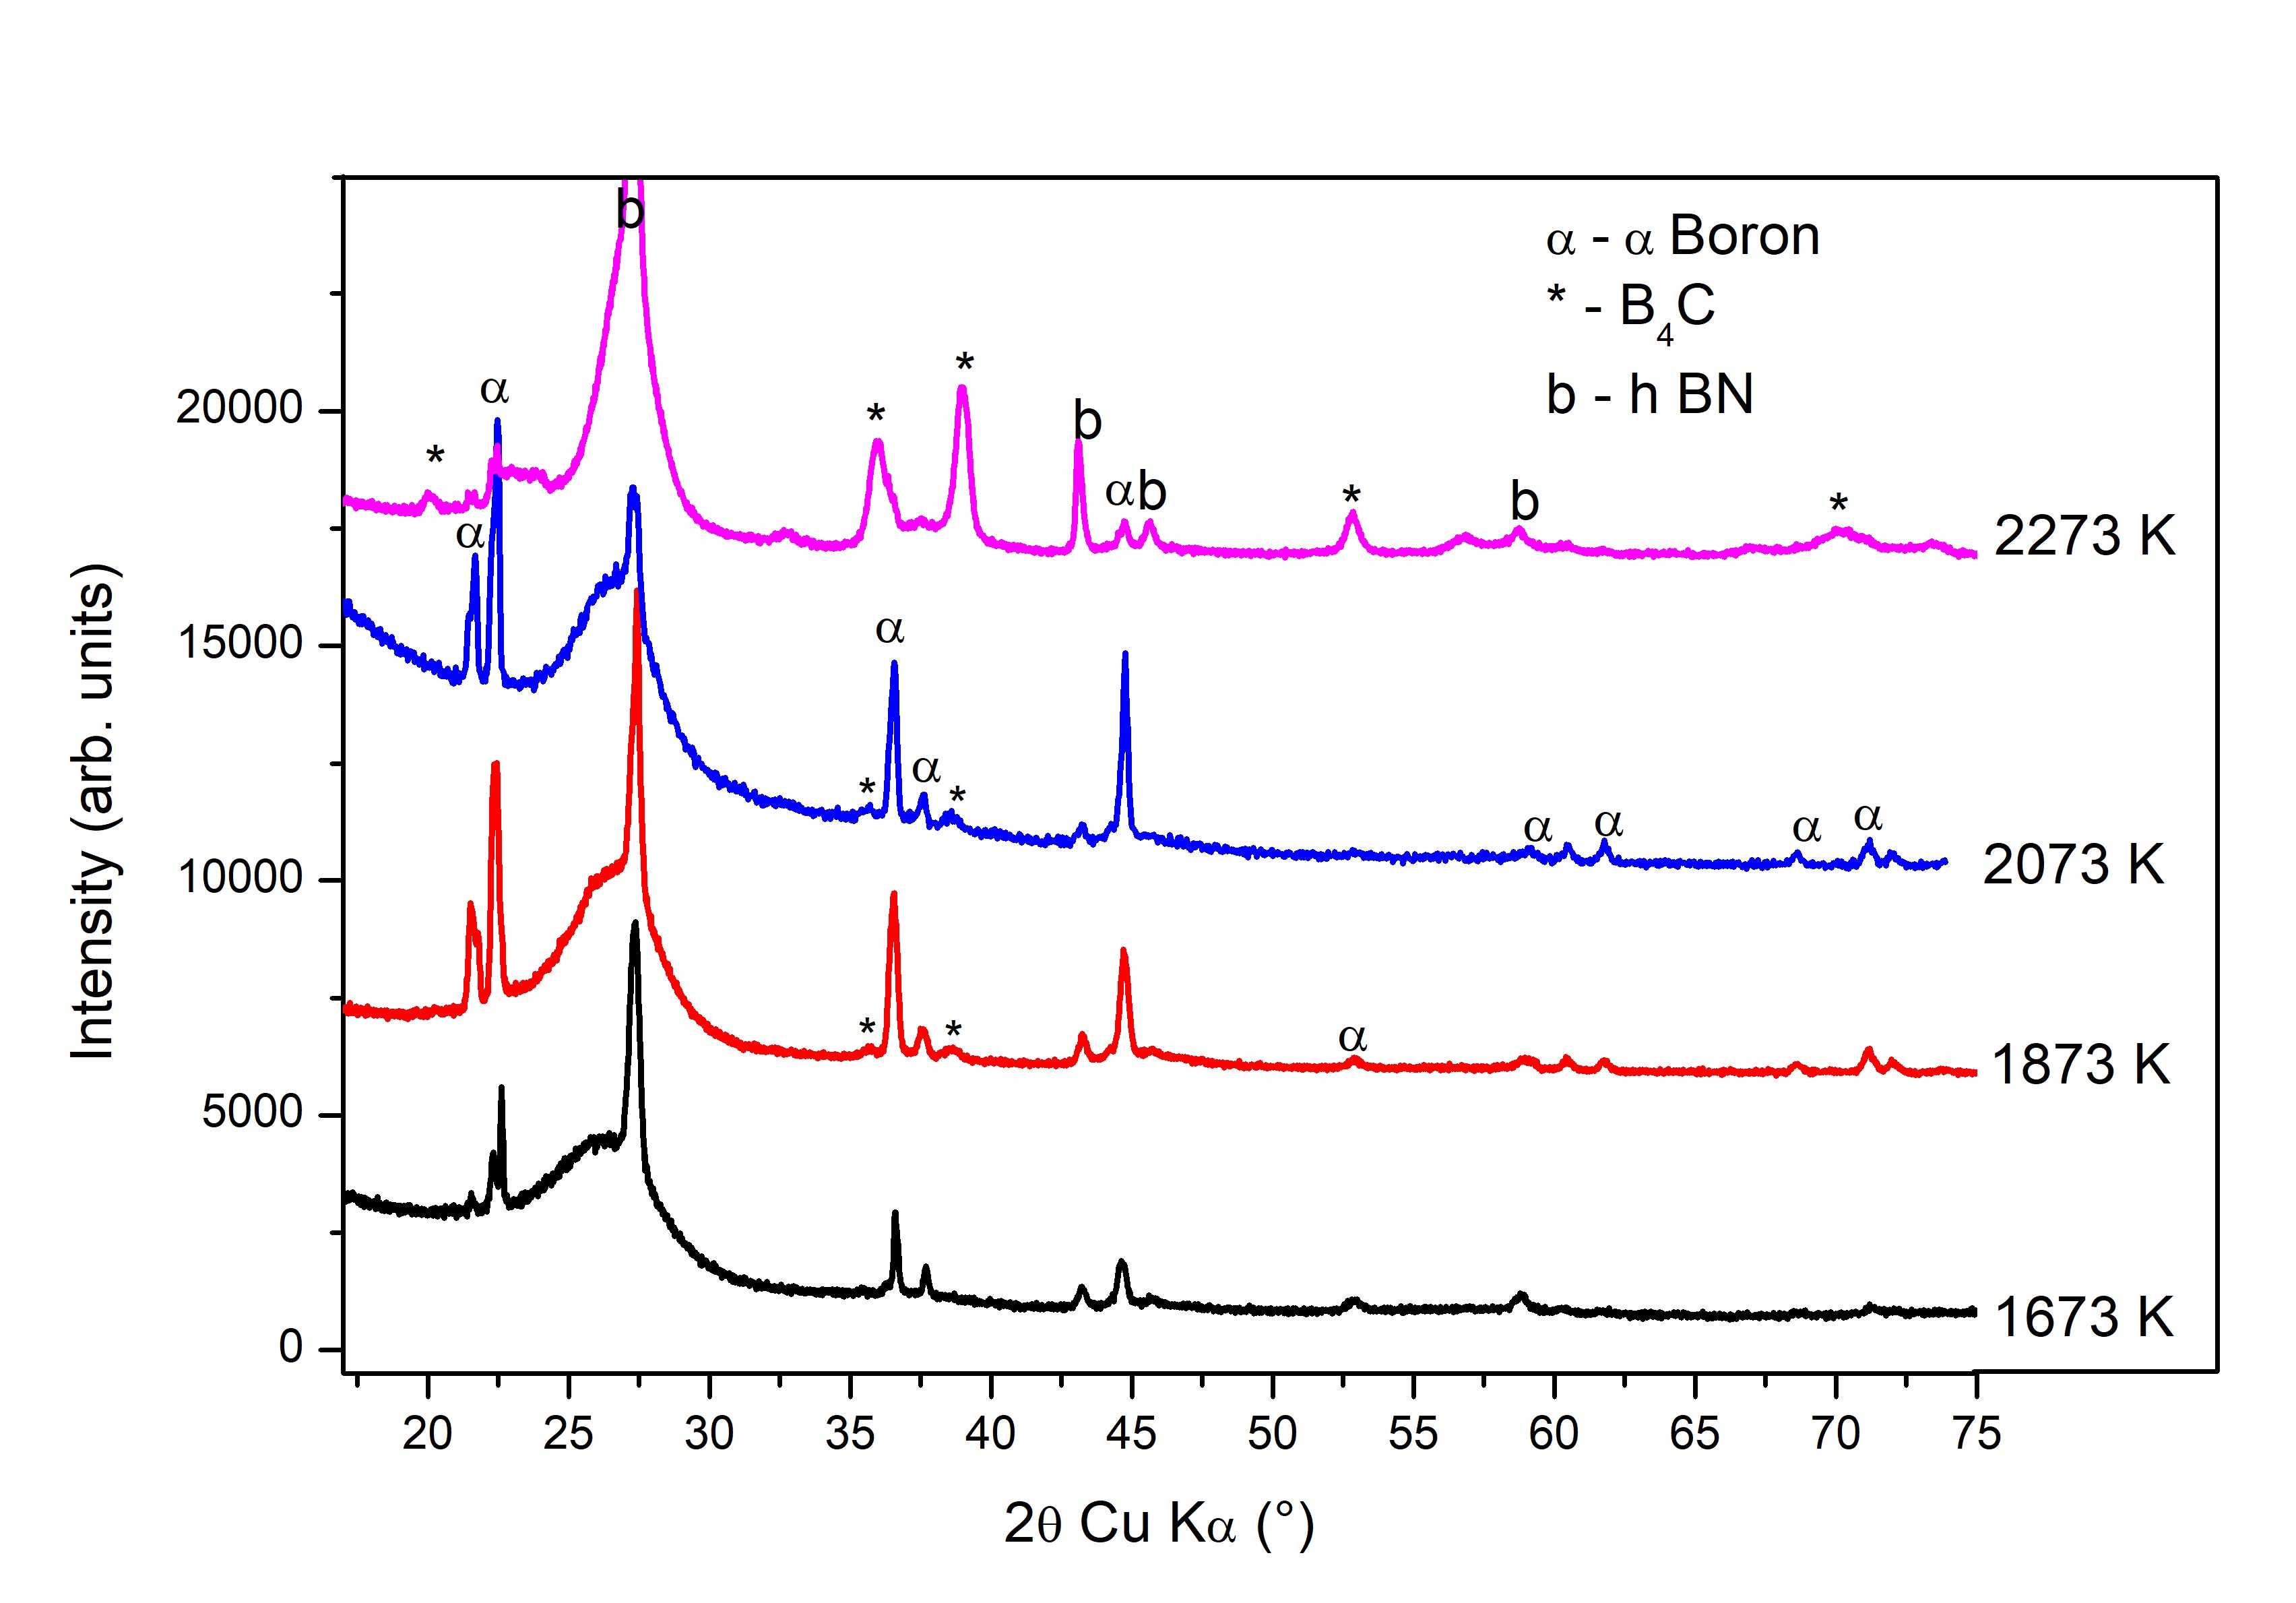
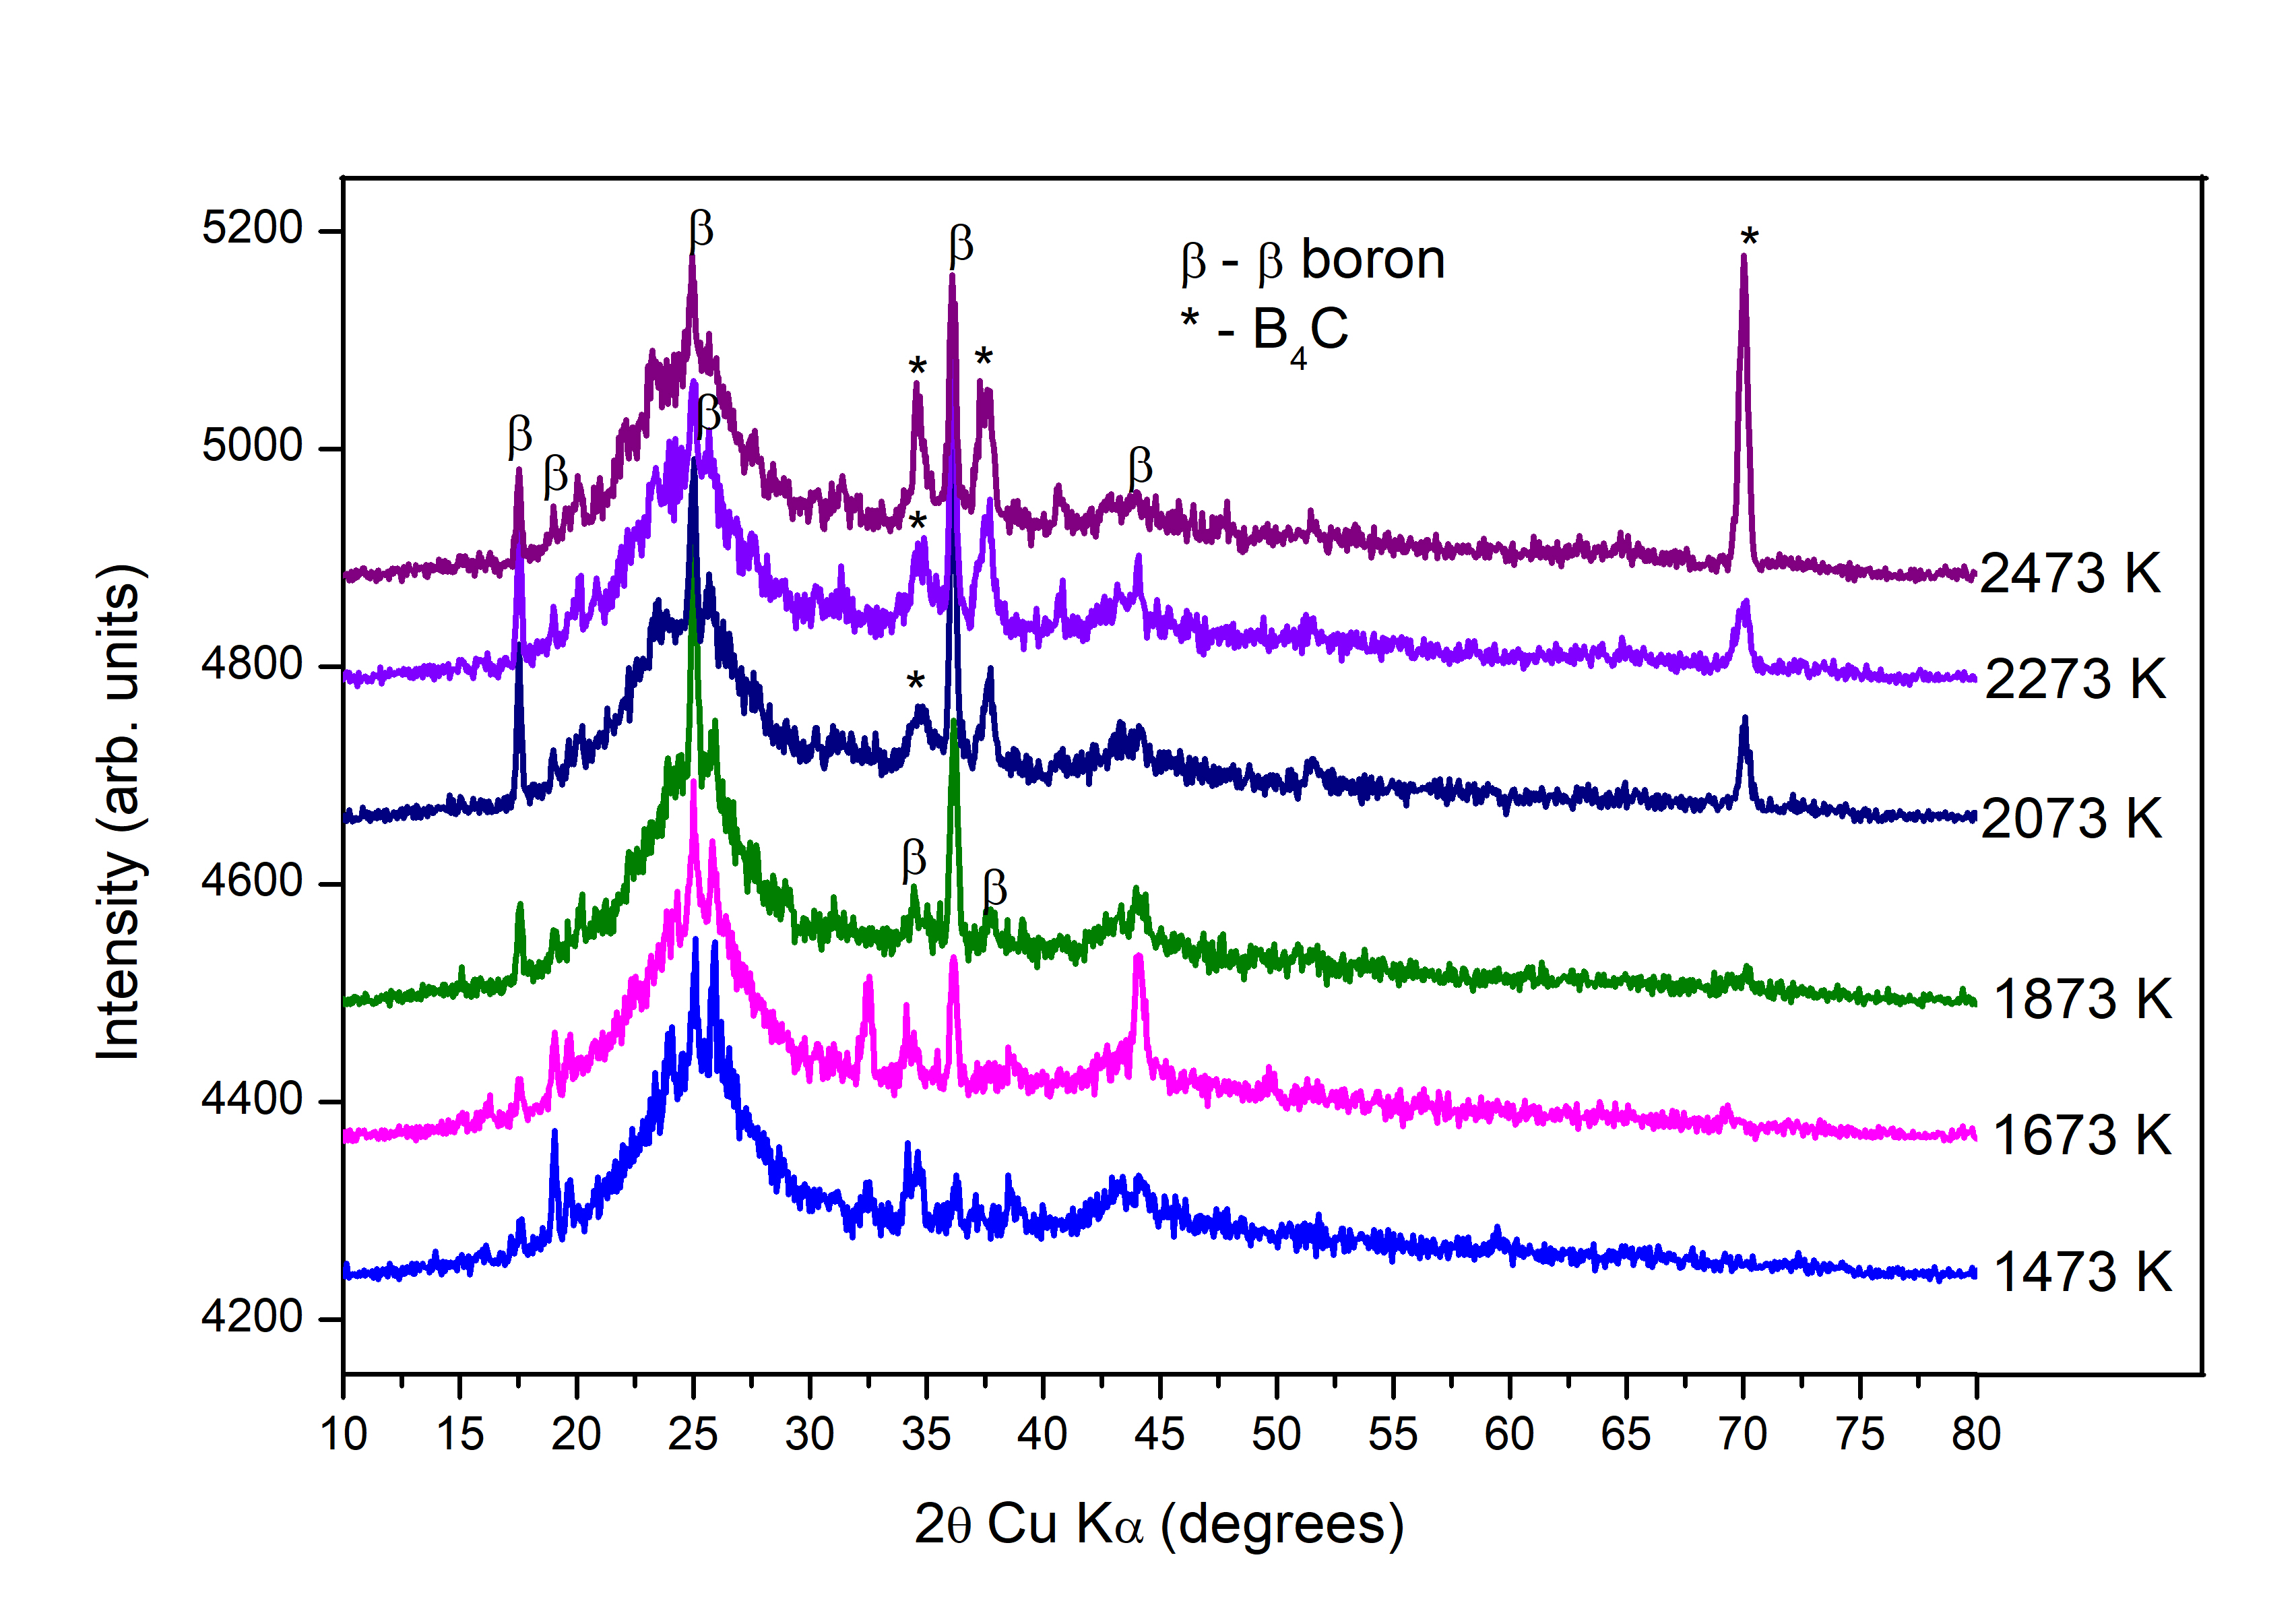
At 5 GPa as well, the temperature of formation of boron carbide decreases from 2273 20 K (when boron is used as a reactant) to 1873 20 K. In figure 4, the XRD patterns at various temperatures for the 5 GPa series are shown. It is observed that only very small XRD peaks of boron carbide appear at temperatures of synthesis of 1873 K and 2073 K. At these temperatures (1873 K and 2073 K), an intermediate phase, identified as boron remained the most prominent phase. Boron carbide becomes the most prominent phase at 2273 K, similar to what was observed during the syntheses with boron and amorphous carbon Chakraborti et al. (2020). Moreover, similar to the case of synthesis from boron, no formation of boron was recorded for the syntheses with amorphous boron at 2 GPa. This is in line with what was observed for the syntheses with boron and amorphous carbon in Ref. Chakraborti et al. (2020).
Additionally, in situ synthesis at 2 GPa, in figure 5, with a reactant mixture of boron and amorphous carbon, corroborated the ex situ results reported in Chakraborti et al. (2020) - boron carbide forms at 2073 K from a mixture of boron and amorphous carbon under a pressure of 2 GPa. The diffractograms were taken within 5 minutes of raising the temperature each time, unlike the 2 hour dwell time that the samples were subjected to for the ex situ syntheses. This means that the reactions were still incomplete when the diffractograms were taken - this is the reason behind the presence of boron and amorphous carbon in the diffractograms even at high temperatures.
| Reference | Pressure | Reactants | heating | Synthesis | Optimal |
| (GPa) | rate | temp. (K) | temp. (K) | ||
| Wang et al, 2009 Wang et al. (2009) | 0.02 | B + graphite | constant | 1573 | - |
| Roszeitis et al, 2014 Roszeitis et al. (2014) | 0.05 | B + graphite | constant | 1606 | - |
| This work | 2 0.2 | amorph. B + amorph. C | constant | 1873 20 | 1873 |
| This work | 5 0.2 | amorph. B + amorph. C | constant | 1873 20 | 2273 |
| Our work, 2020 Chakraborti et al. (2020) | 2 0.2 | B + amorph. C | constant | 2073 20 | 2073 |
| Our work, 2020 Chakraborti et al. (2020) | 2 0.2 | B + graphite | constant | 2273 20 | >2273 |
| Our work, 2020 Chakraborti et al. (2020) | 5 0.2 | B + amorph. C | constant | 2273 20 | 2273 |
| Our work, 2020 Chakraborti et al. (2020) | 5 0.2 | B + graphite | constant | 2473 20 | >2573 |
| This work | 13 0.5 | B + amorph. C | cycling | 2430 20 | >2430 |
| This work | 13 0.2 | B + amorph. C | constant | >2473 | >2473 |
III.2 Diffraction at 13 GPa
We also report the results at 13 GPa.
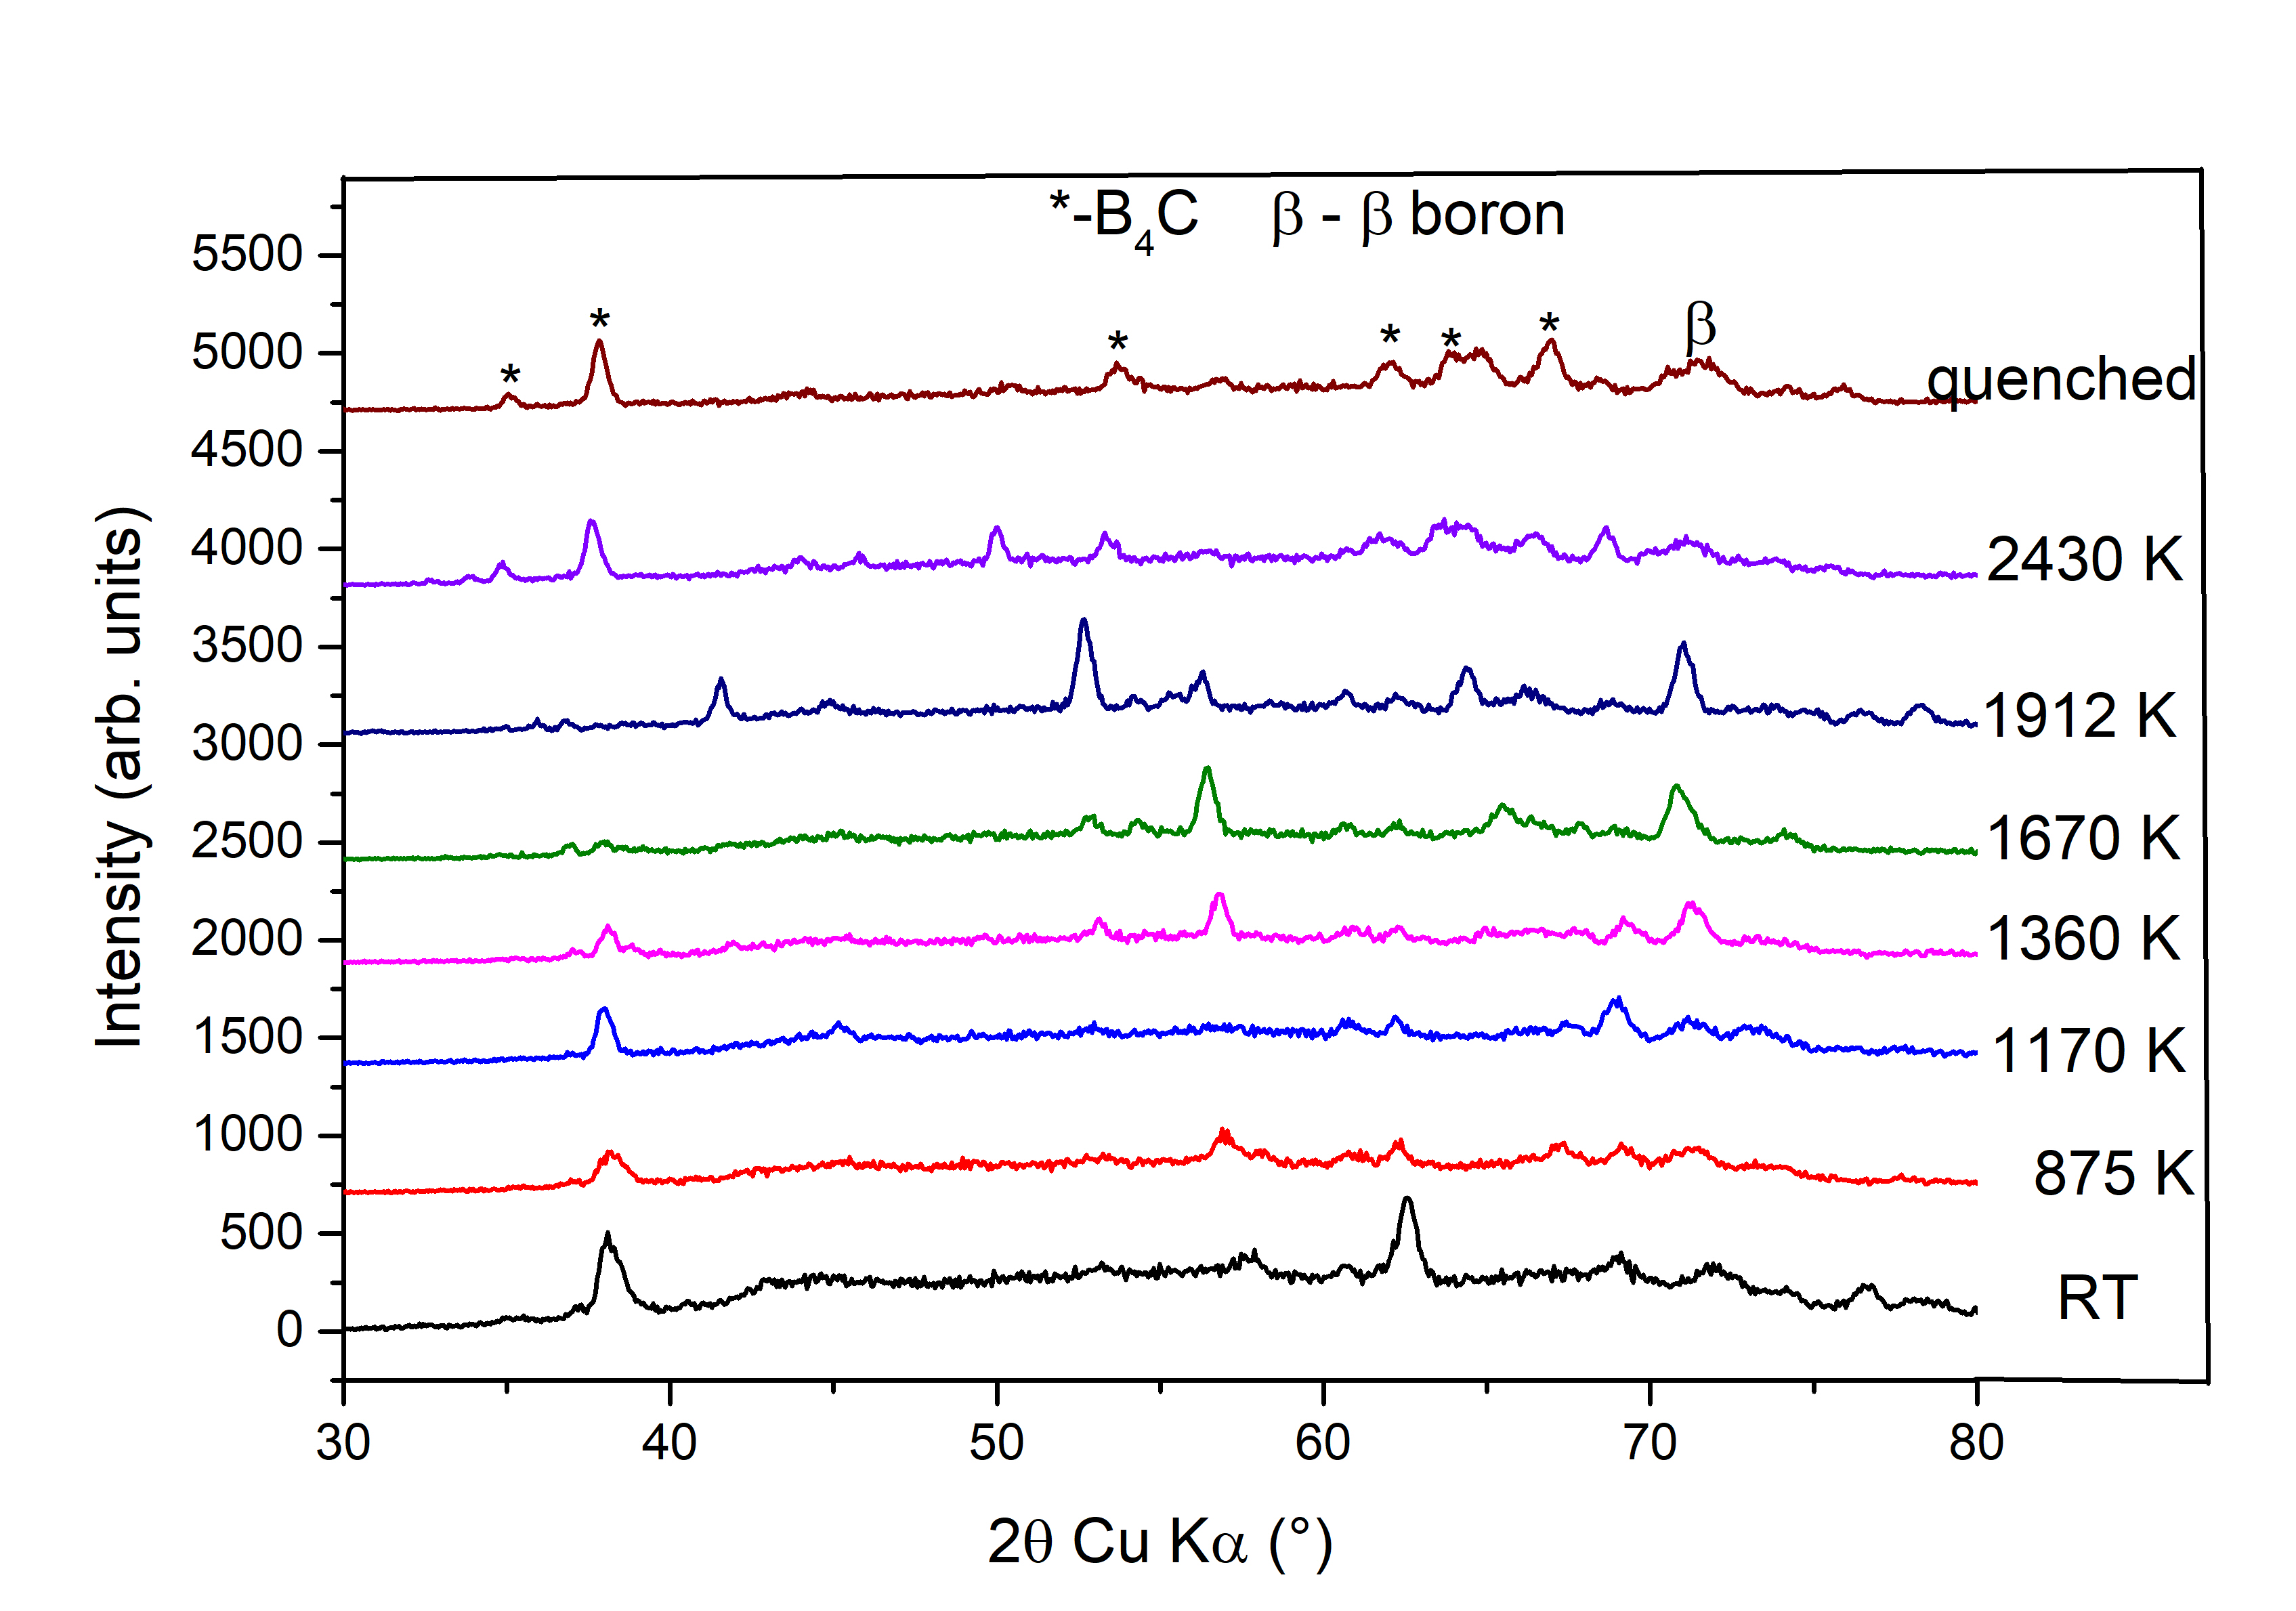
During the in situ run at 13 GPa, a series of EDXRD patterns were taken immediately after the temperature was raised in each cycle and before the system was quenched. Figure 6 shows the EDXRD patterns as a function of rising temperature at 13 GPa. In the figure, the data obtained with the synchrotron radiation has been converted to Cu K in order to facilitate the treatment and analysis of the data.
As the upper limit of temperature is increased in each cycle, only some boron peaks are observed up to 1912 K. Some peaks of boron are different from one cycle to another: this can be attributed to the recrystallisation of boron under high pressure and temperature conditions Parakhonskiy et al. (2011).
However, in the last cycle, as temperature is increased to 2430 K, most of the boron has reacted and the formation of boron carbide is observed.
After the last cycle of temperature increase, the system is quenched and EDXRD is performed again to observe whether boron carbide remains in the system. As the final EDXRD pattern in figure 6 shows, the boron carbide peaks have remained unchanged after quenching.
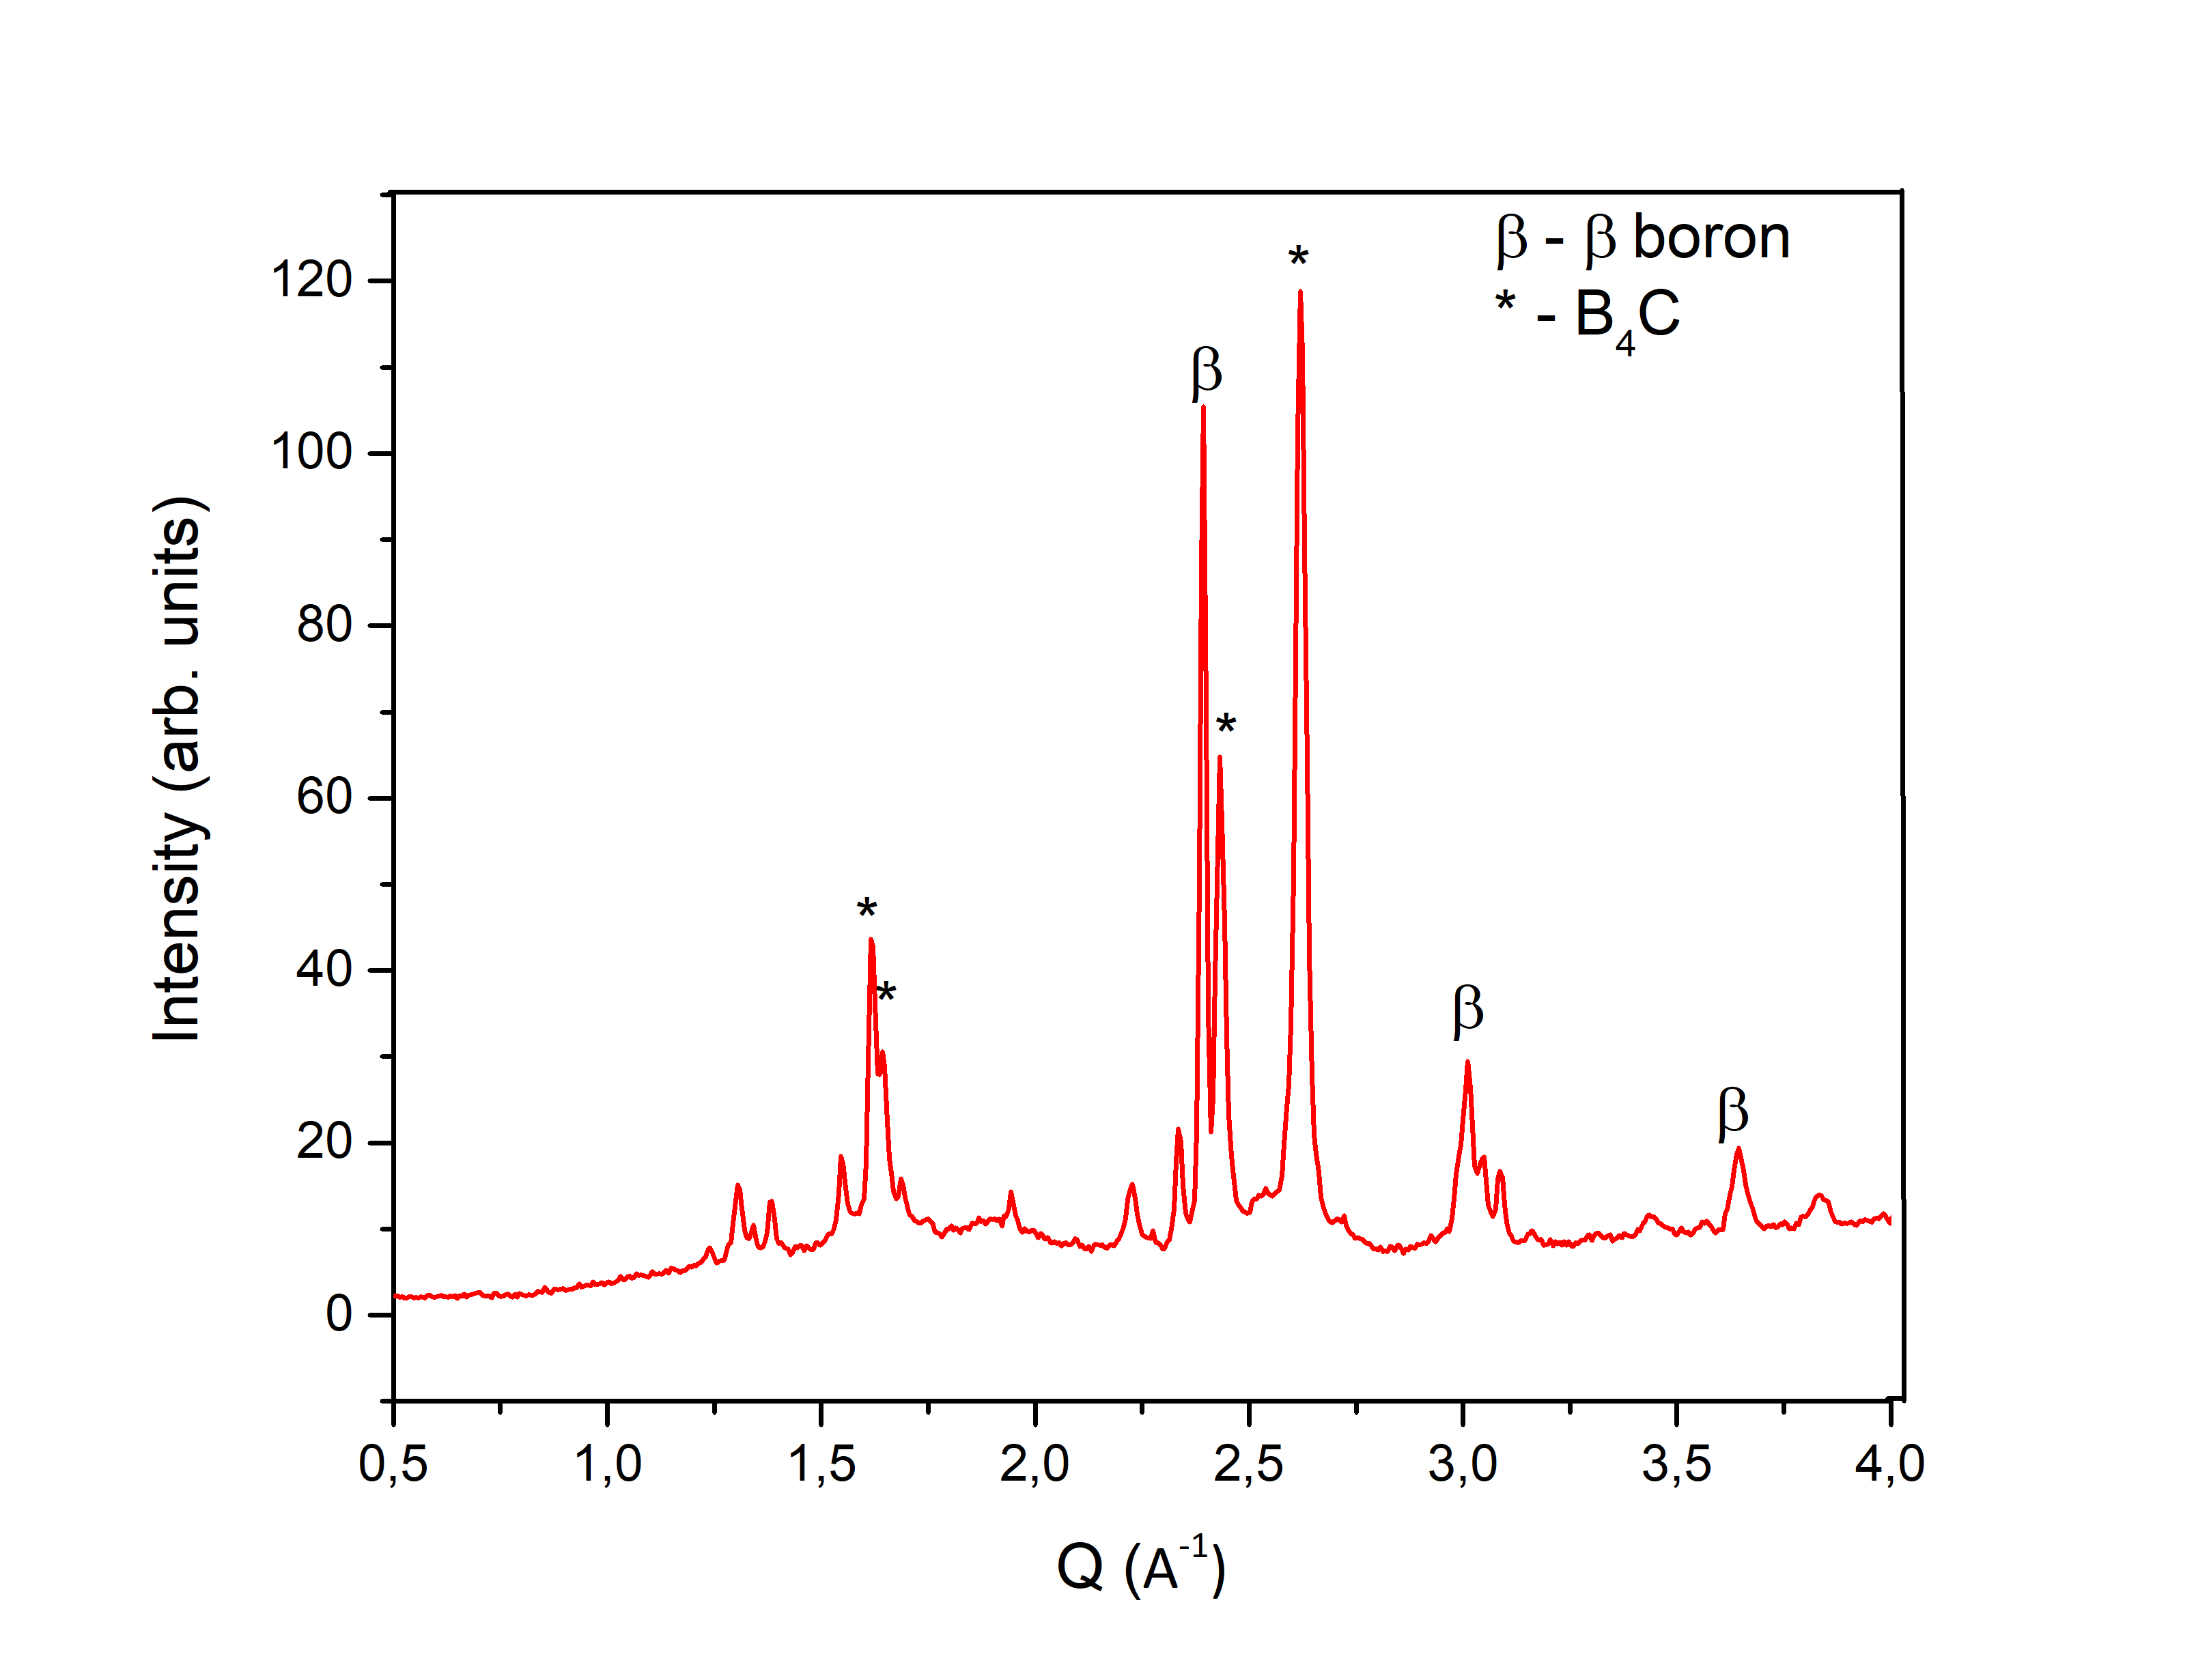
After this, the sample was decompressed and another XRD pattern was taken using the CAESAR system. The CAESAR pattern is shown in figure 7: it is confirmed that boron carbide has remained in the sample after the process.
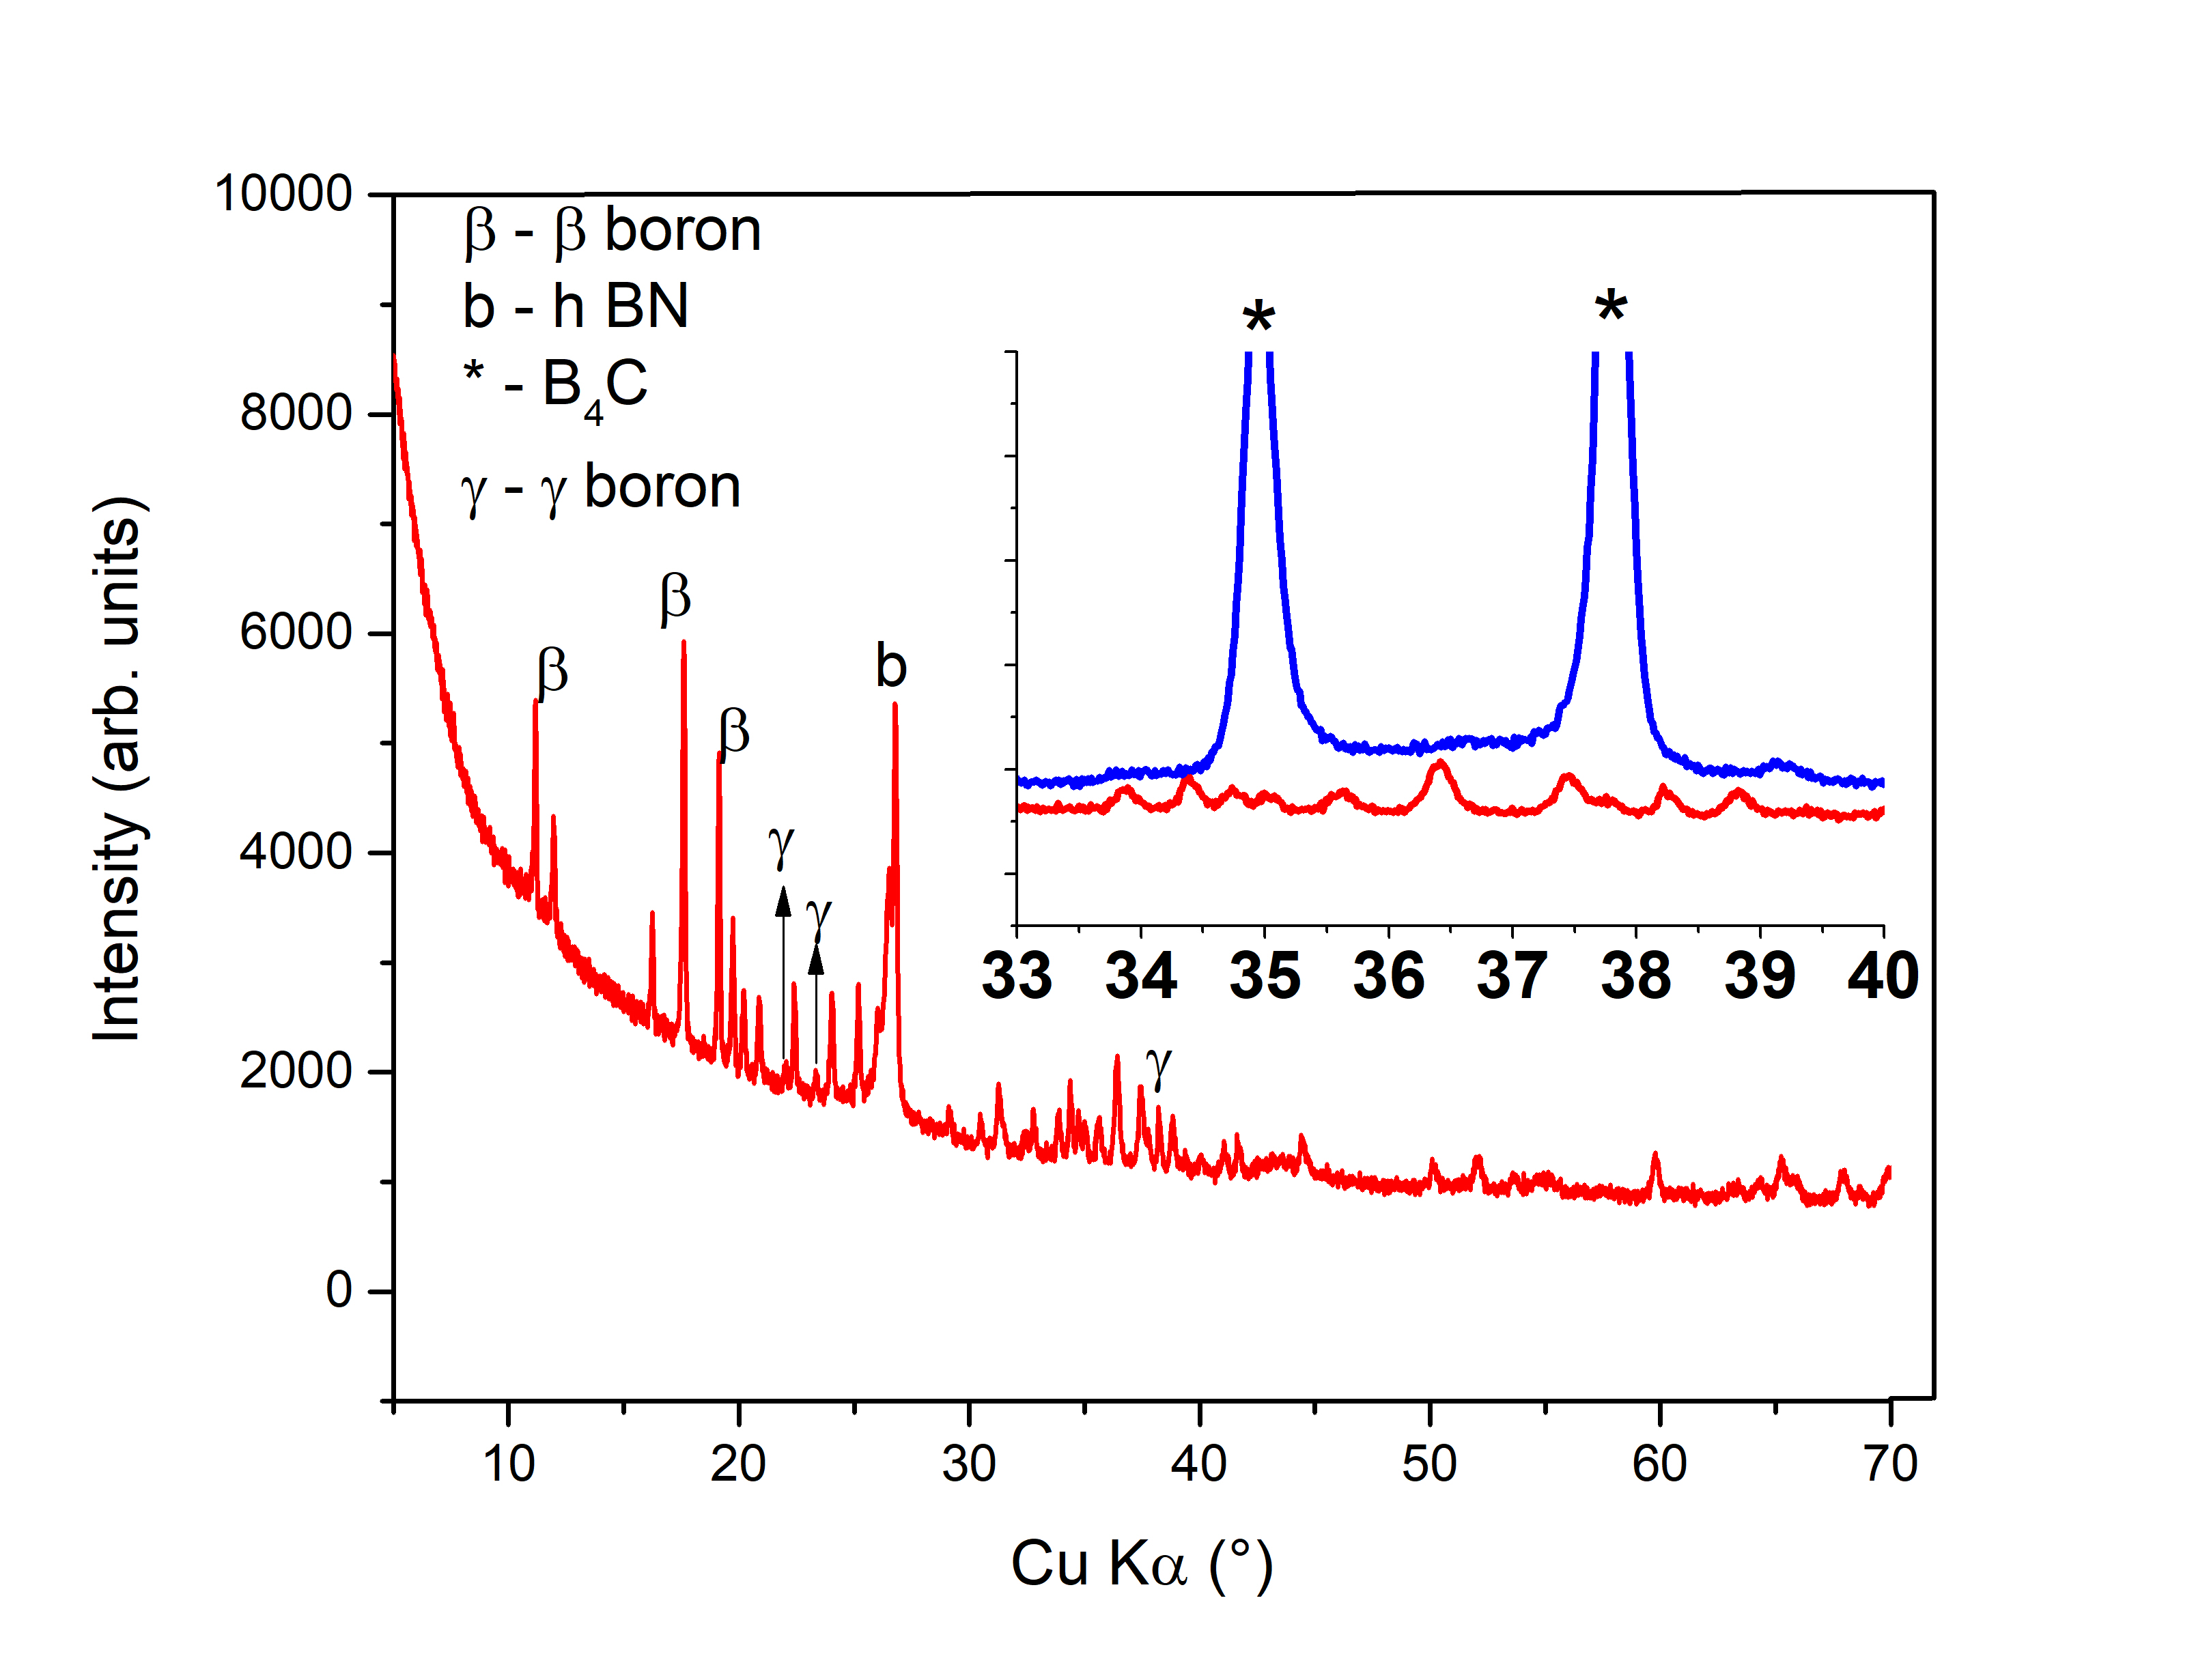
In order to verify whether the temperature cycling had any effect on the formation of boron carbide, a second experiment was performed. In this ex situ experiment, the temperature was raised to 2473 K slowly without any cycling. The XRD performed on the recovered sample after the experiment is shown in figure 8: no boron carbide peaks have been observed in the sample. In order to establish this observation, the XRD diffractogram has been compared to that of boron carbide formed at 2473 K under 2 GPa in the inset of figure 8. The 2 angle domain between 33° - 40° (in inset of figure 8) shows the most prominent peaks of boron carbide (012) and (104) under Cu K radiation. As is evident from the comparison, the sample quenched after a HPHT treatment at 13 GPa and 2473 K does not contain any boron carbide. Some trace amounts of orthorhombic boron Oganov et al. (2009) was found in the sample, but no boron was formed, contrary to the case at 5 GPa. At 13 GPa, after heating to 2473 K, the quenched sample is overwhelmingly composed of rhombohedral boron.
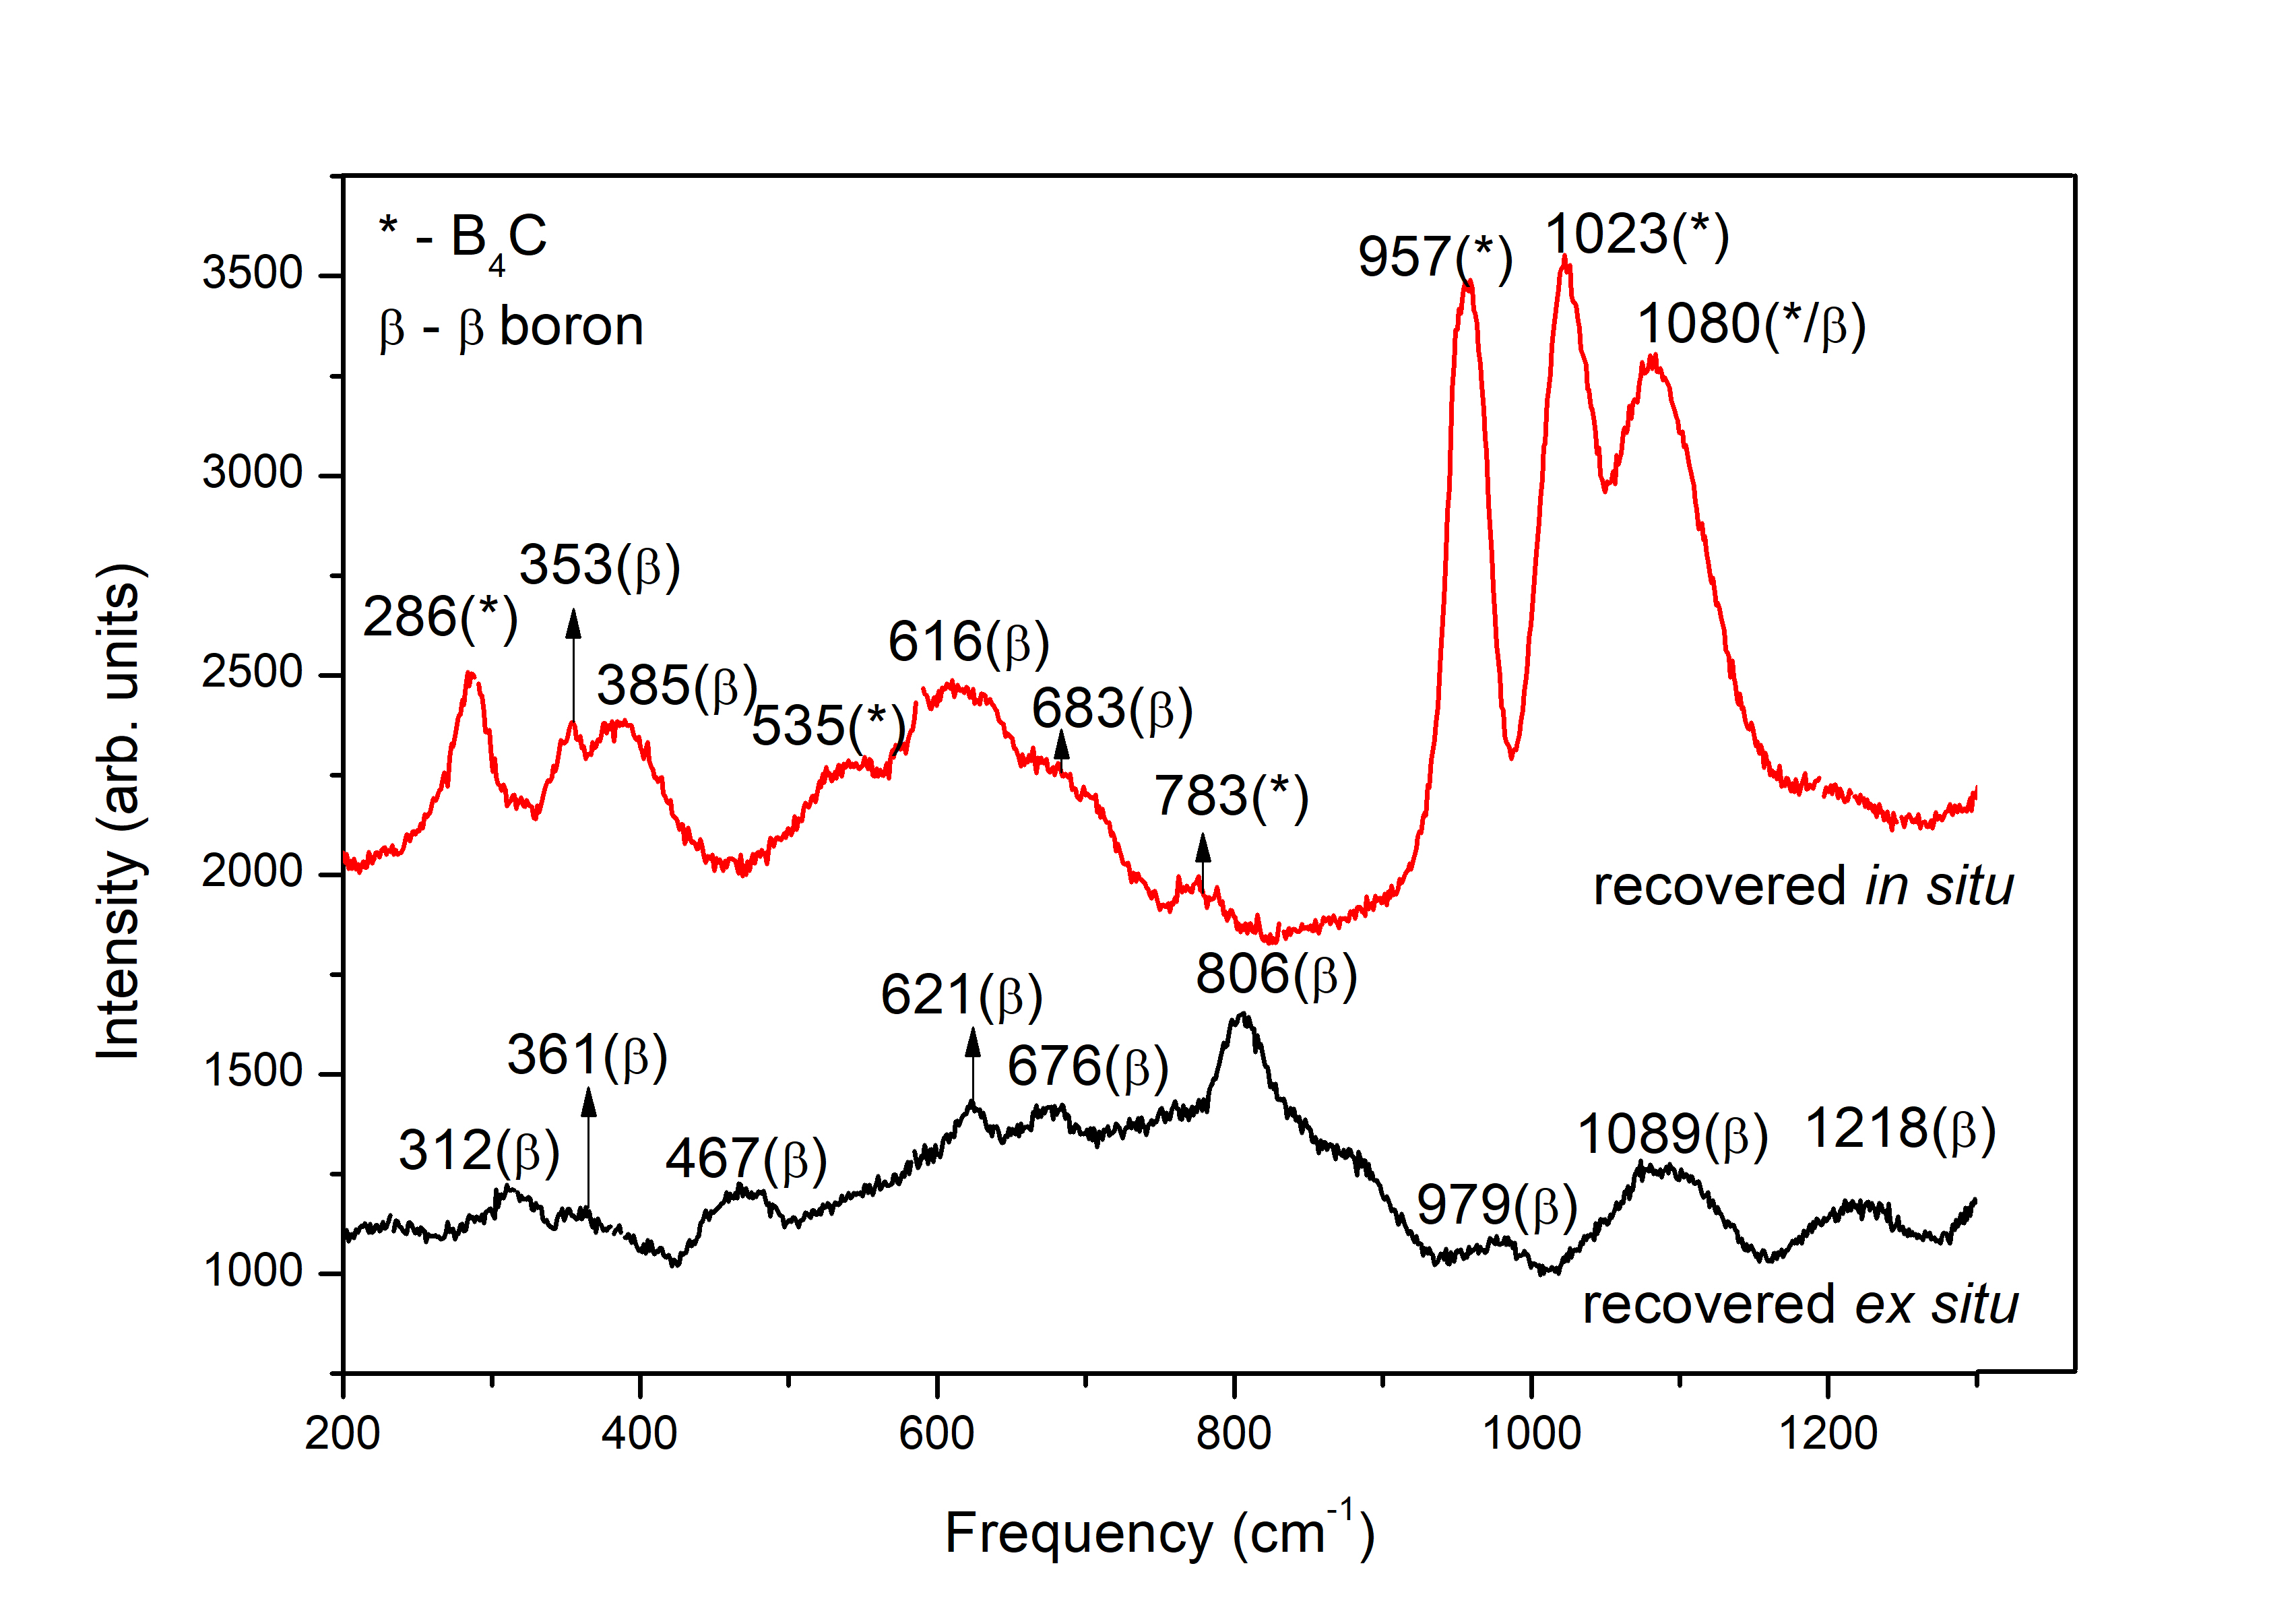
III.3 Raman spectroscopy at 13 GPa
Figure 9 shows the results of the Raman spectroscopy done on the recovered samples from the in situ and ex situ synthesis. Crystalline boron peaks were found in both samples, while the in situ synthesis had additional boron carbide peaks. No peaks corresponding to boron or boron were found in either of the samples.
IV Discussions
IV.1 Search for the optimal synthesis parameters
The synthesis at 2 GPa follows a well-understood and direct path, similar to what has been reported in the literature Wang et al. (2009); Roszeitis et al. (2014) for the low pressure syntheses. However, the synthesis temperature rises considerably. A temperature increase by more than 250 K with respect to that of ambient pressure is required to form boron carbide at 2 GPa. Only by 1873 K (in the case of amorphous boron and amorphous carbon), 2073 K (in the case of boron and amorphous carbon) and 2273 K (in the case of boron and graphite) do we find that boron carbide has formed.
Regarding the optimisation of the synthesis conditions, amorphous carbon turns out to be a better reactant than graphite for synthesising boron carbide at elevated pressures, since the use of graphite requires a further increase of the synthesis temperature. This is attributed to the higher reactivity of amorphous carbon because of its high concentration of dangling bonds Kouchi (2011); Caro et al. (2018); Robertson (1986). Also, carbon atoms have higher mobility in amorphous carbon than in graphite Limandri et al. (2019). The higher mobility of the carbon atoms increases the diffusion of carbon throughout the reacting mixture - this allows the reactants to come in contact with each other thus leading to synthesis of boron carbide at lower temperatures.
Amorphous boron is also found to be a better reactant than boron - this can also be attributed to the better reactivity of amorphous boron compared to crystalline boron due to the absence of an ordered crystalline structure Portehault et al. (2016), Yang et al. (2013).
Moreover, the higher reactivity of amorphous boron and carbon can also be attributed to the higher surface area available in amorphous substances leads to greater contact area for reactions to take place, compared to their crystalline counterparts.
At 5 GPa, the reaction with both amorphous boron and boron produce boron as the prominent product up to 2073 K. This indicates that boron is an intermediate step towards the formation of boron carbide from amorphous or boron and amorphous carbon under a pressure of 5 GPa.
The synthesis temperature also increases with the increase of pressure in all of the cases except for that of amorphous boron as reactant. Yang et al. Yang et al. (2013) have suggested that high pressure can decrease the reaction efficiency of boron greatly. In their experiments, the evaporation rate of the surface boron oxide would decrease as the pressure increased. However this does not explain the reason behind the increase of synthesis temperature when amorphous carbon is replaced by graphite, as the same crystalline boron was used in both cases. Another possible explanation is that high pressure may inhibit the diffusion of carbon atoms through the interstitial spaces in crystalline boron and thus, it would slow down the reaction. The application of higher temperature values would then favour the diffusion process that leads to the formation of boron carbide. In another study, it has also been noted that an inverse relationship between pressure and the reaction constant exists at the high pressure limit for chemically activated reactions Carstensen et al. (2007). Therefore, as the pressure applied during the synthesis increases, the reaction rate falls. This effect can be compensated by an increase in temperature, which results in the increased synthesis temperature of boron carbide. Thus, temperature can be said to act as negative pressure Jay et al. (2019), and so higher temperature at higher pressure may be the signature that the change in diffusion due to pressure is compensated by the change in diffusion due to temperature. This relationship between the rate of change of the diffusion constant with temperature and pressure in the case of formation of boron carbide from its elements under pressure has been expressed in equation 1.
| (1) |
where D is the diffusion constant of carbon or boron atoms, T is the temperature, P is the pressure and k is the constant of proportionality.
IV.2 Crystallite size and particle size
The average crystallite size of the boron carbide as synthesised at 2 and 5 GPa has been determined using the Scherrer formula Patterson (1939). The average crystallite size (about 25 nm) was found to decrease with pressure, and to increase with the synthesis temperature. The size was also found to slightly decrease when graphite is used as a reactant instead of amorphous carbon. Concerning the granulometry of the powder, scanning electron microscopy showed a particle size of 3 - 6 microns irrespective of reactant mixture or synthesis temperature.
IV.3 Carbon content of the synthesised boron carbide
It is also worthwhile to try to find out the carbon concentration of the boron carbide synthesised using different reactants and different pressures. It is difficult to do so using XRD analysis techniques, because of the close atomic numbers of boron and carbon Gosset and Colin (1991). Chemical analysis has been used extensively in literature to find out the carbon concentration in boron carbides Schwetz and Karduck (1991); Aselage and Tissot (1992). However, chemical analysis can overestimate the carbon present in the samples due to the presence of free carbon in boron carbides. In the present work, we have deduced the approximate carbon content of the boron carbides synthesized through their lattice parameters Gosset (2020); Aselage and Tissot (1992). In the literature, the carbon concentration was deduced as a function of three parameters - the hexagonal cell parameters and and the rhombohedral cell volume . The lattice parameters for the syntheses were determined by the Le Bail refinement using the software Powdercell Kraus and Nolze (1996). The unit cell volume values were then compared with the reference values in the literature Gosset (2020); Aselage and Tissot (1992) and an estimate of the carbon content was deduced (table 3). These analyses were done for the boron carbides synthesised from amorphous carbon at the temperatures where boron carbide first appears.
Results show that the carbon content in boron carbides decreases with increase of the pressure of synthesis. This can be attributed to the lower diffusion of carbon in boron as the pressure increases, leading to the incorporation of a smaller amount of carbon in the unit cells: this argument also holds true for the rise of synthesis temperature with increase in pressure, for the same reasons as given above i.e temperature acts as negative pressure.
Thus, we propose pressure as a way to modify the carbon concentration of boron carbides.
| P (GPa) | T (K) | Reactants | (Å) | (Å) | (Å3) | at. % C |
|---|---|---|---|---|---|---|
| 5 | 2473 | B + graphite | 5.617 | 12.160 | 332.251 | 12.8 - 16 |
| 5 | 2273 | B + amorph. C | 5.634 | 12.125 | 333.41 | 12.8 - 16 |
| 5 | 1873 | amorph. B + amorph. C | 5.628 | 12.091 | 331.69 | 12.8 - 16 |
| 2 | 2273 | B + graphite | 5.613 | 12.091 | 329.941 | 16 - 17.4 |
| 2 | 2073 | B + amorph. C | 5.600 | 12.114 | 329.095 | 17.4 - 18.7 |
| 2 | 1873 | amorph. B + amorph. C | 5.596 | 12.079 | 327.628 | >18.7 |
IV.4 Effect of thermal cycling versus constant temperature increase
During the in situ experiment at 13 GPa, it was found that boron carbide formed in the last cycle when the temperature was raised to 2433 K when temperature was increased through thermal cycling. When the same experiment was repeated without the thermal cycling in ex situ conditions at 2473 K, no boron carbide was formed. In both cases, the measured pressure was identical (within 0.5 GPa). This established that the synthesis temperature of boron carbide from elements at 13 GPa is above 2473 K, when steady heating is used. Hence, it is evident that the thermal cycling had played a role in the synthesis of boron carbide from its elements at a lower temperature.
Some work has been done in the literature on the effects of thermal cycling in chemical reactions. Barratt et al. Barratt et al. (2010) have shown through computational models that some hypothetical processes generate higher yields under forced thermal cycling than under single, fixed temperature conditions. Thermal cycling can also hasten phase transitions in some cases, as shown by Lee et al. Lee and Choi (2000). They have shown the kinetic transition of Fe-17 wt % Mn alloy into phase due to thermal cycling: this can be attributed to the increase in transformation kinetics at the numerous nucleation sites introduced through thermal cycling.
Luk’yanenko et al. Luk’yanenko et al. (1997) have performed both theoretical and experimental investigations into the effect of thermal cycling on the high temperature interaction of titanium with gases like oxygen and nitrogen. They report that thermal cycling had intensified the diffusion displacements of impurity atoms. The diffusion coefficients of these oxygen and nitrogen impurity atoms increase both in the matrix and in the newly-formed phase. This had strongly affected the conditions of formation and growth of the new phase because the number of possible nucleation centers on the phase boundary had permanently increased with time and the energy barrier of the phase transformation has decreased as well.
Thus, we find that the dilation/densification cycles applied to boron structure favours the diffusion of carbon atoms, leading to nucleation sites of boron carbide. This has resulted in the formation of boron carbide at a lower temperature than that would be needed by a steady fixed temperature condition.
V Conclusions
In the present work, we have synthesised boron carbide at 2 GPa, 5 GPa and 13 GPa. The optimum synthesis parameters of boron carbide at pressures up to 5 GPa from elemental boron and carbon have been studied for the first time, using the large volume Paris-Edinburgh press. It is seen that the mechanism of elemental formation of boron carbide is heavily dependent on pressure, which affects the temperature of formation of boron carbide. Amorphous carbon has proven to be a better reactant than graphite for the synthesis of boron carbide, since it lowers the temperature of formation, both at 2 GPa and at 5 GPa. Amorphous boron has also followed this trend, since it results in lower temperature of formation of boron carbide both at 2 GPa and 5 GPa, when compared with boron.
We have found that the carbon concentration of boron carbide depends on the pressure value, and propose pressure as a means to control carbon concentration in boron carbides.
The synthesis experiments at the higher pressure value of 13 GPa have been performed for the first time. We have shown that the synthesis temperature of boron carbide from boron and amorphous carbon is at least above 2473 K, with steady heating. The temperature of synthesis of boron carbide has been shown to decrease with thermal cycling that allows easier diffusion of carbon into the boron structure. Thus, thermal cycling can be investigated as a tool in bringing down the synthesis temperature in other chemical reactions as well.
Acknowledgements.
Supports from the DGA (France) and from the program NEEDS-Matériaux (France) are gratefully acknowledged. The authors thank Benoit Baptiste, Keevin Béneut, Ludovic Delbes, Antoine Jay, Hicham Moutaabbid, and Silvia Pandolfi for useful discussions. The X-ray diffraction platform in IMPMC is also acknowledged. The PhD fellowship for A. Chakraborti has been provided by the Ecole Doctorale of Institut Polytechnique de Paris. We acknowledge SOLEIL for the provision of synchrotron radiation facilities.References
- Caretti et al. (2008) I. Caretti, R. Gago, J. M. Albella, and I. Jimenez, Physical Review B 77, 174109 (2008).
- Herrmann et al. (2013) M. Herrmann, I. Sigalas, M. Thiele, M. Müller, H.-J. Kleebe, and A. Michaelis, International Journal of Refractory Metals and Hard Materials 39, 53 (2013).
- Roy et al. (2006) T. Roy, C. Subramanian, and A. Suri, Ceramics International 32, 227 (2006).
- Kakiage et al. (2012) M. Kakiage, Y. Tominaga, I. Yanase, and H. Kobayashi, Powder Technology 221, 257 (2012).
- Thévenot (1990) F. Thévenot, Journal of the European Ceramic Society 6, 205 (1990).
- Suri et al. (2010) A. K. Suri, C. Subramanian, J. K. Sonber, and T. S. R. C. Murthy, International Materials Reviews 55, 4 (2010).
- Alizadeh et al. (2006) A. Alizadeh, E. Taheri-Nassaj, N. Ehsani, and H. R. Baharvandi, Advances in Applied Ceramics 105, 291 (2006).
- Gosset (2020) D. Gosset, Properties of B4C, 2nd ed., edited by R. Konings and R. Stolle (Elseiver, 2020).
- Yan et al. (2009) X. Q. Yan, Z. Tang, L. Zhang, J. J. Guo, C. Q. Jin, Y. Zhang, T. Goto, J. W. McCauley, and M. W. Chen, Physical Review Letters 102, 075505 (2009).
- Fujii et al. (2010) T. Fujii, Y. Mori, H. Hyodo, and K. Kimura, Journal of Physics: Conference Series 215 (2010).
- Mukhanov et al. (2012) V. A. Mukhanov, P. S. Sokolov, and V. L. Solozhenko, Journal of Superhard Materials 34, 211 (2012).
- Dera et al. (2014) P. Dera, M. H. Manghnani, A. Hushur, Y. Hu, and S. Tkachev, Journal of Solid State Chemistry 215, 85 (2014).
- Hushur et al. (2016) A. Hushur, M. H. Manghnani, H. Werheit, P. Dera, and Q. Williams, Journal of Physics: Condensed Matter, Journal of Physics: Condensed Matter 28, 045403 (2016).
- Mondal et al. (2016) S. Mondal, E. Bykova, S. Dey, S. I. Ali, N. Dubrovinskaia, L. Dubrovinsky, G. Parakhonskiy, and S. van Smaalen, Scientific Reports 6, 19330 (2016).
- Chen et al. (2004) S. Chen, D. Z. Wang, J. Y. Huang, and Z. F. Ren, Applied Physics A 79, 1757 (2004).
- Li-Hong et al. (2008) B. Li-Hong, L. Chen, T. Yuan, T. Ji-Fa, H. Chao, W. Xing-Jun, S. Cheng-Min, and G. Hong-Jun, Chinese Physics B 17, 4247 (2008).
- Chakraborti et al. (2020) A. Chakraborti, N. Vast, and Y. Le Godec, Solid State Sciences 104, 106265 (2020).
- Anselmi-Tamburini et al. (2005) U. Anselmi-Tamburini, Z. A. Munir, Y. Kodera, T. Imai, and M. Ohyanagi, Journal of the American Ceramic Society 88, 1382 (2005).
- Wang et al. (2004) Y. Wang, T. Uchida, R. Von Dreele, M. L. Rivers, N. Nishiyama, K.-i. Funakoshi, A. Nozawa, and H. Kaneko, Journal of Applied Crystallography 37, 947 (2004).
- Liebermann (2011) R. C. Liebermann, High Pressure Research 31, 493 (2011).
- Dewaele et al. (2000) A. Dewaele, G. Fiquet, D. Andrault, and D. Hausermann, Journal of Geophysical Research: Solid Earth 105, 2869 (2000).
- Tange et al. (2009) Y. Tange, Y. Nishihara, and T. Tsuchiya, Journal of Geophysical Research: Solid Earth 114 (2009).
- Clark and Hoard (1943) H. Clark and J. Hoard, Journal of the American Chemical Society 65, 2115 (1943).
- Wang et al. (2009) C. B. Wang, S. Zhang, Q. Shen, and L. M. Zhang, Materials Science and Technology 25, 809 (2009).
- Roszeitis et al. (2014) S. Roszeitis, B. Feng, H.-P. Martin, and A. Michaelis, Journal of the European Ceramic Society 34, 327 (2014).
- Parakhonskiy et al. (2011) G. Parakhonskiy, N. Dubrovinskaia, E. Bykova, R. Wirth, and L. Dubrovinsky, Scientific reports 1, 96 (2011).
- Yang et al. (2008) W. Yang, G. Shen, Y. Wang, and H.-k. Mao, High Pressure Research 28, 193 (2008).
- Oganov et al. (2009) A. R. Oganov, J. Chen, C. Gatti, Y. Ma, Y. Ma, C. W. Glass, Z. Liu, T. Yu, O. O. Kurakevych, and V. L. Solozhenko, Nature 457, 863 (2009).
- Callmer (1977) B. Callmer, Acta Crystallographica Section B, 33, 1951 (1977).
- Kouchi (2011) A. Kouchi, Amorphous carbon, in Encyclopedia of Astrobiology, edited by M. Gargaud, R. Amils, J. C. Quintanilla, H. J. J. Cleaves, W. M. Irvine, D. L. Pinti, and M. Viso (Springer Berlin Heidelberg, 2011) pp. 41–42.
- Caro et al. (2018) M. A. Caro, A. Aarva, V. L. Deringer, G. Csányi, and T. Laurila, Chemistry of Materials 30, 7446 (2018).
- Robertson (1986) J. Robertson, Advances in Physics 35, 317 (1986).
- Limandri et al. (2019) S. Limandri, G. Garbarino, D. Sifre, M. Mezouar, and V. Galván Josa, Journal of Applied Physics 125, 165902 (2019).
- Portehault et al. (2016) D. Portehault, G. Gouget, C. G. Stary, and C. Sanchez, Nanostructured amorphous boron material, Patent WO2016207558A1 (2016).
- Yang et al. (2013) W. Yang, W. Ao, J. Zhou, J. Liu, K. Cen, and Y. Wang, Journal of Propulsion and Power 29, 1207 (2013).
- Carstensen et al. (2007) H.-H. Carstensen, A. M. Dean, and R. W. Carr, Chapter 4 the kinetics of pressure-dependent reactions, in Comprehensive Chemical Kinetics, Vol. 42 (Elsevier, 2007) pp. 101–184.
- Jay et al. (2019) A. Jay, O. Hardouin Duparc, J. Sjakste, and N. Vast, Journal of Applied Physics 125, 185902 (2019).
- Patterson (1939) A. L. Patterson, Physical Review 56, 978 (1939).
- Gosset and Colin (1991) D. Gosset and M. Colin, Journal of Nuclear Materials 183 (1991).
- Schwetz and Karduck (1991) K. A. Schwetz and P. Karduck, Journal of the Less Common Metals 175, 1 (1991).
- Aselage and Tissot (1992) T. L. Aselage and R. G. Tissot, Journal of the American Ceramic Society 75, 2207 (1992).
- Kraus and Nolze (1996) W. Kraus and G. Nolze, Journal of Applied Crystallography 29, 301 (1996).
- Barratt et al. (2010) C. Barratt, D. Lepore, M. Cherubini, and P. Schwartz, International Journal of Chemistry 2, 19 (2010).
- Lee and Choi (2000) Y.-K. Lee and C.-S. Choi, Metallurgical and Materials Transactions A 31, 2735 (2000).
- Luk’yanenko et al. (1997) O. H. Luk’yanenko, V. S. Pavlyna, A. T. Pichugin, and V. M. Fedirko, Materials Science 33, 739 (1997).