Discovery of a 310-day Period from the Enshrouded Massive System NaSt1 (WR 122)
Abstract
We present optical and infrared (IR) light curves of NaSt1, also known as Wolf-Rayet (WR) 122, with observations from Palomar Gattini-IR (PGIR), the Zwicky Transient Facility (ZTF), the Katzman Automatic Imaging Telescope (KAIT), the Asteroid Terrestrial-impact Last Alert System (ATLAS), and the All-Sky Automated Survey for Supernovae (ASAS-SN). We identify a d photometric period from the optical and IR light curves that reveal periodic, sinusoidal variability between 2014 July and 2021 July. We also present historical IR light curves taken between 1983 July and 1989 May, which show variability consistent with the period of the present-day light curves. In the past, NaSt1 was brighter in the band with larger variability amplitudes than the present-day PGIR values, suggesting that NaSt1 exhibits variability on longer ( decade) timescales. Sinusoidal fits to the recent optical and IR light curves show that the amplitude of NaSt1’s variability differs at various wavelengths and also reveal significant phase offsets of d between the ZTF and PGIR light curves. We interpret the d photometric period from NaSt1 as the orbital period of an enshrouded massive binary. We suggest that the photometric variability of NaSt1 may arise from variations in the line-of-sight optical depth toward circumstellar optical/IR emitting regions throughout its orbit due to colliding-wind dust formation. We speculate that past mass transfer in NaSt1 may have been triggered by Roche-lobe overflow (RLOF) during an eruptive phase of an Ofpe/WN9 star. Lastly, we argue that NaSt1 is no longer undergoing RLOF mass transfer.
1 Introduction
Almost all massive stars have a close binary companion ( d), implying that binary interaction is common in massive stars (Sana et al., 2012; Moe & Di Stefano, 2017). The ubiquity of binary interactions such as mass transfer has challenged our understanding of massive-star evolution and notably diverges from the theoretical framework of single-star evolution (e.g., Heger et al. 2003; Groh et al. 2013). Binary interaction can influence mass loss and enable additional massive-star evolutionary pathways beyond the single-star evolution framework (Smith, 2014). In particular, Roche-lobe overflow (RLOF) is a critical binary mass-transfer processes that can strip the hydrogen envelope of a massive star and lead to the emergence of a helium-rich Wolf-Rayet (WR) star (Paczyński, 1967; Podsiadlowski et al., 1992; De Marco & Izzard, 2017; Götberg et al., 2018). Agreement between the observed statistical properties of massive stars and predictions from recent binary stellar population synthesis models indeed indicate that binary interactions are important in the formation of WR stars (Vanbeveren et al., 1998; Meynet & Maeder, 2005; Rosslowe & Crowther, 2015; Eldridge et al., 2017).
The WR phase is an important evolved stage of a massive star that precedes its end-of-life explosion as a Type Ib/c supernova (SN) or direct collapse to a black hole (Heger et al., 2003; Smith et al., 2011a; Sukhbold et al., 2016). WR binaries may therefore precede the formation of binary black holes and are potential progenitors of black hole mergers (e.g., Belczynski et al. 2016). Populations of WR stars formed via binary interaction can also have a profound impact on the ionization of the interstellar medium (ISM) of their host galaxies as well as the intergalactic medium (IGM) beyond (Sander & Vink, 2020; Götberg et al., 2020). WR star dust formation, which has been observed in colliding-winds from carbon-rich WR (WC) stars with OB-star binary companions (e.g., Williams et al. 1987; Tuthill et al. 1999), may also significantly contribute to dust abundances in the ISM of their host galaxies (Lau et al., 2020).
Understanding the underlying physics of binary interactions that lead to the formation of a WR star is therefore of great importance. However, there is a dearth of known interacting massive binaries owing to the relatively short timescales associated with the RLOF mass-transfer process in post-main-sequence (Case B) mass transfer. One of the most well-known interacting massive binary systems that is currently undergoing RLOF mass transfer is RY Scuti, which is an eclipsing system with an 11 day orbital period surrounded by a toroidal circumstellar nebula of dust and ionized gas (Gehrz et al., 1995; Grundstrom et al., 2007; Smith et al., 1999, 2002, 2011b).
The enigmatic NaSt1 system (also known as LS IV +00 5 and WR 122) was initially classified as a late-type, nitrogen-rich WR (WN10) star by Nassau & Stephenson (1963) and Massey & Conti (1983) but was later proposed to be a B[e], O[e], or Ofpe/WN9 star (van der Hucht et al., 1989, 1997). NaSt1 again had its true nature called into question as a result of high spectral resolution observations by Crowther & Smith (1999), who suggested that NaSt1 may be an early-type WR star enshrouded by an Car-like nebula. It is now thought to host a WR star emerging from a RLOF mass-transfer phase with a binary companion (Mauerhan et al., 2015). NaSt1 is an intriguing system that may present a rare opportunity to investigate this transitional phase, particularly given its relatively nearby distance of kpc (Rate & Crowther, 2020).
The presence of a binary system in NaSt1 was inferred from its surrounding extended () disk-like, nitrogen-rich nebula that is thought to originate from nonconservative mass transfer in the central system (Mauerhan et al., 2015). Mauerhan et al. (2015) also showed that NaSt1 exhibits X-ray emission consistent with colliding-wind WR binaries. An important diagnostic of mass transfer via RLOF are the orbital and stellar properties of the central binary; however, these properties remain largely unknown for NaSt1.
NaSt1 possesses an interesting combination of observational characteristics that are important for understanding the nature of its stellar component(s). Optical and near-infrared (IR) spectroscopy by Crowther & Smith (1999) showed no obvious stellar lines but revealed narrow nebular emission features consistent with fully CNO-processed material that is thought to be ionized by an unseen WR star. The unusual chemical composition of NaSt1’s nebula has notably drawn comparisons to the luminous blue variable (LBV) system Car and its surrounding N-rich nebula (Smith & Morse, 2004). High-excitation emission lines from NaSt1 also indicated that the ionizing source of its nebula must possess an effective temperature K, which is consistent with the presence of a WR star. Classical WR stars, however, are characterised by broad, full width at half-maximum intensity (FWHM) km s-1 emission features. These broad features are notably absent from NaSt1’s spectrum. Interestingly, many of the strong emission lines from NaSt1 exhibit double-peaked profiles separated by tens of km s-1, which may originate from a circumstellar or circumbinary disk that could be obscuring or outshining WR emission features (Mauerhan et al., 2015). Similar multi-peaked narrow emission features dominate the optical spectrum in RY Scuti (Smith et al., 2002). NaSt1’s nebular spectrum is also heavily reddened ( mag; Crowther & Smith 1999) by interstellar and/or circumstellar material. Strong thermal-IR emission from NaSt1 indicates the presence of circumstellar dust that either formed recently or is currently forming (Rajagopal et al., 2007).
In this paper, we present the discovery of periodic photometric variability from NaSt1 with data from optical and near-IR imaging surveys. This work also presents some of the first science results from the recently commissioned near-IR imaging survey Palomar Gattini-IR (PGIR; Moore & Kasliwal, 2019; De et al., 2020a). In Section 2, we describe the new and archival observations of NaSt1 used in our analysis. The results of our optical and IR variability analysis of NaSt1 are presented in Section 3. In Section 4, we discuss the possible origins for the observed photometric variability and speculate on the nature of NaSt1, including whether it is currently undergoing mass transfer. We summarize our results and conclude in Section 5.
| MJD | ||||||||||
|---|---|---|---|---|---|---|---|---|---|---|
| (KAIT) | (ZTF) | (ATLAS) | (KAIT) | (ASAS-SN) | (ZTF) | (KAIT) | (ATLAS) | (KAIT) | (PGIR) | |
| 56818.446 | 16.21 0.04 | – – | – – | 14.38 0.02 | – – | – – | 12.82 0.03 | – – | 12.29 0.03 | – – |
| 56821.406 | 16.23 0.06 | – – | – – | 14.39 0.02 | – – | – – | 12.82 0.03 | – – | 12.29 0.03 | – – |
| 56824.434 | 16.22 0.07 | – – | – – | 14.38 0.02 | – – | – – | 12.81 0.03 | – – | 12.30 0.03 | – – |
| 56826.437 | 16.18 0.04 | – – | – – | 14.38 0.02 | – – | – – | 12.80 0.03 | – – | 12.27 0.03 | – – |
| … | … | … | … | … | … | … | … | … | … | … |
| … | … | … | … | … | … | … | … | … | … | … |
Note. — Optical/IR photometry from KAIT, ATLAS, ASAS-SN, ZTF, and PGIR. All magnitudes are given in the Vega system, and the errors correspond to the uncertainty in the photometric measurements. A full version of this table (with the KAIT Clear photometry) is available electronically.
2 Observations and Archival Data
2.1 PGIR J-band Photometry
PGIR is a wide-field, time-domain imaging survey located at Palomar Observatory. It utilizes a 30 cm telescope and -band filter similar to the 2MASS filter with an effective wavelength of m and an effective filter bandwidth of m. PGIR achieves a field of view (FoV) with its 2k 2k HAWAII-2RG detector and a scale of pixel-1. The entire sky visible from Palomar is imaged by PGIR every nights down to a 5 detection limit of 14.8 Vega mag111All magnitudes provided in this work are in the Vega magnitude system.. The PGIR image processing and photometric calibration are described by De et al. (2020a). The -band saturation limit of PGIR was initially mag, but has been subsequently improved to mag after implementing a new readout mode described by De et al. (2020b).
NaSt1, which is located at (J2000) and (J2000) (Gaia Collaboration, 2018), was well-covered by PGIR imaging fields. In order to investigate the -band variability of NaSt1, forced aperture photometry was performed at its coordinates using a 3-resampled-pixel radius () aperture in PGIR images taken between 2018 Nov. and 2021 June. Importantly, source confusion is not an issue since NaSt1 is mag brighter in than all objects within of its coordinates (Cutri et al., 2003). Photometry from PGIR and all other platforms included in this work are provided in Table 1.
2.2 KAIT Optical Photometry
Optical photometry of NaSt1 was obtained with the robotic 0.76 m Katzman Automatic Imaging Telescope (KAIT; Filippenko et al. 2001) at Lick Observatory. Additional Clear-band (close to the band; see Li et al. 2003) images were also obtained with KAIT. A series of 66 imaging observations of NaSt1 was performed with KAIT between 2014 July and 2015 Nov. The KAIT observing frequency of NaSt1 ranged from a few days to a few weeks when visible.
All images were reduced using a custom pipeline (Ganeshalingam et al., 2010; Stahl et al., 2019). Point-spread-function (PSF) photometry was then obtained using DAOPHOT (Stetson, 1987) from the IDL Astronomy User’s Library222http://idlastro.gsfc.nasa.gov/. Several nearby stars were chosen from the Pan-STARRS1333http://archive.stsci.edu/panstarrs/search.php catalog for calibration. Their magnitudes were first transformed into Landolt magnitudes (Landolt, 1992) using the empirical prescription presented by Tonry et al. (2012) and then transformed to the KAIT natural system.
Apparent magnitudes were all measured in the KAIT4 natural system. The final results were transformed to the standard system using local calibrators and color terms for KAIT4 as given in Table 4 of Ganeshalingam et al. (2010), except for KAIT Clear-band data, where no reliable color term is measured owing to the broad response function. We therefore present the Clear magnitude relative to the reference stars in Landolt magnitude, which is essentially in the KAIT natural system.
2.3 BASS Mid-IR Spectroscopy
Mid-IR observations of NaSt1 were made using The Broadband Array Spectrograph System (BASS) sensor (Hackwell et al., 1990) at the 3.6 m Advanced Electro-Optical System (AEOS) telescope on Haleakela, HI, on 2017 Oct. 23, 2018 May 13, 2019 Apr. 6, and 2019 Aug 24 (UT dates are used throughout this paper). AEOS utilizes a chopping secondary mirror, run at 7 Hz for rapid sampling of the background. While observing, a chop-and-nod strategy was used with a chop throw of and a telescope nod of the same distance between exposures. 30 s integrations were obtained per nod position, and 12–26 samples were obtained for each of the AEOS observations (6–13 min total integration).
An off-axis visible-wavelength CCD was used for guiding to keep the source centered in the instrument aperture during exposures. The resolving power of BASS is 30–125 across a 3–13 m bandpass. Flux calibration was obtained via observations of the standard star Lyr (Vega) at an airmass similar to that of the NaSt1 observations. Flux calibration was performed by dividing the target spectrum by the Vega spectrum and then multiplying the result by a Kurucz model atmosphere of Vega matched to the resolution of the data. This process also removes most of the telluric features. However, residual telluric artifacts remained, particularly in the deep water absorption band over 5–8 m, so those data were removed for clarity. Although the stellar-atmosphere model does not account for dust excess, Vega’s debris excess does not emit significantly shortward of 13 m. For example, at the long-wavelength end of our BASS spectrum, Vega’s 13 m debris disk excess is –3% of the photosphere (Su et al., 2013).
Wavelength calibration of each BASS channel was performed in the lab using a monochrometer, and either checked on-sky with observations of a strong mid-IR emission-line source (planetary nebula NGC 7027) or in the dome using a blackbody source (hot plate) measured at two temperatures ( C and C) and attenuated by films of polystyrene and polysulfone to superimpose absorption features for reference.
| MJD | Source | |||||
|---|---|---|---|---|---|---|
| 45528 | 9.54 | 8.51 | 6.50 | 4.12 | UKIRT* | |
| 45838 | 9.52 | 8.46 | 6.39 | 3.99 | 3.30 | ESO* |
| 46237 | 9.19 | 8.27 | 6.25 | 3.90 | 3.46 | UKIRT |
| 46302 | 9.05 | 7.95 | 5.94 | 3.78 | 3.16 | UKIRT |
| 46715 | 9.49 | 8.18 | 6.19 | 3.91 | 3.18 | UKIRT |
| 46960 | 9.10 | 7.82 | 5.88 | 3.71 | 3.04 | ESO |
| 47258 | 8.99 | 7.85 | 5.87 | 3.66 | 2.98 | ESO |
| 47259 | 8.99 | 7.82 | 5.87 | 3.66 | 3.02 | ESO |
| 47261 | 9.04 | 7.89 | 5.87 | 3.68 | 2.96 | ESO |
| 47304 | 9.18 | 7.97 | 6.02 | 3.76 | 3.12 | ESO |
| 47670 | 9.40 | 8.25 | 6.25 | 3.89 | 3.19 | ESO |
| 47671 | 9.39 | 8.25 | 6.25 | 3.90 | 3.23 | ESO |
Note. — IR photometry of NaSt1 from UKIRT and the ESO 1 m photometric telescope. Uncertainties are assumed to be 0.1 mag for -band photometry and 0.15 mag for -band photometry.
*Previously published by (Williams et al., 1987).
2.4 Historical UKIRT and ESO IR Photometry
We present historical IR photometry of NaSt1 (Tab. 2) taken from the 3.8 m United Kingdom Infrared Telescope (UKIRT) and the European Southern Observatory (ESO) 1 m photometric telescope between 1983 July and 1989 May (MJD 45528–47671). The UKIRT and ESO photometry taken on 1983 July 13 (MJD 45838) and 1983 May 18 (MJD 45528), respectively, were previously published by Williams et al. (1987). Subsequent photometry is presented in this work for the first time. Since these observations were taken as a continuation of the photometry published by Williams et al. (1987), the observations follow the same procedures described in their paper. ESO filter properties are described by van der Bliek et al. (1996). The UKIRT and filter properties are provided by Hawarden et al. (2001) and Leggett et al. (2003), respectively.
UKIRT photometry was obtained using a 12.4″-diameter aperture, and photometry was obtained with a 5″-diameter aperture. ESO photometry was measured through a 15″-diameter aperture except for the observation taken on 1987 June 14 (MJD 46960), where a 22″-diameter aperture was used. The photometry is shown in Table 2 and provided in Vega magnitudes.
2.5 Archival Optical Photometry: ZTF, ASAS-SN, and ATLAS
We utilize the -band and -band PSF-fit photometry of NaSt1 from the Zwicky Transient Facility (ZTF; Bellm et al. 2019; Masci et al. 2019) Public Data Release 6444https://www.ztf.caltech.edu/page/dr6. ZTF observations of NaSt1 were taken between 2018 Apr. and 2021 Apr. with a d cadence when visible. Only the photometry with clean extractions (i.e., “catflags = 0”) from ZTF DR6 were used for the analysis. Several nights included multiple observations of the field containing NaSt1. For example, high-cadence -band observations were taken on MJD 58347 and MJD 58348, where each night consisted of images. Multiple ZTF - and -band observations taken over a night were therefore averaged in single-night bins. Since ZTF photometry from the DR6 catalog was provided in units of AB magnitude, we converted the photometry to Vega units by applying the conversions and .
We also utilize the -band photometry of NaSt1 from the All-Sky Automated Survey for Supernovae (ASAS-SN; Shappee et al. 2014; Kochanek et al. 2017). Photometry of NaSt1 was obtained from the ASAS-SN Variable Star Database555https://asas-sn.osu.edu/variables (Jayasinghe et al., 2020), where it was identified as a variable with the reference ID ASASSN-V J185217.55+005944.3. ASAS-SN photometry of NaSt1 from the Variable Star Database spans from 2015 Feb. to 2018 Nov. with an observing cadence of week when visible.
Lastly, we use photometric measurements of NaSt1 obtained by the Asteroid Terrestrial-impact Last Alert System (ATLAS) project between between 2015 Oct 23 (MJD 57318) to 2021 Jul 9 (MJD 59404) from the ATLAS forced photometry server666https://fallingstar-data.com/forcedphot/ (Tonry et al., 2018; Heinze et al., 2018; Smith et al., 2020). ATLAS surveys the entire visible sky at declinations north of every two nights with the ATLAS orange (“o-band”; Å) and cyan (“c-band”; Å) filters. ATLAS photometry obtained from the forced-photometry server were filtered by ignoring observations where the NaSt1 was within 100 pixels of the edge of the field of view and where the magnitude error was greater than 0.1 mag. Multiple observations of NaSt1 taken over a night were averaged in single-night bins. PSF photometry of NaSt1 were converted from Jy to Vega magnitudes using zero points of 3585.79 Jy and 2846.76 Jy for the - and -band filters, respectively, which were derived by the Spanish Virtual Observatory (SVO) Filter Profile Service (Rodrigo et al., 2012; Rodrigo & Solano, 2020).
| Telescope (Filter) | Amplitude (mag) | Mag. Offset | MJD | (d) | Brightest Lines | |
|---|---|---|---|---|---|---|
|
PGIR ()
12350 Å (1624 Å) |
He i
He i Pa |
|||||
|
KAIT ()
8061 Å (1471 Å) |
He ii
O i [N i] |
|||||
|
ATLAS ()
6632 Å (2368 Å) |
He i
He i He i |
|||||
|
ZTF ()
6340 Å (1515 Å) |
He i
He i H |
|||||
|
KAIT ()
6273 Å (1202 Å) |
He i
He i H |
|||||
|
ASAS-SN* ()
5466 Å (890 Å) |
He i
[N ii] He ii |
|||||
|
KAIT ()
5389 Å (909 Å) |
[N ii]
He i He ii |
|||||
|
ATLAS ()
5184 Å (2144 Å) |
He i
[N ii] He ii |
|||||
|
ZTF ()
4722 Å (1282 Å) |
He ii
He i H |
|||||
|
KAIT ()
4445 Å (907 Å) |
He ii
H [Fe iii] |
Note. — NaSt1 light curve and adopted-period fit results, which were derived assuming a period matching the ZTF -band value of d (see Fig. 1). The listed properties include the telescope/instrument details (filter effective wavelength and bandwidth), the amplitude of the sinusoidal variability, the magnitude offset at mid-line of the sine function, the MJD where the phase of the sine function , and the phase offset () from the PGIR value. The phase fitting for the ZTF, ATLAS, and PGIR models assumed an initial estimate of MJD 58700, while the KAIT and ASAS-SN models assumed initial estimates of MJD 57100 and MJD 56800, respectively. The relative flux contributions from the cataloged nebular emission lines from NaSt1 (Crowther & Smith, 1999) to the photometric measurements in the different filters wavebands (based on the adopted-period fits) is shown under . The brightest three lines in each filter band is also listed in descending order of line strength.
*ASAS-SN photometry of NaSt1 is likely confused with a nearby () optical point source.
3 Results and Analysis
3.1 Light Curve Periodicity, Variability Amplitude, and Phase Offset
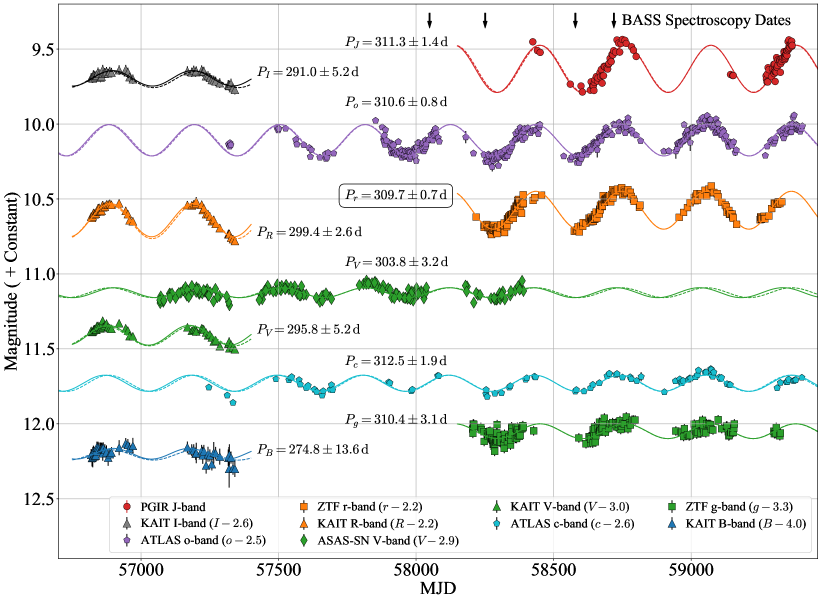
The near-IR and optical light curves of NaSt1 taken between 2014 July and 2021 July are shown in Figure 1 and present clear evidence of smooth variability on a roughly year-long timescale. Since the variations are sufficiently smooth and symmetric about maxima, sinusoidal functions were fit to the PGIR, ZTF, ATLAS, ASAS-SN, and KAIT photometry using a least-squares fitting routine from the SciPy library in Python v.3.8.5. The free parameters were the period, variability amplitude, magnitude offset, and phase. The sinusoidal fits to each light curve reveal variability consistent with a period of d. The best-constrained period was derived from the fit to the ZTF -band light curve of d, which we adopt as NaSt1’s photometric variability period. All other light curves were then refitted with an adopted period of d. The results from the adopted-period sinusoidal fits are shown in Table 3. The following analysis utilizes the results from these adopted-period ( d) sinusoidal fits.
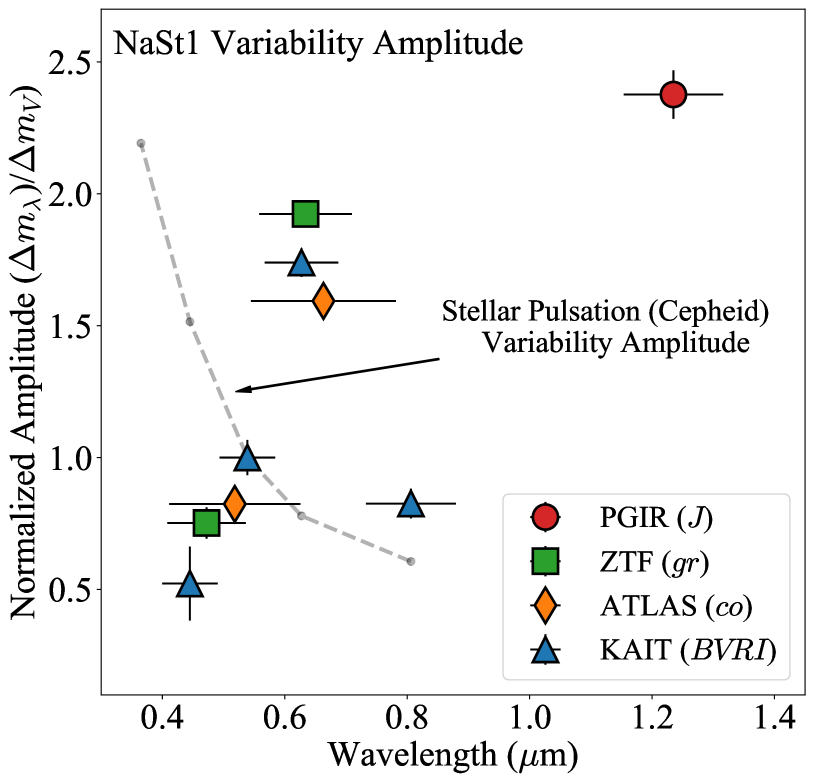
Interestingly, the sinusoidal variability amplitudes differ across the different wavelengths, which is shown in Fig. 2. The ZTF , KAIT , ATLAS , and PGIR bands exhibit higher variability amplitudes relative to the other photometric bands. The KAIT -band amplitude is comparable to the ZTF - and ATLAS c-band amplitudes, which demonstrates that there is no obvious trend in the amplitudes as a function of wavelength. The apparent wavelength dependence of NaSt1’s variability amplitude notably differs from the expected trend for stellar pulsations (e.g., Cepheids), where an increased amplitude is expected toward shorter wavelengths (Klagyivik & Szabados, 2009).
The amplitude fit from the ASAS-SN -band photometry is discrepant with the KAIT -band amplitude despite the similar wavelength coverage of the instrument filters (Tab. 3). Owing to the much larger pixels of ASAS-SN compared to the KAIT pixels and the two-pixel () radius aperture used for ASAS-SN photometry (Kochanek et al., 2017), the lower ASAS-SN amplitude is likely due to confusion with a nearby source of comparable -band brightness as NaSt1. Photometry from the Pan-STARRS Data Release 1 catalog (Chambers et al., 2016) supports this explanation and shows that there is a source located from NaSt1 with a PS1 -band brightness that of NaSt1. Synthetic Johnson -band photometry derived from optical spectroscopy of NaSt1 presented by Crowther & Smith (1999), where mag, also shows closer agreement with the 14.41 mag offset derived from the KAIT -band light-curve fit (Table 3). The mag amplitude derived from the KAIT -band photometry therefore more accurately traces the NaSt1 variability than the lower-amplitude ASAS-SN photometry.
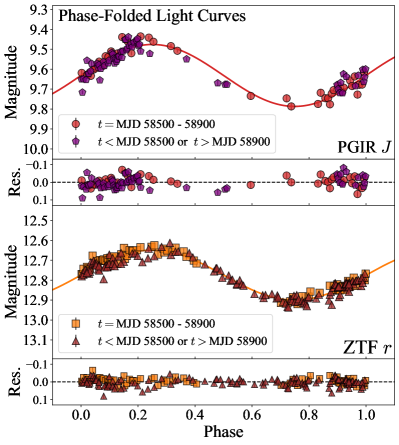
The phase-folded PGIR -band and ZTF -band light curves, which show the highest variability amplitude, are shown in Figure 3 (left). These phase-folded light curves and the fitted-model residuals demonstrate the close agreement to sinusoidal variability. The phase-folded light curves also show the cycle-to-cycle consistency of NaSt1’s photometric variability.
| Filter |
Amplitude
(mag) |
Mag. Offset | MJD () |
|---|---|---|---|
|
UKIRT/ESO
U: 1.24 (0.23) m E: 1.21 (0.19) m |
|||
|
UKIRT/ESO
U: 1.65 (0.26) m E: 1.64 (0.27) m |
|||
|
UKIRT/ESO
U: 2.18 (0.37) m E: 2.22 (0.36) m |
|||
|
UKIRT/ESO
U: 3.77 (0.53) m E: 3.74 (0.58) m |
Note. — Instrument filter details (effective wavelength and bandwidth) and results from adopted-period ( d) sine fits to the historical -band light curves of NaSt1 observed by UKIRT and ESO 1 m. Fitted properties include the variability amplitude, magnitude offset at mid-line of the fitted sine function, and the MJD where the phase of the sine function . The phase fitting assumed an initial estimate of MJD 45630.
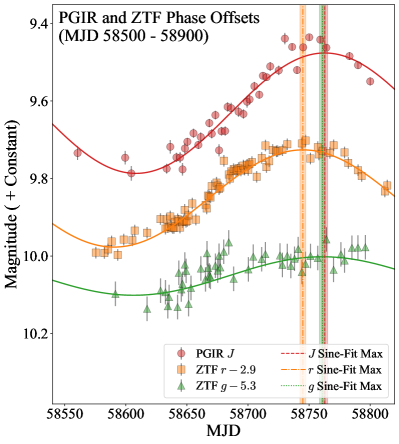
The ZTF -band and PGIR -band light curves from NaSt1 between MJD 58550 and MJD 58900 and the adopted-period sinusoidal fits indicate a significant () phase offset of d, where the -band peak lags behind the -band peak (Fig. 3, right). There is a similar phase offset between the ZTF -band and -band light-curve fits, where the -band offset agrees with the PGIR -band offset within the uncertainties. The phase offsets suggest that the PGIR -band and ZTF -band emission originate from distinct stellar and/or circumstellar components of NaSt1.
3.2 Historical IR Variability
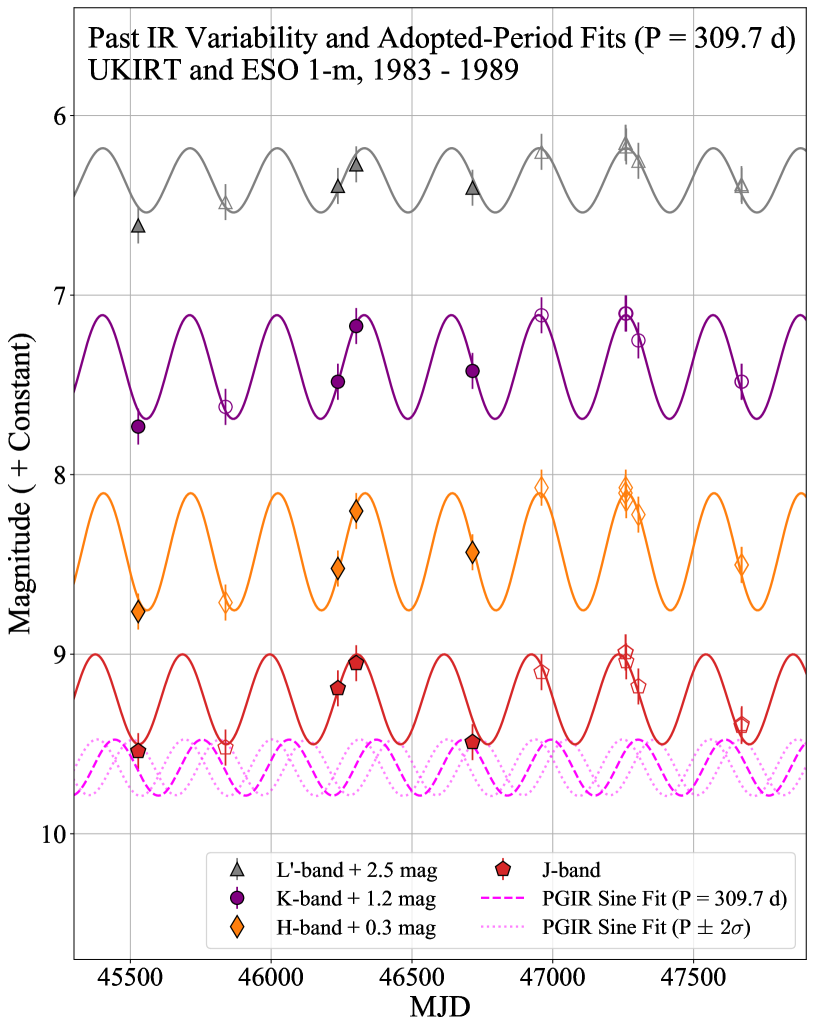
Adopted-period ( d) light-curve fits to the UKIRT and ESO 1 m -band observations of NaSt1 taken in 1983–1989 reveal that the periodicity of the past photometric variability is consistent with the present-day observations (Fig. 4). Adopted-period light-curve fits to the -band observations were unsatisfactory, which was likely due to the larger photometric uncertainties. Fig. 4 also shows the predicted -band emission based on the adopted-period fit to the PGIR light curve. Note that despite the small uncertainties in the period ( d) used for the light-curve fitting, the extrapolation from MJD to MJD leads to large uncertainties in the predicted phase. The consistent fit to the historic photometry strengthens our adopted period and demonstrates coherence of the periodic variability over decades.
The results from the adopted-period fits to the historical IR light curves are shown in Table 4. Similar to the results from the recent optical/IR light curve analysis (Tab. 3), the variability amplitudes differ at different filter wavelengths. Interestingly, the results from the light-curve fits indicate that the past -band emission was brighter and showed variability amplitudes larger than the recent PGIR -band observations.
It is important to consider the color and magnitude conversions between the different IR photometric systems of UKIRT/ESO and PGIR. Based on the UKIRT and 2MASS transformation equations 37–40 from Carpenter (2001) and the measured magnitude offsets from the adopted-period light-curve fits (Tab. 4), the 2MASS and UKIRT -band photometry conversion is . Owing to their similar filter properties, , which implies that the change in between the past and recent observations is mag. This suggests that NaSt1 does indeed exhibit variability on longer ( decade) timescales.
3.3 Mid-IR Variability
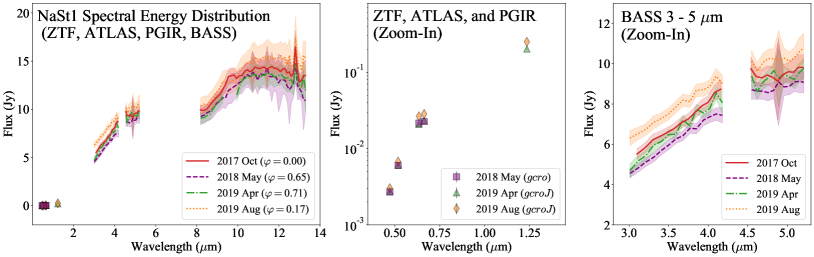
Mid-IR spectroscopy of NaSt1 with BASS taken in 2017–2019 reveals variability at 3–13 m (Fig. 5), where the mid-IR flux from NaSt1 is likely dominated by thermal emission from circumstellar dust (Crowther & Smith, 1999; Rajagopal et al., 2007). The IR-dominated spectral energy distribution (SED) in Figure 5 (left) also demonstrates that NaSt1 is enshrouded by circumstellar dust in addition to being obscured by interstellar material.
Figure 5 (center) shows the semicontemporaneous ZTF , ATLAS , and PGIR photometry taken within 20 d () of the BASS spectroscopy in 2019 Apr. (MJD 58579) and within 7 days () of BASS spectroscopy in 2019 Aug. (MJD 58719). Figure 5 (center) also shows the ZTF and ATLAS photometry taken within 4 d () of the BASS spectroscopy in 2018 May (MJD 58251). The timing of the 2019 Apr. () and 2019 Aug. () observations sample near the NaSt1 minimum and peak emission, respectively (see Fig. 1). The NaSt1 SED at these two epochs shows that the trend in the mid-IR variability is consistent with the optical/near-IR variability (Fig. 5, right). The ZTF, ATLAS, and PGIR photometry increased by 10–30% between the 2019 Apr.and 2019 Aug. The 3–13 m emission increased similarly by –30% between 2019 Apr. and 2019 Aug., where the largest variations () were observed at shorter mid-IR wavelengths ( m). Variability from the circumstellar dust emission in the mid-IR is therefore likely linked to the optical/near-IR variability.
3.4 Color Variability
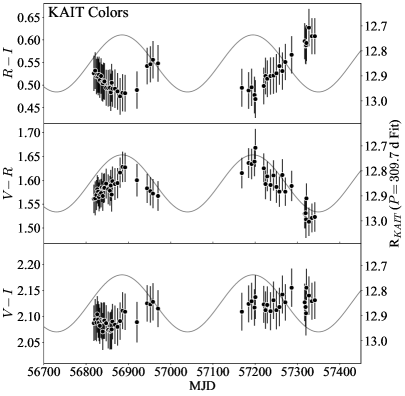
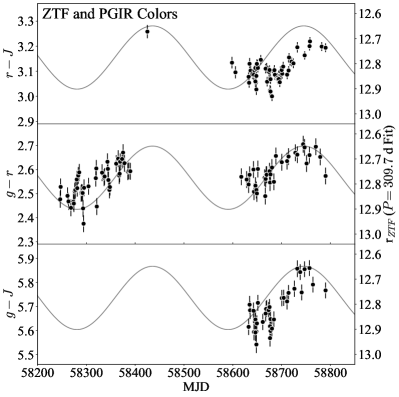
In order to investigate the color variability of NaSt1, KAIT and ZTF/PGIR color curves were produced with simultaneous or nearly contemporaneous observations. Figure 6 (left) presents KAIT , , and color curves, which are derived directly from the simultaneous multiband KAIT observations. Since PGIR and ZTF observations were not performed simultaneously, the PGIR/ZTF , , and light curves in Figure 6 (right) were produced by utilizing observations taken within d ().
KAIT color curves in Figure 6 (left) each show different variability trends. The color curve varied consistently with the -band brightness; however, the curve indicates the opposite trend. The color curve exhibits no significant variability, which is likely due to the lower amplitude of the -band variability relative to that of the shorter wavelength -band filter (Fig. 2). The ZTF and PGIR , , and color curves all show variability correlated with increasing -band brightness. The discrepancies in the color evolution reflect the inconsistency of the variability amplitude from NaSt1 as a function of wavelength and suggest that different wavelength filters trace emission from different stellar and/or circumstellar components. The observed phase offsets between different filters (Fig. 3, right) likely influence the color evolution as well.
3.5 Emission-Line Contributions
Optical and near-IR spectroscopy of NaSt1 by Crowther & Smith (1999) revealed prominent narrow nebular emission lines such as He i , H, and [N ii] , which may contribute to the photometric measurements and variability. In order to determine whether the emission lines are influencing the variability, the NaSt1 emission-line list from Crowther & Smith (1999) was used to quantify the relative observed flux density contribution to the model-derived photometry (i.e., “Mag. Offset” in Table 3). A absolute flux calibration uncertainty was assumed for both the emission-line measurements from Crowther & Smith (1999) and the PGIR, KAIT, ATLAS, ZTF, and ASAS-SN photometry.
Table 3 shows , the ratio of the flux density from NaSt1’s observed emission lines over the filter bandwidths relative to the observed photometry. The nebular emission lines from NaSt1 do indeed appear to contribute –30% to the optical photometry, where the strongest emission lines in NaSt1 are associated with He i, He ii, and [N ii]. However, the emission line contribution is much lower in . Since the amplitudes in the optical light curves are in the range –0.13 mag, or –11% of the “Mag. Offset,” it is possible that the photometric variability may be due to changes in the observed strength of the emission lines in these filters. Interestingly, the ATLAS , ZTF , and KAIT observations which exhibit the largest photometric variability amplitudes at optical wavelengths (Fig. 2) are the only bands that include coverage of He i , the strongest optical emission line observed from NaSt1 (Crowther & Smith, 1999). These are also the only filter bands that include coverage of H and [N ii] , where emission from the latter appears as an extended and asymmetric nebula around NaSt1 (Mauerhan et al. 2015; Fig. 7, top)
The emission-line contribution to the PGIR -band photometry is negligible, which indicates that the large variability amplitude does not arise from variable near-IR emission lines. There is also minimal () emission-line contribution to the past photometry from UKIRT/ESO (Tab. 4), which suggests that the apparent change in the -band amplitude variability between the UKIRT/ESO and PGIR observations is not due to emission line variations. -band emission from NaSt1 may instead be dominated by thermal emission from circumstellar dust.
It is possible that the PGIR , ATLAS , ZTF , and KAIT bands exhibit high-amplitude variability because the filter bands trace emission with a significant contribution from circumstellar material. The other filter bands with lower variability amplitudes may instead be more influenced by stellar continuum emission.
4 Discussion
4.1 Possible Single-Star Origins of Variability
NaSt1’s asymmetric nebula (Fig. 7, top; Mauerhan et al. 2015) combined with the discovery of its regular period suggests that NaSt1 hosts a binary. Photometric variability arising from pulsations or other intrinsic instability in hot, single, massive stars also do not typically appear as regular or sinusoidal as we observe from NaSt1 (e.g., Soraisam et al. 2020). We therefore postulate that the smooth d photometric variability is most likely modulated by the orbit of a binary in NaSt1. This discussion is notably reminiscent of the long debate on the binary vs. single-star hypotheses on Car, where the binary interpretation is favored based on observations of its stable periodic variability (Damineli, 1996; Corcoran, 2005; Damineli et al., 2008). However, it is still important to consider the possible single-star mechanisms that may also account for the observed variability in NaSt1.
One of the most common origins of stellar variability is stellar pulsations. This mechanism can result in near-sinusoidal photometric variations, which have been observed from stars such as Cepheids, Miras, and red supergiants (RSGs). However, the amplitude of the photometric variability arising from stellar pulsations exhibits a characteristic wavelength dependence, where the amplitudes increase toward shorter wavelengths owing to associated changes in the star’s effective temperature (e.g., Klagyivik & Szabados 2009). This is inconsistent with the observed variability amplitudes of NaSt1 at different-wavelength filters as shown in Fig. 2. We therefore argue against stellar pulsations as the origin of NaSt1’s photometric variability.
Another possibility for a single-star variability origin is rotational modulation that occurs in a rare class of highly magnetised O-stars with the peculiar “Of?p” classification (Walborn, 1973; Howarth et al., 2007; Grunhut et al., 2017). Of?p stars exhibit near-sinusoidal variability on the order of mag and are attributed to phase-dependent occulations of a wind-trapped magnetosphere (Nazé et al., 2015; Munoz et al., 2020). They can also be slow rotators with rotation periods that range from weeks to years (Nazé et al., 2015). Of?p stars also exhibit dramatic spectral variability. For example, the well-known Galactic Of?p star HD 191612 exhibits both photometric variations and strongly variable Balmer and He i lines on a d period (Howarth et al., 2007). Interestingly, another Galactic Of?p star, HD 148937, is surrounded by an extended dusty and N-rich circumstellar nebula (Mahy et al., 2017), which is similar to the properties of NaSt1’s nebula. The photometric variability of Of?p stars, however, is modulated by wavelength-independent electron scattering opacity from a wind-trapped magnetosphere (Munoz et al., 2020). The variability amplitudes should therefore show no significant deviations as a function of wavelength. Howarth et al. (2007) also show that the photometric variations in HD 191612 must arise from continuum-level variability rather than changes in the line emission strength. Although it is unlikely, we cannot completely rule out the Of?p phenomenon as a contributor to NaSt1’s photometric variability.
4.2 Possible Binary Origins of Variability
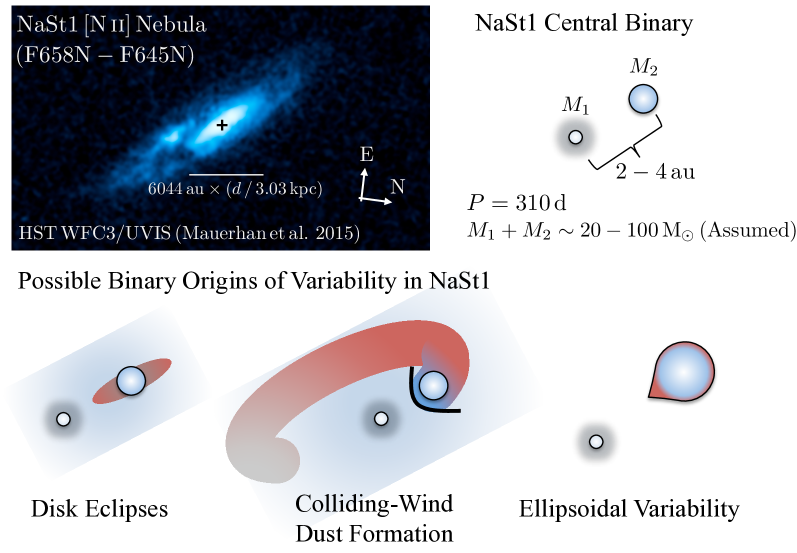
Given our discussion in the previous section, we assume that NaSt1’s photometric variability is associated with the orbital period of a binary system as opposed to a single-star origin. Here, we examine the possible binary origins of NaSt1’s variability and the relation to its orbital period. First, we can infer some orbital properties of the binary system assuming that the orbital period is consistent with the observed d variability period. Assuming a combined stellar mass in the range –100 M⊙ for the binary and a circular orbit, a d orbital period corresponds to an orbital separation of –4 au. We note that a circular orbit is expected for a system that recently underwent RLOF. The orientation of the binary system can be inferred from NaSt1’s extended N-rich nebula, which exhibits a nearly edge-on geometry with an inclination angle of (Mauerhan et al., 2015). Figure 7 (top) shows the resolved HST imaging by Mauerhan et al. (2015) of NaSt1’s N-rich nebula and our schematic illustration of the embedded central binary. (Fig. 7, bottom): disk eclipses, colliding-wind dust formation, and ellipsoidal variability.
4.2.1 Disk Eclipses
Given a large orbital separation ranging over several au, it is highly unlikely that the smooth, sinusoidal variability could arise from eclipses from the stars themselves, which would instead appear as narrow eclipses. However, we suggest that the variability may be caused by eclipses of a circumbinary disk from an optically and geometrically thick circumstellar disk in NaSt1 that formed as a result of the RLOF mass-transfer process. Several prominent emission lines in NaSt1 (e.g., [N ii] ; Crowther & Smith 1999) show double-peaked profiles that indeed indicate the presence of a disk.
This scenario is similar to the massive eclipsing binary RY Scuti, which is currently undergoing RLOF with a mass gainer that appears to be enshrouded by an optically and geometrically thick accretion disk (Grundstrom et al., 2007; Djurašević et al., 2008; Smith et al., 2011b). RY Scuti also exhibits smooth, periodic variability; however, its 11 d orbital period is much shorter than that of NaSt1, and its variability is not as consistent with a sine wave (Djurašević et al., 2008).
Given the significant contribution from the strong nebular emission lines to the observed photometry in NaSt1 (Table 3), it is possible that the photometric variability is linked to the obscuration of line-emitting regions from a circumbinary disk by a circumstellar disk. Optical variability in this scenario could arise from a circumstellar disk obscuring a varying fraction of the emitting surface area of a circumbinary disk, which requires the density distribution of the circumbinary disk to deviate from circular symmetry. This may be expected if circumbinary material is associated with NaSt1’s asymmetric [N ii] nebula (Fig. 7). The observed IR variability may then arise from disk eclipses of the observed circumstellar/circumbinary dust component around NaSt1 with an extent of au (Rajagopal et al., 2007).777This has been updated with the recent kpc distance estimate to NaSt1 (Rate & Crowther, 2020), and we note that Rajagopal et al. (2007) had adopted a distance of 2 kpc. A similar alternative scenario is that a circumstellar disk may block a significant fraction of the ionizing and dust-heating radiation field from the stripped-envelope, mass-donor star. If the surrounding nebulae of dust and ionized gas are asymmetric, this scenario could also lead to optical/IR variability throughout the orbit of the central binary.
Another disk-related scenario, where the mass gainer in NaSt1 has an optically-thick accretion-disk like RY Scuti, is that the photometric variability may arise from the disk precession. The emission from the disk could be powered by reprocessed light from the hot, ionizing star in NaSt1, which would be analogous to the 162-d “super-orbital” period from the Galactic microquasar SS 433 (e.g., Fabrika 2004). However, such a scenario should present complex photometric variability modulated by a shorter-timescale orbital period. Although a detailed analysis of this hypothesis is beyond the scope of this work, we consider this scenario unlikely given NaSt1’s smooth and stable sinusoidal variability.
4.2.2 Colliding-wind Dust Formation
Mid-IR and X-ray observations of NaSt1 indicate the presence of ongoing or recent dust formation that may be due to colliding winds (Rajagopal et al., 2007; Mauerhan et al., 2015). Dust formation via colliding winds is common in late-type carbon-rich WR (WC) binaries (Williams et al., 1987) and is also believed to occur in Car (Smith, 2010). In this process, the strong wind from the WR star collides with the weaker wind from an OB-star companion which creates a dense shock front that cools and forms dust in the wake of the OB star (Usov, 1991; Tuthill et al., 2008). An inclined dust-forming WR binary can exhibit smooth IR variability owing to viewing perspective variations toward the dust-forming region throughout the system’s orbit (Monnier et al., 1999; Hendrix et al., 2016). The line-of-sight optical depth to the dust-forming regions can vary with viewing angle due to obscuration from optically thick regions of the colliding-wind shock cone. These effects are evident in the colliding-wind dust-forming WR system WR 98a (WC8-9vd; Williams et al. 1995), which exhibits a “rotating” dusty pinwheel nebula and roughly sinusoidal IR variability that are both consistent with a d period (Monnier et al., 1999). HD 36402, a WC4(+O?)+O8I system in the Large Magellanic Cloud (Moffat et al., 1990), also exhibits dust formation and sinusoidal IR variability with a 5.1 yr photometric period (Williams et al., 2013; Williams, 2019).
Observations of NaSt1 do not present an obvious dusty pinwheel nebula; however, a dusty pinwheel may be difficult to resolve owing to its shorter orbital period and high inclination. It is therefore plausible that the near-IR and mid-IR variability from NaSt1 may be due to a mechanism similar to that seen in WR 98a and HD 36402.
In the colliding-wind dust-formation scenario, the optical variability observed from NaSt1 could be linked to obscuration of a circumbinary nebula by optically thick regions of the colliding-wind shock cone and/or newly formed dust. As mentioned in Sec. 3.5, the variability amplitudes of the optical and IR light curves may therefore be associated with the fraction of the circumstellar/circumbinary emission over the stellar continuum emission in each filter band. The filter bands that exhibit that highest variability amplitude are notably the PGIR band, which should be dominated by circumstellar dust, and the ZTF , KAIT , and ATLAS bands, which cover the brightest nebular emission line He i as well as H and [N ii] . The other filter bands that show lower amplitude variability are less influenced by the nebular emission and may capture variability influenced by the stellar continuum emission.
We note that it is unlikely that the observed variability of NaSt1 arises from variable or episodic dust formation since we would expect anti-correlated IR and optical light curves, where newly forming IR-luminous dust obscures the optical emission.
4.2.3 Ellipsoidal Variability
Given the interpretation of binary mass transfer in NaSt1 (Mauerhan et al., 2015), the stars and/or a circumstellar disk may be tidally distorted and exhibit ellipsoidal variability as the system reveals different cross-sections throughout its nearly edge-on orbit (e.g., Morris & Naftilan 1993). Such variations may naturally reproduce some of the wavelength-dependent amplitudes of the light curve owing to temperature gradients along the surface of the elongated star or disk.
It is important to note that if the NaSt1 light curve was modulated by ellipsoidal variability throughout a binary orbit, its orbital period would be twice that of the period derived from the sinusoidal model because two consecutive brightness peaks would correspond to the two phases of quadrature in a full orbit. Tidally elongated stars in such a wide orbital configuration would therefore have to exhibit large radii. Assuming a d orbital period, a combined stellar mass range of 20–100 M⊙, and a binary mass ratio of 0.25–4.0, the radius of the tidally distorted star would have to approach its Roche-lobe radius of 220–710 R⊙ (Eggleton, 1983). In this scenario, the tidally distorted star should therefore possess a radius consistent with that of a supergiant.
4.2.4 Preferred Interpretation and Unresolved Issues
Given the evidence for dust formation, we favor the interpretation that NaSt1’s periodic variability is linked to variable line-of-sight optical depth effects from colliding-wind dust formation. The longer timescale variability suggested by the past -band light curve (Fig. 4) may be a product of stellar variability and/or fluctuations in the optical/UV radiation heating the circumstellar dust. We cannot conclusively rule out a possible contribution to NaSt1’s periodic photometric variability from disk eclipses and/or ellipsoidal variability. In Sec. 4.3 & 4.4, we will argue that NaSt1 does not host a supergiant, which suggests that ellipsoidal variability from a tidally distorted star is unlikely.
It is interesting to note that almost all known massive dust-forming colliding-wind binaries exhibit a C-rich chemistry and host a WC star (Crowther, 2007). Future work on determining the composition of circumstellar dust around NaSt1 will be important for distinguishing the chemistry of the enshrouded star(s).
Unfortunately, it is difficult to deduce a comprehensive interpretation of NaSt1’s variability that satisfies all of the observational constraints. Most notably, there are still unresolved issues on how to account for the apparent phase delay between different filters (Fig. 3, right; Table 3) as well as the origin of longer timescale variability suggested by the historical -band light curve (Fig. 4). We can speculate on the origin of the 17-day phase offset between the PGIR and ZTF light curves (Fig. 3, right), where the phase delay timescale corresponds to a light-travel distance of 2940 AU, or 10 at a distance of 3.03 kpc. Given the extent of bright circumstellar material in the central regions of NaSt1’s nebula (Fig. 7, top left), it is possible that the phase delay corresponds to the light-travel time between stellar and/or circumstellar components of NaSt1.
Owing to the complexity and obscured nature of NaSt1, further observations and theoretical modeling are needed to resolve these issues and test our hypotheses. Three-dimensional radiative transfer models would be valuable for exploring how variations in line-of-sight optical depths from colliding-wind dust formation affect the optical and IR light curves as well as the multi-epoch mid-IR BASS spectra. Continued multiwavelength photometric as well as spectroscopic monitoring of NaSt1 will also be important for resolving the origin(s) of its variability.
4.3 On the Nature of NaSt1: An Ofpe/WN9 Eruption?
Assuming that the photometric variability is modulated by the orbital motion of a binary in NaSt1, we can speculate on its nature in the context of the mass-transfer interpretation presented by Mauerhan et al. (2015). The –4 au binary orbital separation (Sec. 4.1) allows us to estimate the Roche-lobe radius that the mass-donor star must have approached in order to trigger mass transfer. Adopting a binary mass ratio of 0.25–4.0, the Roche-lobe radius is in the range 140–450 R⊙. Although such a large stellar radius might suggest an RSG mass donor, an RSG is not consistent with the high temperatures ( K) inferred from NaSt1’s high-excitation nebular emission lines, and there are no spectroscopic RSG features in the the IR where its emission should be directly observable (Crowther & Smith, 1999).
Crowther & Smith (1999) suggested that the highly CNO-processed composition of the nebula and the temperature of the hot ionizing source is consistent with an early-type nitrogen-rich WR (WN) star; however, they demonstrated that NaSt1 does not exhibit any broad features consistent with an early WN star. It is important to note that the absence of spectroscopic confirmation of WR features does not preclude the presence of a WR star in NaSt1. The LBV system Car is also enshrouded by dense circumstellar material and hosts an unseen hot massive companion that is thought be a WR star (see Smith et al. 2018 and references therein).
Interestingly, Smith et al. (2020) presented observations of an Ofpe/WN9 star, which are stars that show properties intermediate between those of Of and WN stars (Walborn, 1977; Bohannan & Walborn, 1989), and confirmed that they can undergo an LBV-like eruption. During this eruptive phase, the radius of the Ofpe/WN9 star can expand to double the size of its quiescent radius (Smith et al., 2020). Ofpe/WN9 stars in the Galactic center exhibit radii of –80 , which corresponds to the radius where (Martins et al., 2007). We therefore suggest that mass transfer in NaSt1 could have been triggered during an eruptive phase from an Ofpe/WN9 star that is now obscured or outshined by dense circumbinary or circumstellar material. The massive RLOF binary RY Scuti is also believed to have undergone past LBV-like eruptions that led to the formation of its toroidal circumstellar nebula (Smith et al., 2011b).
Earlier, van der Hucht et al. (1989, 1997) had proposed that NaSt1 may host an Ofpe/WN9 star; however, this was based only on the nebular spectrum. Crowther & Smith (1999) instead suggested that NaSt1 hosts an early-type WN star based on the high temperatures required for the ionization source of its nebula. Our Ofpe/WN9 hypothesis on the nature of NaSt1 is still consistent with the interpretation by Crowther & Smith (1999): after its eruption, the mass donor may no longer resemble an Ofpe/WN9 star and could have transitioned to a hotter, earlier-type WN phase like the Ofpe/WN9 star MCA-1B studied by Smith et al. (2020). It is also possible that envelope stripping may have led to a more advanced chemical composition than the WN phase such as the WC phase. However, the deficiency of carbon in the circumstellar environment around NaSt1 would require a very recent transition to a WC star.
We can obtain insight on the enshrouded star(s) in NaSt1 from radio observations taken by the Karl G. Jansky Very Large Array (VLA) telescope in the Global View of Star Formation in the Milky Way (GLOSTAR) survey (Medina et al., 2019). Interestingly, NaSt1 exhibits a radio spectral index of between 4 Ghz and 8 GHz, consistent with the spectral index expected for free-free emission from an ionized stellar wind (; Wright & Barlow 1975; Panagia & Felli 1975). Such thermal radio emission properties are commonly identified from the ionized winds of OB and WR stars (Abbott et al., 1986; Bieging et al., 1989). We can then estimate the mass-loss rate of the ionized wind given the theoretical relation between the observed radio flux density and the stellar wind parameters (Wright & Barlow, 1975):
| (1) |
where is the mass-loss rate in M⊙ yr-1, is the wind velocity in km s-1, is the mean molecular weight, is the mean ionic charge, is the number of electrons per ion, is the Gaunt factor at observed frequency , and is the distance in kpc. In order to estimate the mass-loss rate from the NaSt1 radio counterpart, we assume that , which is consistent with H-poor winds, and , , and (Leitherer et al., 1997). Given the absence of any obvious stellar emission features from NaSt1’s optical and near-IR spectrum (Crowther & Smith, 1999), we must provide a guess for the wind velocity associated with the radio counterpart. Since the wind is most likely ionized by a hot central WR or OB star, we adopt a wind velocity of km s-1. From NaSt1’s observed 5.8 GHz flux density of mJy (Medina et al., 2019), we then estimate a mass-loss rate of
| (2) |
This mass-loss rate estimate is likely uncertain by factors of a few given NaSt1’s unknown wind velocity. However, we note that a mass-loss rate of M⊙ yr-1 is consistent with the upper range of mass-loss rates exhibited by Galactic WN stars (Hamann et al., 2019).
4.4 No (More) Mass Transfer in NaSt1?
In this section, we address whether NaSt1 is undergoing RLOF mass transfer assuming the observed photometric variability is modulated by the orbital motion of the interacting (or previously interacting) binary. In order to assess the current state of mass transfer, we estimate the radius of the hot, ionizing star in NaSt1 and compare it to the Roche-lobe radius (–450 R⊙) derived above.
First, we obtain an estimate of the stellar luminosity from NaSt1’s observed brightness mag. By adopting the interstellar and/or circumstellar extinction correction toward NaSt1 by Crowther & Smith (1999) of mag and using the Gaia-derived distance of kpc (Rate & Crowther, 2020), the absolute magnitude of NaSt1 is . The 30,000 K lower limit of the temperature derived for the ionizing source in NaSt1 by Crowther & Smith (1999) from optical spectroscopy implies a bolometric correction is mag, which indicates a stellar luminosity of L⊙. The radius of such a 30,000 K star would be R⊙, an order of magnitude less than the estimated Roche-lobe radius. Stellar temperatures higher than 30,000 K will require larger bolometric corrections and thus lead to higher stellar luminosities; however, the resulting radii will be smaller than that of the 30,000 K star. For example, a star with a temperature of 200,000 K, which is the upper limit of the ionizing source temperature derived by Crowther & Smith (1999), would imply a luminosity of L⊙ and a stellar radius of R⊙ given the appropriate bolometric correction of mag. Based on these constraints, we suggest that NaSt1 is not currently undergoing binary mass transfer.
| Property | Value | Ref |
|---|---|---|
| Eq. Coordinates (J2000) | , | 1 |
| Gal. Coordinates (J2000) | 033.9154∘, +00.2639∘ | 1 |
| PM | mas yr-1 | 1 |
| PM | mas yr-1 | 1 |
| Distance | kpc | 2 |
| Spec. Classifications |
WN10
Ofpe/WN9, B[e], O[e] Early WR + Car-like Nebula? |
3, 4
5, 6 7 |
| 6.5 mag | 7 | |
| Var. Period | d | 8 |
| mJy | 9 | |
| Spec. Index, | 9 | |
| M⊙ yr-1 | 8 | |
| erg s-1 | 10 | |
| L⊙ | 7, 8 | |
| () | 16.208 (0.034) | 8 |
| () | 15.349 (0.049) | 8 |
| () | 14.370 (0.054) | 8 |
| () | 14.414 (0.066) | 8 |
| () | 12.850 (0.114) | 8 |
| () | 12.775 (0.126) | 8 |
| () | 12.608 (0.105) | 8 |
| () | 12.303 (0.054) | 8 |
| () | 9.632 (0.156) | 8 |
| () | 9.25 (0.25) | 8 |
| () | 8.18 (0.33) | 8 |
| () | 6.17 (0.29) | 8 |
| () | 3.87 (0.18) | 8 |
Note. — References: 1 - Gaia Collaboration (2018), 2 - Rate & Crowther (2020), 3 – Nassau & Stephenson (1963), 4 – Massey & Conti (1983), 5 – van der Hucht et al. (1989), 6 – van der Hucht et al. (1997), 7 – Crowther & Smith (1999), 8 – This work, 9 – Medina et al. (2019), 10 – Mauerhan et al. (2015)
5 Conclusions
A comprehensive summary of NaSt1’s properties including the results from our work are provided in Table 5. In this paper, we presented the discovery of a d photometric variability period from NaSt1 with optical and near-IR light curves obtained between 2014 July and 2021 July (Fig. 1). The best-constrained period, d, is derived from a sinusoidal fit to the ZTF -band light curve. The amplitude of NaSt1’s sinusoidal variability differed at different wavelengths, and we identify a significant phase shift between the sine models fit to the -band and -band light curves (Table 3; Fig. 3, right). Based on previously cataloged optical emission lines from the nebula surrounding NaSt1 (Crowther & Smith, 1999), we determined that nebular emission lines contribute –30% to the optical photometry (Table 3). The fraction of emission originating from circumstellar material may therefore be linked to the differing variability amplitudes observed across the filter wavelengths. Historical IR light curves over 1983–1989 show that the past variability was consistent with the present-day period of d. However, the past -band brightness and variability amplitudes (Tab. 4) were greater than that measured by the recent PGIR light curves, suggesting that NaSt1 exhibits variability on longer ( decade) timescales. Mid-IR AEOS/BASS spectra of NaSt1, which were taken semicontemporaneously with ZTF, ATLAS, and PGIR observations, demonstrated that its 3–13 m emission is also variable and appears to be correlated with the optical/near-IR variability (Fig. 5).
We discussed possible single-star origins for NaSt1’s photometric variability. Stellar pulsations are an unlikely origin given the inconsistency between the observed and expected trend in the variability amplitude as a function of wavelength (see Fig. 2). We also considered rotational modulation in a rare class of highly magnetized O-stars (Of?p) as a possible origin of single-star variability. However, the amplitude of photometric variations from Of?p stars should show no significant deviations as a function of wavelength, which is also discrepant from the observations of NaSt1. We therefore postulate that the observed d optical/near-IR periodic, sinusoidal variability is associated with the orbital period of a binary system in NaSt1. Although the properties of the stars in this binary system are still unknown, we use the d orbital period to estimate an orbital separation of –4 au assuming a combined binary mass ranging between 20–100 M⊙ (Fig. 7, top).
Given the nearly edge-on geometry of NaSt1’s extended nebula (Mauerhan et al., 2015), we present possible binary origins of variability including (1) eclipses of a circumbinary disk from an optically and geometrically thick circumstellar disk around one of the stars, (2) variations in the line-of-sight optical depth to optical/near-IR emitting regions due to colliding-wind dust formation, and (3) ellipsoidal variability from a tidally elongated star (Fig. 7, bottom). We favor the colliding-wind dust formation hypothesis; however, future work with 3D radiative transfer modeling is crucial to reproduce optical and IR light curves that incorporate the line-of-sight optical depth variability throughout the orbit of a highly inclined dust-forming colliding-wind binary. Ultimately, the origin(s) of NaSt1’s photometric variability is still an open question. Further work and more observations are needed to develop a comprehensive interpretation that satisfies all of the observational constraints including the phase offsets and historical IR variability.
Assuming that NaSt1’s periodic photometric variability reflects a d binary orbital period, we addressed whether the binary is undergoing RLOF mass transfer. Based on the CNO-enriched material in NaSt1’s nebula and the estimated range of sizes for the Roche-lobe radius of the mass donor star in NaSt1 (–450 R⊙), we suggest that mass transfer could have been triggered by an LBV-like eruptive phase in an Ofpe/WN9 star in NaSt1 that filled its Roche lobe as it expanded. This interpretation is bolstered with recent observations by Smith et al. (2020) that confirmed Ofpe/WN9 stars can undergo LBV-like eruptions and expand to double the size of their quiescent radius. Owing to the mass loss from its outer envelope, it is possible that the mass donor star in NaSt1 no longer resembles an Ofpe/WN9 star. The donor star may have transitioned to either a hotter, earlier WN spectral subtype or a more chemically advanced WC phase. Radio observations of NaSt1 in the GLOSTAR survey (Medina et al., 2019) reveal a spectral index consistent with free-free emission from an ionized stellar wind and reinforces the interpretation that NaSt1 hosts a hot massive star. Given the relation between the observed radio flux and stellar wind parameters provided by Wright & Barlow (1975), we estimated a mass-loss rate of M⊙ yr-1,consistent with the upper range of mass-loss rates exhibited by Galactic WN stars.
Based on the inferred orbital separation and the radius estimates of the star that dominates the ionizing flux and -band emission, we suggest that such a binary system is no longer undergoing mass transfer. NaSt1 still remains an enigmatic system that could provide new insights into an important transitional evolutionary phase of massive stars. Multiwavelength follow-up observations and continued spectroscopic and photometric monitoring will therefore be valuable for addressing the open questions on the nature of NaSt1.
References
- Abbott et al. (1986) Abbott, D. C., Beiging, J. H., Churchwell, E., et al. 1986, ApJ, 303, 239. doi:10.1086/164070
- Astropy Collaboration et al. (2013) Astropy Collaboration, Robitaille, T. P., Tollerud, E. J., et al. 2013, A&A, 558, A33
- Astropy Collaboration et al. (2018) Astropy Collaboration, Price-Whelan, A. M., Sipőcz, B. M., et al. 2018, AJ, 156, 123
- Belczynski et al. (2016) Belczynski, K., Holz, D. E., Bulik, T., et al. 2016, Nature, 534, 512. doi:10.1038/nature18322
- Bellm et al. (2019) Bellm, E. C., Kulkarni, S. R., Graham, M. J., et al. 2019, PASP, 131, 018002. doi:10.1088/1538-3873/aaecbe
- Bieging et al. (1989) Bieging, J. H., Abbott, D. C., & Churchwell, E. B. 1989, ApJ, 340, 518. doi:10.1086/167414
- Bohannan & Walborn (1989) Bohannan, B. & Walborn, N. R. 1989, PASP, 101, 520. doi:10.1086/132463
- Carpenter (2001) Carpenter, J. M. 2001, AJ, 121, 2851. doi:10.1086/320383
- Chambers et al. (2016) Chambers, K. C., Magnier, E. A., Metcalfe, N., et al. 2016, arXiv:1612.05560
- Corcoran (2005) Corcoran, M. F. 2005, AJ, 129, 2018. doi:10.1086/428756
- Crowther & Smith (1997) Crowther, P. A. & Smith, L. J. 1997, A&A, 320, 500
- Crowther & Smith (1999) Crowther, P. A. & Smith, L. J. 1999, MNRAS, 308, 82. doi:10.1046/j.1365-8711.1999.02707.x
- Crowther (2007) Crowther, P. A. 2007, ARA&A, 45, 177. doi:10.1146/annurev.astro.45.051806.110615
- Cutri et al. (2003) Cutri, R. M., Skrutskie, M. F., van Dyk, S., et al. 2003, VizieR Online Data Catalog, II/246
- Damineli (1996) Damineli, A. 1996, ApJ, 460, L49. doi:10.1086/309961
- Damineli et al. (2008) Damineli, A., Hillier, D. J., Corcoran, M. F., et al. 2008, MNRAS, 384, 1649. doi:10.1111/j.1365-2966.2007.12815.x
- Davidson & Humphreys (1997) Davidson, K. & Humphreys, R. M. 1997, ARA&A, 35, 1. doi:10.1146/annurev.astro.35.1.1
- De et al. (2020a) De, K., Hankins, M. J., Kasliwal, M. M., et al. 2020a, PASP, 132, 025001. doi:10.1088/1538-3873/ab6069
- De et al. (2020b) De, K., Ashley, M. C. B., Andreoni, I., et al. 2020b, ApJ, 901, L7. doi:10.3847/2041-8213/abb3c5
- De Marco & Izzard (2017) De Marco, O. & Izzard, R. G. 2017, PASA, 34, e001. doi:10.1017/pasa.2016.52
- Djurašević et al. (2008) Djurašević, G., Vince, I., & Atanacković, O. 2008, AJ, 136, 767. doi:10.1088/0004-6256/136/2/767
- Eggleton (1983) Eggleton, P. P. 1983, ApJ, 268, 368. doi:10.1086/160960
- Eldridge et al. (2017) Eldridge, J. J., Stanway, E. R., Xiao, L., et al. 2017, PASA, 34, e058. doi:10.1017/pasa.2017.51
- Fabrika (2004) Fabrika, S. 2004, Astrophys. Space Phys. Res., 12, 1
- Filippenko et al. (2001) Filippenko, A. V., Li, W. D., Treffers, R. R., et al. 2001, IAU Colloq. 183: Small Telescope Astronomy on Global Scales, 246, 121
- Gaia Collaboration (2018) Gaia Collaboration 2018, VizieR Online Data Catalog, I/345
- Ganeshalingam et al. (2010) Ganeshalingam, M., Li, W., Filippenko, A. V., et al. 2010, ApJS, 190, 418. doi:10.1088/0067-0049/190/2/418
- Gehrz et al. (1995) Gehrz, R. D., Hayward, T. L., Houck, J. R., et al. 1995, ApJ, 439, 417. doi:10.1086/175184
- Götberg et al. (2018) Götberg, Y., de Mink, S. E., Groh, J. H., et al. 2018, A&A, 615, A78. doi:10.1051/0004-6361/201732274
- Götberg et al. (2020) Götberg, Y., de Mink, S. E., McQuinn, M., et al. 2020, A&A, 634, A134. doi:10.1051/0004-6361/201936669
- Groh et al. (2013) Groh, J. H., Meynet, G., & Ekström, S. 2013, A&A, 550, L7. doi:10.1051/0004-6361/201220741
- Grundstrom et al. (2007) Grundstrom, E. D., Gies, D. R., Hillwig, T. C., et al. 2007, ApJ, 667, 505. doi:10.1086/521043
- Grunhut et al. (2017) Grunhut, J. H., Wade, G. A., Neiner, C., et al. 2017, MNRAS, 465, 2432. doi:10.1093/mnras/stw2743
- Hackwell et al. (1990) Hackwell, J. A., Warren, D. W., Chatelain, M. A., et al. 1990, Proc. SPIE, 1235, 171. doi:10.1117/12.19086
- Hamann et al. (2019) Hamann, W.-R., Gräfener, G., Liermann, A., et al. 2019, A&A, 625, A57. doi:10.1051/0004-6361/201834850
- Hawarden et al. (2001) Hawarden, T. G., Leggett, S. K., Letawsky, M. B., et al. 2001, MNRAS, 325, 563. doi:10.1046/j.1365-8711.2001.04460.x
- Heger et al. (2003) Heger, A., Fryer, C. L., Woosley, S. E., et al. 2003, ApJ, 591, 288. doi:10.1086/375341
- Heinze et al. (2018) Heinze, A. N., Tonry, J. L., Denneau, L., et al. 2018, AJ, 156, 241. doi:10.3847/1538-3881/aae47f
- Hendrix et al. (2016) Hendrix, T., Keppens, R., van Marle, A. J., et al. 2016, MNRAS, 460, 3975. doi:10.1093/mnras/stw1289
- Howarth et al. (2007) Howarth, I. D., Walborn, N. R., Lennon, D. J., et al. 2007, MNRAS, 381, 433. doi:10.1111/j.1365-2966.2007.12178.x
- Jayasinghe et al. (2020) Jayasinghe, T., Stanek, K. Z., Kochanek, C. S., et al. 2020, MNRAS, 493, 4186. doi:10.1093/mnras/staa499
- Klagyivik & Szabados (2009) Klagyivik, P. & Szabados, L. 2009, A&A, 504, 959. doi:10.1051/0004-6361/200811464
- Kochanek et al. (2017) Kochanek, C. S., Shappee, B. J., Stanek, K. Z., et al. 2017, PASP, 129, 104502. doi:10.1088/1538-3873/aa80d9
- Landolt (1992) Landolt, A. U. 1992, AJ, 104, 340. doi:10.1086/116242
- Lau et al. (2020) Lau, R. M., Eldridge, J. J., Hankins, M. J., et al. 2020, ApJ, 898, 74
- Leggett et al. (2003) Leggett, S. K., Hawarden, T. G., Currie, M. J., et al. 2003, MNRAS, 345, 144. doi:10.1046/j.1365-8711.2003.06943.x
- Leitherer et al. (1997) Leitherer, C., Chapman, J. M., & Koribalski, B. 1997, ApJ, 481, 898. doi:10.1086/304096
- Li et al. (2003) Li, W., Filippenko, A. V., Chornock, R., et al. 2003, PASP, 115, 844. doi:10.1086/376432
- Mahy et al. (2017) Mahy, L., Hutsemékers, D., Nazé, Y., et al. 2017, A&A, 599, A61. doi:10.1051/0004-6361/201629585
- Masci et al. (2019) Masci, F. J., Laher, R. R., Rusholme, B., et al. 2019, PASP, 131, 018003. doi:10.1088/1538-3873/aae8ac
- Martins et al. (2007) Martins, F., Genzel, R., Hillier, D. J., et al. 2007, A&A, 468, 233. doi:10.1051/0004-6361:20066688
- Massey & Conti (1983) Massey, P. & Conti, P. S. 1983, PASP, 95, 440. doi:10.1086/131190
- Mauerhan et al. (2015) Mauerhan, J., Smith, N., Van Dyk, S. D., et al. 2015, MNRAS, 450, 2551. doi:10.1093/mnras/stv257
- Medina et al. (2019) Medina, S.-N. X., Urquhart, J. S., Dzib, S. A., et al. 2019, A&A, 627, A175. doi:10.1051/0004-6361/201935249
- Meynet & Maeder (2005) Meynet, G. & Maeder, A. 2005, A&A, 429, 581. doi:10.1051/0004-6361:20047106
- Moe & Di Stefano (2017) Moe, M. & Di Stefano, R. 2017, ApJS, 230, 15. doi:10.3847/1538-4365/aa6fb6
- Moffat et al. (1990) Moffat, A. F. J., Niemela, V. S., & Marraco, H. G. 1990, ApJ, 348, 232. doi:10.1086/168232
- Monnier et al. (1999) Monnier, J. D., Tuthill, P. G., & Danchi, W. C. 1999, ApJ, 525, L97. doi:10.1086/312352
- Moore & Kasliwal (2019) Moore, A. M. & Kasliwal, M. M. 2019, Nature Astronomy, 3, 109. doi:10.1038/s41550-018-0675-x
- Morris & Naftilan (1993) Morris, S. L. & Naftilan, S. A. 1993, ApJ, 419, 344. doi:10.1086/173488
- Munoz et al. (2020) Munoz, M. S., Wade, G. A., Nazé, Y., et al. 2020, MNRAS, 492, 1199. doi:10.1093/mnras/stz2904
- Nassau & Stephenson (1963) Nassau, J. J. & Stephenson, C. B. 1963, Hamburger Sternw. Warner & Swasey Obs., C04, 0
- Nazé et al. (2015) Nazé, Y., Walborn, N. R., Morrell, N., et al. 2015, A&A, 577, A107. doi:10.1051/0004-6361/201525875
- Paczyński (1967) Paczyński, B. 1967, Acta Astron., 17, 355
- Panagia & Felli (1975) Panagia, N. & Felli, M. 1975, A&A, 39, 1
- Podsiadlowski et al. (1992) Podsiadlowski, P., Joss, P. C., & Hsu, J. J. L. 1992, ApJ, 391, 246. doi:10.1086/171341
- Rajagopal et al. (2007) Rajagopal, J., Menut, J.-L., Wallace, D., et al. 2007, ApJ, 671, 2017. doi:10.1086/522515
- Rate & Crowther (2020) Rate, G. & Crowther, P. A. 2020, MNRAS, 493, 1512. doi:10.1093/mnras/stz3614
- Rodrigo et al. (2012) Rodrigo, C., Solano, E., & Bayo, A. 2012, IVOA Working Draft 15 October 2012. doi:10.5479/ADS/bib/2012ivoa.rept.1015R
- Rodrigo & Solano (2020) Rodrigo, C. & Solano, E. 2020, Contributions to the XIV.0 Scientific Meeting (virtual) of the Spanish Astronomical Society, 182
- Rosslowe & Crowther (2015) Rosslowe, C. K. & Crowther, P. A. 2015, MNRAS, 447, 2322. doi:10.1093/mnras/stu2525
- Sana et al. (2012) Sana, H., de Mink, S. E., de Koter, A., et al. 2012, Science, 337, 444. doi:10.1126/science.1223344
- Sander & Vink (2020) Sander, A. A. C. & Vink, J. S. 2020, MNRAS, 499, 873. doi:10.1093/mnras/staa2712
- Shappee et al. (2014) Shappee, B. J., Prieto, J. L., Grupe, D., et al. 2014, ApJ, 788, 48. doi:10.1088/0004-637X/788/1/48
- Smith et al. (1999) Smith, N., Gehrz, R. D., Humphreys, R.M., et al. 1999, AJ, 118, 960
- Smith et al. (2002) Smith, N., Gehrz, R. D., Stahl, O., et al. 2002, ApJ, 578, 464
- Smith & Morse (2004) Smith, N. & Morse, J. A. 2004, ApJ, 605, 854. doi:10.1086/382671
- Smith (2010) Smith, N. 2010, MNRAS, 402, 145. doi:10.1111/j.1365-2966.2009.15901.x
- Smith et al. (2011a) Smith, N., Li, W., Filippenko, A. V., et al. 2011a, MNRAS, 412, 1522. doi:10.1111/j.1365-2966.2011.17229.x
- Smith et al. (2011b) Smith, N., Gehrz, R. D., Campbell, R., et al. 2011b, MNRAS, 418, 1959. doi:10.1111/j.1365-2966.2011.19614.x
- Smith (2014) Smith, N. 2014, ARA&A, 52, 487. doi:10.1146/annurev-astro-081913-040025
- Smith et al. (2018) Smith, N., Andrews, J. E., Rest, A., et al. 2018, MNRAS, 480, 1466. doi:10.1093/mnras/sty1500
- Smith et al. (2020) Smith, N., E Andrews, J., Moe, M., et al. 2020, MNRAS, 492, 5897. doi:10.1093/mnras/staa061
- Smith et al. (2020) Smith, K. W., Smartt, S. J., Young, D. R., et al. 2020, PASP, 132, 085002. doi:10.1088/1538-3873/ab936e
- Soraisam et al. (2020) Soraisam, M. D., Bildsten, L., Drout, M. R., et al. 2020, ApJ, 893, 11. doi:10.3847/1538-4357/ab7b7b
- Stahl et al. (2019) Stahl, B. E., Zheng, W., de Jaeger, T., et al. 2019, MNRAS, 490, 3882. doi:10.1093/mnras/stz2742
- Stetson (1987) Stetson, P. B. 1987, PASP, 99, 191. doi:10.1086/131977
- Su et al. (2013) Su, K. Y. L., Rieke, G. H., Malhotra, R., et al. 2013, ApJ, 763, 118. doi:10.1088/0004-637X/763/2/118
- Sukhbold et al. (2016) Sukhbold, T., Ertl, T., Woosley, S. E., et al. 2016, ApJ, 821, 38. doi:10.3847/0004-637X/821/1/38
- Tonry et al. (2012) Tonry, J. L., Stubbs, C. W., Lykke, K. R., et al. 2012, ApJ, 750, 99. doi:10.1088/0004-637X/750/2/99
- Tonry et al. (2018) Tonry, J. L., Denneau, L., Heinze, A. N., et al. 2018, PASP, 130, 064505. doi:10.1088/1538-3873/aabadf
- Tuthill et al. (1999) Tuthill, P. G., Monnier, J. D., & Danchi, W. C. 1999, Nature, 398, 487
- Tuthill et al. (2008) Tuthill, P. G., Monnier, J. D., Lawrance, N., et al. 2008, ApJ, 675, 698. doi:10.1086/527286
- Usov (1991) Usov, V. V. 1991, MNRAS, 252, 49
- Vanbeveren et al. (1998) Vanbeveren, D., De Donder, E., Van Bever, J., et al. 1998, New A, 3, 443. doi:10.1016/S1384-1076(98)00020-7
- van der Bliek et al. (1996) van der Bliek, N. S., Manfroid, J., & Bouchet, P. 1996, A&AS, 119, 547
- van der Hucht et al. (1981) van der Hucht, K. A., Conti, P. S., Lundstrom, I., et al. 1981, Space Sci. Rev., 28, 227. doi:10.1007/BF00173260
- van der Hucht et al. (1989) van der Hucht, K. A., Williams, P. M., van Genderen, A. M., et al. 1989, IAU Colloq. 113: Physics of Luminous Blue Variables, 301. doi:10.1007/978-94-009-1031-7_51
- van der Hucht et al. (1997) van der Hucht, K. A., Williams, P. M., Morris, P. W., et al. 1997, Luminous Blue Variables: Massive Stars in Transition, 120, 211
- Walborn (1973) Walborn, N. R. 1973, AJ, 78, 1067. doi:10.1086/111509
- Walborn (1977) Walborn, N. R. 1977, ApJ, 215, 53. doi:10.1086/155334
- Williams et al. (1987) Williams, P. M., van der Hucht, K. A., & Thé, P. S. 1987, A&A, 182, 91
- Williams et al. (1995) Williams, P. M., Cohen, M., van der Hucht, K. A., et al. 1995, MNRAS, 275, 889. doi:10.1093/mnras/275.3.889
- Williams et al. (2013) Williams, P. M., Chu, Y.-H., Gruendl, R. A., et al. 2013, MNRAS, 431, 1160. doi:10.1093/mnras/stt237
- Williams (2019) Williams, P. M. 2019, MNRAS, 488, 1282. doi:10.1093/mnras/stz1784
- Wright & Barlow (1975) Wright, A. E. & Barlow, M. J. 1975, MNRAS, 170, 41. doi:10.1093/mnras/170.1.41