Gemini NIFS survey of feeding and feedback in nearby Active Galaxies - IV. Excitation
Abstract
The near-infrared spectra of Active Galactic Nuclei (AGN) present emission lines of different atomic and molecular species. The mechanisms involved in the origin of these emission lines in AGN are still not fully understood. We use J and K band integral field spectra of six luminous () Seyfert galaxies (NGC 788, Mrk 607, NGC 3227, NGC 3516, NGC 5506 and NGC 5899) in the Local Universe () to investigate the gas excitation within the inner 100-300 pc radius of the galaxies at spatial resolutions of a few tens of parsecs. In all galaxies, the H2 emission originates from thermal processes with excitation temperatures in the range 2400–5200 K. In the high line ratio (HLR) region of the H2/Br vs. [Fe ii]/Pa diagnostic diagram, which includes 29 % of the spaxels, shocks are the main excitation mechanism, as indicated by the correlation between the line widths and line ratios. In the AGN region of the diagram (64 % of the spaxels) the H2 emission is due to the AGN radiation. The [Fe ii] emission is produced by a combination of photoionisation by the AGN radiation and shocks in five galaxies and is dominated by photoionisation in NGC 788. The [S ix]1.2523 m coronal emission line is present in all galaxies, and its flux distributions are extended from 80 to 185 pc from the galaxy nuclei, except for NGC 5899, in which this line is detected only in the integrated spectrum.
keywords:
Galaxies: active – Galaxies: Seyfert – Galaxies: nuclei – Galaxies: excitation1 Introduction
The [Fe ii] and molecular hydrogen emission lines are among the most prominent spectral features in the near-infrared (near-IR) spectra of active galactic nuclei (AGN), but which excitation mechanisms are responsible for their emission in AGN are still in debate (e.g. Rodríguez-Ardila et al., 2004; Rodríguez-Ardila et al., 2005; Riffel et al., 2006b; Dors et al., 2012; Riffel et al., 2013a, 2019; Lamperti et al., 2017). Such lines can be produced by the AGN or young stars radiation field or by shocks, as for example from supernovae explosions or interaction of a radio jet with the ambient gas.
The H2 molecule can be excited by (i) fluorescence through absorption of soft-ultraviolet photons (912–1108 Å) in the Lyman and Werner bands, existing both in star-forming regions and surrounding AGN (Black & van Dishoeck, 1987), (ii) shocks (Hollenbach & McKee, 1989), e.g. the interaction of a radio jet with the interstellar medium (Riffel et al., 2006a, 2015, e.g.) or from supernovae explosions (Larkin et al., 1998, and references therein), (iii) X-ray illumination by a central AGN (Draine & Woods, 1990; Maloney et al., 1996) or (iv) UV radiation in dense clouds, with densities in the range 104 and 105 cm-3 (Sternberg & Dalgarno, 1989; Davies et al., 2003) – see also Mouri (1994) for a discussion about the origin of the H2 emission in Seyfert and Starburst galaxies. UV fluorescence is usually regarded as a non-thermal excitation process, while shocks and X-ray/UV heating are referred to as thermal processes. Thermal and non-thermal processes produce distinct relative intensities between emission lines of H2, which can be used to discriminate the dominant excitation mechanism. Single aperture (e.g. Reunanen et al., 2002; Rodríguez-Ardila et al., 2004; Rodríguez-Ardila et al., 2005; Riffel et al., 2013a) and spatially resolved (e.g. Davies et al., 2005; Storchi-Bergmann et al., 2009; Mazzalay et al., 2013; Riffel et al., 2014a, 2020b) observations of AGN suggest that thermal processes dominate the production of the nuclear H2 emission in Seyfert galaxies. Near-IR integral field spectroscopy (IFS) provides the spatial distribution and kinematics of the emission lines, which can be used to kinematically identify signatures of shocks (e.g. increased line widths associated to a radio jet or outflow), thus making it possible to discriminate between X-rays and shocks (e.g. Riffel et al., 2010, 2015).
The [Fe ii] near-IR emission lines are produced in the partially ionised gas phase and [Fe ii]1.2570m/Pa ratio is controlled by the ratio between the volumes of the partially to fully ionised gas (Mouri et al., 1990; Mouri et al., 1993; Rodríguez-Ardila et al., 2005; Riffel et al., 2008; Storchi-Bergmann et al., 2009). The partially ionised zones in the central region of galaxies originate from X-ray emission (Simpson et al., 1996) in AGN or shocks due to the interaction of radio jets and gas outflows with the ambient clouds (Forbes & Ward, 1993). However, to determine whether the [Fe ii] emission in AGN is due to shocks or X-ray excitation, a detailed mapping of the emission-line distributions is required, which can be done by analysing IFS data of spatially-resolved outflow structures in nearby AGN or more powerful distant nuclei. Even with many works investigating the excitation processes of the H2 and [Fe ii], it is still unclear if they have a common origin or are produced by a combination of distinct mechanisms.
Some studies have used near-IR IFS to map the [Fe ii] and H2 distribution and kinematics in local Seyfert galaxies at scales from few tens to few hundreds of parsecs (e.g. Riffel et al., 2006a, 2010, 2014a, 2014b, 2020b; Durré & Mould, 2018; May & Steiner, 2017; May et al., 2020). The results reached by these studies suggest the H2 and [Fe ii] present distinct flux distributions and kinematics, with the former more restricted to the galactic plane and the latter extending to higher latitudes above it and often presenting signatures of outflows. However, the studies above are based on single objects. A detailed study on the H2 and [Fe ii] emission is performed by Colina et al. (2015), who investigated the gas excitation structure in a sample composed of 10 luminous infrared galaxies (LIRGs), 5 Seyfert galaxies and 7 Star-Forming galaxies, using near-IR IFS. They define new areas in the [Fe ii]1.6440 m/Br – H22.1218 m/Br diagnostic plane – previously based on single aperture measurements (e.g. Larkin et al., 1998; Reunanen et al., 2002; Riffel et al., 2006b; Riffel et al., 2013a), for the compact, high surface brightness regions dominated by AGN, young ionising stars, and supernovae explosions. Although, Colina et al. (2015) define typical ranges of AGN line ratios, their work is not aimed to investigate in details the excitation mechanisms of the near-IR emission lines in AGN hosts.
Besides the molecular and low ionisation gas, the near-IR spectra includes coronal emission lines (CLs) from highly ionisation gas (with typical ionisation potentials larger than 100 eV), such as [S ix]1.2523 m, which has an ionisation potential of 328.2 eV. The origin of the CLs in AGN is still not clear. These lines are usually broader than those from low ionisation gas and blueshifted relative to the stellar rest frame, indicating they originate in the outflowing gas from the outer portions of the Broad Line Region (Rodríguez-Ardila et al., 2002; Müller-Sánchez et al., 2011). This is further supported by photoionisation models, which suggest that the nuclear coronal emission in AGN originates in the inner edge of the dusty torus (Glidden et al., 2016) and by the fact that the luminosity of coronal lines is correlated with the X-ray luminosity (Rodríguez-Ardila et al., 2011). However, photoionisation models cannot reproduce the extended coronal gas emission on scales of a few hundred of parsecs, where the coronal lines originate from shocks due to the interaction of a radio jet or outflows with the interestellar medium (e.g. Rodríguez-Ardila & Fonseca-Faria, 2020).
In this study, we use near-IR IFS of a sample of six luminous Seyfert galaxies (NGC 788, Mrk 607, NGC 3227, NGC 3516, NGC 5506 and NGC 5899) to investigate the origin of the [Fe ii] and H2 emission on scales of 100 pc and map the spatial extent of the coronal emission lines. We use the same sample previously discussed in Schönell et al. (2019), where we present the data, emission-line flux, surface gas mass distributions and kinematic maps. There, we found that H2 emission originates mostly from gas rotating in the galaxy plane, while the ionised gas shows signatures of outflows. In addition, the amount of gas available in the inner kpc of these galaxies is, at least, 100 times larger than needed to power the central AGN. This paper is organized as follows. Section 2 presents information about the sample, data reduction and measurements, Section 3 presents the emission-line flux distributions and emission-line ratio diagnostic diagrams, while the discussion is presented in Section 4 and our conclusions in Section 5. We use a cosmology throughout this paper.
2 The sample, data and measurements
Our sample is composed of 6 nearby and luminous Seyfert galaxies. They are part of a sample of 29 galaxies from the Gemini NIFS survey of feeding and feedback processes in nearby active galaxies (Riffel et al., 2018). The objects on the sample were selected based on the following criteria: hard X-ray (14–195 keV) luminosities erg s-1, redshifts and extended [O iii] emission previously reported in the literature. Nine galaxies from this sample have not yet been observed, mainly due to failures in the ALTtitude conjugate Adaptive optics for the InfraRed (ALTAIR) system. Among the already observed galaxies in both J and K bands using adaptive optics, we select for this study the six objects with no previous detailed analysis on the gas excitation: NGC 788, Mrk 607, NGC 3227, NGC 3516, NGC 5506 and NGC 5899. The six galaxies studied here are the same previously studied in Schönell et al. (2019), where we focused on the presentation of data, flux and gas mass distribution. They are among the 50% more luminous objects of the Riffel et al. (2018) sample. The galaxies of our sample have (Oh et al., 2018) – which corresponds to bolometric luminosites in the range , using the relation between and presented in Ichikawa et al. (2017) – and redshifts in the range (corresponding to 17–60 Mpc).
The J and K band observations were performed with the Gemini Near-infrared Integral Field Spectrograph (NIFS, McGregor et al., 2003), which has a field of view of 3 arcsec3 arcsec and angular sampling of 0.1030.042 arcsec2. NIFS was coupled to the ALTtitude conjugate Adaptive optics for the InfraRed (ALTAIR) system and the resulting angular resolutions are in the range 0.12–0.18 arcsec, corresponding to a few tens of parsecs.
We follow the standard procedure to reduce the raw data using the gemini iraf package, including the trimming of the images, flat-fielding, cosmic ray rejection, sky subtraction, wavelength and s-distortion calibrations, removal of the telluric features, flux calibration and construction of the datacubes for each individual exposure on each science target at an angular sampling of 0.05 arcsec0.05 arcsec. The final datacubes are obtained by median combining the individual datacubes in each band using the peak of the continuum emission as reference. More details about the sample, instrument, observations and data reduction are presented in previous papers (Riffel et al., 2017, 2018; Schönell et al., 2019).
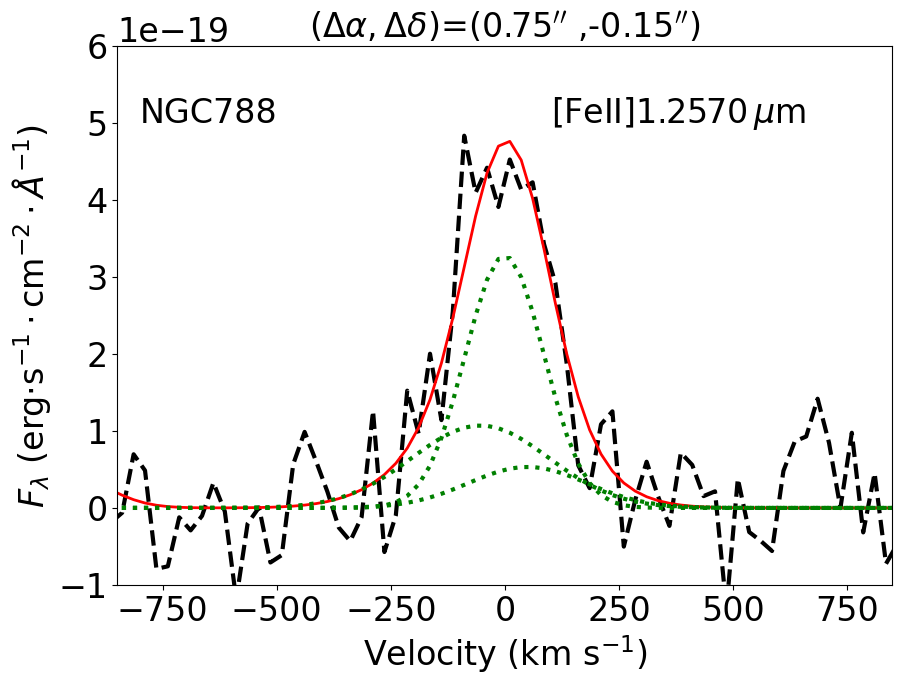
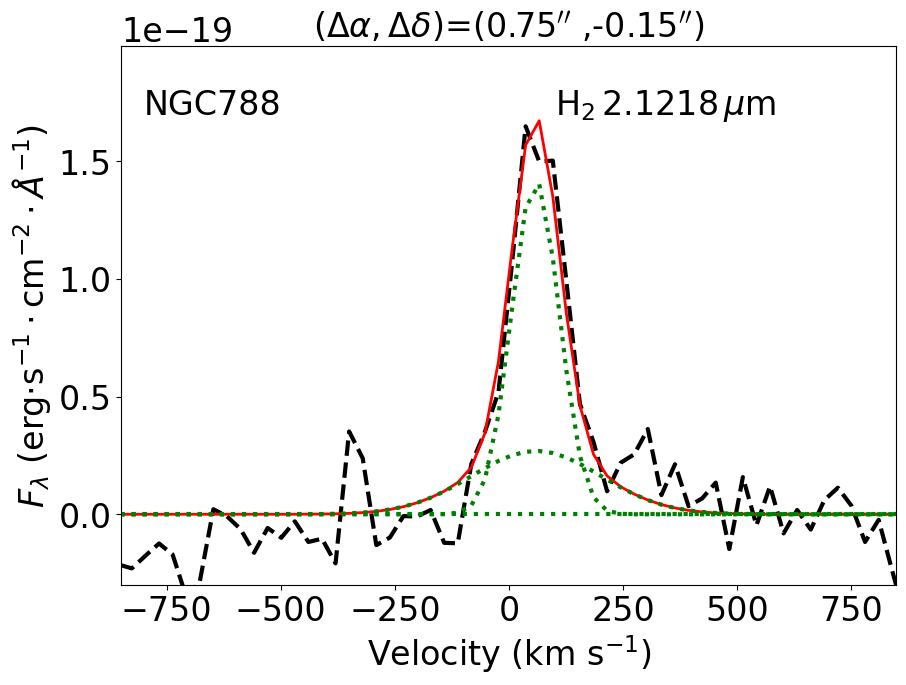
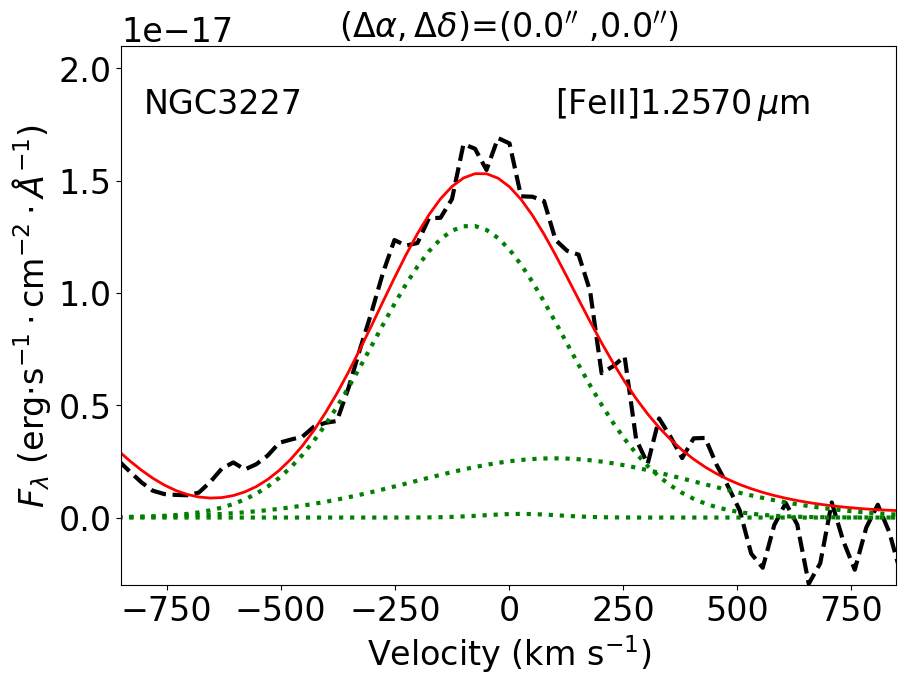
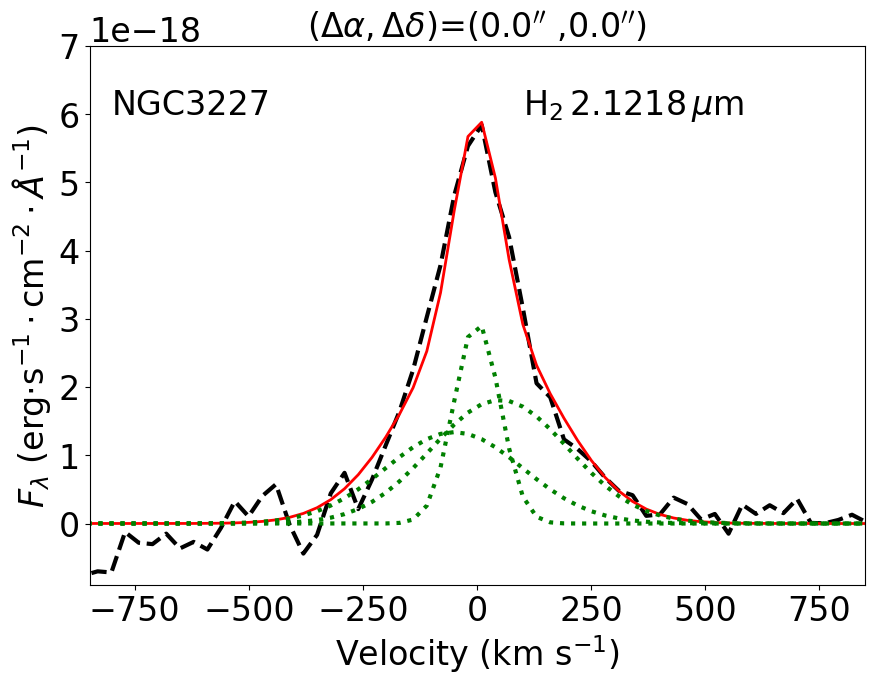
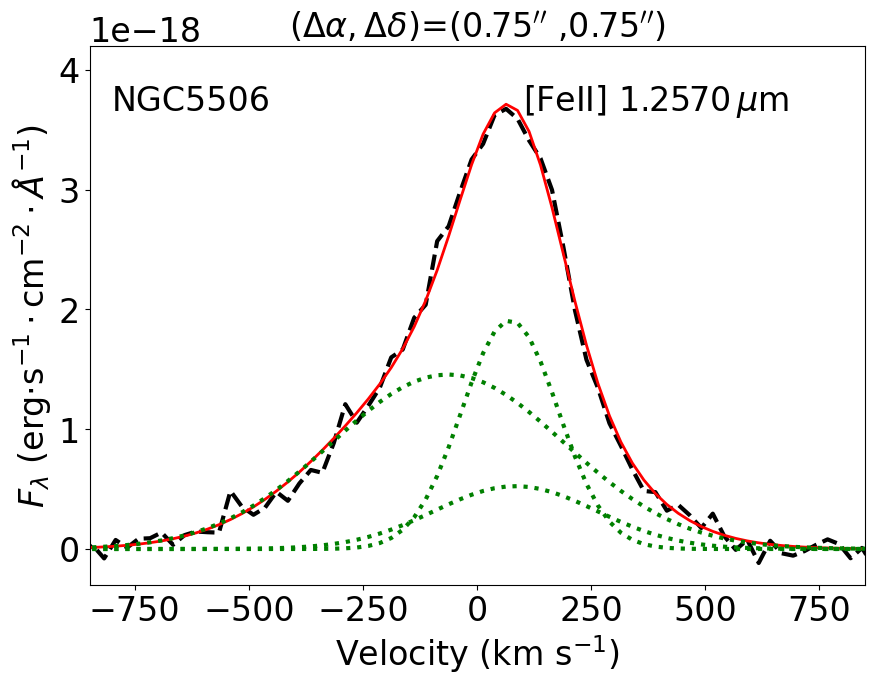
To investigate the origin of hot molecular and ionised gas emission in the galaxies of our sample, we measure the emission-line flux distribution by adopting the following procedure: first, we follow Liu et al. (2013) and fit each emission line by a combination of three Gaussian functions using the ifscube code (Ruschel-Dutra, 2020). The choice of the number of components has no physical motivation and simply aims to reproduce the observed profiles. In previous papers by our group we used the profit code (Riffel, 2010) to fit the emission-line profiles by Gaussian or Gauss-Hemite profiles (e.g. Schönell et al., 2019). The ifscube code is more suitable for this work as it perform the fits of the emission-lines in each band simultaneously and allow the inclusion of more than one Gaussian component or Gauss-Hermite series. The underlying continuum is represented by a third order polynomial function. Initial guesses for the centroid velocity and velocity dispersion of each component are provided to the code as obtained from the fit of the nuclear spaxel using the iraf.splot task. These guesses are used by the code to model the nuclear spaxel and then it performs the fitting of the neighboring spaxles following a spiral loop and using the parameters from spaxels located at distances smaller than 0.25 arcsec from the fitted spaxel. Although we allow up to three Gaussian components to fit each line profile, if fewer components are able to properly reproduce the observed profile, the code fits only the number of components necessary to reproduce the observed profile, by setting the amplitudes of the unnecessary Gaussian functions as zero. Three galaxies of our sample (NGC 3227, NGC 3516, and NGC 5506) host type 1 AGN. To fit the Pa and Br line profiles of these galaxies, we included an additional Gaussian to account for the Broad Line Region (BLR) emission. In Figure 1 we show examples of the fits of the [Fe ii]m (left) and Hm (right) profiles for NGC 788, NGC 3227 and NGC 5506.
We integrate the fluxes in the modeled spectra within a spectral window of 1500 km s-1 width centred at each emission line, after the subtraction of the contribution of the continuum emission. This procedure produces flux distributions very similar to those obtained from direct integration of the observed line profiles, but the modeled spectra is less sensitive to spurious features and thus the resulting flux maps from the modeled spectra are less affected by them. For the type 1 AGN, the BLR components are subtracted from the observed spectra before the computation of the fluxes of the narrow components.
3 Results
3.1 Emission-line flux distributions
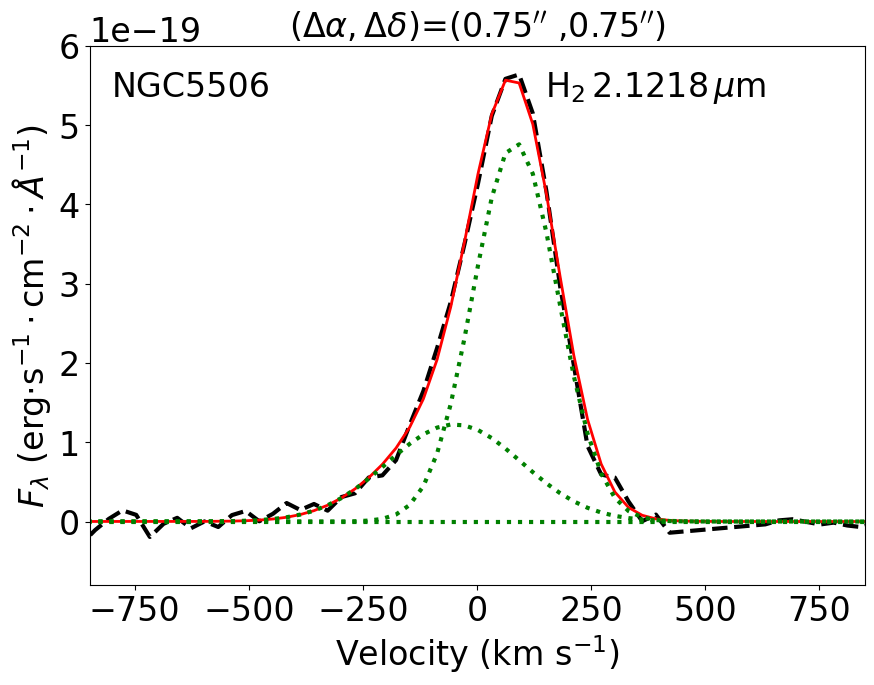
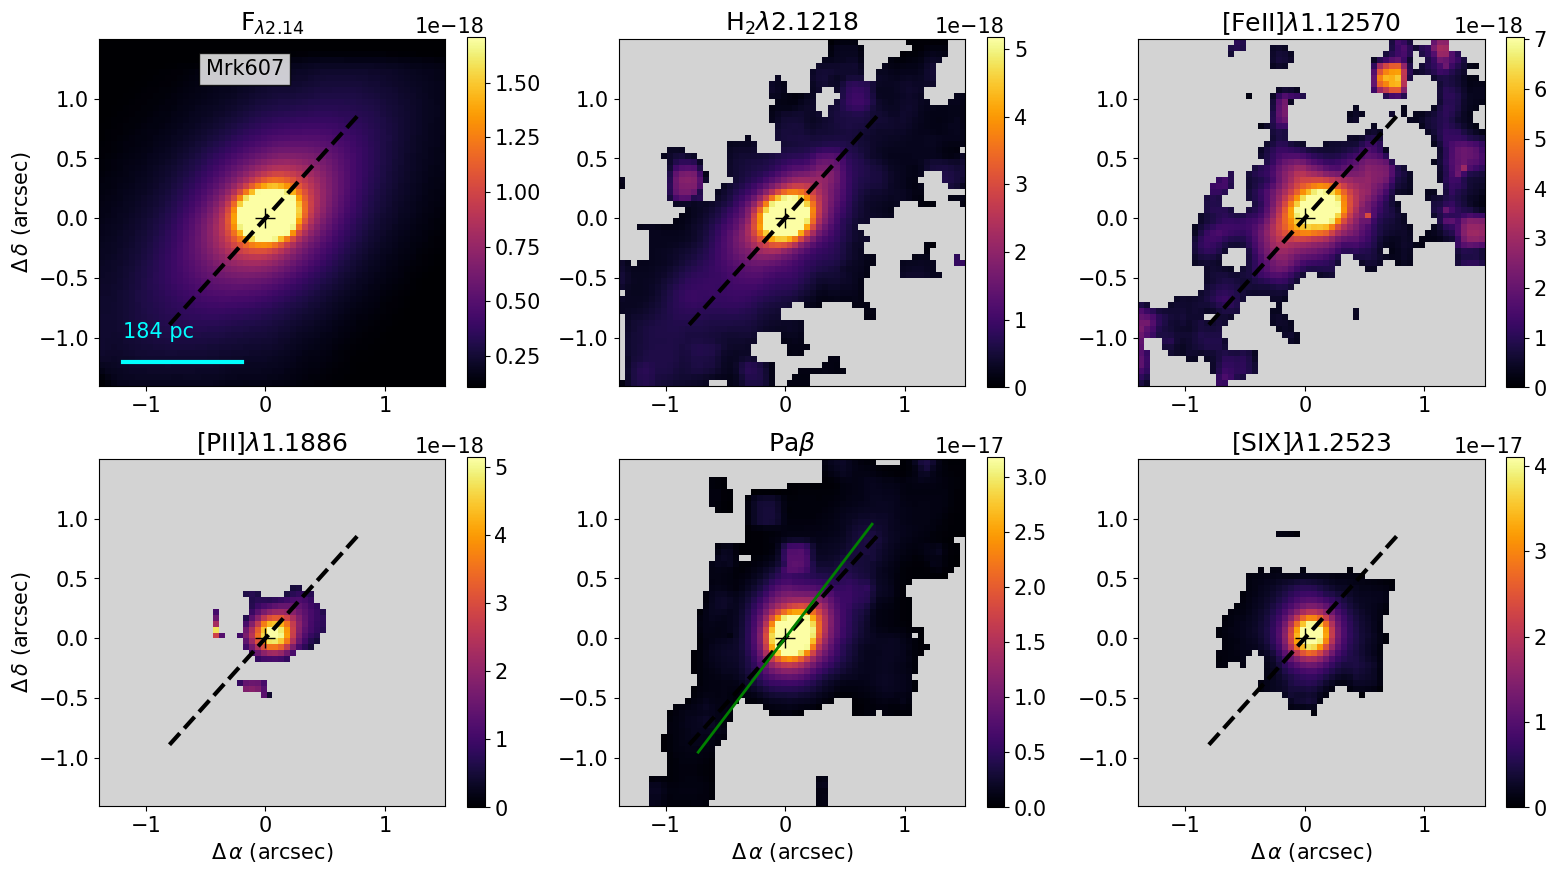
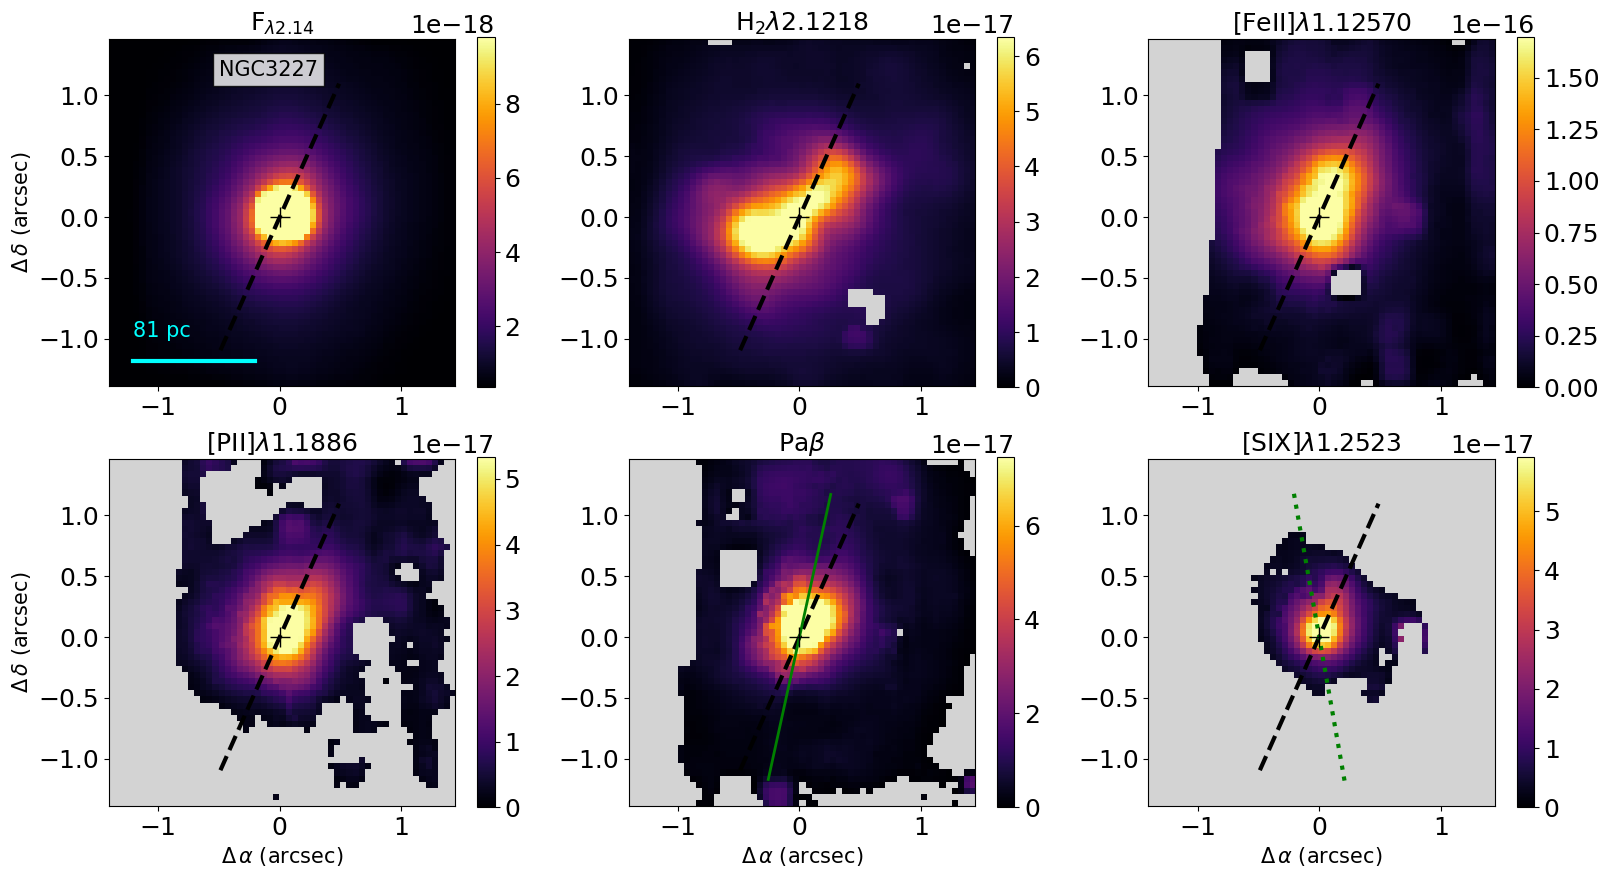
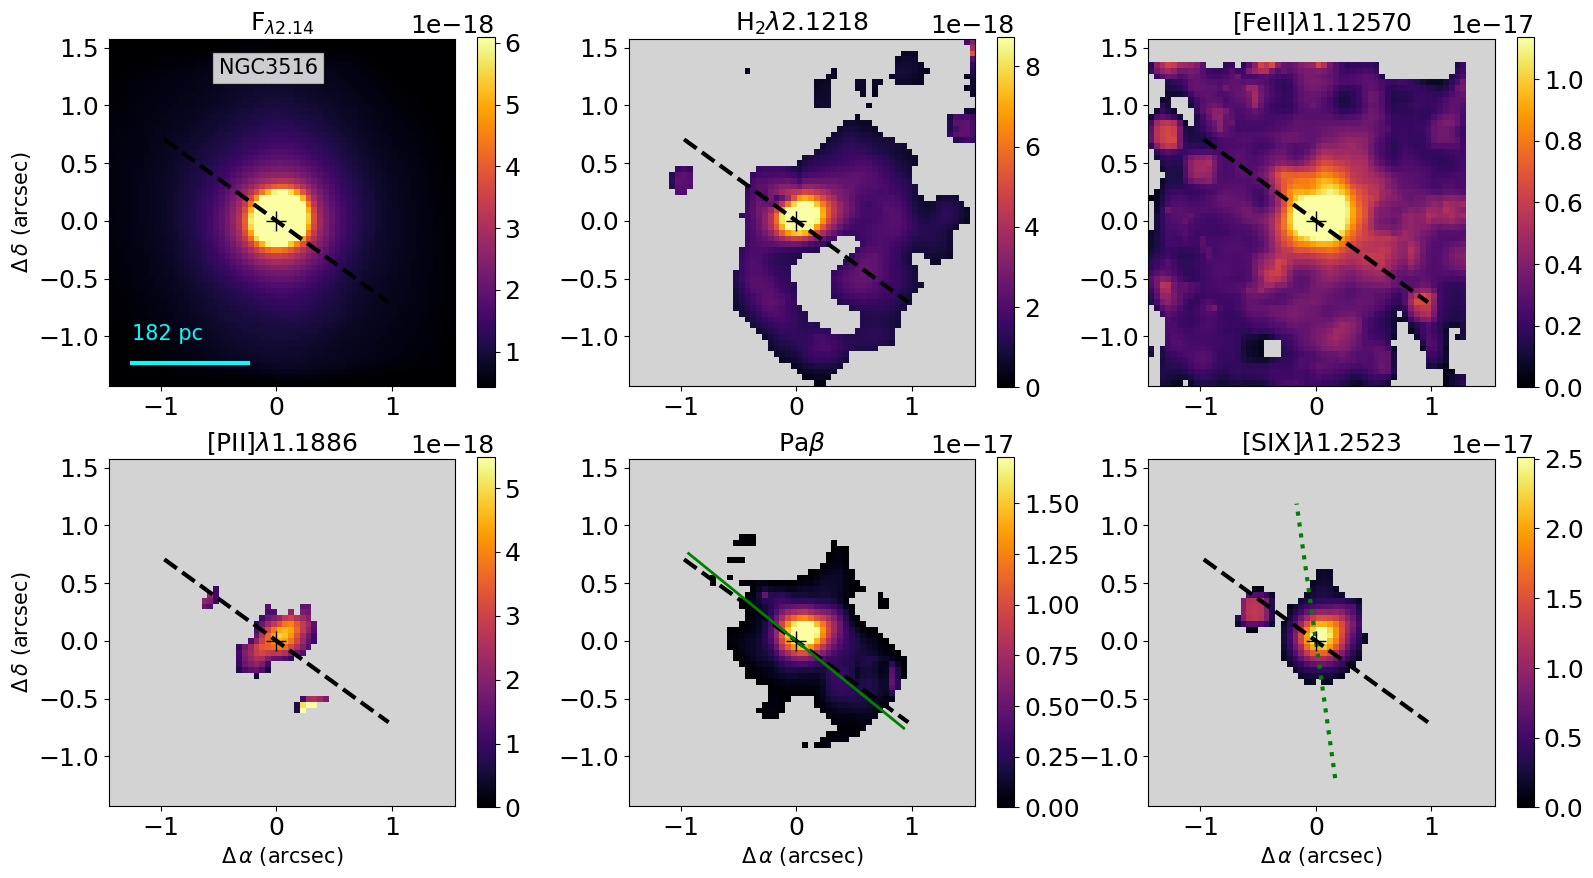
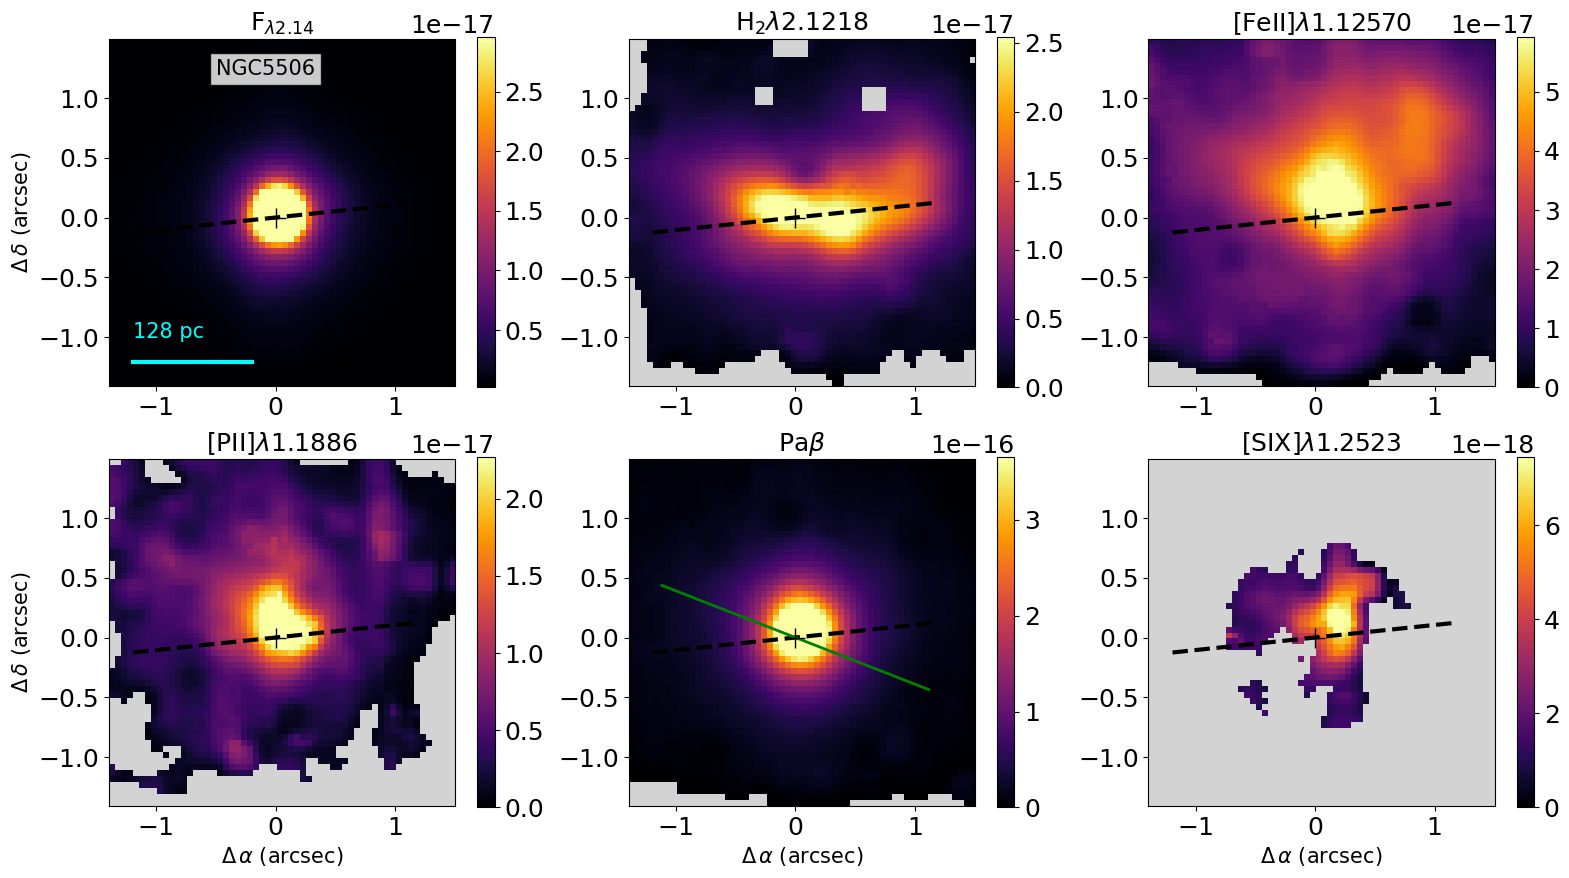
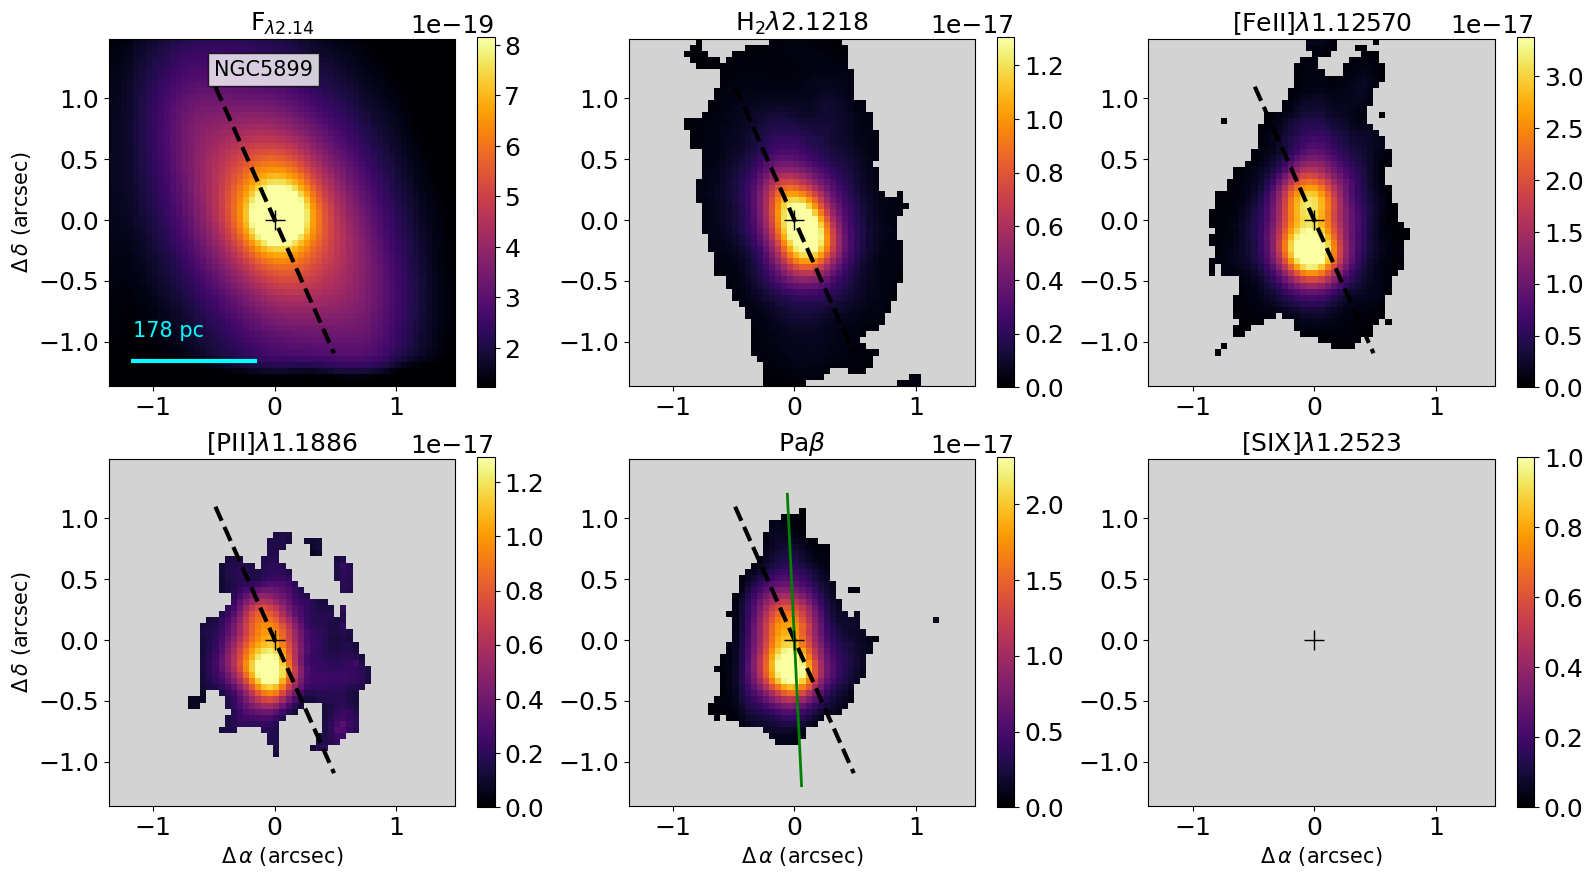
The first and second rows of Figures 2 – 7 present the K-band continuum image, H2 2.1218 m, [Fe ii]1.2570 m, [P ii]1.1886 m, Pa and [S ix]1.2523 m emission-line flux distributions of the galaxies of our sample. Although the H2, [Fe ii] and Pa flux distributions were already shown in Schönell et al. (2019), the measurement method is distinct here, and the figures allow a comparison among the distinct emission line flux distribution for the different galaxies. In all maps, gray regions correspond to masked locations where the line is not detected at 3 level of the continuum noise. The dashed lines overlaid to all maps correspond to the orientation of line of nodes of the galaxy, as derived from the fitting of the stellar velocity fields by Riffel et al. (2017). The green continuous line shown in the Pa map shows the orientation of the most collimated Pa emission (which can be used as an indicator of the AGN ionisation axis), computed using the cv2.moments python package. We performed Monte Carlo simulations with 100 iterations each, by adding random noise with amplitude of the 20th percentile flux value of the corresponding Pa map and use the average value of the position angle of all simulations.
As already noticed by Schönell et al. (2019), distinct flux distributions are observed for the molecular and low ionised gas emission lines in most galaxies. The only exception is Mrk 607, for which both molecular and low ionisation gas emission is observed mainly along the galaxy’s major axis. We detect the [S ix]1.2523 m emission in five galaxies of our sample. The [S ix] flux distribution extends to distances 100 pc from the nucleus for NGC 788, Mrk 607, NGC 3227 and NGC 5506, is marginally resolved for NGC 3516 and is not detected in individual spaxels for NGC 5899.
3.2 Emission-line ratio diagnostic diagrams
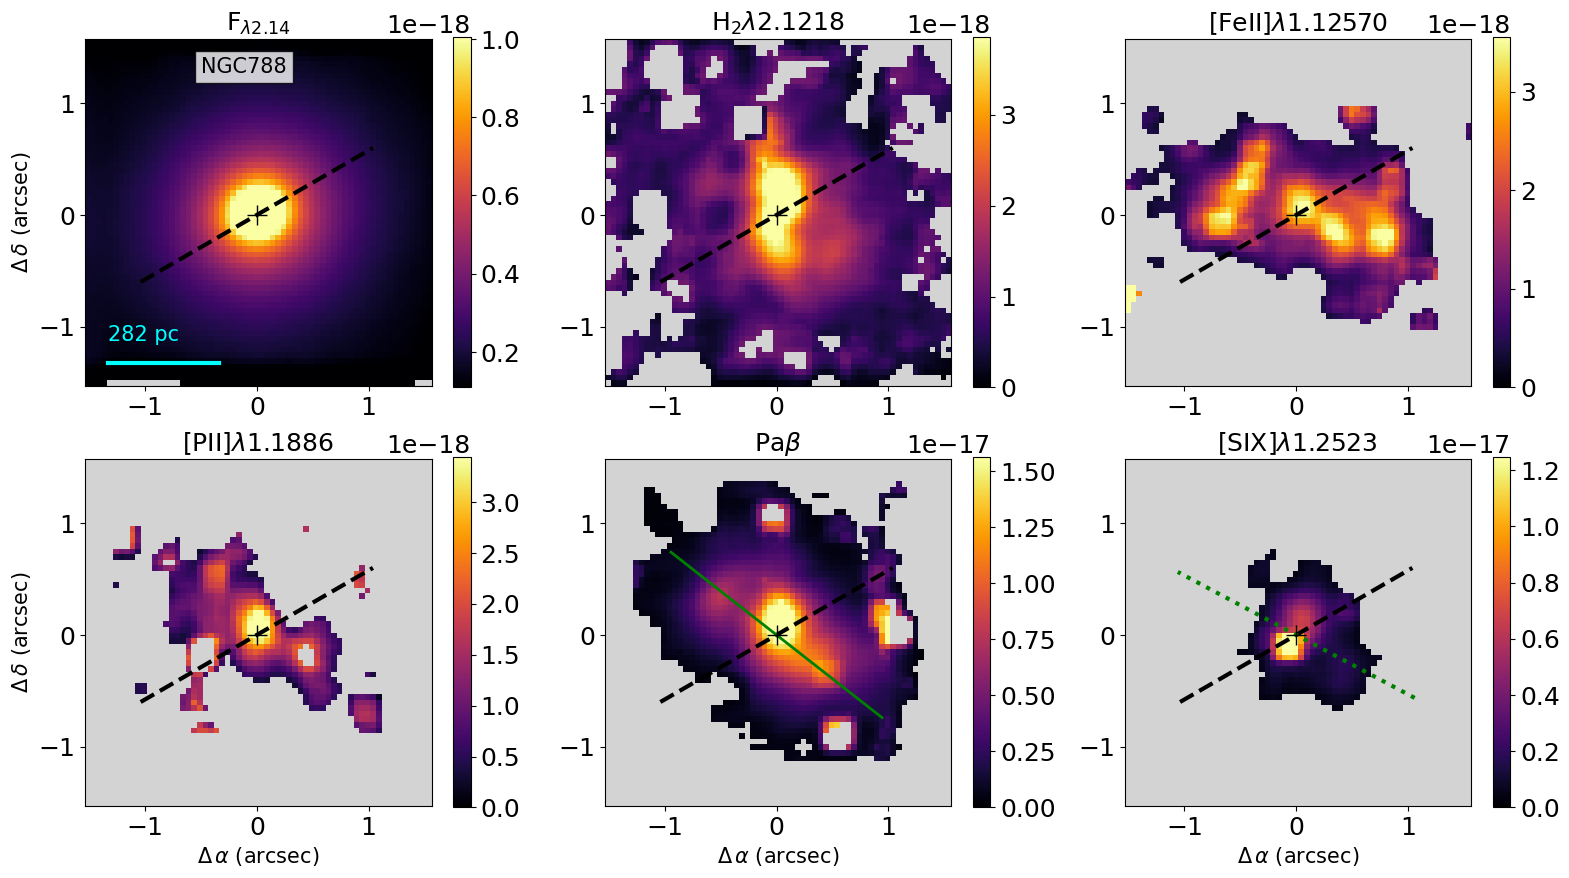
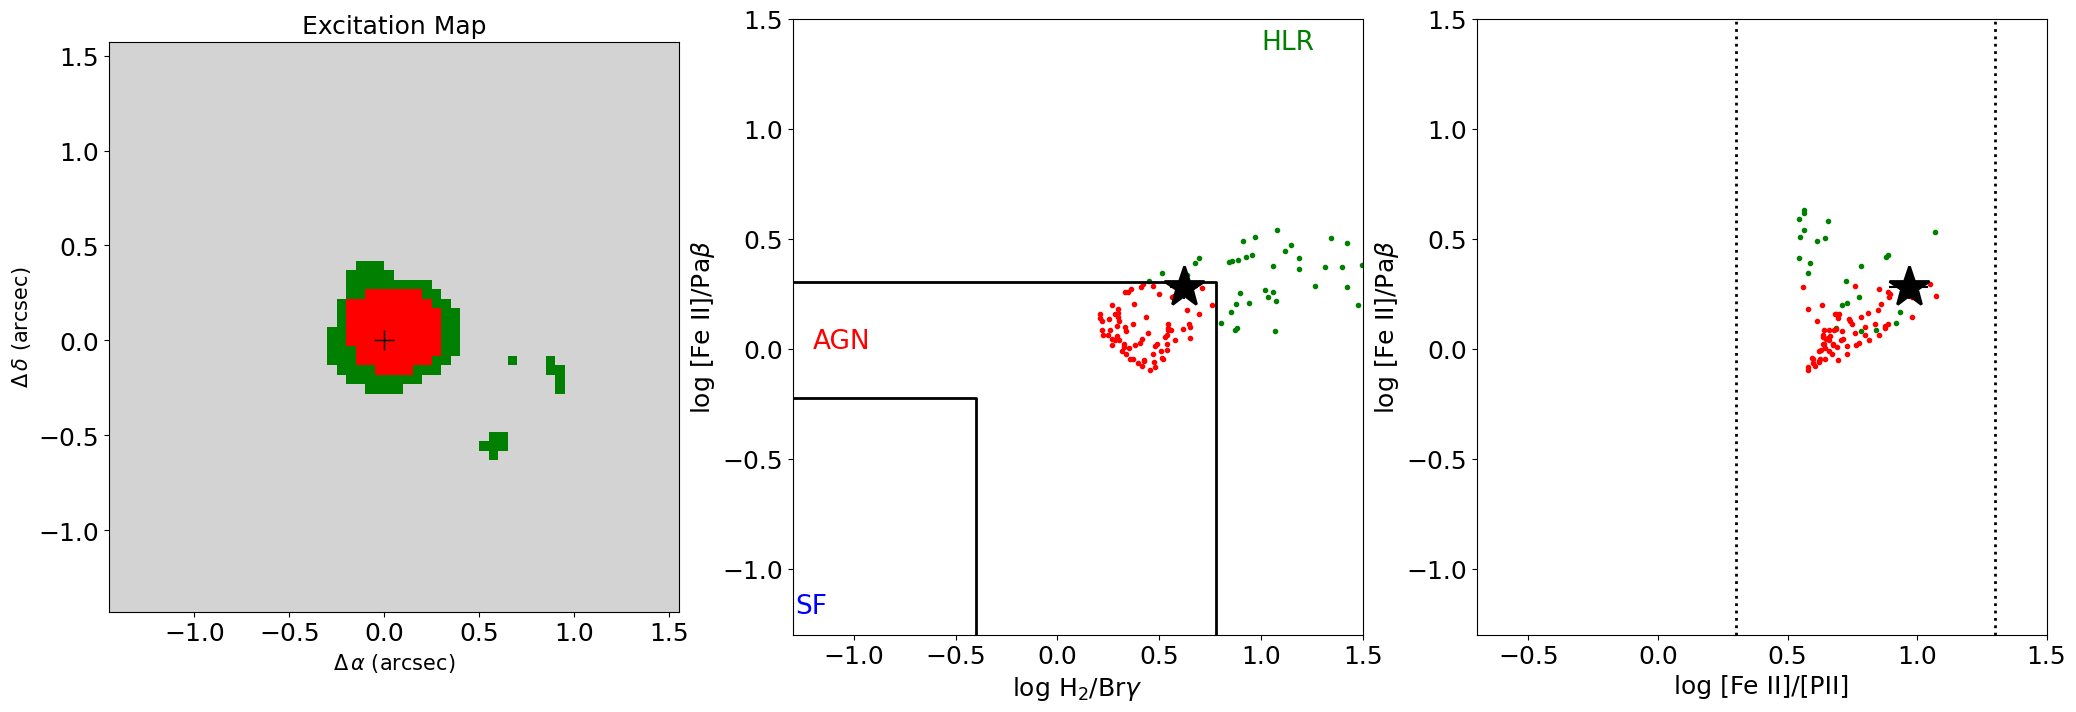
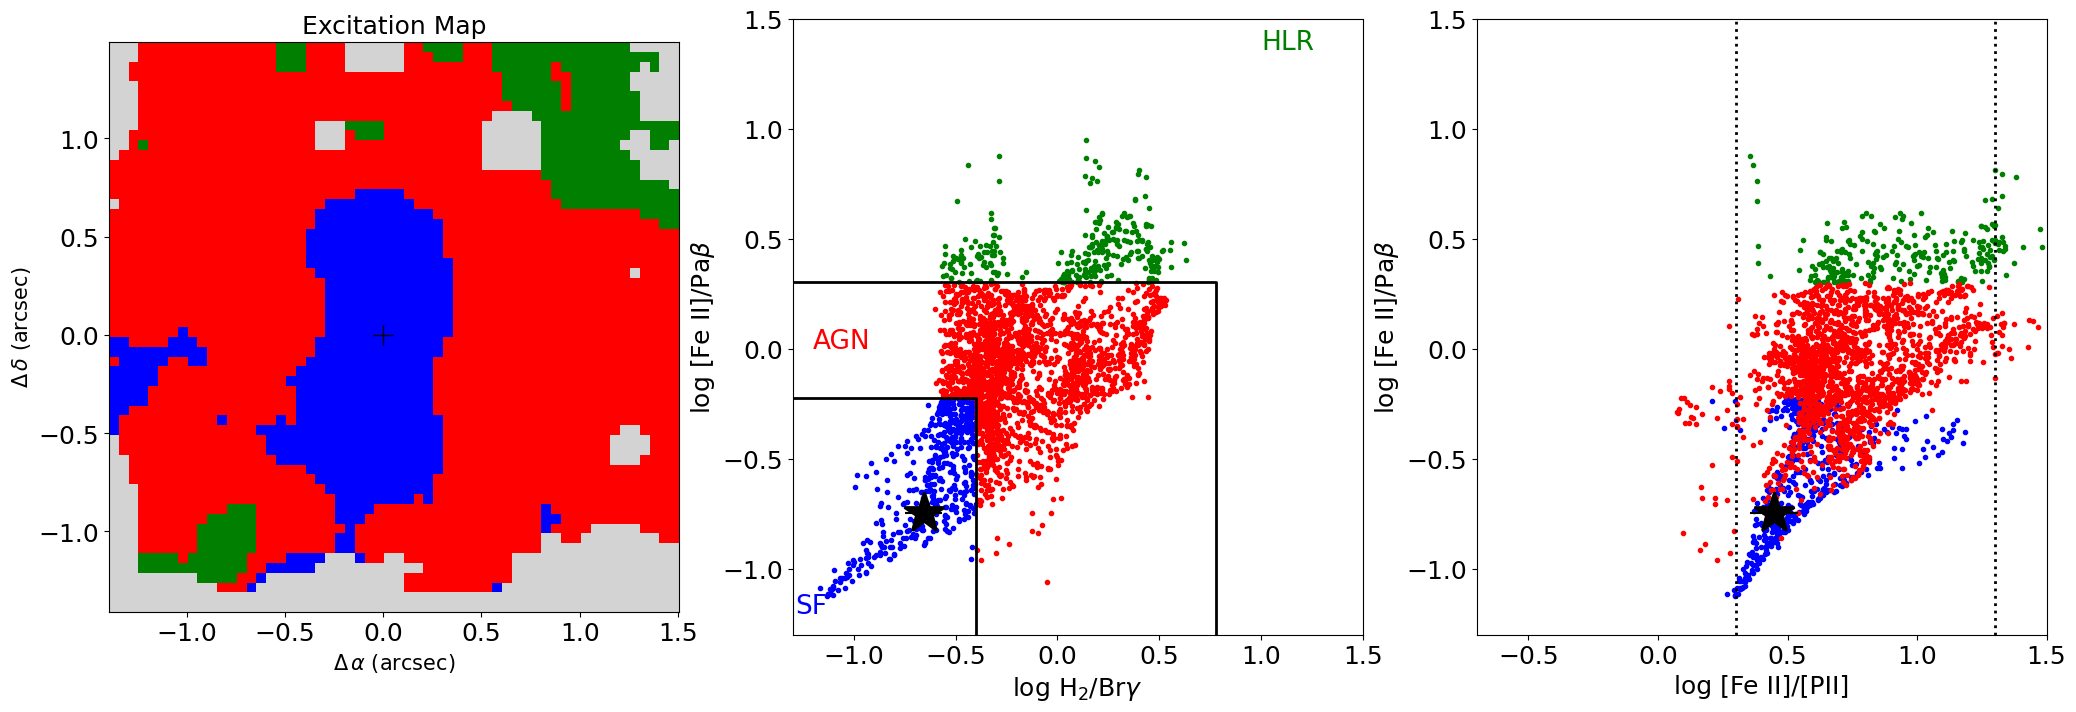
A way to investigate the excitation mechanisms of the near-IR emission lines is by constructing line-ratio diagrams (e.g Reunanen et al., 2002; Rodríguez-Ardila et al., 2004; Rodríguez-Ardila et al., 2005; Riffel et al., 2013a; Riffel et al., 2020b). The [Fe ii]1.2570 m/Pa vs. H2 2.1218 m/Br is the most commonly used diagram for this purpose. We present this diagram for the individual spaxels of the galaxies of our sample in the third row of Figures 2 – 7. The continuous lines show the empirical limits that separate Star Forming (SF) galaxies, AGN and high line ratio (HLR) objects as defined by Riffel et al. (2013a) using the nuclear spectra of a large sample of galaxies. The HLR region corresponds to the highest values of [Fe ii]1.2570 m/Pa and H2 2.1218 m/Br line ratios, occupied by Transition Objects, LINERs and Supernovae Remnants. The H2 flux maps show also emission from locations where no ionized gas emission is seen the H2 emission is likely produced by shocks due to the interaction of a wide opening angle wind with the dense gas (e.g. Zakamska & Greene, 2014; Riffel et al., 2020b) or by X-rays from the central AGN escaping through the dusty torus. The former is in agreement with shock models used to describe the H2 molecule formation from luminous galaxies (Guillard et al., 2009). For the latter one would expect the regions with H2 emission and no ionized gas emission being located mainly perpendicular to the AGN ionization axis, which is not supported by the flux distributions in our sample. Similarly, there is [Fe ii] emission in regions outside the AGN ionization cones, likely tracing the photodissosiation regions at the cone edges.
Colina et al. (2015) presented a detailed analysis of the two-dimensional gas excitation in a sample of LIRGs and Seyfert nuclei using IFS spectroscopy and defined new areas in the near-IR diagnostic diagram for AGN, SF, and supernovae explosions. They used the [Fe ii]1.6440 m/Br and H2 2.1218 m/Br line ratios, which can be converted to the ratios used in this work. Colina et al. (2015) used a similar range of values for the H2 2.1218 m/Br to define the AGN region as that used in Riffel et al. (2013a), but their results indicate a larger upper limit of the [Fe ii]1.2570 m/Pa (of 7, obtained using the relation [Fe ii]1.6440 m/Br[Fe ii]1.2570 m/Pa presented in their work). The sample of Seyfert galaxies used in Colina et al. (2015) is composed of only 5 objects and all of them present outflows that can produce shocks (Riffel et al., 2006a; Riffel & Storchi-Bergmann, 2011a, b; Riffel et al., 2013b; Storchi-Bergmann et al., 2010; May et al., 2018, 2020), and thus, a contribution of shocks to the [Fe ii] excitation cannot be ruled out. Thus, we used the separating lines from Riffel et al. (2013a), that even if they are based on single aperture spectra, these authors used a larger sample, composed of 67 galaxies.
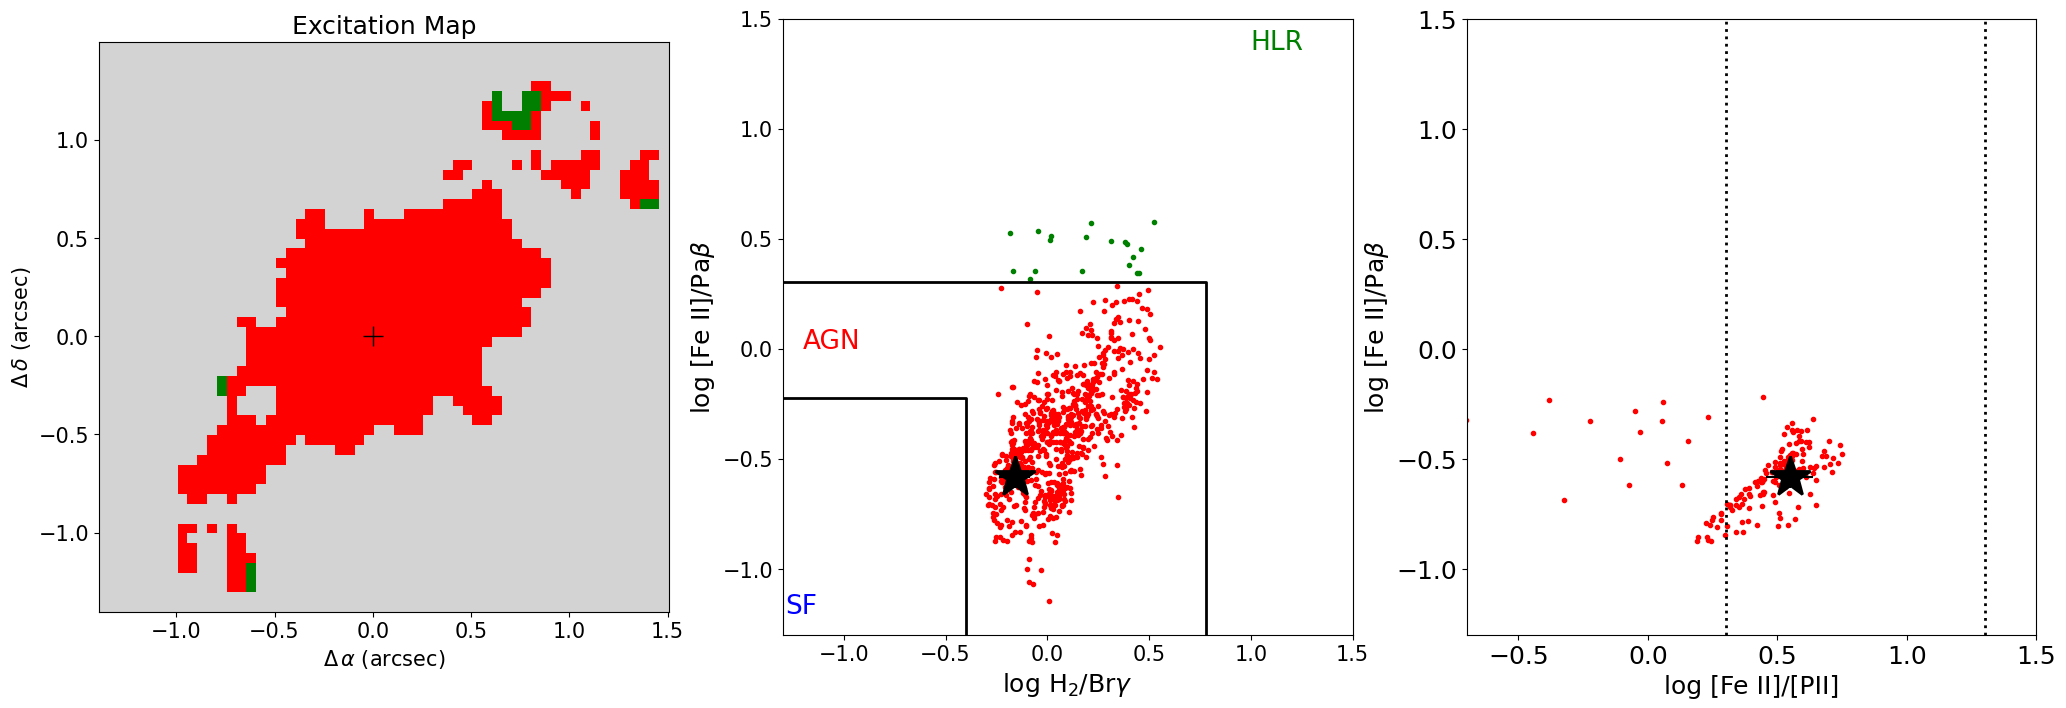
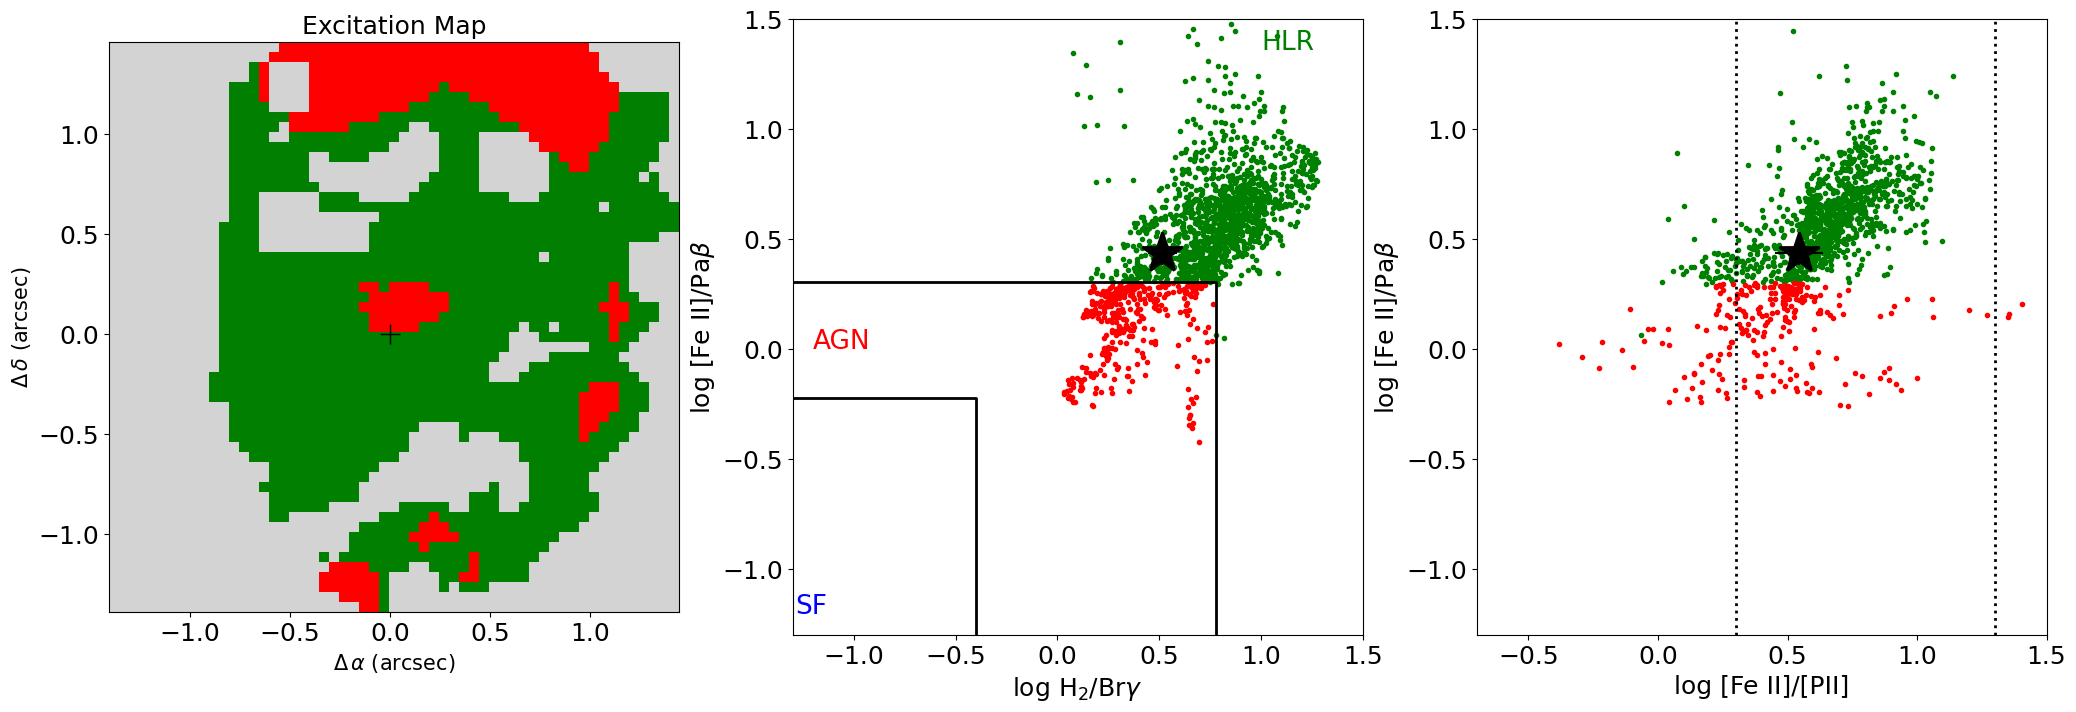
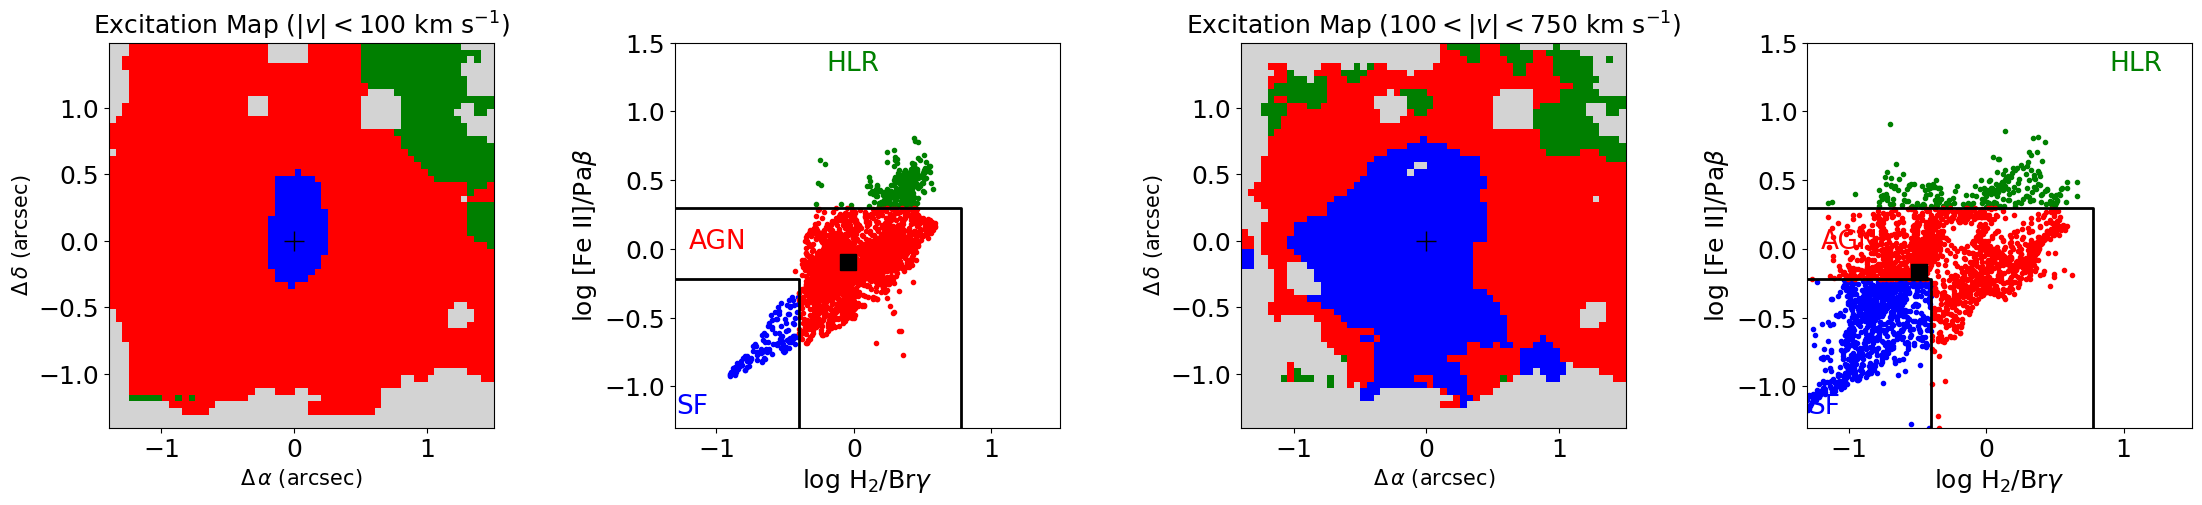
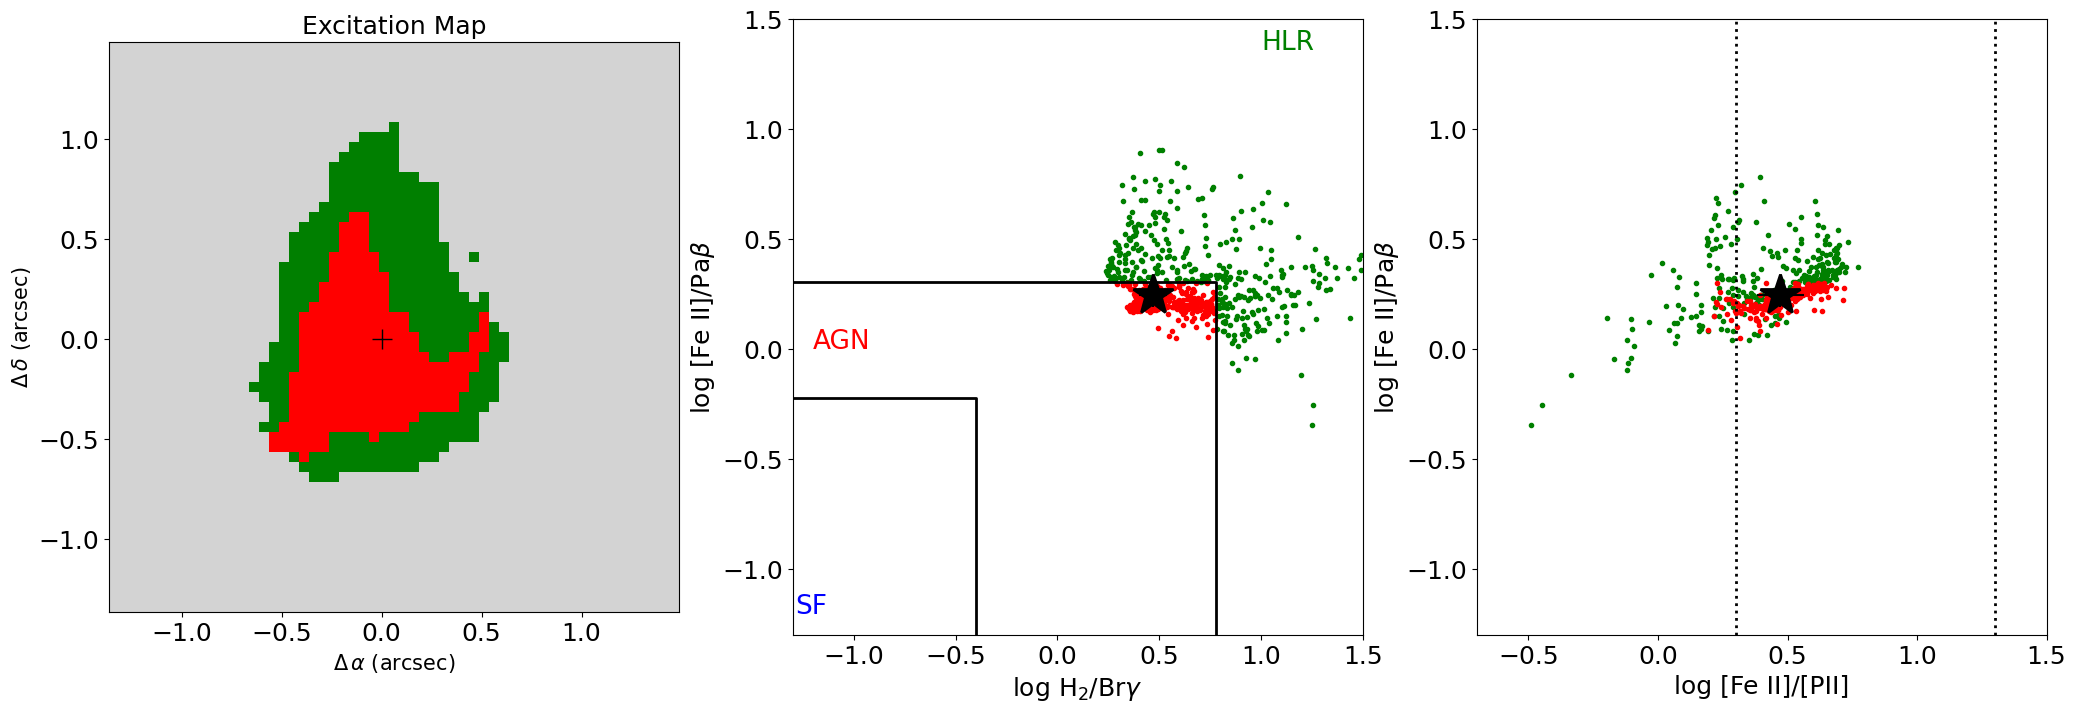
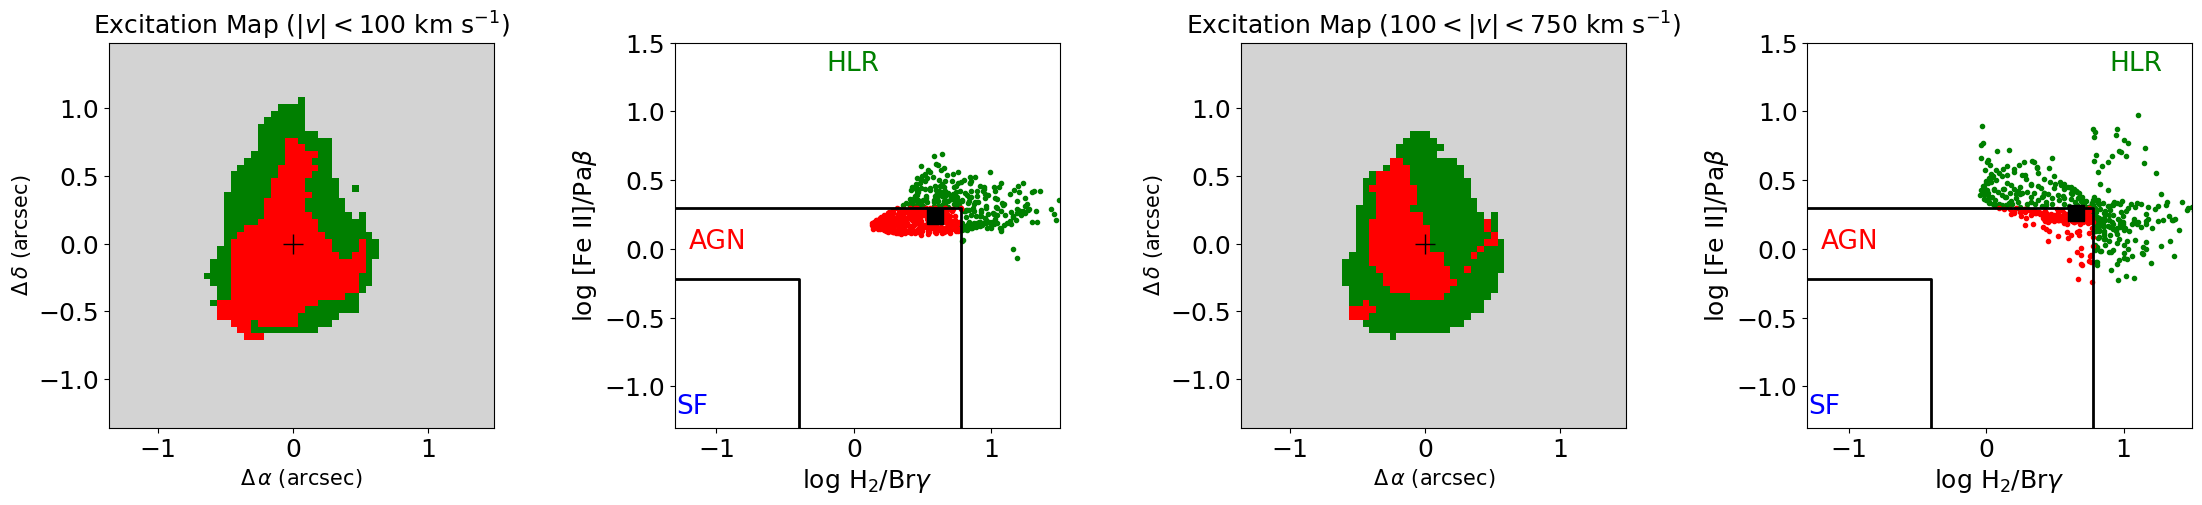
The left panels in the third row of Figs. 2 – 7 show the colour coded excitation maps, where SF dominated spaxels are shown in blue, AGN dominated are in red and spaxels with line ratios in the HLR region are in green. All galaxies, but NGC 5506, show nuclear line ratios typical of AGN. NGC 788, Mrk 607 and NGC 3516 show line ratios in the AGN region of the diagnostic diagram in all locations, but the Br emission line is detected only at the centre in the latter. HLRs are seen in some locations for NGC 3227, NGC 5506 and NGC 5899. The only galaxy for which we found SF line ratios is NGC 5506, observed in the innermost region around the nucleus.
Another line ratio useful to investigate the role of shocks in the excitation of the [Fe ii] is the [Fe ii]1.2570 m/[P ii]1.1886 m. This line ratio increases if shocks release the iron from dust grains reaching values of 20 in supernovae remnants, while values of 2 are seen in photoionised gas (Oliva et al., 2001; Storchi-Bergmann et al., 2009). Schönell et al. (2019) presented the [Fe ii]/[P ii] ratio maps for our sample and here we present a plot of [Fe ii]/Pa vs. [Fe ii]/[P ii] for the galaxy spaxels of our sample in the right panels of the third row of Figs. 2 – 7. The colour coding is the same as for the [Fe ii]/Pa vs. H2/Br diagram. The dotted vertical lines in these panels represent the limits of ratios in photoionised objects and in shock dominated objects – [Fe ii]/[P ii] and 20, respectively (Oliva et al., 2001; Storchi-Bergmann et al., 2009) – see also Riffel et al. (2019). All galaxies show ratios larger than 2, with the highest values corresponding to the HLR regions in the excitation maps shown in the bottom-left panels of Figs. 2 – 7.
Table 1 presents the emission-line ratios, measured within two distinct apertures: (i) within the 100 pc radius and (ii) within 0.5 arcsec radius. The first aperture allows the comparison of the line ratios observed in distinct galaxies at the same physical scale, while the latter is useful to investigate the nuclear line emission.
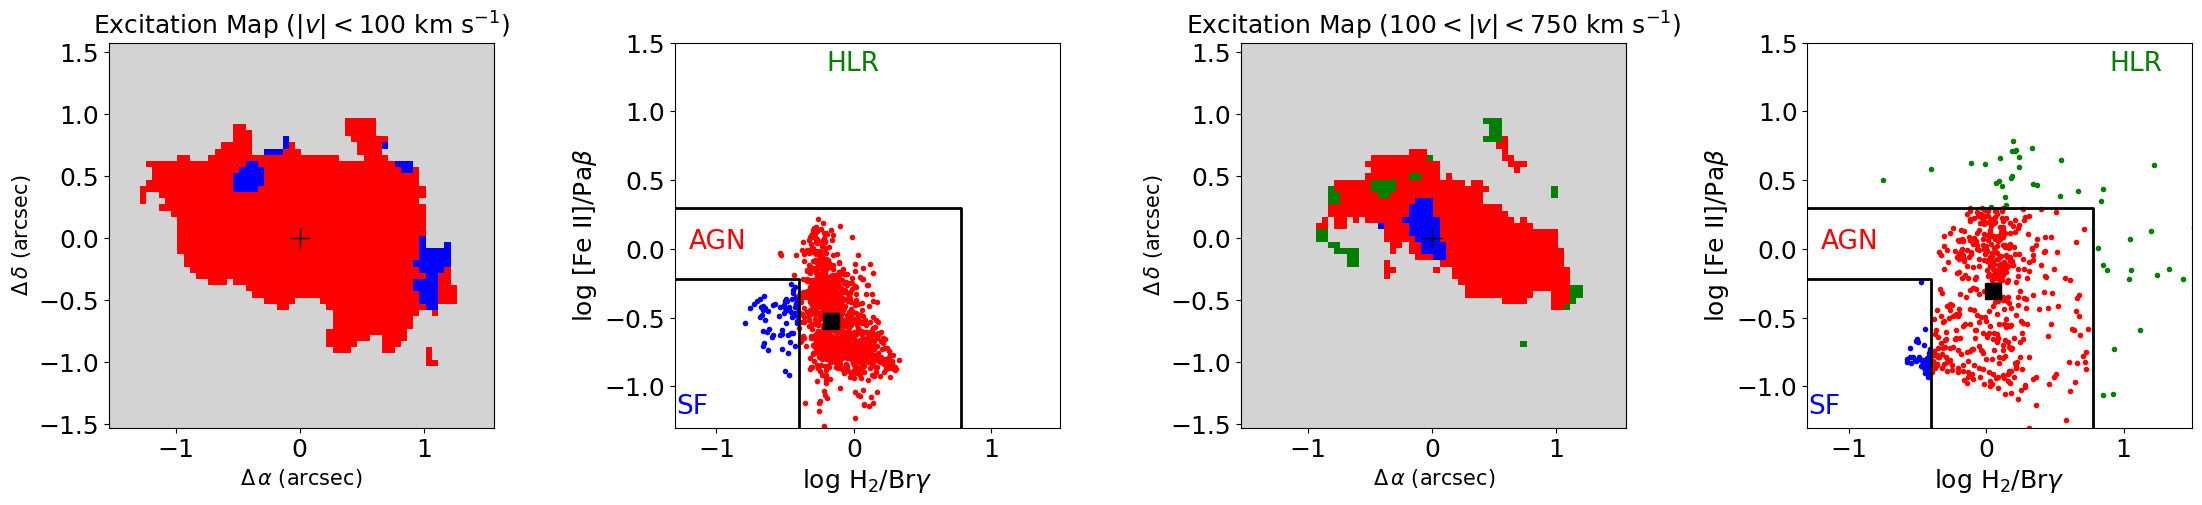
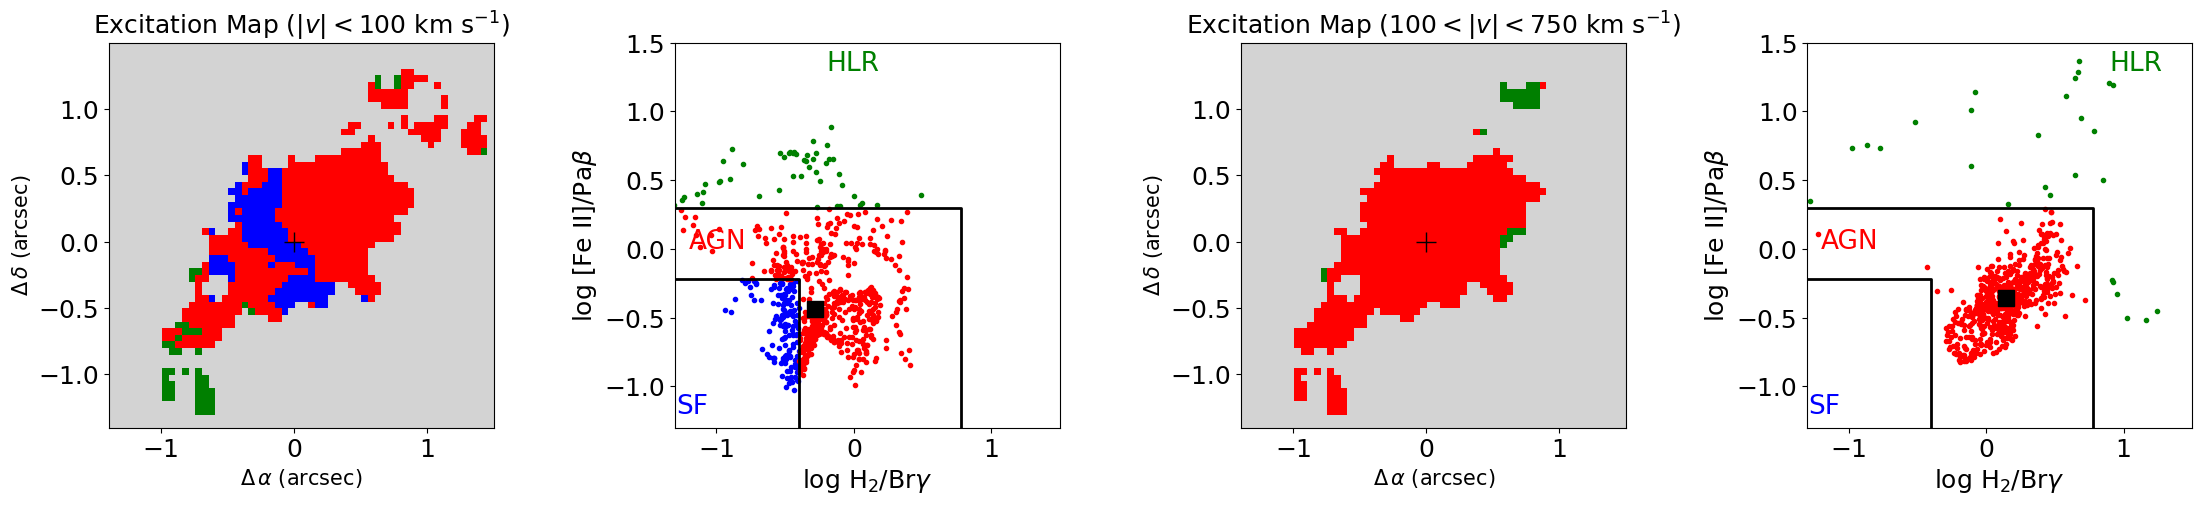
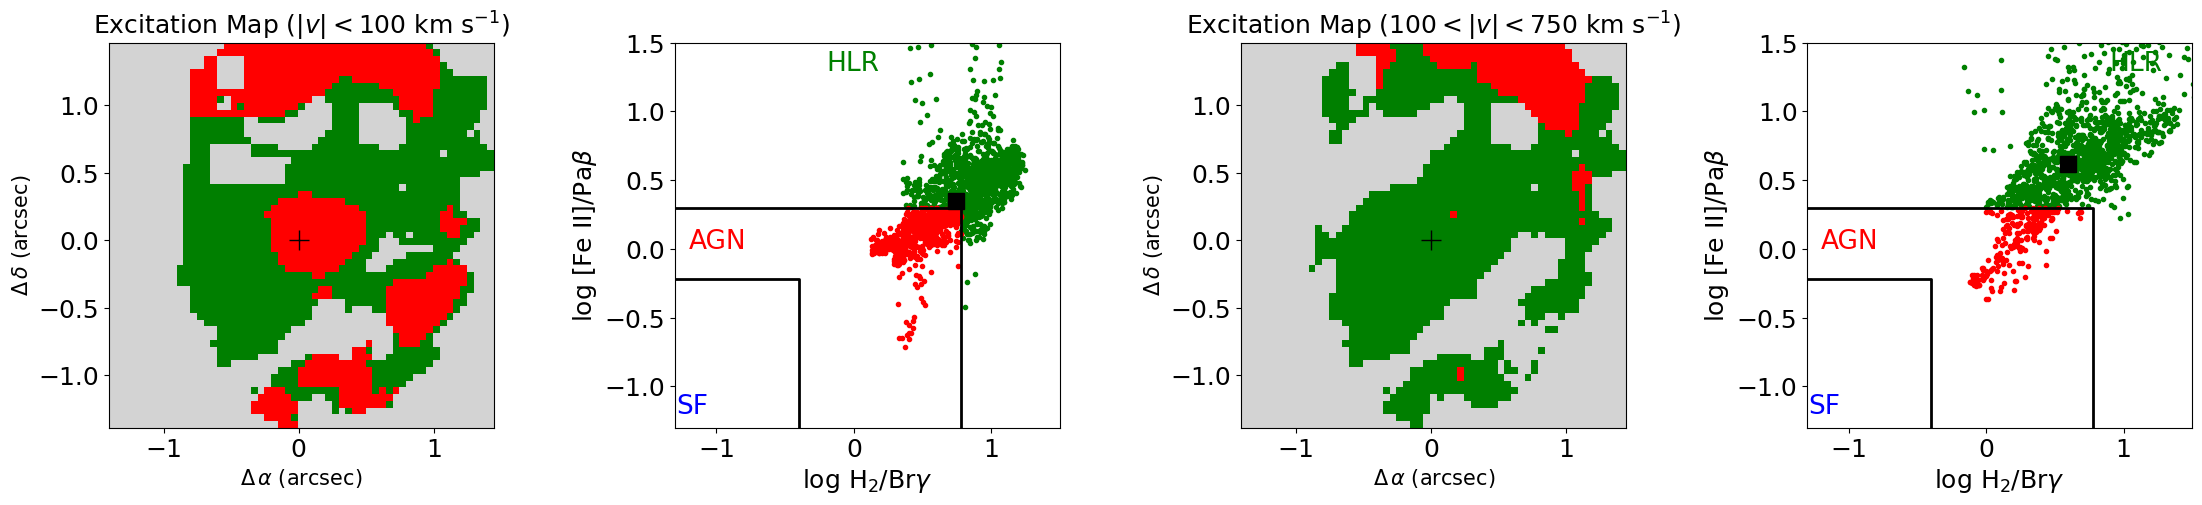
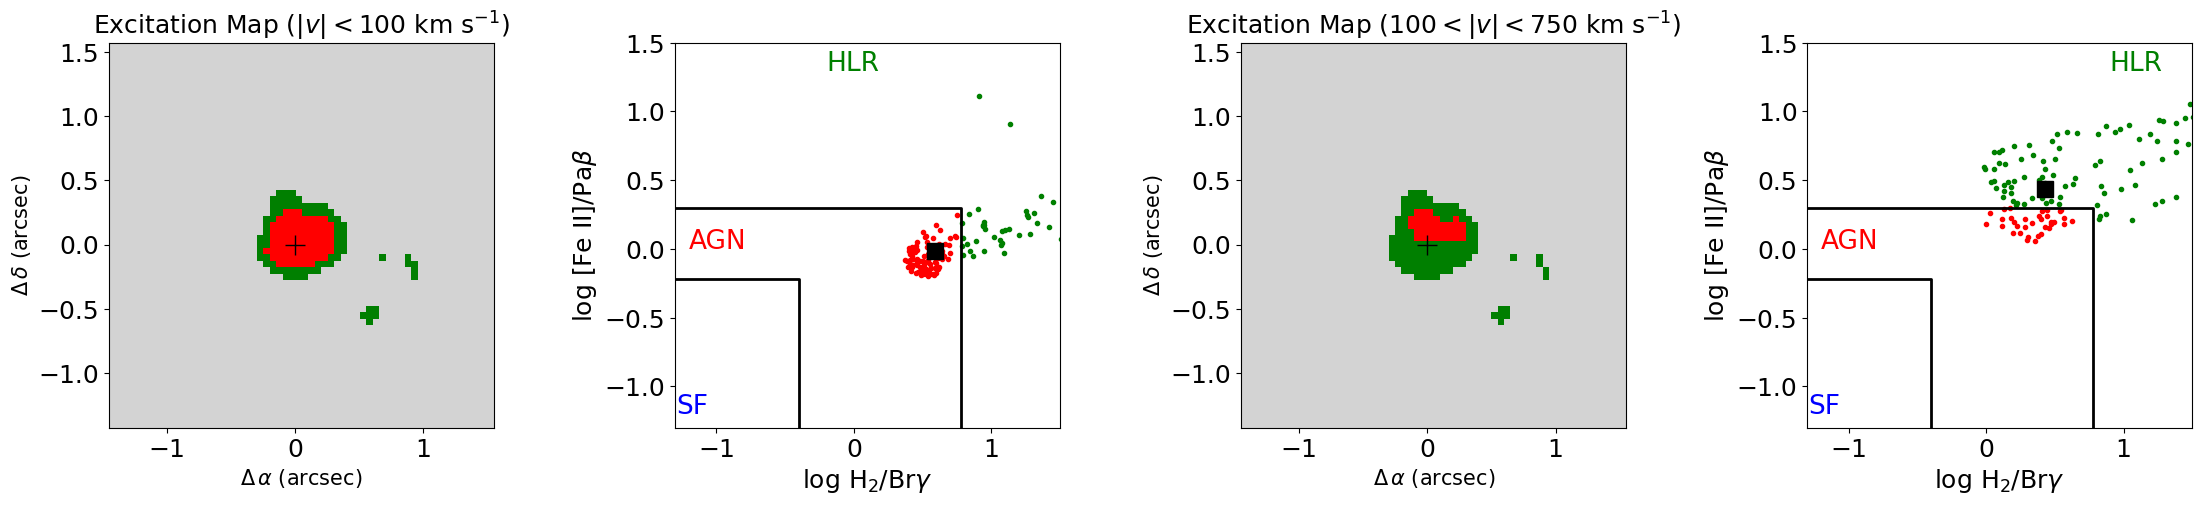
The bottom row of Figs. 2 – 7 show the excitation maps and diagnostic diagrams for each galaxy, constructed using the line fluxes integrated within two velocity ranges: (i) the low velocity range and (ii) the high velocity range . The velocity range in each spaxel is measured relative to the velocity of the peak of the corresponding line profile. The high velocity range is more sensitive to shock excitation, as observed in optical emission lines (e.g. Ho et al., 2014; D’Agostino et al., 2019b; Riffel et al., 2020a). We exclude from these diagrams spaxels where the emission lines are not detected at a 3 continuum level.
| aperture of 100 pc radius | aperture of 0.5 arcsec radius | |||||||
|---|---|---|---|---|---|---|---|---|
| Galaxy | [Fe ii]/Pa | [Fe ii]/[P ii] | [S ix]/Pa | H2/Br | [Fe ii]/Pa | [Fe ii]/[P ii] | [S ix]/Pa | H2/Br |
| NGC788 | 0.180.05 | 1.150.55 | 0.390.16 | 0.710.25 | 0.230.03 | 1.410.33 | 0.320.07 | 0.810.14 |
| Mrk607 | 0.260.03 | 2.980.57 | 0.750.13 | 0.700.11 | 0.260.03 | 3.530.82 | 0.760.17 | 0.690.13 |
| NGC3227 | 3.440.05 | 5.120.15 | 0.660.11 | 5.120.27 | 2.710.35 | 3.50.82 | 0.420.09 | 1.440.25 |
| NGC3516 | 1.700.24 | 8.501.98 | 1.230.25 | 4.400.64 | 1.90.24 | 9.281.79 | 1.260.22 | 4.190.73 |
| NGC5506 | 0.250.05 | 3.460.32 | 0.0110.002 | 0.280.05 | 0.180.02 | 2.810.66 | 0.0110.004 | 0.220.05 |
| NGC5899 | 1.720.18 | 3.070.59 | 0.0010.001 | 3.030.25 | 1.750.23 | 2.970.69 | 0.0010.001 | 2.940.51 |
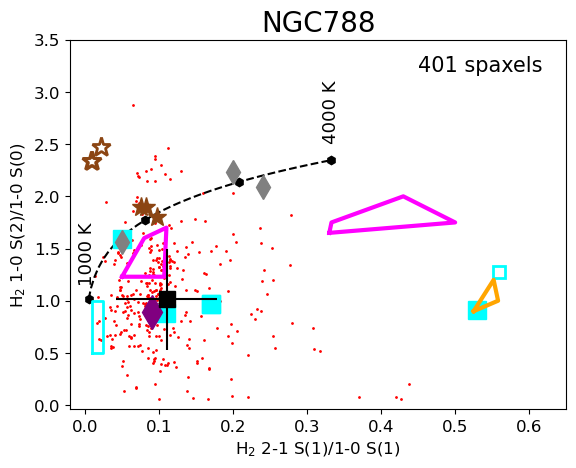

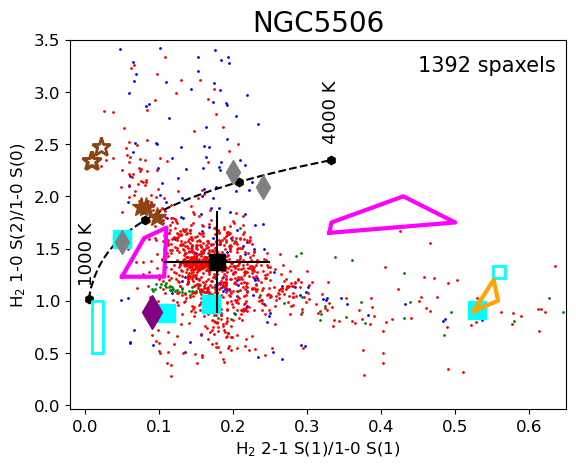
The H2 2-1 S(1)m/1-0 S(1)m vs. 1-0 S(2)m/1-0 S(0)m diagram is useful to investigate the origin of the H2 emission. The spectral range for Mrk 607 and NGC 5899 does not include the Hm emission line and these lines are not detected in our data of NGC 3516. Thus, we construct the H2 diagnostic diagrams only for NGC 788, NGC 3227 and NGC 5506 and present them in Figure 8. The colours of the points are defined as in Figs. 2 – 7 and we show also in the figure the predictions of distinct models. Most points in the diagrams for the three galaxies are away from the region predicted by the non-thermal UV excitation models of Black & van Dishoeck (1987) (identified by the orange polygon), indicating that the H2 emission originates in thermal processes.
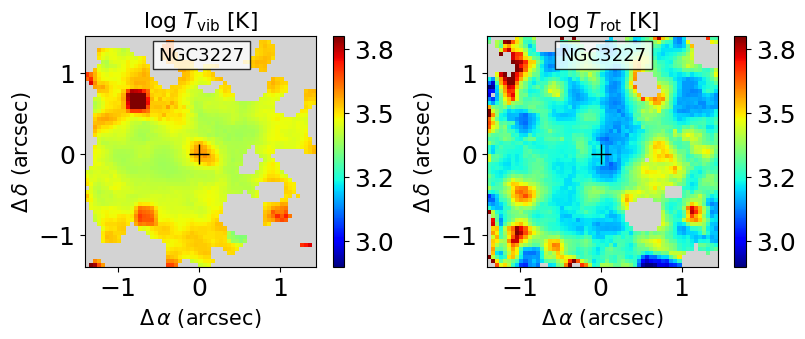
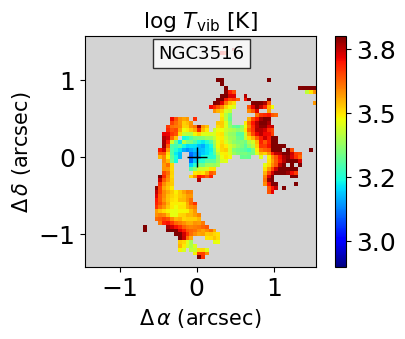
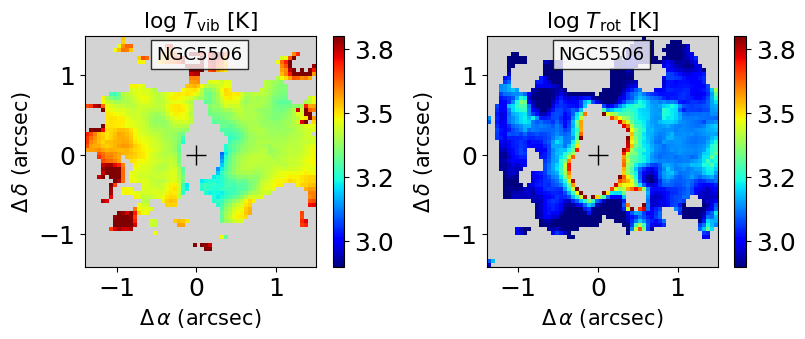
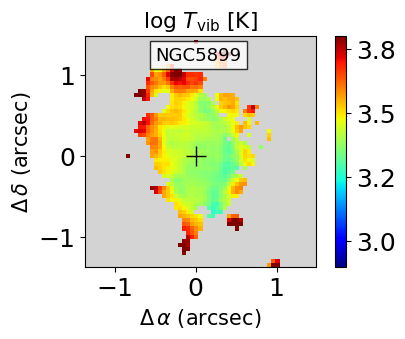
3.3 Molecular hydrogen temperatures
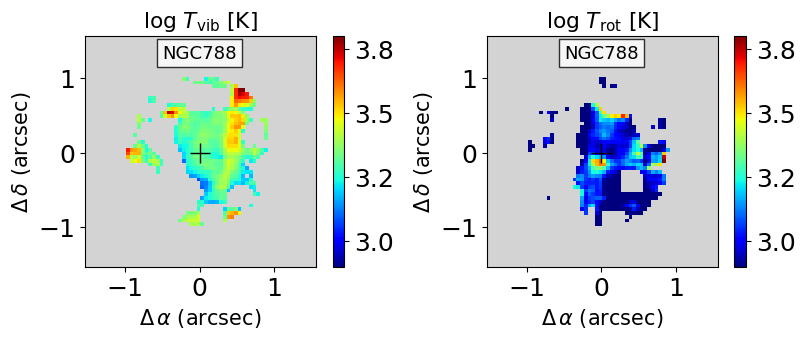
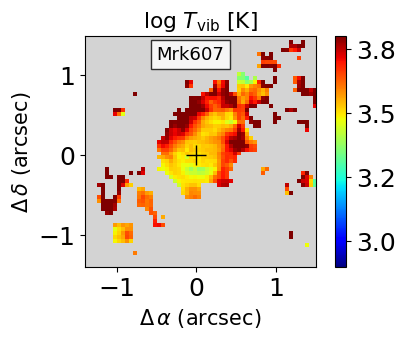
Figure 9 presents the vibrational () and rotational () temperature distributions of the H2 gas. These temperatures are obtained using the fluxes of the H2 lines according to
| (1) |
and
| (2) |
respectively (Reunanen et al., 2002) and the Einstein coefficients are taken from Turner et al. (1977). As mentioned above, for Mrk 607 and NGC 5899 the spectral range does not include the Hm emission line and thus we do not estimate the H2 rotational temperatures for these galaxies. Although the spectral region of the NGC 3516 data includes the Hm emission line, the signal-to-noise ratios in both lines used to derive the rotational temperature are not high enough to obtain , so we also present only the vibrational temperature map for this galaxy. The gray regions in the maps of Fig. 9 correspond to locations where one or both emission lines used to calculate the corresponding temperature are not detected with, at least, 2 above the noise level with respect to the adjacent continuum.
The vibrational temperatures range from 1000 to 5000 K, while the rotational temperatures range from a few hundred to 4000 K. Overall, NGC 788 shows much smaller values of than those of , while for NGC 3227 both temperature ranges are similar and for NGC 5506 is slightly smaller than . Table 2 presents temperature values estimated within circular apertures of 100 pc and 0.5 arcsec radii, centred at the nuclei of the galaxies.
| Galaxy | (K) | (K) | (K) | (K) |
|---|---|---|---|---|
| NGC788 | 2145308 | 1126963 | 2276201 | 1073339 |
| Mrk607 | 3634419 | – | 3370422 | – |
| NGC3227 | 306969 | 1745130 | 2864313 | 1723820 |
| NGC3516 | 2546213 | – | 2431228 | – |
| NGC5506 | 205572 | 1485242 | 1602102 | 1528860 |
| NGC5899 | 2438196 | – | 2525245 | – |
4 Discussion
4.1 Notes on individual objects
4.1.1 NGC 788
NGC 788 is a spiral galaxy (SA0/a?(s)) located at 56 Mpc and hosts a Sy 2 nucleus. The stellar velocity field is described by a rotation pattern, with the orientation of the line of the nodes and smaller ( km s-1) stellar velocity dispersion patches are observed at 250 pc, probably due to intermediate age stellar populations (Riffel et al., 2017). The radial profile for the ionised gas mass is more concentrated in the centre ( pc) and has a steeper distribution than that of the hot molecular gas (Riffel et al., 2018). By mapping the gas distribution, Schönell et al. (2019) show that Pa and [Fe ii]m emission are extended along the northeast–southwest direction and present higher ( km s-1) velocity amplitudes and regions of km s-1 in the same direction, interpreted as a bipolar outflow. On the other hand, the Hm presents emission in the whole NIFS FoV and low velocity dispersion ( km s-1). NGC 788 presents a compact radio emission at 3.6 cm and slightly resolved extended radio emission along the position angle at 20 cm (Nagar et al., 1999).
Our results are shown in Fig. 2. The [Fe ii]1.2570 m flux distribution is more extended along the NE-SW direction and presents several knots of enhanced emission. Similar orientations and knots of emission are also observed in Pa and [P ii]. The ionised gas emission is likely tracing the AGN ionisation structure. We find that the Pa emission is extended mostly along , which is displaced from stellar kinematic PA (; Riffel et al., 2017) by . The highest intensity levels in the H2 flux map are more extended along the N–S direction, while at lower flux levels, the H2 emission spreads over the whole NIFS FoV. The [S ix]1.2523 m is compact and slightly elongated along the AGN ionisation axis, as traced by the orientation of the Pa emission. The H2 2.1218 m/Br vs. [Fe ii]1.2570 m/Pa diagnostic diagram of NGC 788 shows all values in the AGN region, but the [Fe ii]/Pa ratio is smaller than 2.0 at most locations. The [Fe ii]/[P ii] ratio is also smaller than 2.0 at most locations. The Spearman test reveals that there is no correlation between H2/Br and [Fe ii]/Pa. The median value of the [Fe ii]/Pa for the high velocity range is larger than that of the low velocity range.
4.1.2 Mrk 607
Mrk 607 is an edge-on spiral galaxy () classified as Sa?, hosts a Seyfert 2 nucleus and is located at Mpc (Véron-Cetty & Véron, 2006). Hubble Space Telescope (HST) observations show that the [Oiii] emission is well aligned to the galaxy’s major axis (), being more extended along the north-east side (Ferruit et al., 2000; Schmitt et al., 2003). Patches of low stellar velocity dispersion produced by young to intermediate age stellar populations are observed at distances of 200 pc from the centre (Riffel et al., 2017). Optical and near-IR IFS observations show that the stellar kinematics in the inner kpc of Mrk 607 is dominated by rotation in the plane of the disc. The gas also presents a clear rotation pattern, but in the opposite direction of the stars (Freitas et al., 2018; Riffel et al., 2017; Schönell et al., 2019). In addition, equatorial ionised outflows (perpendicular to the ionization cone) are observed in the optical emission lines (Freitas et al., 2018). Radio emission is seen only from a nuclear compact source, with no evidence of a radio jet at kpc scales (Colbert et al., 1996; Nagar et al., 1999).
For Mrk 607 (Fig. 3), we find that the molecular and ionised gas emission is more extended along the orientation of line of nodes derived from the stellar velocity line of nodes (; Riffel et al., 2017). The ionised gas is more extended to the northwest side of the nucleus and we derive a orientation for the Pa emission of , consistent with the stellar kinematic PA and with the orientation of optical emission (Ferruit et al., 2000; Schmitt et al., 2003; Freitas et al., 2018). The [P ii]1.1886 m and [S ix]1.2523 m show emission only at distances smaller than 0.8 arcsec from the nucleus. As for NGC 788, the H2/Br vs. [Fe ii]/Pa diagnostic diagram shows all values in the AGN region, but a good correlation is found between both ratios. The [Fe ii]/[P ii] ratio is larger than 2.0 at most locations, reaching values of up to 7. Both the H2/Br and [Fe ii]/Pa ratios median values are larger for the high velocity range, compared to the low velocity gas. Values typical of SF galaxies are seen for the low velocity range in a narrow stripe perpendicular to the galaxy’s major axis, co-spatial with the equatorial outflows observed in ionised gas (Freitas et al., 2018).
4.1.3 NGC 3227
NGC 3227 is a spiral galaxy (SAB(s)a), located at a distance of 22 Mpc and with a Sy 1.5 nucleus (Ho et al., 1997). A full description of its NIR emission line spectrum is made in Riffel et al. (2006b). Radio continuum observations at 18 cm show two main components separated by 0.4 arcsec, offset from the optical peak and located at PA. An outflow is observed in the [Oiii]Å, but it is not aligned with the radio emission (Mundell et al., 1995). Signatures of outflows are also observed in H (Arribas & Mediavilla, 1994) and in H2 1-0S(1) in the central arcsec (Davies et al., 2014). Schinnerer et al. (2000) detected an asymmetric nuclear ring of cold molecular gas with 3 arcsec diameter, which is co-spatial with regions of high [Fe ii]/Pa (of up to 4) and H2/Br (up to 10) values (Schönell et al., 2019). The velocity fields of the hot molecular and ionised gas show a rotation pattern, but it is distorted indicating the presence of additional kinematic components (Schönell et al., 2019).
The flux maps for NGC 3227 (Fig. 4), show extended emission over most of the FoV, except for the [S ix]1.2523 m, whose emission is restricted to the inner arcsec radius. The flux distributions are more elongated along the galaxy’s major axis (; Riffel et al., 2017) and we derive an orientation of for the Pa emission, which close to the orientation of the radio jet (Mundell et al., 1995), and thus it is likely tracing the AGN ionisation axis. The H2/Br vs. [Fe ii]/Pa diagram shows values in the AGN and HLR regions, with the AGN ratios seen mainly at the centre and close to the borders of the FoV, along the AGN ionisation axis. The [P ii]/Pa line ratio presents values between 2 and 15 in most locations and it correlates with the [Fe ii]/Pa. The excitation map for the low velocity range highlights the structure seen in the excitation map using the total fluxes, with values typical of AGN at the nucleus and along the AGN ionisation axis, and HLRs in between. On the other hand, for the high velocity range, most of the ratios fall in the HLR region, except for a region northern of the nucleus, close to the border of the NIFS FoV. As for the previous galaxies, the median line ratios for the high velocity range are larger than those for the low velocity gas.
4.1.4 NGC 3516
This is a lenticular galaxy, classified as (R)SB00?(s), with a Sy 1.2 nucleus. Recently a detection of an UV flare placed this galaxy as a changing-look AGN (Ilić et al., 2020). The gas velocity fields deviate from a well-behaved rotation pattern, as observed for the near-IR emission lines (Schönell et al., 2019) and H (Veilleux et al., 1993). This feature is likely due to a bipolar outflow (Goad & Gallagher, 1987) and explained by a precessing twin jet model (Veilleux et al., 1993). Schönell et al. (2019) reported [Fe ii]m/Pa in regions with enhanced values ( km s-1), indicating shocks. As is the case of Mrk 607, NGC 3516 presents patches of smaller stellar velocity dispersion values ( km s-1) due to the presence of young to intermediate stellar populations. An extended radio emission along is detected at 20 cm, while at 3.6 cm only unresolved nuclear emission is detected (Nagar et al., 1999). The [O iii] emission observed by HST shows an S-shaped morphology, extended by 13.6 arcsec along (Schmitt et al., 2003).
The emission-line flux distributions for NGC 3516 (Fig. 5) are the most compact among all galaxies in our sample. Only the [Fe ii] presents emission over the whole FoV. The extended emission is seen mainly along the major axis of the galaxy (; Riffel et al., 2017). We derive an orientation of for the Pa emission, which may be tracing emission from the galaxy’s disc rather than the AGN ionisation structure, as at larger scales, this galaxy presents a clear extended NLR along (Schmitt et al., 2003). Not much can be said about the ionisation structure of this galaxy, as we were able to measure all emission lines only at the centre. The observed line ratios fall in the AGN and HLR regions of the diagnostic diagram, and higher median values are found for the line ratios using the high velocity range, as compared to those of the low velocity range.
4.1.5 NGC 5506
NGC 5506 is a spiral galaxy classified as Sa pec edge-on, located at a distance of 31 Mpc and hosting a Sy 1.9 nucleus (Blanco et al., 1990; Kewley et al., 2001). NIFS observations of NGC 5506 show that [Fe ii]m flux distribution is more extended perpendicularly to the galaxy’s major axis () (Riffel et al., 2017; Schönell et al., 2019). This feature, combined with structures in the same spatial location with high velocity dispersion ( km s-1) and the distorted velocity fields, supports the presence of an ionised gas outflow, previously observed using optical long-slit spectra (Maiolino et al., 1994). The Hm is distributed along the major axis and its emission is not as prominent as for the ionised gas, this is probably because the H2 molecule is dissociated by AGN radiation (Schönell et al., 2019). VLA observations of NGC 5506 at 3.6 cm reveal a linear structure along the east-west direction, surrounded by diffuse emission, with a total extension of 300 pc (Schmitt et al., 2001).
The [Fe ii] flux distribution of NGC 5506 (Fig. 6) shows a well defined one-sided cone to the north of the nucleus, which is also seen in the [P ii] flux map. The H2 flux distribution is more elongated along the galaxy’s major axis (; Riffel et al., 2017), presenting a structure that seems to be tracing the outer walls of the cone seen in [Fe ii]. The Pa shows a round flux distributions and we derive an orientation of , which seems to trace the east wall of the cone seen in [Fe ii]. The [S ix] line emission is slightly more extended to the north of the nucleus. The H2/Br vs. [Fe ii]/Pa shows values in all regions, with values typical of SF at the nucleus and along the north-south direction, surrounded by the values typical of AGN and HLRs are seen close to the borders of the NIFS FoV. A good correlation is found between H2/Br and [Fe ii]/Pa, and between [Fe ii]/Pa and [Fe ii]/[P ii], with the latter ratio presenting values of up to 20. Unlike previous objects, this galaxy presents smaller line ratios for the high velocity gas than for the low velocity range. This behaviour will be further discussed in next section.
4.1.6 NGC 5899
NGC 5899 is located at 39 Mpc, classified as SAB(rs)c (Ann et al., 2015) and hosts a Sy 2 nucleus (de Vaucouleurs et al., 1991). This galaxy presents a partial ring of low stellar velocity dispersion ( km s-1) with radius of 200 pc centred at the galaxy nucleus likely produced by young/intermediate age stellar populations (Riffel et al., 2017). Schönell et al. (2019) found that the Hm emission is extended along the galaxy major axis () and shows a rotation pattern with small velocity dispersion values over the whole field of view. On the other hand, the strongest [Fe ii] 1.2570 m and Pa emissions are seen along the north-south direction, as well as the highest gradient in the velocity fields. The velocity dispersion of the [Fe ii] reaches values of km s-1 reinforcing the hypothesis that the ionised gas traces an outflow, while the molecular gas follows the rotation of the stars (Schönell et al., 2019). To the best of our knowledge, no extended radio emission is detected in NGC 5899.
The H2 emission in NGC 5899 (Fig. 7) is more extended along the orientation of the galaxy’s disc (; Riffel et al., 2017), while the ionised gas is displaced by 23∘ from it, and the emission peak of the ionised gas emission is observed at 0.3 arcsec south of the nucleus. No [S ix]1.2523 m emission is detected spaxel-by-spaxel, but we were able to measure its flux using integrated spectra, as shown in Tab. 1. The excitation map shows values in the AGN region, close to the nucleus, surrounded by HLR regions. There is no correlation between H2/Br and [Fe ii]/Pa, but the range of values observed in both line ratios is small. At most locations the [Fe ii]/[P ii] is slightly larger than 2. The median H2/Br and [Fe ii]/Pa ratios for the low and high velocity ranges are similar, but the fraction of spaxels in the HLR is larger for the latter.
4.2 Gas excitation
The most comprehensive study of the two-dimensional ionisation structure in nearby galaxies using near-IR IFS was performed by Colina et al. (2015). The authors used the H2 2.1218 m/Br and [Fe ii]m/Br diagnostic diagram, as their VLT SINFONI data covers the H and K bands. The diagnostic diagrams are presented for 10 LIRGs and are compared with results from previously published data of SF and Seyfert galaxies. The results in Colina et al. (2015) indicates that H2 2.1218 m/Br and [Fe ii]m/Br are correlated in most objects (e.g. IC 4687), while no correlations are observed in few objects (e.g. NGC 3256). As the SINFONI covers a larger FoV than NIFS and the ionisation structure in LIRGS is more complex, most of objects in the sample of Colina et al. (2015) show line ratios spanning a wide range of values. Some of the Seyfert galaxies in their work clearly show no correlation between the line ratios involved in the diagnostic diagram (e.g., Mrk 1157; Riffel & Storchi-Bergmann, 2011b). We find strong correlations between H2 2.1218 m/Br and [Fe ii]1.2570 m/Pa for Mrk 607, NGC 3227 and NGC 5506, while no correlations are found for the other galaxies, although a trend of increasing H2/Br with the increasing of [Fe ii]/Pa is observed for NGC 3516 (but the number of points is small) and for the high velocity range of NGC 788. However, considering that the SINFONI data used in Colina et al. (2015) covers a larger FoV, their observations are seeing limited and their sample has an average redshift larger than ours, a comparison between individual correlations is not straightforward.
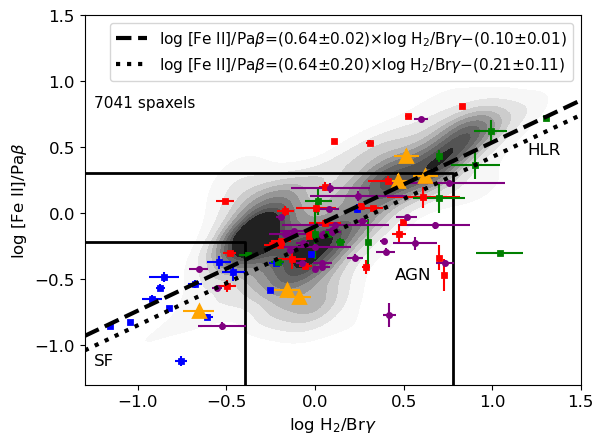
We use the emission-line ratios of all galaxies of our sample to construct the [Fe ii]1.2570 m/Pa vs. H2 2.1218 m/Br diagnostic diagram (shown in Figure 10), which is useful to investigate the origin of the near-IR emission lines. We find a strong correlation between [Fe ii]/Pa and H2/Br in good agreement with previous results using single aperture (e.g. Rodríguez-Ardila et al., 2005; Riffel et al., 2013a) and integral field (e.g. Colina et al., 2015) spectra of nearby active galaxies. As the Pa and Br emission-lines are originated from the same process (i.e. photoionisation by the AGN or young-massive stars), a possible interpretation of this correlation is that the H2 and [Fe ii] emissions originate from the same excitation mechanism.
We use a Spearman correlation test and find a correlation coefficient between [Fe ii]/Pa and H2/Br of and a correlation confidence level larger than 99.9 %. This suggests that the [Fe ii] and H2 emissions in our sample are dominated by thermal processes. We fit the data by a linear equation resulting in
| (3) |
The best fit equation to our data is shown as a dashed line in Fig. 10, which is consistent with the one obtained by Riffel et al. (2013a) using single aperture spectra of 67 nearby galaxies [].
We have also compiled the [Fe ii]/Pa and H2/Br ratios measured by integrated spectra for a sample of 93 objects composed of Star Forming Galaxies (Larkin et al., 1998; Dale et al., 2004; Rodríguez-Ardila et al., 2005; Riffel et al., 2013a), Blue Compact Dwarf Galaxies (Izotov & Thuan, 2011), Seyfert galaxies (Knop et al., 2001; Reunanen et al., 2002; Rodríguez-Ardila et al., 2004; Rodríguez-Ardila et al., 2005; Riffel et al., 2006b), LINERs (Larkin et al., 1998; Riffel et al., 2013a) and BAT AGN (Lamperti et al., 2017). We show these measurements as colour points in Fig. 10 and include the nuclear ratios observed in our sample, within 0.5 arcsec radius, represented by the orange triangles. As already noticed in Riffel et al. (2013a), there is a strong correlation between the nuclear [Fe ii]/Pa and H2/Br ratios. The Spearman test results in and . It is worth mentioning that the correlation coefficients for the integrated and spatially resolved line ratios are very similar, meaning that the [Fe ii]/Pa and H2/Br diagnostic diagram, originally designed for single aperture measurements, can be used to obtain information on the excitation of the spatially resolved emitting gas. The best linear fit of the single aperture data, shown as a dotted line Fig. 10, is well consistent with the resulting fit of the spatially resolved data (dashed line).
Except for NGC 5506, all galaxies show higher line ratios in the high velocity range () than in the low velocity range ). This indicates that shocks contribute to the [Fe ii] and H2 emission, even in galaxies with most of the spaxels in the AGN region of the diagnostic diagrams (e.g. NGC 788 and Mrk 607).
In order to further investigate the origin of the line emission we use two quantities that can be obtained from our data: and . is the width of an emission-line above which 80 per cent of the flux is emitted, and is frequently used to identify ionised outflows (Zakamska & Greene, 2014; Wylezalek et al., 2017; Wylezalek et al., 2020; Riffel et al., 2020b; Kakkad et al., 2020). The parameter is more sensitive to the wings of the emission-line profiles, and thus a better indicator of outflows than the velocity dispersion () from a Gaussian function. Usually values larger than 600 km s-1 in the [O iii]5007Å line in powerful AGN are associated to outflows (e.g. Kakkad et al., 2020), while in low-luminosity AGN have been attributed to ionised outflows (e.g. Wylezalek et al., 2020). We follow a similar procedure used in the optical by D’Agostino et al. (2019b) to separate the contributions of star formation, shocks, and AGN ionisation (see also D’Agostino et al., 2019a) and define an emission-line ratio function () by
| (4) |
with H2 2.1218 m/Br and [Fe ii]1.2570 m/Pa, and P02 and P98 being the percentile 2 and 98 of the observed emission-line ratios, respectively. D’Agostino et al. (2019b) define the emission-line ratio function using [O iii]5007/H and [N ii]6583/H line ratios in the optical and instead of use the P02 and P98 parameters, they use the minimum and maximum ratios. The P02 and P98 parameters are less sensitive to outliers than the minimum and maximum ratio values.
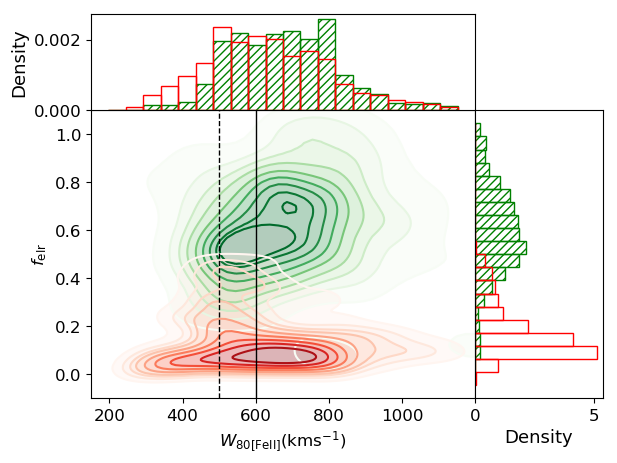
We present, in Figure 11, the density plot of vs. (corrected for instrumental broadening) for all spaxels with H2 2.1218 m/Br [Fe ii]1.2570 m/Pa measurements from all galaxies. In green, we show the line ratios from the HLR region in the diagnostic diagram (Figs. 2 – 7) and in red those from the AGN region. We do not show contours for the SF region as they are seen only in one galaxy. We find larger than the typical limits above which they can be attributed to outflows. The values derived in this work are larger than those obtained from the maps presented in Schönell et al. (2019) using the relation: (Zakamska & Greene, 2014). However, Schönell et al. (2019) fitted the emission lines by Gauss-Hermite series the relation above is no longer valid. In addition, the and maps from Schönell et al. (2019) present high values (with absolute values of up to 0.3), a clear indication that the line profiles are not Gaussian. A detailed discussion about the gas kinematics will be presented in a forthcoming paper (Bianchin et al., in prep.), but we find ionised outflows in all galaxies of our sample, based on the analysis of multi-Gaussian component fits to the near-IR emission lines. The interaction of these outflows with the interstellar medium can produce the shocks necessary to excite the H2 and [Fe ii] emission lines.
In Fig. 11, clearly separates two excitation regimes: the AGN regime, with , and the HLR excitation regime for which is higher. In addition, in the HLR excitation regime, increases with , supporting the dominance of shock excitation. A similar increase of the emission-line ratio function with the gas velocity dispersion is seen in the optical and associated to shocks (D’Agostino et al., 2019a; D’Agostino et al., 2019b; Riffel et al., 2020a). This suggests a strong contribution of shocks to the H2 and [Fe ii] emission from regions with high [Fe ii]/Pa and H2/Br ratios in the galaxies of our sample.
Spaxels in the AGN region of the [Fe ii]/Pa vs. H2/Br diagram present a wide range in and a smaller range of values of , as compared to the shock dominated spaxels. There is no trend between and in the red contours of Fig. 11. This result indicates that shocks are less efficient in the production of line emission, when competing with the AGN radiation field, as found in the optical (Zakamska & Greene, 2014). Thus, although a large fraction of the gas is outflowing and outflows naturally produce shocks, the AGN radiation field is the main responsible for the production of the H2 and [Fe ii] in the AGN region of the NIR diagnostic diagram. Some contribution of shocks in the AGN region of the diagnostic diagram is supported by the higher line ratios seen in the high velocity range, as discussed above.
4.2.1 The origin of the H2 emission
The near-IR H2 emission lines in the AGN spectra originate from thermal processes (Fischer et al., 1987; Moorwood & Oliva, 1990; Veilleux et al., 1997; Rodríguez-Ardila et al., 2005; Dors et al., 2012; Riffel et al., 2013a). The [Fe ii]/Pa vs. H2/Br diagnostic diagrams of all galaxies show that most of the line ratios are in the AGN and HLR regions. This indicates that thermal processes are the most relevant excitation mechanisms in our sample.
The H2 vibrational and rotational temperatures are similar if the gas is in local thermal equilibrium (excited by thermal processes), while for fluorescent excitation, the rotational temperature is expected to be approximately 10 per cent of the vibrational temperature (Sternberg & Dalgarno, 1989; Rodríguez-Ardila et al., 2004). We measure both and for NGC 788, NGC 3227 and NGC 5506 (see Fig. 9 and Tab. 2). For the these galaxies, the rotational temperatures are smaller than the vibrational, but larger than the values expected for fluorescent excitation. The largest difference is seen in NGC 788, for which the vibrational temperature is about twice the rotational temperature. For NGC 5506 the vibrational and rotational temperatures are the most similar, with within the inner 100 pc of the galaxy and within the 0.5 arcsec. This indicates that thermal processes are dominant in all galaxies, but there is also some contribution from non-thermal processes, mainly in NGC 788.
The H2 2–1 S(1)/1–0 S(1) vs. 1–0 S(2)/1–0 S(0) diagnostic diagrams (Fig. 8) confirm the conclusion that thermal processes dominate the H2 emission in NGC 788, NGC 3227, NGC 5506. Most of the points in the diagrams of Fig. 8 lie close to the range of values predicted by shock and X-ray excitation models, but some points are also seen close to region predicted for UV excitation of the H2 in dense photon-dominated regions with cloud densities between 104 and 105 cm-3, exposed to UV radiation field of of young 1–5 Myr star clusters (Davies et al., 2003, 2005).
We note the points from SF region of the [Fe ii]1.2570 m/Pa vs. H2 2.1218 m/Br diagnostic diagram (Fig. 6) for NGC 5506 are seen distant from the region expected for non-thermal excitation and fall very close to the regions predicted by X-ray and shock models in the H2 diagnostic diagram of Fig. 8. The H2 and ionised gas emission-line flux distributions are seen almost perpendicular to each other, with the strongest emission in ionised gas being along the north-south direction, at the same locations classified as SF in the excitation map. The [O iii]5007Å is also more collimated along the north-south direction and its kinematics is consistent with a bipolar outflow (Fischer et al., 2013). This suggests the lower [Fe ii]1.2570 m/Pa vs. H2 2.1218 m/Br line ratios along the north-south direction are not produced by star formation, but they may be a consequence of the AGN radiation field. The lower line ratios can be explained if the H2 gas is partially dissociated by the AGN radiation or by shocks from the outflow, decreasing its abundance and consequently its emission, as found for other Seyfert galaxies (Storchi-Bergmann et al., 2009; Riffel et al., 2014a; Gnilka et al., 2020). Similarly, the [Fe ii] abundance may be reduced by a strong radiation field, favouring higher excitation levels of the iron.
Although we were not able to measure the H2 rotational temperatures and produce the H2 2–1 S(1)/1–0 S(1) vs. 1–0 S(2)/1–0 S(0) excitation diagrams for Mrk 607, NGC 3516 and NGC 5899, the comparison of their [Fe ii]1.2570 m/Pa vs. H2 2.1218 m/Br diagnostic diagram with those of the other galaxies is useful to understand how the H2 emission originates in these objects. Mrk 607 and NGC 788 present very similar [Fe ii]1.2570 m/Pa vs. H2 2.1218 m/Br diagrams, with all points in the AGN region, but overall small [Fe ii]/Pa. This, together with the fact that the emission of both ionised and molecular gas in Mrk 607 are similar and observed mainly along the major axis of the galaxy, suggest that we cannot rule out a contribution of fluorescent excitation to the H2 lines. NGC 3516 and NGC 5899 show high values of both [Fe ii]1.2570 m/Pa and H2 2.1218 m/Br, suggesting thermal processes are dominant in these galaxies.
4.2.2 The origin of the [Fe ii] emission
The [Fe ii] emission lines in AGN can be produced by photoionisation and shocks. The photoionisation models of Dors et al. (2012) and Riffel et al. (2013a) show that an increase in the [Fe ii]/Pa can originate from an enhancement of the Fe/O abundance. This suggests the correlation seen in Fig. 10 could originate in a combination of the amount of ionising photons and a variation in the iron abundance. However, the [Fe ii] emission can also be increased by shock excitation and indeed, the presence of shocks is supported by the high values of (Fig. 11).
The [Fe ii] and [P ii] have similar excitation temperatures and ionisation potentials (16.2 and 19.8 eV, respectively) and the [Fe ii]1.2570 m/[P ii]1.1886 m can be used to investigate the origin of the [Fe ii] emission. The iron is usually locked into dust grains and fast shocks can release it. In photoionised objects, such as the Orion Nebulae, [Fe ii]1.2570 m/[P ii]1.1886 m2 and larger values indicate shocks have destroyed the dust grains, releasing the iron and increasing its abundance (Oliva et al., 2001; Jackson & Beswick, 2007; Storchi-Bergmann et al., 2009; Riffel et al., 2010, 2020b). In all galaxies, but NGC 788, most of the spaxels present [Fe ii]1.2570 m/[P ii]1.1886 m2 indicating shocks play an important role in the production of the [Fe ii] emission in our sample. In shock dominated objects, values of up to 20 are expected for this line ratio (e.g. Oliva et al., 2001). Such high values are observed only in some spaxels for NGC 5506, indicating the [Fe ii] emission in the galaxies of our sample originates by a combination of photoionisation and shocks. The comparison of the [Fe ii]/[P ii] vs. [Fe ii]/Pa and H2/Br vs. [Fe ii]/Pa (Figs. 2 – 7) shows that high values of H2/Br and [Fe ii]/Pa are not a sufficient condition for shock excitation, although higher values of these ratios usually imply in larger [Fe ii]/[P ii] values (e.g. for NGC 3227 and NGC 5506). The shocks necessary to release the iron from the dust grains may be produced by the interaction of the outflows with the ambient gas, as indicated by the high values.
4.3 Coronal line emission
Coronal lines (CLs) are those produced by high ionisation species, with ionisation potentials typically larger than 100 eV. In the near-IR spectra of AGN, the most common CLs are [S viii]0.9914 m, [S ix]1.2523 m, [Si x]1.4305 m, [Si vi]1.9650 m, [Al ix]2.0450 m, [Ca viii]2.3213 m and [Si vii] 2.4830 m. (Rodríguez-Ardila et al., 2011). The high ionisation gas in active galaxies can originate from photoionisation due the AGN ionising continuum (e.g. Shields & Oke, 1975; Korista & Ferland, 1989; Ferguson et al., 1997), shocks due to the interaction of a radio jet or outflows with the ambient gas (e.g. Osterbrock & Parker, 1965; Rodríguez-Ardila & Fonseca-Faria, 2020) or by a combination of photoionisation and shocks (e.g. Viegas-Aldrovandi & Contini, 1989; Contini & Viegas, 2001). Photoionisation seems to be the dominant excitation mechanism of CLs, but a contribution of shocks is necessary to reproduce the observed line intensities, specially at distances larger than 100 pc from the nucleus (Rodríguez-Ardila et al., 2006, 2011; Rodríguez-Ardila & Fonseca-Faria, 2020; Geballe et al., 2009).
The CLs usually trace highly ionised AGN-driven outflows, as indicated by their broader and blueshifted profiles as compared to those from lower ionisation gas (Rodríguez-Ardila et al., 2002, 2006; Müller-Sánchez et al., 2011; Rodríguez-Ardila et al., 2017). For example, in the Circinus galaxy, highly ionised gas (traced by the [Fe vii]6087 m) is seen up to 700 pc from the nucleus, and is tracing shock ionisation due to the interaction of the radio jet with the ambient gas (Rodríguez-Ardila & Fonseca-Faria, 2020).
Our NIFS data provides a unique capability to map the extension of the coronal line emission in nearby galaxies. The most prominent CL in in our observed spectral window is [S ix]1.2523 m. The [S ix]1.2523 m flux distribution is spatially resolved in all galaxies of our sample, except for NGC 5899, which only presents a very faint nuclear [S ix] emission. Table 3 lists the full width at half maximum (FWHM) of the [S ix] flux distributions and the most extended [S ix] emission at 3 level detection () for the galaxies of our sample. We find FWHM ranging from 30 to 90 pc, and in the range 80 – 185 pc. The extension of the [S ix] in our sample is slightly larger than those found by Müller-Sánchez et al. (2011) using IFS of a sample of seven nearby Seyfert galaxies. They used the [Si vi]1.9650 m emission as a tracer of the coronal line region and found FWHM from 8 to 60 pc and sizes from 8 to 150 pc. Prieto et al. (2005) derived extensions of the [Si vii]2.48 m from 30 to 200 pc using adaptive optics narrow band images with the ESO/VLT. At these scales, a pure photoionisation scenario fails to reproduce the CLs intensities, favoring an additional contribution of shocks to the coronal emission (e.g. Rodríguez-Ardila et al., 2006; Mazzalay et al., 2013; Rodríguez-Ardila & Fonseca-Faria, 2020). Most of galaxies of our sample show compact radio emission (Nagar et al., 1999; Schmitt et al., 2001). The only exception is NGC 3227, which shows extended radio emission along (Mundell et al., 1995). However, the CL emission in this galaxy does not present a clear extension along the direction of the radio structure. On the other hand, ionised outflows are common in our sample (Bianchin et al., in prep.) and thus, the most likely scenario to produce CLs observed in our sample is the combination of photoionisation and shocks due to AGN-driven outflows (e.g. Viegas-Aldrovandi & Contini, 1989; Contini & Viegas, 2001).
| Galaxy | FWHM | FWHM | FWHMPSF | |
|---|---|---|---|---|
| (arcsec) | (pc) | (pc) | (arcsec) | |
| NGC788 | 0.32 | 90 | 185 | 0.13 |
| Mrk607 | 0.34 | 63 | 150 | 0.14 |
| NGC3227 | 0.36 | 30 | 80 | 0.13 |
| NGC3516 | 0.37 | 68 | 120 | 0.17 |
| NGC5506 | 0.47 | 60 | 100 | 0.15 |
5 Conclusions
We use Gemini NIFS J and K band data to investigate the origin of the near-IR emission lines in the inner few hundred pc of six luminous Seyfert galaxies (NGC 788, Mrk 607, NGC 3227, NGC 3516, NGC 5506 and NGC 5899) at spatial resolutions of 10 to 40 pc. Our main conclusions are the following:
-
•
For all galaxies, the [Fe ii]1.2570 m/Pa vs. H2 2.1218 m/Br diagrams present values in the AGN and HLR regions at most locations. We find a strong correlation between [Fe ii]1.2570 m/Pa and H2 2.1218 m/Br represented by the linear equation which is consistent with the previous result of Riffel et al. (2013a), possibly indicating a common excitation origin.
-
•
The HLR regions in the [Fe ii]1.2570 m/Pa vs. H2 2.1218 m/Br diagnostic diagram are observed surrounding the AGN region, with no preferential orientation relative to the orientation of the ionisation structure.
-
•
We define an emission-line ratio function () that depends on the [Fe ii]1.2570 m/Pa vs. H2 2.1218 m/Br line ratios and presents values in the range 0–1. We find a correlation between this function and , where increases with for the HLR regions of the galaxies indicating shocks produced by gas outflows contribute to the line emission in locations with high [Fe ii]1.2570 m/Pa and H2 2.1218 m/Br values.
-
•
The H2 emission lines are excited by thermal processes in all galaxies. Based on line-ratio diagnostic diagrams and the trend seen between and the , our results indicate, for spaxels in the HLR region, the main process exciting the H2 lines are shocks produced by AGN-driven winds. While for spaxels in the AGN region of the diagnostic diagram, the AGN radiation field is responsible for the observed H2 emission. A small contribution of shocks cannot be ruled out in the AGN region, as indicated by the higher line ratios obtained by computing the line fluxes at velocities of km s-1, compared to those using km s-1, relative to the peak velocity.
-
•
The [Fe ii] emission in our sample originates from a combination of photoionisation by the central source and shocks due to AGN winds, as indicated by the [Fe ii]1.2570 m/[P ii]1.1886 m high values (2–20), line ratios and the correlation between and the for the HLR region.
-
•
The coronal line region, traced by [S ix]1.2523 m emission, extends out between 80 and 185 pc from the galaxy nucleus in five galaxies and is likely produced by AGN photoionisation. The [S ix]1.2523 m emission line is only detected in NGC 5899 using an integrated spectrum.
Acknowledgements
We thank an anonymous referee for useful suggestions which helped to improve the paper. This study was financed in part by Conselho Nacional de Desenvolvimento Científico e Tecnológico (202582/2018-3, 304927/2017-1 and 400352/2016-8) and Fundação de Amparo à pesquisa do Estado do Rio Grande do Sul (17/2551-0001144-9 and 16/2551-0000251-7). M.B. thanks the financial support from Coordenação de Aperfeiçoamento de Pessoal de Nível Superior - Brasil (CAPES) - Finance Code 001. R.R. thanks CNPq, CAPES and FAPERGS for financial support. N.Z.D. acknowledges partial support from FONDECYT through project 3190769. Based on observations obtained at the Gemini Observatory, which is operated by the Association of Universities for Research in Astronomy, Inc., under a cooperative agreement with the NSF on behalf of the Gemini partnership: the National Science Foundation (United States), National Research Council (Canada), CONICYT (Chile), Ministerio de Ciencia, Tecnología e Innovación Productiva (Argentina), Ministério da Ciência, Tecnologia e Inovação (Brazil), and Korea Astronomy and Space Science Institute (Republic of Korea). This research has made use of NASA’s Astrophysics Data System Bibliographic Services. This research has made use of the NASA/IPAC Extragalactic Database (NED), which is operated by the Jet Propulsion Laboratory, California Institute of Technology, under contract with the National Aeronautics and Space Administration. The Pan-STARRS1 Surveys (PS1) and the PS1 public science archive have been made possible through contributions by the Institute for Astronomy, the University of Hawaii, the Pan-STARRS Project Office, the Max-Planck Society and its participating institutes, the Max Planck Institute for Astronomy, Heidelberg and the Max Planck Institute for Extraterrestrial Physics, Garching, The Johns Hopkins University, Durham University, the University of Edinburgh, the Queen’s University Belfast, the Harvard-Smithsonian centre for Astrophysics, the Las Cumbres Observatory Global Telescope Network Incorporated, the National Central University of Taiwan, the Space Telescope Science Institute, the National Aeronautics and Space Administration under Grant No. NNX08AR22G issued through the Planetary Science Division of the NASA Science Mission Directorate, the National Science Foundation Grant No. AST-1238877, the University of Maryland, Eotvos Lorand University (ELTE), the Los Alamos National Laboratory, and the Gordon and Betty Moore Foundation.
Data availability
The data used in this work are publicly available online via the GEMINI archive https://archive.gemini.edu/searchform, under the following program codes: GN-2012B-Q-45, GN-2013A-Q-48, GN-2015A-Q-3, GN-2015B-Q-29 and GN-2016A-Q-6. The processed datacubes used in this article will be shared on reasonable request to the corresponding author.
References
- Ann et al. (2015) Ann H. B., Seo M., Ha D. K., 2015, The Astrophysical Journal Supplement Series, 217, 27
- Arribas & Mediavilla (1994) Arribas S., Mediavilla E., 1994, Astrophysical Journal, 437, 149
- Black & van Dishoeck (1987) Black J. H., van Dishoeck E. F., 1987, ApJ, 322, 412
- Blanco et al. (1990) Blanco P. R., Ward M. J., Wright G. S., 1990, Monthly Notices of the Royal Astronomical Society, 242, 4P
- Colbert et al. (1996) Colbert E. J. M., Baum S. A., Gallimore J. F., O’Dea C. P., Christensen J. A., 1996, Astrophysical Journal, 467, 551
- Colina et al. (2015) Colina L., et al., 2015, A&A, 578, A48
- Contini & Viegas (2001) Contini M., Viegas S. M., 2001, ApJS, 132, 211
- D’Agostino et al. (2019a) D’Agostino J. J., Kewley L. J., Groves B. A., Medling A., Dopita M. A., Thomas A. D., 2019a, MNRAS, 485, L38
- D’Agostino et al. (2019b) D’Agostino J. J., et al., 2019b, MNRAS, 487, 4153
- Dale et al. (2004) Dale D. A., et al., 2004, ApJ, 601, 813
- Davies et al. (2003) Davies R. I., Sternberg A., Lehnert M., Tacconi-Garman L. E., 2003, ApJ, 597, 907
- Davies et al. (2005) Davies R. I., Sternberg A., Lehnert M. D., Tacconi-Garman L. E., 2005, ApJ, 633, 105
- Davies et al. (2014) Davies R. I., et al., 2014, ApJ, 792, 101
- Dors et al. (2012) Dors Oli L. J., Riffel R. A., Cardaci M. V., Hägele G. F., Krabbe Á. C., Pérez-Montero E., Rodrigues I., 2012, MNRAS, 422, 252
- Draine & Woods (1990) Draine B. T., Woods D. T., 1990, ApJ, 363, 464
- Durré & Mould (2018) Durré M., Mould J., 2018, ApJ, 867, 149
- Ferguson et al. (1997) Ferguson J. W., Korista K. T., Ferland G. J., 1997, ApJS, 110, 287
- Ferruit et al. (2000) Ferruit P., Wilson A. S., Mulchaey J., 2000, The Astrophysical Journal Supplement Series, 128, 139
- Fischer et al. (1987) Fischer J., Geballe T. R., Smith H. A., Simon M., Storey J. W. V., 1987, ApJ, 320, 667
- Fischer et al. (2013) Fischer T. C., Crenshaw D. M., Kraemer S. B., Schmitt H. R., 2013, The Astrophysical Journal Supplement Series, 209, 1
- Forbes & Ward (1993) Forbes D. A., Ward M. J., 1993, ApJ, 416, 150
- Freitas et al. (2018) Freitas I. C., et al., 2018, MNRAS, 476, 2760
- Geballe et al. (2009) Geballe T. R., Mason R. E., Rodríguez-Ardila A., Axon D. J., 2009, ApJ, 701, 1710
- Glidden et al. (2016) Glidden A., Rose M., Elvis M., McDowell J., 2016, ApJ, 824, 34
- Gnilka et al. (2020) Gnilka C. L., et al., 2020, ApJ, 893, 80
- Goad & Gallagher (1987) Goad J. W., Gallagher J. S. I., 1987, Astronomical Journal, 94, 640
- Guillard et al. (2009) Guillard P., Boulanger F., Pineau Des Forêts G., Appleton P. N., 2009, A&A, 502, 515
- Ho et al. (1997) Ho L. C., Filippenko A. V., Sargent W. L. W., 1997, The Astrophysical Journal Supplement Series, 112, 315
- Ho et al. (2014) Ho I. T., et al., 2014, MNRAS, 444, 3894
- Hollenbach & McKee (1989) Hollenbach D., McKee C. F., 1989, ApJ, 342, 306
- Ichikawa et al. (2017) Ichikawa K., Ricci C., Ueda Y., Matsuoka K., Toba Y., Kawamuro T., Trakhtenbrot B., Koss M. J., 2017, ApJ, 835, 74
- Ilić et al. (2020) Ilić D., et al., 2020, Astronomy & Astrophysics, 638, A13
- Izotov & Thuan (2011) Izotov Y. I., Thuan T. X., 2011, ApJ, 734, 82
- Jackson & Beswick (2007) Jackson N., Beswick R. J., 2007, MNRAS, 376, 719
- Kakkad et al. (2020) Kakkad D., et al., 2020, arXiv e-prints, p. arXiv:2008.01728
- Kewley et al. (2001) Kewley L. J., Heisler C. A., Dopita M. A., Lumsden S., 2001, The Astrophysical Journal Supplement Series, 132, 37
- Knop et al. (2001) Knop R. A., Armus L., Matthews K., Murphy T. W., Soifer B. T., 2001, AJ, 122, 764
- Korista & Ferland (1989) Korista K. T., Ferland G. J., 1989, ApJ, 343, 678
- Kwan et al. (1977) Kwan J. H., Gatley I., Merrill K. M., Probst R., Weintraub D. A., 1977, ApJ, 216, 713
- Lamperti et al. (2017) Lamperti I., et al., 2017, MNRAS, 467, 540
- Larkin et al. (1998) Larkin J. E., Armus L., Knop R. A., Soifer B. T., Matthews K., 1998, ApJS, 114, 59
- Lepp & McCray (1983) Lepp S., McCray R., 1983, ApJ, 269, 560
- Liu et al. (2013) Liu G., Zakamska N. L., Greene J. E., Nesvadba N. P. H., Liu X., 2013, MNRAS, 436, 2576
- Maiolino et al. (1994) Maiolino R., Stanga R., Salvati M., Rodriguez Espinosa J. M., 1994, Astronomy and Astrophysics, 290, 40
- Maloney et al. (1996) Maloney P. R., Hollenbach D. J., Tielens A. G. G. M., 1996, ApJ, 466, 561
- May & Steiner (2017) May D., Steiner J. E., 2017, MNRAS, 469, 994
- May et al. (2018) May D., Rodríguez-Ardila A., Prieto M. A., Fernández-Ontiveros J. A., Diaz Y., Mazzalay X., 2018, MNRAS, 481, L105
- May et al. (2020) May D., Steiner J. E., Menezes R. B., Williams D. R. A., Wang J., 2020, MNRAS, 496, 1488
- Mazzalay et al. (2013) Mazzalay X., Rodríguez-Ardila A., Komossa S., McGregor P. J., 2013, MNRAS, 430, 2411
- McGregor et al. (2003) McGregor P. J., et al., 2003, Gemini near-infrared integral field spectrograph (NIFS). Proceedings of the SPIE, pp 1581–1591, doi:10.1117/12.459448
- Moorwood & Oliva (1990) Moorwood A. F. M., Oliva E., 1990, A&A, 239, 78
- Mouri (1994) Mouri H., 1994, ApJ, 427, 777
- Mouri et al. (1990) Mouri H., Nishida M., Taniguchi Y., Kawara K., 1990, ApJ, 360, 55
- Mouri et al. (1993) Mouri H., Kawara K., Taniguchi Y., 1993, ApJ, 406, 52
- Müller-Sánchez et al. (2011) Müller-Sánchez F., Prieto M. A., Hicks E. K. S., Vives-Arias H., Davies R. I., Malkan M., Tacconi L. J., Genzel R., 2011, ApJ, 739, 69
- Mundell et al. (1995) Mundell C. G., Holloway A. J., Pedlar A., Meaburn J., Kukula M. J., Axon D. J., 1995, Monthly Notices of the Royal Astronomical Society, 275, 67
- Nagar et al. (1999) Nagar N. M., Wilson A. S., Mulchaey J. S., Gallimore J. F., 1999, ApJS, 120, 209
- Oh et al. (2018) Oh K., et al., 2018, ApJS, 235, 4
- Oliva et al. (2001) Oliva E., et al., 2001, A&A, 369, L5
- Osterbrock & Parker (1965) Osterbrock D. E., Parker R. A. R., 1965, ApJ, 141, 892
- Prieto et al. (2005) Prieto M. A., Marco O., Gallimore J., 2005, MNRAS, 364, L28
- Reunanen et al. (2002) Reunanen J., Kotilainen J. K., Prieto M. A., 2002, MNRAS, 331, 154
- Riffel (2010) Riffel R. A., 2010, Ap&SS, 327, 239
- Riffel & Storchi-Bergmann (2011a) Riffel R. A., Storchi-Bergmann T., 2011a, MNRAS, 411, 469
- Riffel & Storchi-Bergmann (2011b) Riffel R. A., Storchi-Bergmann T., 2011b, MNRAS, 417, 2752
- Riffel et al. (2006a) Riffel R. A., Storchi-Bergmann T., Winge C., Barbosa F. K. B., 2006a, MNRAS, 373, 2
- Riffel et al. (2006b) Riffel R., Rodríguez-Ardila A., Pastoriza M. G., 2006b, A&A, 457, 61
- Riffel et al. (2008) Riffel R. A., Storchi-Bergmann T., Winge C., McGregor P. J., Beck T., Schmitt H., 2008, MNRAS, 385, 1129
- Riffel et al. (2010) Riffel R. A., Storchi-Bergmann T., Nagar N. M., 2010, MNRAS, 404, 166
- Riffel et al. (2013a) Riffel R., Rodríguez-Ardila A., Aleman I., Brotherton M. S., Pastoriza M. G., Bonatto C., Dors O. L., 2013a, MNRAS, 430, 2002
- Riffel et al. (2013b) Riffel R. A., Storchi-Bergmann T., Winge C., 2013b, MNRAS, 430, 2249
- Riffel et al. (2014a) Riffel R. A., Vale T. B., Storchi-Bergmann T., McGregor P. J., 2014a, MNRAS, 442, 656
- Riffel et al. (2014b) Riffel R. A., Storchi-Bergmann T., Riffel R., 2014b, ApJ, 780, L24
- Riffel et al. (2015) Riffel R. A., Storchi-Bergmann T., Riffel R., 2015, MNRAS, 451, 3587
- Riffel et al. (2017) Riffel R. A., Storchi-Bergmann T., Riffel R., Dahmer-Hahn L. G., Diniz M. R., Schönell A. J., Dametto N. Z., 2017, MNRAS, 470, 992
- Riffel et al. (2018) Riffel R. A., et al., 2018, MNRAS, 474, 1373
- Riffel et al. (2019) Riffel R., et al., 2019, MNRAS, 486, 3228
- Riffel et al. (2020a) Riffel R. A., et al., 2020a, MNRAS,
- Riffel et al. (2020b) Riffel R. A., Storchi-Bergmann T., Zakamska N. L., Riffel R., 2020b, MNRAS, 496, 4857
- Rodríguez-Ardila & Fonseca-Faria (2020) Rodríguez-Ardila A., Fonseca-Faria M. A., 2020, ApJ, 895, L9
- Rodríguez-Ardila et al. (2002) Rodríguez-Ardila A., Viegas S. M., Pastoriza M. G., Prato L., 2002, ApJ, 579, 214
- Rodríguez-Ardila et al. (2004) Rodríguez-Ardila A., Pastoriza M. G., Viegas S., Sigut T. A. A., Pradhan A. K., 2004, A&A, 425, 457
- Rodríguez-Ardila et al. (2005) Rodríguez-Ardila A., Riffel R., Pastoriza M. G., 2005, MNRAS, 364, 1041
- Rodríguez-Ardila et al. (2006) Rodríguez-Ardila A., Prieto M. A., Viegas S., Gruenwald R., 2006, ApJ, 653, 1098
- Rodríguez-Ardila et al. (2011) Rodríguez-Ardila A., Prieto M. A., Portilla J. G., Tejeiro J. M., 2011, ApJ, 743, 100
- Rodríguez-Ardila et al. (2017) Rodríguez-Ardila A., Prieto M. A., Mazzalay X., Fernández-Ontiveros J. A., Luque R., Müller-Sánchez F., 2017, MNRAS, 470, 2845
- Ruschel-Dutra (2020) Ruschel-Dutra D., 2020, danielrd6/ifscube v1.0, doi:10.5281/zenodo.3945237, https://doi.org/10.5281/zenodo.3945237
- Schinnerer et al. (2000) Schinnerer E., Eckart A., Tacconi L. J., 2000, The Astrophysical Journal, 533, 826
- Schmitt et al. (2001) Schmitt H. R., Ulvestad J. S., Antonucci R. R. J., Kinney A. L., 2001, ApJS, 132, 199
- Schmitt et al. (2003) Schmitt H. R., Donley J. L., Antonucci R. R. J., Hutchings J. B., Kinney A. L., 2003, ApJS, 148, 327
- Schönell et al. (2019) Schönell A. J., Storchi-Bergmann T., Riffel R. A., Riffel R., Bianchin M., Dahmer-Hahn L. G., Diniz M. R., Dametto N. Z., 2019, MNRAS, 485, 2054
- Shields & Oke (1975) Shields G. A., Oke J. B., 1975, ApJ, 197, 5
- Simpson et al. (1996) Simpson C., Forbes D. A., Baker A. C., Ward M. J., 1996, MNRAS, 283, 777
- Smith (1995) Smith M. D., 1995, A&A, 296, 789
- Sternberg & Dalgarno (1989) Sternberg A., Dalgarno A., 1989, ApJ, 338, 197
- Storchi-Bergmann et al. (2009) Storchi-Bergmann T., McGregor P. J., Riffel R. A., Simões Lopes R., Beck T., Dopita M., 2009, MNRAS, 394, 1148
- Storchi-Bergmann et al. (2010) Storchi-Bergmann T., Lopes R. D. S., McGregor P. J., Riffel R. A., Beck T., Martini P., 2010, MNRAS, 402, 819
- Turner et al. (1977) Turner J., Kirby-Docken K., Dalgarno A., 1977, ApJS, 35, 281
- Veilleux et al. (1993) Veilleux S., Tully R. B., Bland-Hawthorn J., 1993, Astronomical Journal, 105, 1318
- Veilleux et al. (1997) Veilleux S., Goodrich R. W., Hill G. J., 1997, ApJ, 477, 631
- Véron-Cetty & Véron (2006) Véron-Cetty M. P., Véron P., 2006, Astronomy and Astrophysics, 455, 773
- Viegas-Aldrovandi & Contini (1989) Viegas-Aldrovandi S. M., Contini M., 1989, A&A, 215, 253
- Wylezalek et al. (2017) Wylezalek D., et al., 2017, MNRAS, 467, 2612
- Wylezalek et al. (2020) Wylezalek D., Flores A. M., Zakamska N. L., Greene J. E., Riffel R. A., 2020, MNRAS, 492, 4680
- Zakamska & Greene (2014) Zakamska N. L., Greene J. E., 2014, MNRAS, 442, 784
- de Vaucouleurs et al. (1991) de Vaucouleurs G., de Vaucouleurs A., Corwin Herold G. J., Buta R. J., Paturel G., Fouque P., 1991, Third Reference Catalogue of Bright Galaxies