Simple quasistationary method for simulations of epidemic processes with localized states
Abstract
Epidemic processes on random graphs or networks are marked by localization of activity that can trap the dynamics into a metastable state, confined to a subextensive part of the network, before visiting an absorbing configuration. Quasistationary (QS) method is a technique to deal with absorbing states for finite sizes and has played a central role in the investigation of epidemic processes on heterogeneous networks where localization is a hallmark. The standard QS method possesses high computer and algorithmic complexity for large systems besides parameters whose choice are not systematic. However, simpler approaches, such as a reflecting boundary condition (RBC), are not able to capture the localization effects as the standard QS method does. In the present work, we propose a QS method that consists of reactivating nodes proportionally to the time they were active along the preceding simulation. The method is compared with the standard QS and RBC methods for the susceptible-infected-susceptible model on complex networks, which is a prototype of a dynamic process with strong and localization effects. We verified that the method performs as well the as standard QS in all investigated simulations, providing the same scaling exponents, epidemic thresholds, and localized phases, thus overcoming the limitations of other simpler approaches. We also report that the present method has significant reduction of the computer and algorithmic complexity than the standard QS methods. So, this method arises as a simpler and efficient tool to analyze localization on heterogeneous structures through QS simulations.
I Introduction
Many phenomena can be suited within the framework of dynamical processes on complex networks, in which individuals represented by nodes (or vertices) interact with each other and the interactions are mediated by links (or edges) [1], as illustrated in Fig. 1. Nodes and links are more frequently used in the context of physical systems while vertices and edges for their mathematical representation as graphs. We use both terminologies interchangeably. Examples range from rumor and epidemic spreading [2, 3, 4, 5, 6] to urban mobility [7, 8]. In particular, those with absorbing states, in which the dynamics is trapped forever when visited [9, 10], represent an important class of processes on networks [1].
Epidemics can be modeled as reaction-diffusion systems, in which the states of agents and the corresponding transitions are related to epidemiological stages (susceptible, infectious, immunized, etc) [11]. One of the most fundamental epidemic models is the susceptible-infected-susceptible (SIS), in which individuals can be infectious or susceptible. The former heals spontaneously with rate and the latter is infected with rate per infectious contact [12]. On networks, the contagion is mediated by edges connecting infected and susceptible nodes. Since the infection cannot arise spontaneously, a configuration with only susceptible individuals is an absorbing state.
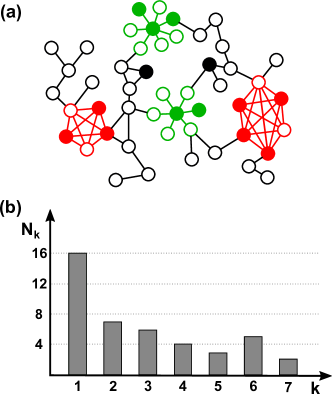
The SIS model on power-law networks with degree distribution , defined as the probability that a randomly selected vertex has connections (Fig. 1), presents remarkable properties. For example, the epidemic threshold, which separates an inactive (absorbing) from an active (fluctuating) phase, is asymptotically null [13, 14] that implies a nonzero prevalence (fraction of infected nodes) for any finite infection rate in an infinite network. For finite systems, the dynamics near to the transition is featured by a localized activation [15, 16, 17, 18, 19]. In the particular case of random power-law networks, the competition of two basic localized structures, stars and maximum -core subgraphs [20, 21], plays a central role on the activity distribution. A star subgraph is composed of a vertex of degree plus its nearest-neighbors, see Fig. 1, and can sustain a localized metastable activity of a SIS dynamics [13], permitting mutual activation of hubs even if they are far from each other [13, 14, 22]. The maximum -core [20], which is the minimal connected subset containing only elements of degree after the removal of all vertices of degree and the edges connected to them, may undergo an activation before the star graphs being responsible by the onset of the endemic phase [21]. However, more complex scenarios can emerge on real networks, in which other motifs, such as cliques of fully connected vertices (Fig. 1), rule the epidemic activation [23].
Analyses of absorbing-state phase transitions by means of simulations demand approaches to prevent trapping into absorbing states since, strictly, they are the only actual steady-state for finite sizes [9]; the only ones accessible in simulations. A fundamental approach is the quasistationary (QS) analysis [9], in which averages at a time are performed only over a subspace of configurations that did not visit the absorbing state until that time. Alternatively, one can consider some perturbation of the dynamics in such a way that the absorbing state is no longer accessible. However, these perturbations must be negligible for intensive and extensive quantities in the thermodynamic limit [24]. There are some methods conceived within this approach [25, 26, 27].
The standard quasistationary which are hereafter generally called QS method (SQS) can be implemented by storing configurations picked up at random along simulations with a certain rate (a parameter of the method) and using them to form a new active state whenever the dynamics is trapped into an absorbing state [28]. The method has frequently been used to investigate localization of epidemic processes on networks [15, 16, 29, 30, 31, 32]. Despite being general, the method has some drawbacks for simulations on large networks such as the high RAM memory load to store a large number of configurations, metastability problems due to finite sampling and time averaging on critical and subcritical simulations, and parameters which do not have a systematic calibration and are model dependent. Simpler methods, such as reflecting boundary condition (RBC), in which the dynamics returns to the previously visited configuration if it has fallen into an absorbing state, can circumvent these problems [27]. A systematic comparison between SQS and RBC [24] for the SIS model on power-law networks shows that the latter is unable to capture some metastable dynamics related to localized states as the former does, leading, for example, to different finite-size scaling (FSS) exponents at the transition. A variant of the RBC, called hub reactivation [24, 33], consists of reinfecting the most connected vertex of the network every time the absorbing state is visited. This method outperformed RBC on the identification of localized phases, equating to the SQS method. However, this method is biased for dynamics in which a single hub plays a major role in the localization and calls for a generalization towards other dynamical processes and relevant network structures such as the cliques shown in Fig. 1.
In this paper, we investigate a QS method without tuning parameters and metastability issues, demanding reduced amount of RAM, and able to capture the same localization patterns on heterogeneous networks as the SQS does. It consists of reactivating a given number of vertices, chosen proportionally to their activity times along the whole history of the simulation, being hereafter called reactivation per activity time (RAT). We compare RAT with the SQS and RBC methods using the challenging SIS dynamics on a variety of synthetic and real networks with high heterogeneity, including scale-free and multiplex structures [34]. Among other findings, we report that all methods provide the same epidemic thresholds in scale-networks with degree exponents , but RBC differs on the FSS of the epidemic prevalence at the epidemic threshold. Using dynamical susceptibility curves [15], we report that the SQS and RAT methods capture the same localization patterns, even in the cases where RBC and SQS mismatch, as for example, in synthetic networks with degree exponent and real networks with degree correlations and more complicated structures. Metastability problems due to insufficient time averaging were not observed for RAT in the networks where they were for SQS. Last but not least, the RAM load in RAT is greatly reduced with respect to SQS while CPU times are slightly smaller.
The remainder of this paper is organized as follows. In Section II we describe the investigated QS methods and the algorithms to simulate the SIS model. We present simulations comparing the QS methods on synthetic and real networks in section III. The computer performance of the QS methods are presented in section IV. Finally, we draw our remarks and prospects for potential applications of the RAT method in section V.
II Methods
Consider systems with elements labeled by which be can either active or inactive. In the case of epidemic processes we have infected and susceptible individuals, but we keep the generic active and inactive terms allowing extension to other dynamical processes. We follow the approach of QS method as a perturbation of the dynamical rules that prevents the trapping into absorbing states in such a way that this disturbance is negligible and does not alter any system’s intensive or extensive properties in the thermodynamic limit [24]. However, it is important to stress that subextensive (increasing sub-linearly with ) and non-extensive (vanishing as ) quantities may depend on the QS method, including critical and localized phases investigated in the present work [24].
A central quantity to be computed is the QS distribution defined as the probability that elements are active in the QS regime. It is computed after a relaxation time during an averaging time . Formally, it can be computed as
| (1) |
in which is the number of active individuals at time and the Kronecker delta symbol. Computationally it is implemented as
| (2) |
in which is the time step used in the Gillespie algorithm given in subsection II.4. Basic measures can be directly obtained from such as the QS moments [35]
| (3) |
The order parameter is the QS epidemic prevalence given by . Localization and critical regions can be identified using the QS dynamic susceptibility given by [15],
| (4) |
which presents sharp peaks for values of at a clean phase transition but also detects localized activation involving sub-extensive components of the networks in the form of additional peaks [15, 16, 30].
The remainder of this section is devoted to reviewing SQS and RBC methods and to introduce the RAT method. An initial condition with all vertices infected are considered, averages are computed after a relaxation time during an averaging interval . In very supercritical simulation these times are reduced by one order of magnitude. Here, it worths to comment that these two parameters are intrinsic to any QS method and obey the trivial rule, the larger the more accurate, which is not the case for the other parameters of the SQS method described next in subsection II.1.
II.1 Standard quasistationary method
The SQS method consists of averaging restricted to the ensemble of active samples that did not visit the absorbing states up to the current simulation time [9]. For subcritical and critical analyses of finite-size systems, in which the dynamics often falls into the absorbing states, the SQS method provides only small intervals of stationary data, usually noisy and not allowing long-time series analysis. de Oliveira and Dickman [28] proposed a simulation method to overcome these limitations which consists of jumping to a previously visited active configuration, every time the system falls into the absorbing state. The convergence of this method to the actual QS state is discussed in Ref. [36].
The QS distribution, which is not known a priori, must be computationally emulated. This can be done by saving copies of active configurations visited during the simulation and picking up randomly one of them whenever the system visits an absorbing state. Two parameters are crucial in this algorithm: the number of saved configurations () and the rate with which the list is updated with the current state (). The calibration of these parameters may be challenging given the limited (finite) computational resources. If is too small, the dynamics can be biased toward a subset which is not representative of the actual QS state; if it is too large, RAM allocation becomes an obstacle and the memory of the initial condition takes too long to be erased. If is too large, saving configurations demands too much computational power and simulations can also be improperly biased towards the latest configurations. On the other hand, if is too small, the convergence to the QS regime takes too long due to the slow loss of memory of the initial conditions.
II.2 Reflecting boundary condition
The RBC method is much simpler than SQS: when the system falls into an absorbing state, it jumps to the immediately preceding configuration with a fixed rate usually chosen as the inverse of the time unit used. In the case of SIS it is just . The equivalence between RBC and an external weak field, in which vertices are spontaneously reactivated with a very small rate, was investigated for regular lattices in Ref. [26] and networks in Ref. [24]. It was shown that RBC is equivalent to a random reactivation of a single vertex. Both variations are computationally simple but do not reproduce the QS distributions obtained with SQS method and especially if there are strongly localized activations [24]. Other approaches can be constructed considering targeted reactivation of vertices as, for example, the hub reactivation [33, 24] aforementioned.
II.3 Reactivation per activity time
Inspired by simple reactivation dynamics, we describe a method able to capture the activation of network subgraphs as the SQS method does. Randomly selected vertices are reactivated according to their history of activity in such a way that those which were active for longer times are more probable of being reactivated. The activity time of the vertex at time along a simulation is given by
| (5) |
in which if vertex is active and , otherwise. After the dynamics has fallen into an absorbing state, or vertices are reactivated with probabilities and , respectively, in which is the overall average activity computed as
| (6) |
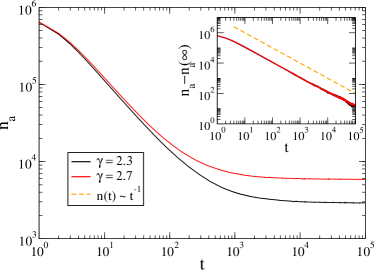
while and are the floor and ceiling functions, respectively. So, the relaxation time must be large enough to erase the influence of the initial condition. For all simulations performed in the present work the convergence is very fast as exemplified for the SIS dynamics near the transition in Fig. 2.
Vertices to be reactivated are chosen at random proportionally to their total activity time. This selection can be done using the rejection method, in which a randomly chosen vertex is accepted with probability
| (7) |
which may be computationally costly if the system falls very often into an absorbing state and the activation time has a broad distribution with values of . This difficulty is circumvented by dividing the vertices in groups , according to some property related to its activity. Next, the total activity time of each group given by
| (8) |
is computed and one of the groups selected with probability
| (9) |
Finally, a randomly selected vertex is accepted with probability
| (10) |
The number of groups and criteria to divide them should be adapted to the dynamical process and network under investigation.
The vertex degree is a natural choice for the SIS model or other processes where activation is related with vertex connectivity. So, in the present work, vertices were labeled such that to form groups of equal size given by
| (11) |
In the case of multiplex networks (section III.3), the binning can be done separately for each layer. This approach will reduce the number of rejections by gathering vertices of similar degree in the same bin. Except for the networks of section III.1, which has a single outlier considered separately, was adopted for all simulations in this paper.
II.4 Algorithms for SIS model
To simulate the SIS dynamics on simple connected networks, we used the optimized Gillespie algorithm (OGA) with phantom processes described in Ref. [37]; See also Ref. [38] for similar methods. The number of infected vertices and total number of edges connected to them given formally by
| (12) |
are determined and kept updated along the simulations. With probability
| (13) |
an infected vertex chosen at random becomes susceptible. With complementary probability an infected vertex is selected at random, proportionally to its degree, and one of its neighbors is selected at random with equal chance. If the selected link points to a susceptible vertex, it is infected. Otherwise, the simulation goes to the next step without altering the configuration (phantom process). Finally, the time is incremented by
| (14) |
where is uniformly distributed in the interval . This whole process is iterated for a predefined time. The activity times of each vertex can be exactly computed by storing the last time it became infected time which is subtracted from the current healing time. However, since the healing is spontaneous, this step can be simplified by incrementing by every time the vertex is healed.
We also analyzed SIS models on multilayer networks, in which same agent belongs to different networks (layers) whose edges represent distinct interactions [34]. For example, a same individual who has Twitter and Facebook profiles with different sets of followers. Let us consider a network with layers; each layer is connected to all others. SIS processes with the same parameters and evolve in each layer. Additionally, a vertical transmission rate , in which one vertex in a layer activates itself in another layer [16], is included. The OGA for the SIS dynamics on multilayer networks runs as follows. With probability
| (15) |
an infected vertex selected at random is healed. With probability
| (16) |
an infected vertex is randomly chosen and activates itself in another layer, also chosen at random, if it was not active yet. Finally, with probability we perform the intralayer infection process of the SIS model described for a single layer. The time increment is analogous to Eq. (14) with the proper denominator given in Eq. (15). Note that a vertex active in multiple layers have to be considered accordingly such that
| (17) |
in which and indicate, respectively, the states and degree of vertex in the layer .
III Comparison of QS methods
We performed QS simulations of the SIS model on complex networks with broad levels of localization to compare the different methods. For simplicity we adopt , fixing therefore the time unit without loss of generality. We start with simple graphs where the localization is highly controlled in subsection III.1. Then, we consider increasing complexity with synthetic power-law, multiplex, and real networks in subsections III.2, III.3, and III.4, respectively.
III.1 Random regular networks with a hub
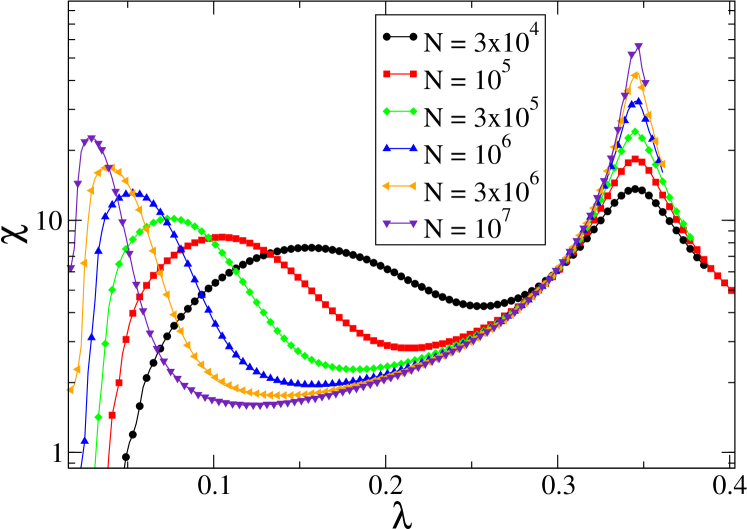
Random regular networks (RRN) are simple graphs, in which every vertex has the same degree () and the connections are performed at random without multiple or self-connections. The SIS model on RRNs undergoes a phase transition at a finite epidemic threshold [39]. Introducing a single vertex of degree in a RRN and still connecting edges at random, a localized activation at , in which only the hub and its neighborhood are involved, is expected in addition to the global one at a finite [31]. In Fig. 3, one can see both activations in the form of peaks in the curves of susceptibility versus infection rate for the SIS model on RRNs of degree plus one hub of degree for different network sizes using the RAT method. Peaks moving towards zero represent the localized activation, while those accumulating at a finite value represent the global ones.
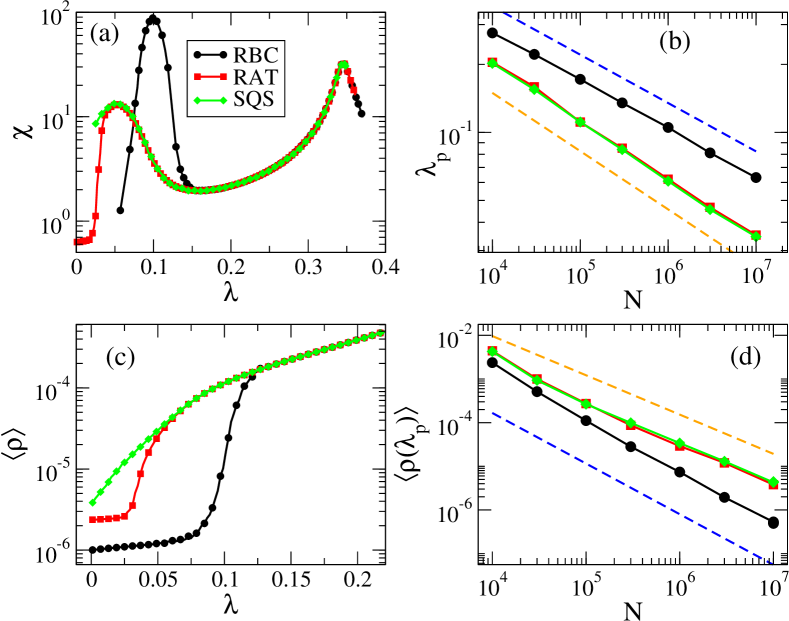
Figure 4 compares some quantities of interest obtained with the three QS methods for SIS on a RRN of and a hub of degree . The susceptibility and prevalence curves, shown in Fig. 4(a) and (c), obtained with RAT and SQS match almost perfectly each other except in the very subcritical region where . In contrast, the localized activation of the hub, characterized by the left peak of the susceptibility curve at , identified with the RBC method is distorted with respect to the SQS method. A finite-size scaling (FSS) of the position of the left peak in the susceptibility curves, which measures the localized activation of the hub, is presented in Fig. 4(b). While RAT and SQS present the same values for within uncertainties, RBC deviates substantially. Assuming a scaling law of the form , a same exponent is obtained for both RAT and SQS whereas for RB. The same FSS analysis can be done for the QS prevalence at , Fig. 4(d), and a similar result is found, in which the scaling obtained with RBC, , differs from those of SQS and RAT, .
III.2 Synthetic power-law networks
Many real networks have a heavy-tailed degree distribution following a power-law [40]. We investigate the performance of the QS methods on power-law, synthetic networks constructed using the uncorrelated configuration model (UCM) [41], in which an upper structural cutoff in the degree distribution is used to guarantee the absence of degree correlations [42]. The minimal degree was fixed in all simulations. Values of related to the different activation mechanisms of the SIS model were considered [21]: for which activation is governed by the maximum -core; where hubs rule the activation but due to the structural cutoff, the degree distribution does not have outliers that generate multiple peaks in the susceptibility curves [15]; and for which activation is also ruled by hubs, but strong localization in a few set of hubs is observed [15, 30].
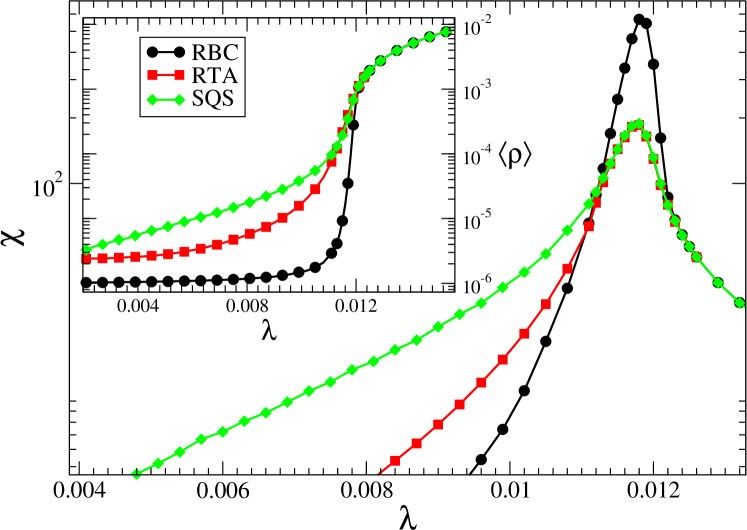
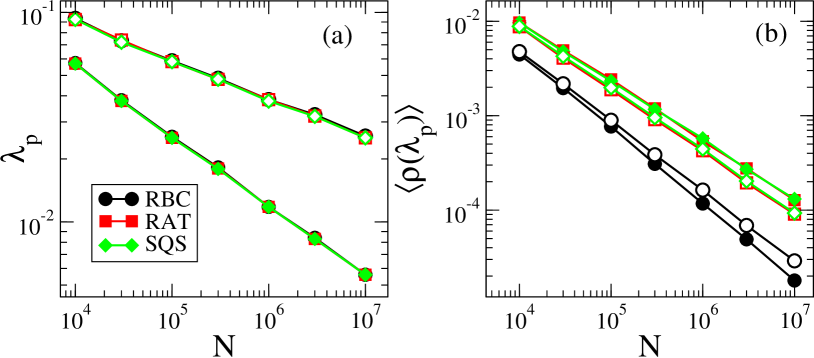
Figure 5 presents the susceptibility and QS epidemic prevalence versus infection rate computed using different SQS methods on power-law networks with vertices and degree exponent . The corresponding curves for are qualitatively similar and not shown for sake of brevity. Curves for the RAT method deviate from the SQS ones only for the very subcritical phase while the RBC deviates on both the subcritical and critical phases. All methods are equivalent in the very supercritical region since absorbing states are not visited for the investigated simulation times. Figure 6 presents the FSS of the epidemic thresholds and QS prevalence, considering two values and 2.8. All methods provide equivalent epidemic thresholds with the same scaling for both values, while the scaling of the prevalence using RBC deviates from RAT and SQS method; the last two match each other almost perfectly.
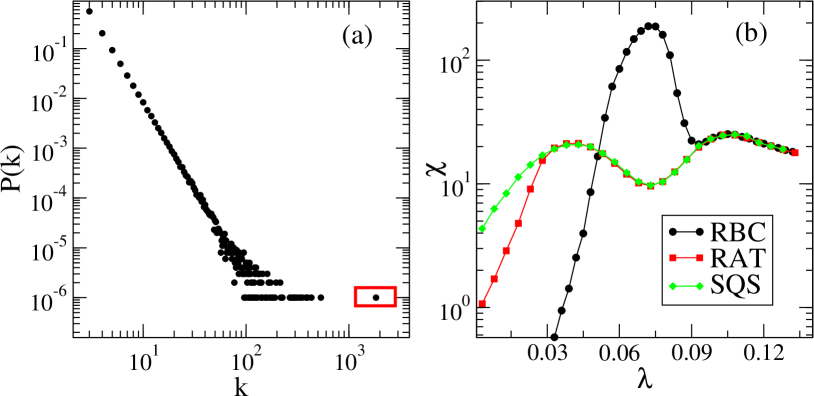
To tackle stronger localization effects, simulations on a synthetic network with vertices and degree exponent was considered. We selected a sample with an outlier of degree , as can be seen in the degree distribution in Fig. 7(a). Comparing curves obtained with different methods in Fig. 7(b), similarly to the case of a RRN plus a hub, RAT and SQS methods are equivalent except in a very subcritical region while RBC deviates substantially in the whole interval of where epidemic activity is highly concentrated in the outlier’s neighborhood, including the position of the peak which is significantly displaced. All methods match in the secondary peak that corresponds to the global activation of the epidemics since falling into the absorbing state is extremely rare, due to activation of the hub.
III.3 Multiplex networks
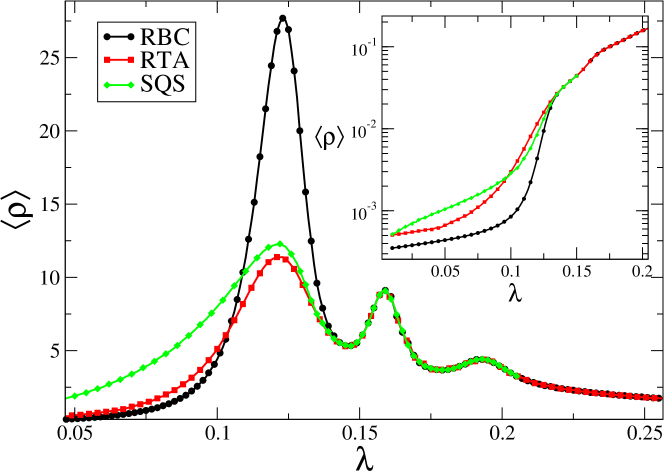
Simulations of the SIS model on multiplex networks show that multiple transitions related to the activation of each layer individually take place for a sufficiently small ratio [16]. So, multiplex networks are perfect substrates to investigate localization. Figure 8 compares the susceptibility curves for a multiplex network with three layers with power-law degree distributions of exponents , , and . Each layer has vertices while the ratio and minimal degree were fixed, such that the layer with smaller degree exponent is activated first. All QS methods capture the transitions in each layer, approximately at the same position. Small differences between SQS and RAT curves are observed before the activation of the first layer () whereas RBC deviates strongly also around the first susceptibility peak.
III.4 Real networks
We performed simulations of the SIS model on some real networks that, differently from UCM, present degree correlations. Six networks were chosen from Ref. [43] based on exotic behaviors of the susceptibility curves generated with the SQS method. Some important properties of the networks are shown in Table 1. The Pearson coefficient defined as [44]
| (18) |
in which the adjacency if vertices and are connected and otherwise, quantify the overall network topological correlations. It lays within the interval , in which positive, null and negative values are related to assortative, neutral and disassortative mixing, respectively [44]. The modularity coefficient lays in the range and quantifies the structure of communities present in the network [44, 40]. The higher modularity coefficient the more significant are the connections among individuals of a same community. The selected networks present a wide range of sizes, heterogeneities (quantified by [40]), degree correlations (related to ) and are highly modular. Highly modular structures with connectivities within modules differing from each other are expected to present independent activation of the communities and multiple peaks in susceptibility curves [15, 45].
| Network | N | ||||
|---|---|---|---|---|---|
| USPowerGrid | 4941 | 2.66 | 10.33 | 0.003 | 0.935 |
| GR-QC-1993-2003 | 4158 | 6.46 | 116.1 | 0.639 | 0.848 |
| Cora | 23166 | 7.69 | 182.3 | -0.055 | 0.790 |
| DBLP-Colab | 1137114 | 8.82 | 366.6 | 0.096 | 0.751 |
| USPatents | 3764117 | 8.77 | 187.8 | 0.167 | 0.812 |
| WebStanford | 255265 | 15.21 | 30897 | -0.115 | 0.920 |
As observed in Fig. 9, all QS methods are able to capture the same number peaks and approximately at the same location. However, as reported for synthetic networks, the RBC distorts the first susceptibility peak whereas RAT matches the SQS curves.
IV Comparison on the computer efficiencies of QS methods
We now discuss the computational complexity of the QS methods. The RAT computational complexity is expected to lie between the other methods. We analyze two key ingredients of computational complexity: RAM load and CPU time. Simulations of the SIS model on UCM networks for (the position of the maximum value of the susceptibility curves) were run on a workstation with an Intel i5 8400 - 2.80 GHz processor and 8 GB of RAM memory. Besides its physical relevance, the choice of the transition point is because simulations below it are not computationally demanding while above it the QS methods become expendable since the absorbing state is almost never visited. Codes were written in Fortran 90 and compiled using a non-commercial version of the Intel Fortran for Linux. Codes for QS simulations of SIS using RAT were made available [46] in both Fortran 90 and Python.
We evaluated the amount of RAM necessary to simulate the SIS model on a UCM network of degree exponent and size . For the SQS simulations with stored copies, up to GB of RAM memory were necessary while for RAT and RBC methods it did not exceed GB. This difference is due to the array to store several copies of the system configurations in the SQS method which are replaced by a simple array with elements to store the activity times in RAT. In SIS simulations, one could use an array smaller than since only the labels of the infected vertices have to be recorded to restart the simulation with a stored configuration. However, we performed this test considering the full array which is necessary for other dynamical processes as, for example, those with infinitely many absorbing states [47, 48] or other epidemic processes [22].
Comparing CPU times of the SIS dynamics running for a total time misleadingly favors RBC, that takes a considerably shorter CPU time than RAT and SQS, which, in turn, are similar. Note, however, that the number of active vertices of the RBC near to the activation transition () is much smaller than in RAT and SQS which are essentially the same; see Fig. 6. Since the time step is larger for a lower number of active vertices, Eq. (14), less operations by unity of time are executed. A side effect is that much less configurations are visited by unit of time and simulations using RBC are noisier than RAT for the same averaging time. For a fair comparison, we performed QS simulations of SIS at using UCM networks of different sizes and considering the same relaxation time . Then, we computed the averages over more time steps (not time units), remarking that the size is not the same for the different QS methods. In other words, the same statistics requires different averaging times for different methods. The CPU times presented in table 2 shows that all methods possess similar efficiencies where RBC is the most efficient while RAT outperforms SQS.
| Size | RBC | RAT | SQS |
|---|---|---|---|
The SQS method has two parameters ( and ) more than RBC and RAT, which are used for saving and replacing copies of previously visited configurations. A poor sampling may trap the dynamic onto metastable states leading to spurious behaviors, particularly common in, but not restricted to, subcritical simulations. Such an effect can be seen in Figs. 9(a), (c) and (d) where non-smooth susceptibility curves are observed before the first activation transition. Finally, the code implementation for RAT is algorithmically much less complex than SQS method since the update of the list with previous configurations is replaced by a simple operation when vertex is inactivated.
V Conclusions and prospects
Dynamical processes with absorbing configurations, which once visited trap the dynamics indefinitely [9], are relevant for many biological, chemical and physical systems. In particular, the study of these processes on non-regular structures, such as complex networks [1], constitutes an interdisciplinary issue with applications to real cases [7, 49, 50, 51]. Considering spreading on networks [11], computational simulation is a central actor in the validation of approximated theories and in the setting up of new insights on open discussions and interpretations [32, 14, 52, 23, 22].
Simulations of active steady-states for dynamics with absorbing configurations on finite-size systems and its extrapolation to the thermodynamic limit constitute a challenge since the system always visits an absorbing state for sufficiently long times [9]. To circumvent this difficulty, one relies on the QS analysis consisting of a perturbation of the dynamical rules, negligible in the thermodynamic limit, which prevents the system from getting trapped into the absorbing states. There are different methods to avoid the absorbing configurations such as the SQS method [28] (section II.1), which constrains the sampling to active configurations, and the RBC [24] (section II.2), in which the system returns to the pre-absorbing configuration when absorbing one is visited. In the case of complex networks, which are highly heterogeneous, the localization on subextensive regions imposes further difficulties in the analysis of QS states [15, 19]. While, on the one hand, the SQS is most general and able to capture localized phases of epidemics on networks [15, 16, 30], it has high computational and algorithmic complexity. On the other hand, RBC is simpler but may distort localized phases detected with SQS.
In order to soften these drawbacks, we introduced the method called RAT (reactivation per activation time) intended to succeed where the SQS does but preserving as much as possible the algorithmic simplicity and lower computational complexity of RBC. The method consists of reactivating vertices proportionally to the amount of time they were active along the whole history of the simulations. In the case of epidemic models, the activity is defined as the total time that a vertex remains infected. This method can easily be generalized to other dynamical processes.
The RAT method was applied to the SIS model on a variety of complex networks, which are characterized by strong localization effects [16, 19, 15] and compared with the RBC and SQS methods. We report that all methods provide the same epidemic threshold on multiplex and uncorrelated scale-free networks (degree exponent ) but the finite-size scaling of the critical epidemic prevalence (density of active vertices at the threshold) of RBC differs of both SQS and RAT that match each other. Considering random networks with outliers in the degree distribution, we report that RAT is able to capture the same localized activity as does the SQS, particularly in the cases where the RBC method deviates substantially from SQS. Finally, simulations on real networks with degree correlations and very complex localization patterns for SIS dynamics support the equivalence of SQS and RAT while RBC distorts the localized activation at low infection rates. Regarding the computational complexity, we observed that the RAM load of RAT is highly reduced compared to SQS while the CPU times near to the transition point are slightly smaller. Also, it worths remarking that RAT is algorithmically simpler than SQS.
Although the RAT method was thoroughly tested for binary dynamics (only two states) in this work, it can be extended to other cases by introducing some procedures that depend on the model’s details. For example, in the susceptible-infected-recovered-susceptible (SIRS) dynamics on networks [22], a modification of the SIS in which a healed vertex becomes immune (state R) to contagion and returns to the susceptible state with some fixed rate, the reactivation must be done immediately after the last infected vertex is healed, despite the rule still permits the spontaneous transitions RS. As in the binary dynamics, the reactivation is done according to Eqs. (5) and (6). However, instead of introducing active vertices in a configuration in which all vertices are susceptible, one has to use the state reached just after healing the last infected vertex. We expect that the RAT method will be extended to QS analyses of many other processes. An interesting future prospect is to consider more complicated dynamics with infinitely many absorbing states such as sandpile models [53, 54] and pair-contact process [55] and systems with bistability which undergo discontinuous transitions [56].
Acknowledgements.
We thank M. M de Oliveira, D. H. Silva and W. Cota for comments and suggestions. This work was partially supported by the Brazilian agencies Conselho Nacional de Desenvolvimento Científico e Tecnológico- CNPq (Grants no. 430768/2018-4 and 311183/2019-0) and Fundação de Amparo à Pesquisa do Estado de Minas Gerais - FAPEMIG (Grant no. APQ-02393-18). This study was financed in part by the Coordenação de Aperfeiçoamento de Pessoal de Nível Superior (CAPES) - Brasil - Finance Code 001.References
- Barrat et al. [2008] A. Barrat, M. Barthelemy, and A. Vespignani, Dyn. Process. Complex Networks, 1st ed. (Cambridge University Press, Cambridge,UK, 2008).
- Cota et al. [2019] W. Cota, S. C. Ferreira, R. Pastor-Satorras, and M. Starnini, Quantifying echo chamber effects in information spreading over political communication networks, EPJ Data Sci. 8, 35 (2019).
- Yang et al. [2020] L. Yang, Z. Li, and A. Giua, Containment of rumor spread in complex social networks, Inf. Sci. (Ny). 506, 113 (2020).
- Halu et al. [2019] A. Halu, M. De Domenico, A. Arenas, and A. Sharma, The multiplex network of human diseases, npj Syst. Biol. Appl. 5, 15 (2019).
- Gleeson et al. [2016] J. P. Gleeson, K. P. O’Sullivan, R. A. Baños, and Y. Moreno, Effects of Network Structure, Competition and Memory Time on Social Spreading Phenomena, Phys. Rev. X 6, 021019 (2016).
- Soriano-Paños et al. [2018] D. Soriano-Paños, L. Lotero, A. Arenas, and J. Gómez-Gardeñes, Spreading Processes in Multiplex Metapopulations Containing Different Mobility Networks, Phys. Rev. X 8, 031039 (2018).
- Depersin and Barthelemy [2018] J. Depersin and M. Barthelemy, From global scaling to the dynamics of individual cities, Proc. Natl. Acad. Sci. U. S. A. 115, 2317 (2018).
- Carra and Barthelemy [2019] G. Carra and M. Barthelemy, A fundamental diagram of urbanization, Environ. Plan. B Urban Anal. City Sci. 46, 690 (2019).
- Marro and Dickman [1999] J. Marro and R. Dickman, Nonequilibrium Phase Transitions in Lattice Models (Cambridge University Press, Cambridge,UK, 1999).
- Henkel et al. [2008] M. Henkel, M. Pleimling, H. Hinrichsen, and S. Lübeck, Non-Equilibrium Phase Transitions, Vol. 2 (Springer Netherlands, Dordrecht, 2008).
- Pastor-Satorras et al. [2015] R. Pastor-Satorras, C. Castellano, P. Van Mieghem, and A. Vespignani, Epidemic processes in complex networks, Rev. Mod. Phys. 87, 925 (2015).
- Anderson and May [1991] R. M. Anderson and R. M. May, Infectious diseases of humans: dynamics and control (Oxford Univ. Press, Oxford, 1991) oCLC: 844937291.
- Chatterjee and Durrett [2009] S. Chatterjee and R. Durrett, Contact processes on random graphs with power law degree distributions have critical value 0, Ann. Probab. 37, 2332 (2009).
- Boguñá et al. [2013] M. Boguñá, C. Castellano, and R. Pastor-Satorras, Nature of the Epidemic Threshold for the Susceptible-Infected-Susceptible Dynamics in Networks, Phys. Rev. Lett. 111, 068701 (2013).
- Mata and Ferreira [2015] A. S. Mata and S. C. Ferreira, Multiple transitions of the susceptible-infected-susceptible epidemic model on complex networks, Phys. Rev. E 91, 012816 (2015).
- de Arruda et al. [2017] G. F. de Arruda, E. Cozzo, T. P. Peixoto, F. A. Rodrigues, and Y. Moreno, Disease Localization in Multilayer Networks, Phys. Rev. X 7, 011014 (2017).
- Moretti and Muñoz [2013] P. Moretti and M. A. Muñoz, Griffiths phases and the stretching of criticality in brain networks, Nat. Commun. 4, 2521 (2013).
- Wei and Wang [2020] Z. W. Wei and B. H. Wang, Susceptible-infected-susceptible model on networks with eigenvector localization, Phys. Rev. E 101, 042310 (2020).
- Silva and Ferreira [2021] D. H. Silva and S. C. Ferreira, Dissecting localization phenomena of dynamical processes on networks, J. Phys. Complex. 1, 1 (2021).
- Kitsak et al. [2010] M. Kitsak, L. K. Gallos, S. Havlin, F. Liljeros, L. Muchnik, H. E. Stanley, and H. A. Makse, Identification of influential spreaders in complex networks, Nat. Phys. 6, 888 (2010).
- Castellano and Pastor-Satorras [2012] C. Castellano and R. Pastor-Satorras, Competing activation mechanisms in epidemics on networks, Sci. Rep. 2, 371 (2012).
- Ferreira et al. [2016a] S. C. Ferreira, R. S. Sander, and R. Pastor-Satorras, Collective versus hub activation of epidemic phases on networks, Phys. Rev. E 93, 032314 (2016a).
- Pastor-Satorras and Castellano [2018] R. Pastor-Satorras and C. Castellano, Eigenvector Localization in Real Networks and Its Implications for Epidemic Spreading, J. Stat. Phys. 173, 1110 (2018).
- Sander et al. [2016] R. S. Sander, G. S. Costa, and S. C. Ferreira, Sampling methods for the quasistationary regime of epidemic processes on regular and complex networks, Phys. Rev. E 94, 042308 (2016).
- Lübeck and Heger [2003] S. Lübeck and P. C. Heger, Universal finite-size scaling behavior and universal dynamical scaling behavior of absorbing phase transitions with a conserved field, Phys. Rev. E 68, 056102 (2003).
- Pruessner [2007] G. Pruessner, Equivalence of conditional and external field ensembles in absorbing-state phase transitions, Phys. Rev. E 76, 061103 (2007).
- Dickman et al. [2002] R. Dickman, T. Tomé, and M. J. de Oliveira, Sandpiles with height restrictions, Phys. Rev. E 66, 016111 (2002).
- de Oliveira and Dickman [2005] M. M. de Oliveira and R. Dickman, How to simulate the quasistationary state, Phys. Rev. E 71, 016129 (2005).
- Valdano et al. [2018] E. Valdano, M. R. Fiorentin, C. Poletto, and V. Colizza, Epidemic Threshold in Continuous-Time Evolving Networks, Phys. Rev. Lett. 120, 068302 (2018).
- Cota et al. [2016] W. Cota, S. C. Ferreira, and G. Ódor, Griffiths effects of the susceptible-infected-susceptible epidemic model on random power-law networks, Phys. Rev. E 93, 032322 (2016).
- Ferreira et al. [2016b] R. S. Ferreira, R. A. da Costa, S. N. Dorogovtsev, and J. F. F. Mendes, Metastable localization of diseases in complex networks, Phys. Rev. E 94, 062305 (2016b).
- St-Onge et al. [2018] G. St-Onge, J.-G. Young, E. Laurence, C. Murphy, and L. J. Dubé, Phase transition of the susceptible-infected-susceptible dynamics on time-varying configuration model networks, Phys. Rev. E 97, 022305 (2018).
- Lee et al. [2013] H. K. Lee, P.-S. Shim, and J. D. Noh, Epidemic threshold of the susceptible-infected-susceptible model on complex networks, Phys. Rev. E 87, 062812 (2013).
- Bianconi [2018] G. Bianconi, Multilayer Networks (Oxford University Press, Oxford, 2018).
- Dickman and Kamphorst Leal da Silva [1998] R. Dickman and J. Kamphorst Leal da Silva, Moment ratios for absorbing-state phase transitions, Phys. Rev. E 58, 4266 (1998).
- Blanchet et al. [2016] J. Blanchet, P. Glynn, and S. Zheng, Analysis of a stochastic approximation algorithm for computing quasi-stationary distributions, Adv. Appl. Probab. 48, 792 (2016).
- Cota and Ferreira [2017] W. Cota and S. C. Ferreira, Optimized Gillespie algorithms for the simulation of Markovian epidemic processes on large and heterogeneous networks, Comput. Phys. Commun. 219, 303 (2017).
- St-Onge et al. [2019] G. St-Onge, J.-G. Young, L. Hébert-Dufresne, and L. J. Dubé, Efficient sampling of spreading processes on complex networks using a composition and rejection algorithm, Comput. Phys. Commun. 240, 30 (2019).
- Ferreira and Ferreira [2013] R. S. Ferreira and S. C. Ferreira, Critical behavior of the contact process on small-world networks, Eur. Phys. J. B 86, 462 (2013).
- Barabási and Pósfai [2016] A.-L. Barabási and M. Pósfai, Network science (Cambridge University Press, Cambridge, UK, 2016).
- Catanzaro et al. [2005] M. Catanzaro, M. Boguñá, and R. Pastor-Satorras, Generation of uncorrelated random scale-free networks, Phys. Rev. E 71, 027103 (2005).
- Boguñá et al. [2004] M. Boguñá, R. Pastor-Satorras, and A. Vespignani, Cut-offs and finite size effects in scale-free networks, Eur. Phys. J. B 38, 205 (2004).
- Radicchi and Castellano [2015] F. Radicchi and C. Castellano, Breaking of the site-bond percolation universality in networks, Nat. Commun. 6, 10196 (2015).
- Newman [2010] M. Newman, Networks An Introdution (Oxford University Press, Oxford, 2010).
- Cota et al. [2018] W. Cota, G. Ódor, and S. C. Ferreira, Griffiths phases in infinite-dimensional, non-hierarchical modular networks, Sci. Rep. 8, 9144 (2018).
- [46] Codes are freely available at https://github.com/ghscosta/qsmethods.
- Goh et al. [2003] K.-I. Goh, D.-S. Lee, B. Kahng, and D. Kim, Sandpile on Scale-Free Networks, Phys. Rev. Lett. 91, 148701 (2003).
- Sander et al. [2013] R. S. Sander, S. C. Ferreira, and R. Pastor-Satorras, Phase transitions with infinitely many absorbing states in complex networks, Phys. Rev. E 87, 022820 (2013).
- Zhang et al. [2017] Q. Zhang, K. Sun, M. Chinazzi, A. Pastore y Piontti, N. E. Dean, D. P. Rojas, S. Merler, D. Mistry, P. Poletti, L. Rossi, M. Bray, M. E. Halloran, I. M. Longini, and A. Vespignani, Spread of Zika virus in the Americas, Proc. Natl. Acad. Sci. 114, E4334 (2017).
- Merler et al. [2016] S. Merler, M. Ajelli, L. Fumanelli, S. Parlamento, A. Pastore y Piontti, N. E. Dean, G. Putoto, D. Carraro, I. M. Longini, M. E. Halloran, and A. Vespignani, Containing Ebola at the Source with Ring Vaccination, PLoS Negl. Trop. Dis. 10, e0005093 (2016).
- Costa et al. [2020] G. S. Costa, W. Cota, and S. C. Ferreira, Outbreak diversity in epidemic waves propagating through distinct geographical scales, Phys. Rev. Res. 2, 043306 (2020).
- Silva et al. [2019] D. H. Silva, S. C. Ferreira, W. Cota, R. Pastor-Satorras, and C. Castellano, Spectral properties and the accuracy of mean-field approaches for epidemics on correlated power-law networks, Phys. Rev. Res. 1, 033024 (2019).
- Manna [1991] S. S. Manna, Two-state model of self-organized criticality, J. Phys. A. Math. Gen. 24, L363 (1991).
- Dickman et al. [2001] R. Dickman, M. Alava, M. A. Muñoz, J. Peltola, A. Vespignani, and S. Zapperi, Critical behavior of a one-dimensional fixed-energy stochastic sandpile, Phys. Rev. E 64, 056104 (2001).
- Lubeck et al. [2002] S. Lubeck, R. D. Willmann, S. L beck, and R. D. Willmann, Universal scaling behaviour of directed percolation and the pair contact process in an external field, J. Phys. A. Math. Gen. 35, 10205 (2002).
- de Oliveira et al. [2015] M. M. de Oliveira, M. G. E. da Luz, and C. E. Fiore, Generic finite size scaling for discontinuous nonequilibrium phase transitions into absorbing states, Phys. Rev. E 92 (2015).