∎
e1e-mail: Derek.Glazier@glasgow.ac.uk
Single Production Off Neutrons Bound in Deuteron with Linearly Polarized Photons
Abstract
The quasifree photon beam asymmetry, , has been measured at photon energies, , from 390 to 610 MeV, corresponding to center of mass energy from 1.271 to 1.424 GeV, for the first time. The data were collected in the A2 hall of the MAMI electron beam facility with the Crystal Ball and TAPS calorimeters covering pion center-of-mass angles from 49 to 148. In this kinematic region, polarization observables are sensitive to contributions from the and resonances. The extracted values of have been compared to predictions based on partial-wave analyses (PWAs) of the existing pion photoproduction database. Our comparison includes the SAID, MAID, and Bonn-Gatchina analyses; while a revised SAID fit, including the new measurements, has also been performed. In addition, isospin symmetry is examined as a way to predict photoproduction observables, based on fits to published data in the channels , , and .
pacs:
13.60.Le Meson production 13.88.+e Polarization in interactions and scattering1 Introduction
Knowledge of the and resonance decay couplings to nucleons and photons is largely restricted to charged states. Increasing the body of neutron-target measurements will allow a more highly constrained study of neutral states and their couplings. The four charge channels (, , , and ) of pion photoproduction can be described in terms of three isospin amplitudes. This gives the possibility of predicting properties of one channel based on sufficiently detailed measurements of the other three. The channel is the least-studied and was the subject of this experiment.
Most existing data are unpolarized and provide around 1900 photoproduction data points, spanning the full nucleon resonance region Ireland:2019uwn (Table 1). The beam asymmetry, , was previously measured by the GRAAL Collaboration DiSalvo:2009zz . The beam asymmetry measures the relative strength of the production with respect to the plane of photon linear polarisation. Their measurements covered beam energy, , from 703 to 1475 MeV, corresponding to a centre-of-mass energy, , range from 1.484 to 1.912 GeV, just above the current results.
Recently, the A2 Collaboration at MAMI published high-quality unpolarized measurements for photoproduction off a neutron below = 813 MeV Briscoe:2019cyo . The present data extend the range of the previous GRAAL polarized measurements DiSalvo:2009zz , for photoproduction. Further A2 Collaboration measurements of the asymmetry, with longitudinal polarized target and circularly polarized photons, for = 216 – 1606 MeV Costanza:2020wnx , extend previous A2 measurements Dieterle:2017myg . These data will provide the basis for better-constrained decay amplitudes in the near future.
Apart from lower-energy inverse reaction measurements, the extraction of the two-body and observables requires the use of a model-dependent nuclear correction, which mainly comes from final-state interaction (FSI) effects. In several papers, the GWU-ITEP group have shown that the FSI corrections on unpolarized cross sections are less than 20% (see, for instance, Refs. Tarasov:2011ec ; Mattione:2017fxc ; Tarasov:2015sta ). As polarization asymmetries measure ratios of cross sections, FSI effects are expected to have a considerably smaller effect on these, including , and will be comparable, or less than our quoted systematic uncertainties from experimental sources. In this publication, for the neutron bound in a deuteron is presented uncorrected for potential FSI effects so as not to add any model dependence to the results.
| Observable | Nexp | Ndata | Eγ(min) | Eγ(max) | (min) | (max) | Laboratory | Ref |
|---|---|---|---|---|---|---|---|---|
| (MeV) | (MeV) | () | () | |||||
| 9 | 9 | 208 | 373 | 147 | 148 | MAMI | Kossert:2003zf | |
| 27 | 492 | 290 | 813 | 18 | 162 | MAMI | Briscoe:2019cyo | |
| 40 | 43 | 299 | 889 | 70 | 130 | Tokyo | Ando:1977aa | |
| 49 | 931 | 446 | 1427 | 32 | 162 | MAMI | Dieterle:2018adj | |
| 42 | 42 | 455 | 905 | 45 | 143 | Tokyo | Hemmi:1973ii | |
| 35 | 35 | 462 | 784 | 60 | 135 | Frascati | Bacci:1972bh | |
| 3 | 28 | 911 | 1390 | 3 | 91 | SLAC | Clinesmith:1967zn | |
| 27 | 216 | 703 | 1475 | 53 | 164 | GRAAL | DiSalvo:2009zz | |
| 17 | 151 | 446 | 1427 | 46 | 154 | MAMI | Dieterle:2017myg |
The organization for this paper is as follows. In Section 2, details of the A2 experiment and detectors are given; Section 3 outlines the event selection; Section 4 reviews the background subtraction; Section 5 covers the determination of the photon asymmetry; and Section 6 outlines the dominant sources of systematic uncertainty; Section 7 outlines the PWA methods used in the fits and predictions compared to data. Finally, Section 8 presents the results and interpretation of the present A2 data.
2 Experiment
The reaction d n(p) was measured at the Mainzer Microtron (MAMI) electron accelerator facility, in August 2016. The 1.5 GeV MAMI electron beam, incident on an aligned diamond radiator, produced a photon beam via coherent bremsstrahlung, with significant linear polarization up to photon energies of MeV. The energy of the photon beam was measured using the Glasgow-Mainz Tagged Photon Spectrometer with a resolution of around MeV. This spectrometer measured the position of the degraded post-bremsstrahlung electron on a plastic scintillator focal plane consisting of 353 elements after traversing a 1.8 T magnetic dipole field McGeorge:2007tg . The energy of the detected electron, and therefore also the energy of the photon, was deduced from this position.
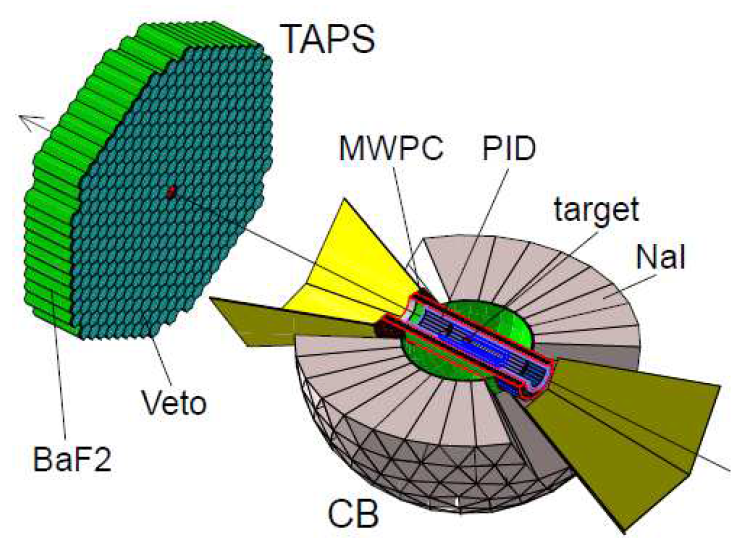
The photon beam interacted in a 10 cm long liquid deuterium target (). The reaction products were detected in two calorimeters: the Crystal Ball (CB), a highly segmented array of 672 NaI(Tl) crystals arranged in a sphere centered on the target cell Starostin:2001zz ; and the TAPS calorimeter, a forward wall of 366 BaF2 and 72 PbWO4 crystals arranged 1.5 m downstream from the CB center Gabler:1994ay (Fig. 1). The CB covers lab. frame angles 21 and TAPS approximately . The target cell was surrounded by a Particle Identification Detector (PID) consisting of 24, 30 cm long plastic scintillators arranged in a cylindrical formation. This allowed separation of reactions with a scattered neutron from those with a proton. A Multi-Wire Proportional Chamber barrel (MWPC) provided tracking information for charged particles which were not used for the all-neutral final state investigated here, however here they provided additional proton rejection. Charge particle identification was provided in the case of the TAPS detector by a thin plastic veto layer in front of each crystal. In addition, a 2.6 cm thick graphite cylinder was situated between the PID and the MWPC to be used as the analysing material for a nucleon polarimeter Bashkanov:2019mpj , and was not required for this analysis Mullen:2020fgd .
All simulations used in this analysis were performed with a full detector model using the Geant4 GEANT4 toolkit.
The linear polarization of the photons was produced by coherent bremsstrahlung Lohmann:1994vz ; Timm:1969mf , with the electron beam scattered coherently from an aligned radiator. A thin diamond crystal (30 m) with low mosaic-structure was used to minimize the energy smearing of the coherent spectrum arising from electron multiple scattering effects and crystal defects in the lattice Kellie:2005wy . The alignment of the diamond was carried out using the Stonehenge technique Livingston:2008hv with two orthogonal polarization plane orientations chosen to be at azimuthal angles of with respect to the equatorial plane of the CB detector. To increase the degree of linear polarization a 2 mm diameter Pb-collimator was installed 2.5 m downstream of the radiator, enhancing the ratio of coherent to incoherently scattered photons that reached the . The degree of linear polarization was determined by calibrating against the linearly polarized photon beam asymmetry for production off the proton. This was measured for each photon energy bin and compared to a recent SAID PWA solution including recent high statistics measurements in the same energy range Gardner:2016irh . The ratio of the measured asymmetry to the SAID values gave the photon polarization for each energy bin. The analysis of the proton asymmetry was performed in the same manner as the neutron asymmetry described here. The resulting photon polarization ranged from at = 390 MeV to a maximum of at 610 MeV Mullen:2020fgd .
3 Data Analysis
The photon asymmetry, , for the reaction d n(p) has been measured for beam energies in the range 390 – 610 MeV and a center-of-mass (c.m.) production angle, , range of 49 – 148. The semi-inclusive final state of interest included the recoiling neutron and , and omitted the spectator proton. It was identified by detecting three neutral particles, two s stemming from the decay of the , and a neutron as the third. The energy of the three particles was measured by the CB and TAPS calorimeters which, in coincidence with a tagged photon, allowed the reaction to be reconstructed. The classification of a neutral state was made if there were no hits in the PID or MWPC detectors for the CB or the TAPS veto layer. The spectator proton was not considered as it typically did not have sufficient energy to reach the calorimeters. The was reconstructed from the combination of two of the three particles detected. All combinations were considered, and any incorrect 2 combinations were removed, either by subsequent cuts or by background subtraction.
| Variable | Cut Range | Units |
|---|---|---|
| Tagged Time | < t < 20 | ns |
| Coplanarity | -50 < < 50 | degree |
| Missing Mass | 1850 < Mmiss < 2300 | MeV/c2 |
| Cone Angle | 0 < < 0.5 | radian |
| Invariant Mass | 80 < Minv < 200 | MeV/c2 |
| Spectator Momentum | 0 < < 200 | MeV/ |
Preliminary cuts were placed on a number of variables. These were guided by simulated signal and background channels to ensure no actual signal was lost and are given in Table 2. The missing mass was constructed using the mass of the missing 4-momentum defined as:
| (1) |
where Pbeam is the 4-momentum for the beam photon, Pd is the 4-momentum of the stationary deuterium target, and P is the 4-momentum of the detected . The mass of this missing 4-momentum gave a peak distributed around the summed mass of the two nucleons with some extra smearing from initial Fermi motion within the deuteron. When this initial momentum was low, as was generally the case, the resulting spectator proton momentum was also low and the reaction was approximately two-body with the and participant nucleon being nearly coplanar in :
| (2) |
where is the reconstructed azimuthal angle of the and the azimuthal angle of the detected neutron after rotation by around the z-axis.
The detection of the and the neutron allowed the construction of the difference between the detected nucleon polar angle and the nucleon polar angle reconstructed from the assuming a stationary initial state neutron. This gives the definition of the “Cone Angle”, .
The momentum of the spectator proton was also used to distinguish the quasi-free final state. It was calculated via:
| (3) |
where is the 4-momentum of the detected participant nucleon. The magnitude of momentum for the participant nucleon was calculated using conservation of momentum and energy in the three-body final state, using the measured momentum and the neutron direction, as given by its cluster hit position in the CB.
4 Background Subtractions
To further isolate the true n final state, several sources of background had to be subtracted from the selected events. The main sources of these backgrounds were: random electrons in the photon tagger; background to the two photon combination giving the ; and other reactions producing the same detected particles as the n(p) reaction. The sPlot technique was used to remove these background events using a separate discriminatory variable for each source to produce event-by-event weights termed sWeights, for full details see Pivk:2004ty . The sWeights are normalized using the relative yields and covariance matrix of the signal and background derived from the fits. Weights corresponding to regions of high background are negative and effectively subtract off this contribution to the distribution. This is similar to how a “sideband subtraction” method works, but is more generally applicable. Consecutive fits were performed applying the sWeights from the previous fit. An sPlot fit to the discriminatory variables using appropriate probability density functions (PDFs) derived from simulated event samples, determined the yields of the different event species. The covariance matrix of this yield fit was then used to calculate the sWeights associated with each event in the fitted sample. Including these sWeights in the subsequent observable fits allowed determination of the photon asymmetry for our signal. The fits to the discriminatory variables are described in the following sections.
4.1 Random Tagged Photons
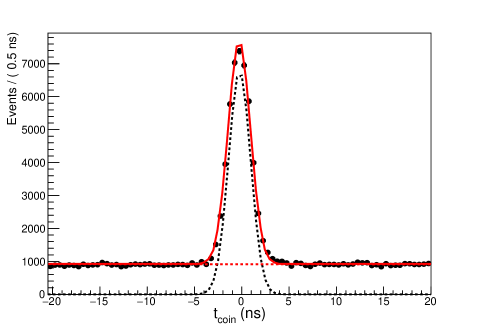
Random coincidences with background electrons in the photon tagger were removed via the coincidence time between the and the tagged beam photon as given by:
| (4) |
with the time of the electron in the tagger, and the time in the calorimeters of the 2 photons . This resulted in a timing distribution strongly peaked at zero with a flat random background, as shown in Fig. 2 for the bin MeV and . In this case, a Gaussian PDF was used for the signal with a uniform background function.
4.2 Background in Invariant Mass
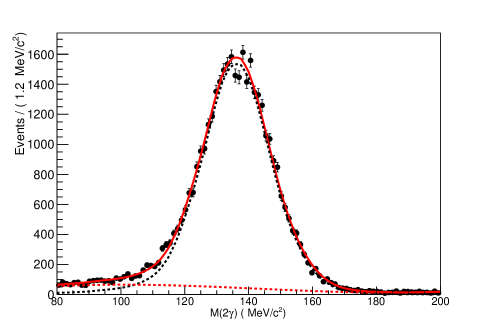
Background to real decays in the two invariant mass distribution can arise from a wrong combination of the three neutral clusters, or multiple clusters created by one actual particle. These background sources will not give a peaking structure in the invariant mass distribution and were thus subtracted using the sPlot technique. The signal PDF was taken from a histogram template of simulated events, while the background was modelled by a third order Chebychev polynomial. An example fit is shown for the bin MeV and in Fig. 3. In this mass range, the signal was typically around of the total events.
4.3 Background to the n(p) final state
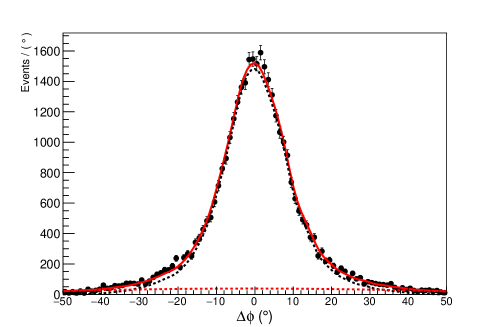
Background to the final state may come, for example, from events in which more than one pion is produced. This background is reduced with the loose cuts given in Table 2. To determine the sWeights for subtracting the residual background, the coplanarity given in Eq. 2 was used. The signal PDF shape was given by simulated data and the background by a second order Chebychev polynomial. The resulting fit, for the bin MeV and , is shown in Fig. 4.
5 Determination of the Photon Asymmetry
The photon asymmetry, , quantifies the effect of the polarization of the beam on the excitation of the neutron and its subsequent decay to a pion and nucleon. With a linearly polarized photon beam the differential cross section is
| (5) |
where is the azimuthal angle of the meson production plane relative to the plane of linear polarization and is the degree of linear polarization. Rotating the orientation of the diamond radiator allowed the plane of linear polarization to flip between and . Shifting the plane by effectively flips the sign of the asymmetry giving two polarization states .
To extract from the measured distributions unbinned extended maximum likelihood fits were performed. The fit function was given by
| (6) |
with determined from fits to be .
The negative log likelihood function given by
| (7) |
was minimized using Minuit as part of the ROOFIT Verkerke:2003ir library. Here, is the number of data events in the and bin, while subscript refers to the value of the variables for a given event. In particular, represents the value of the sWeight used to subtract background events from the likelihood summation.
The PDF normalization integral term was determined by Monte-Carlo integration using simulated data. For this, and values were randomly chosen to match the fluxes and polarization degrees of the real data. This effectively corrected for second order systematic effects due to differences in polarization state luminosity and degree of polarization.
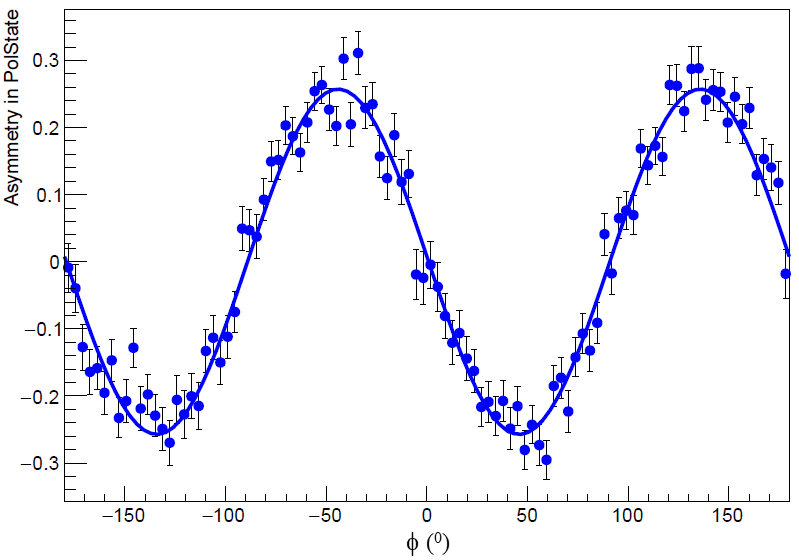
An example of the resulting fitted asymmetry in polarization state compared to the background subtracted data asymmetry, where the plotted asymmetry is calculated as,
| (8) |
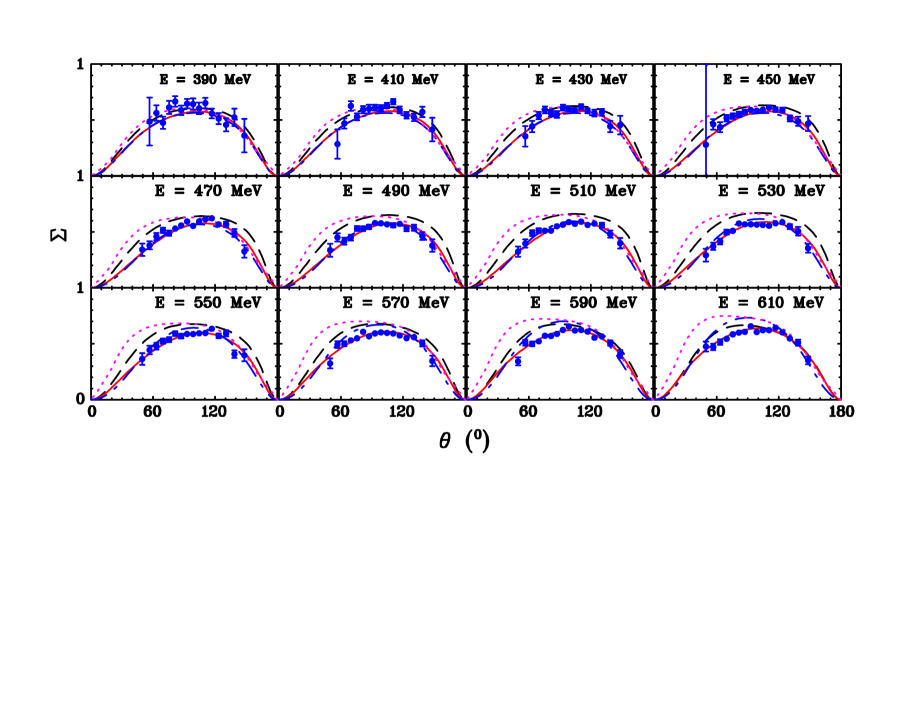
is shown in Fig. 5, for the bin MeV and , as an illustration. The fits were performed in bins of 20 MeV for and 0.1 in . Results are shown in Fig. 6 alongside solutions of various PWAs described in Section 7.
6 Systematic Uncertainties
The dominant sources of systematic uncertainty in the results came from the linear polarization calibration and the background subtraction. The fractional difference between a simple cuts-based analysis and the sPlot background subtraction methods gave an estimate of the systematic uncertainty in background subtraction method for each point. For the cuts-based analysis a similar procedure was performed but, rather than use a sPlot subtraction, tighter cuts were placed on the discriminatory variables to identify a cleaner sample of events with residual backgrounds estimated by simulations to be around 3.6. These cuts are summarised in Table 3.
| Variable | Cut Range | Units |
|---|---|---|
| Tagged Time | -5 < t < 5 | ns |
| Coplanarity | -30 < < 30 | degree |
| Missing Mass | 1850 < Mmiss < 2100 | MeV/c2 |
| Cone Angle | 0 < < 0.3 | radian |
| Invariant Mass | 110 < Minv < 160 | MeV/c2 |
| Spectator Momentum | 0 < < 200 | MeV/ |
While a cuts-only analysis retains some small amount of background, as illustrated in Figs. 3 and 4, the sPlot method is expected to remove all the background. Any error in the subtraction of the background by the weights-based method is expected to be less than the effect of not subtracting the background. Hence, the difference between extracted from the cuts and sPlot subtracted results is used as a conservative estimate of this systematic uncertainty Mullen:2020fgd . Values for this systematic uncertainty were calculated for each and bin with a mean value of . For the systematic uncertainty in the degree of linear polarization there are two factors, first the uncertainty in the SAID solution for on , which was used to determine the polarization, and was estimated to be . Second, the uncertainty on our extraction of the asymmetries which had a main contribution from the background subtraction which was estimated in a similar manner to the background subtraction and found to be . Adding these two factors in quadrature gives an overall systematic uncertainty in our results due to the linear polarization. Other uncertainties were found to be much smaller than these sources: acceptance effects, such as the neutron detection efficiency, cancel due to the polarization flip; polarization degree and luminosity asymmetries were incorporated into the likelihood fit; and unbinned fits were used, removing binning artifacts from the results.
7 Multipole Analysis
The SAID Workman:2012jf , MAID Drechsel:2007if , and Bonn-Gatchina Anisovich:2009zy analyses use different fit formalisms to extract the partial-wave (multipole) amplitudes underlying different data-sets. Comparing the different resulting amplitudes gives an estimate of the systematic errors inherent in the process.
For the MAID analysis, which was completed in 2007, the most recent data-sets have not been included and this must be considered when making comparisons Drechsel:2007if . The MAID unitary isobar approach applies a Breit-Wigner resonance plus background model, guaranteeing unitarity up to the two-pion production threshold.
The Bonn-Gatchina method fits a wider range of reactions utilizing elements of the K-matrix and P-vector approaches Anisovich:2009zy . Both pion and photo-induced reactions are included in a multi-channel fit. Reactions with three-body final states are included using an event-based likelihood fit. The elastic pion-nucleon reaction is fitted based on existing amplitudes. The various data types are fitted with the possibility of renormalization and weighting.
The SAID method is an extension of the Chew-Mandelstam K-matrix approach used to fit pion-nucleon elastic scattering and production data. The resonance spectrum is fixed from this fit Arndt:2006bf and only the photo-couplings are allowed to vary. This differs from the MAID and Bonn-Gatchina analyses, which can add new resonances to improve the agreement with data. The formalism has built-in cuts associated with the , , and thresholds but only single-pion photoproduction data are fitted. Data have been weighted and renormalized in previous fits. No weighting and only renormalization at the one percent level was utilized in fitting the present set of data.
For each angular distribution, a normalization constant () and its uncertainty () were assigned. The quantity is generally associated with the normalization uncertainty (if known). The modified function to be minimized is given by
| (9) |
where the subscript labels the data points within the distribution, is an individual measurement, is the corresponding calculated value, and represents the angular-dependent statistical uncertainty. The total is then found by summing over all measurements. This re-normalization freedom is often important in obtaining the best SAID fit results. For other data analyzed in the fit, such as the total cross sections and excitation data, the statistical and systematic uncertainties were combined in quadrature and no re-normalization was allowed.
In fitting the present set of data, an overall angle-independent systematic uncertainty of was used for in Eq. (9). The resulting values for remained within of unity on average.
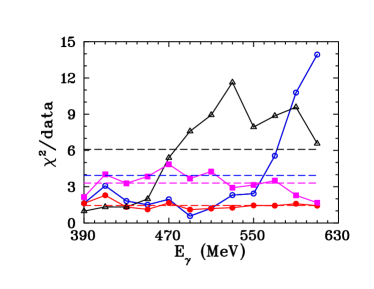
A revised SAID multipole analysis has been completed, including the present set of data. This new global energy-dependent solution has been labeled as MU22. The overall fit quality of the present MU22 and previous MA19 Briscoe:2019cyo SAID fits is compared with the MAID2007 Drechsel:2007if solution in Tables 4 and 5. The inclusion of the present A2 data set provides a fit with significantly improved , specifically at higher energies, in comparisons between the fits and data ( for MA19 = 3.93 and for MU22 = 1.44) as shown in Fig. 7 and Table 4. This demonstrates the influence of these asymmetry measurements with their small uncertainties. The overall comparison of the MA19 and MU22 solutions shows that the fit values are essentially unchanged for and channels. The per data point including all available data and the present A2 data for MA19 and MU22 (with MAID2007) is given in Table 5.
| Solution | data) |
|---|---|
| MU22 | 275/189=1.46 |
| MUXX | 624/189=3.30 |
| MA19 | 743/189=3.93 |
| MAID2007 | 1151/189=6.09 |
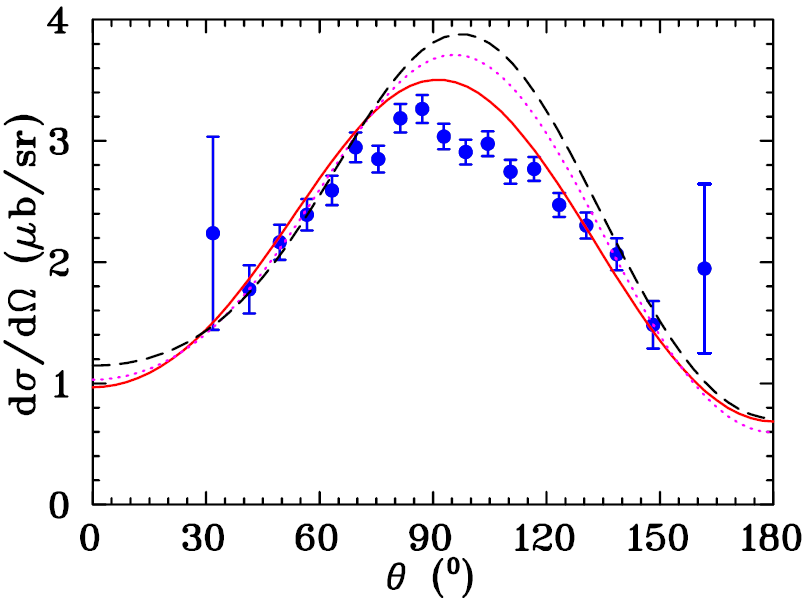
Additionally, an alternative MUXX solution was generated excluding all world data and show results in Fig. 8 and Table 4. The excellent comparison of the isospin-predicted to the data strongly suggests the systematics in the new data are well under control. The comparisons with MAID are interesting as both solutions use isospin symmetry to predict the observables based on the available data from the other three charge channels in 2007 and 2020.
| Solution | data) | data) |
|---|---|---|
| MU22 | 13274/9534=1.39 | 7454/4039=1.85 |
| MUXX | 13171/9534=1.38 | 7259/4039=1.80 |
| MA19 | 12565/9534=1.32 | 7461/4039=1.85 |
| MAID2007 | 73638/9534=7.72 | 14599/4039=3.61 |
| Solution | data) | data) |
| MU22 | 2345/ 798=2.94 | 5879/3456=1.70 |
| MUXX | 7639/ 798=9.57 | 5384/3456=1.56 |
| MA19 | 2649/ 798=3.32 | 5999/3456=1.74 |
| MAID2007 | 4846/ 798=6.07 | 15365/3456=4.45 |
8 Results and Interpretation
A comprehensive set of data for at 12 photon energies has been determined with the CB and TAPS spectrometers using a tagged photon beam at incident photon energies from 390 to 610 MeV. The present data cover the resonance region from above the maximum of the -isobar to the Roper resonance.
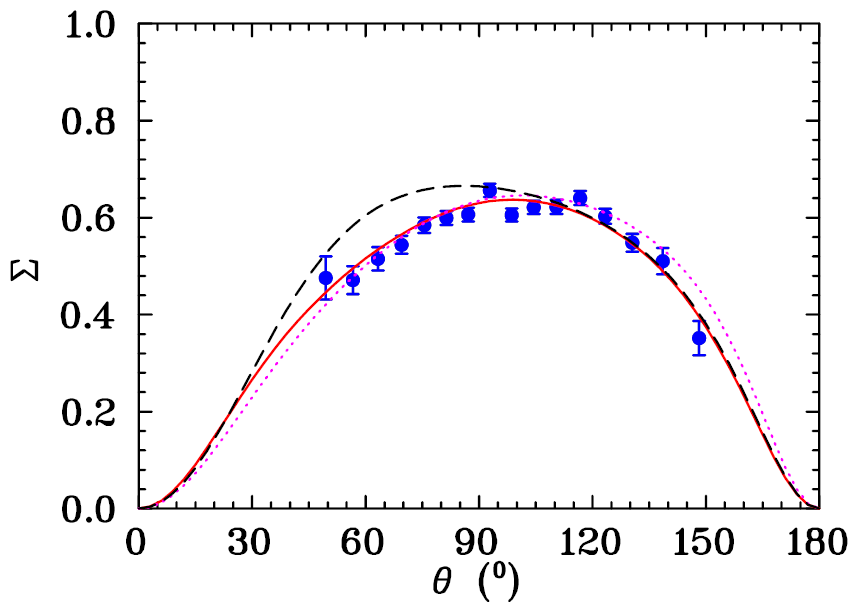
The SAID MA19 Briscoe:2019cyo , Bonn-Gatchina BG2014-02 Gutz:2014wit , and MAID2007 Drechsel:2007if curves shown in Fig. 6 did not include the present A2 data in their fits. In addition, the MAID2007 fit does not include measurements after 2007. MU22 includes all previous measurement and includes the A2 data. All fits and predictions agree well for the lowest energy where the resonance dominates. The angular distribution retains the shape of SAID MA19 up until the highest energies where some larger deviations become apparent.
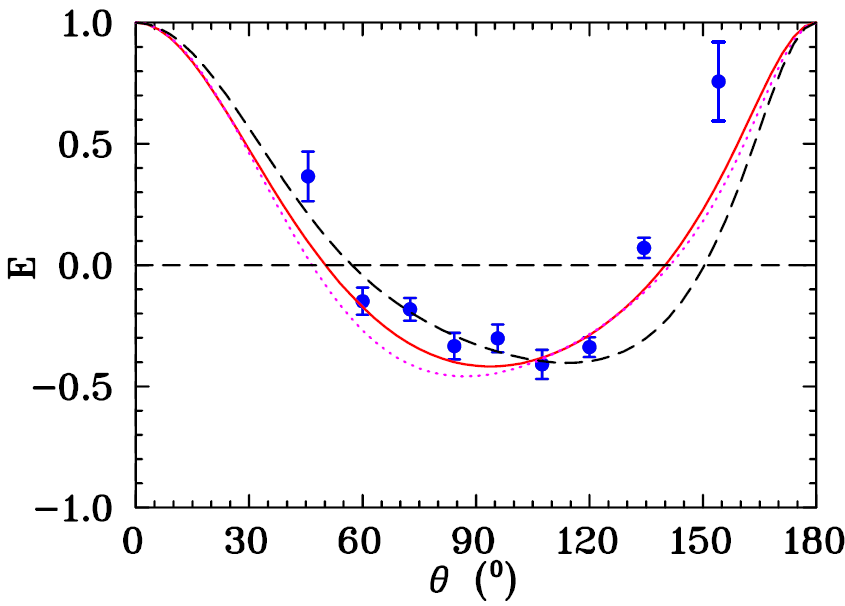
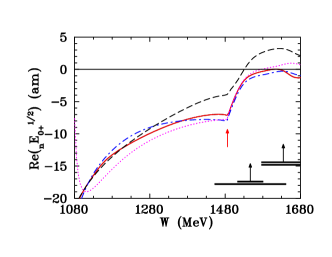
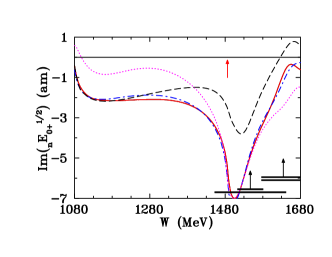
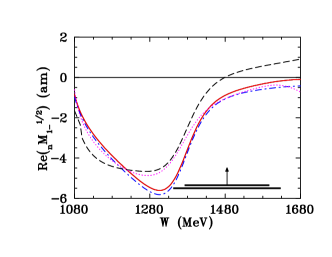
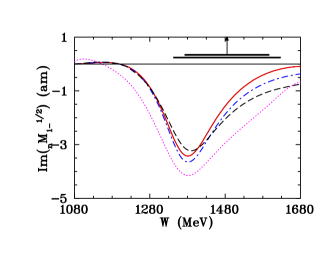
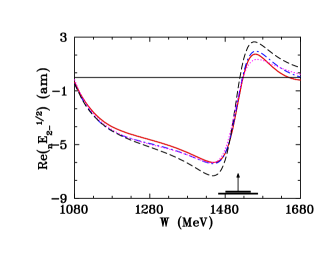
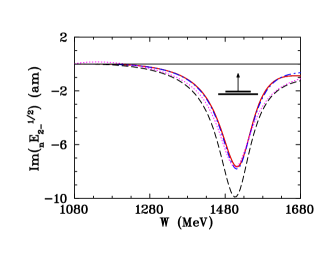
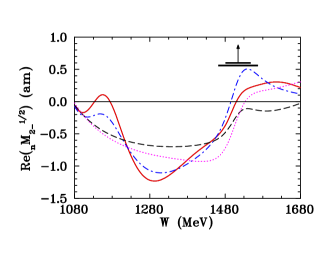
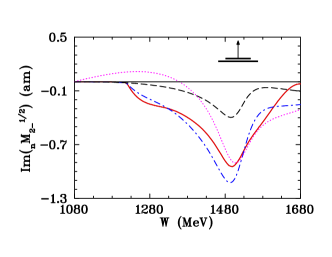
Exploring the effectiveness of isospin symmetry to predict observables, in Fig. 8 the fit (MU22) is compared to predictions from MUXX and MAID2007 for , , and the double-polarization asymmetry . At this energy, the qualitative features are generally reproduced, particularly for the current data. In the fit, cross sections have larger angle-independent systematic uncertainties and the renormalization factor from Eq. (9) improves the description, but is not included in the plot. While the new data cover parts of the and Roper resonance regions, selected isospin multipoles are compared up to a photon energy of 1 GeV. The isospin multipoles are taken as determined by the much larger proton-target database and only the isospin neutron multipoles are shown in Fig. 9. Comparing MA19 to MA22, there are no significant changes seen in the multipole. In addition, comparing imaginary parts of multipoles connected to the nearby () and ( and ), there is also good agreement between the SAID and Bonn-Gatchina plots. The resonance couplings for the , , and are expected to be in agreement with those reported in Ref. Briscoe:2019cyo .
As a final comment on the predictive ability of our fit, excluding all data, a comparison of Tables 4 and 5 shows that fit MUXX is much less successful between the upper energy limit of the present experiment and 1 GeV in the photon energy. This change is due mainly to poor compatibility with GRAAL data DiSalvo:2009zz .
Our results for for consist of 189 experimental points and are available from the SAID database Briscoe:2020zzz , where systematic uncertainties for each bin have been added in quadrature.
Acknowledgements.
This work was supported in part by the UK Science and Technology Facilities Council (STFC Grants No. 57071/1 and No. 50727/1), the U. S. Department of Energy, Office of Science, Office of Nuclear Physics, under Awards No. DE–FG02–01ER41194, No. DE–-SC0016583, No. DE-–SC0016582, and No. DE-–SC0014323. This work was supported by Schweizerischer Nationalfonds (Grants No. 200020–132799, No. 121781, No. 117601, and No. 113511),Deutsche Forschungsgemeinschaft (SFB Grant No. 443,
No. SFB/TR 16, No. SFB 1044), DFG–RFBR (Grant No. 05–-02-–04014), European Community Research Infrastructure Activity (FP6), the U. S. DOE, U. S. NSF, and NSERC (Grant No. SAPPJ–-2018-–00020) Canada. This publication is part of a project that has received funding from the European Union’s Horizon 2020 research and innovation programme under grant agreement STRONG – 2020 - No 824093. We would like to thank all the technical and nontechnical staff of MAMI for their support.
References
- (1) D. G. Ireland, E. Pasyuk, and I. Strakovsky, “Photoproduction reactions and non-strange baryon spectroscopy,” Prog. Part. Nucl. Phys. 111, 103752 (2020).
- (2) The SAID analyses are available through the GWU web-site http://gwdac.phys.gwu.edu/ ; W. J. Briscoe, M. Döring, H. Haberzettl, I. I. Strakovsky, and R. L. Workman, Institute of Nuclear Studies of The George Washington University Database.
- (3) K. Kossert et al. [A2 Collaboration at MAMI], “Quasifree photoproduction from the bound nucleon,” Eur. Phys. J. A 19, 391 (2004).
- (4) W. J. Briscoe et al. [A2 Collaboration at MAMI], “Cross section for at the Mainz A2 experiment,” Phys. Rev. C 100, 065205 (2019).
- (5) A. Ando, in “Physik-Daten, Physics Data,” Sekt. 7 “Compilation of Pion Photoproduction Data,” edited by H. Behrens, G. Ebel, D. Menze, W. Pfeil, and R. Wilcke (Physikallisches Institut der Universitaet, Bonn, Germany, 1977), Vol. 1.
- (6) M. Dieterle et al. [A2 Collaboration at MAMI], “Photoproduction of mesons off protons and neutrons in the second and third nucleon resonance region,” Phys. Rev. C 97, 065205 (2018). It is not included in the SAID fits due to no FSI corrections while it is available in the SAID database Briscoe:2020zzz .
- (7) Y. Hemmi et al., “Photoproduction of neutral pions off neutrons in the energy region between 500 MeV and 900 MeV,” Nucl. Phys. B 55, 333 (1973).
- (8) C. Bacci et al. “Angular distributions for single neutral pion photoproduction from neutrons at 450 – 800 MeV,” Phys. Lett. B 39, 559 (1972).
- (9) C. R. Clinesmith, “ photoproduction from the deuteron at forward angles in the energy range from 900-MeV to 1400-MeV,” Ph. D. Thesis, California Institute of Technology, 1967; Preprint RX–184.
- (10) R. Di Salvo et al. [GRAAL Collaboration], “Measurement of Sigma beam asymmetry in photoproduction off the neutron in the second and third resonances region,” Eur. Phys. J. A 42, 151 (2009).
- (11) M. Dieterle et al. [A2 Collaboration at MAMI], “First measurement of the polarization observable and helicity-dependent cross sections in single photoproduction from quasi-free nucleons,” Phys. Lett. B 770, 523 (2017).
- (12) S. Costanza and F. Cividini, “Double polarization observable and helicity dependent cross section for single 0 photoproduction off proton and neutron,” EPJ Web Conf. 241, 01005 (2020).
- (13) V. E. Tarasov, W. J. Briscoe, H. Gao, A. E. Kudryavtsev, and I. I. Strakovsky, “Extracting the photoproduction cross section off the neutron from deuteron data with FSI effects,” Phys. Rev. C 84, 035203 (2011).
- (14) P. T. Mattione et al. [CLAS Collaboration], “Differential cross section measurements for above the first nucleon resonance region,” Phys. Rev. C 96, 035204 (2017).
- (15) V. E. Tarasov, W. J. Briscoe, M. Dieterle, B. Krusche, A. E. Kudryavtsev, M. Ostrick, and I. I. Strakovsky, “On the extraction of cross sections for 0 and photoproduction off neutrons from deuteron data,” Phys. Atom. Nucl. 79, 216 (2016).
- (16) J. C. McGeorge et al., “Upgrade of the Glasgow photon tagging spectrometer for Mainz MAMI-C,” Eur. Phys. J. A 37, 129 (2008).
- (17) A. Starostin et al. [Crystal Ball Collaboration], “Measurement of near threshold,” Phys. Rev. C 64, 055205 (2001).
- (18) A. R. Gabler et al., “Response of TAPS to monochromatic photons with energies between 45-MeV and 790-MeV,” Nucl. Instrum. Meth. A 346, 168 (1994).
- (19) M. Bashkanov et al. [A2 Collaboration at MAMI], “Signatures of the hexaquark in d(,),” Phys. Rev. Lett. 124, 132001 (2020).
- (20) C. A. Mullen, “Linearly polarised pion photoproduction on the deuteron,” Ph. D. Thesis, Glasgow University, 2020.
- (21) D. Lohmann et al. “Linearly polarized photons at MAMI (Mainz),” Nucl. Instrum. Meth. A 343, 494 (1994).
- (22) U. Timm, “Coherent bremsstrahlung of electrons in crystals,” Fortsch. Phys. 17, 765 (1969).
- (23) J. D. Kellie et al., “The selection and performance of diamond radiators used in coherent bremsstrahlung experiments,” Nucl. Instrum. Meth. A 545, 164 (2005).
- (24) K. Livingston, “The Stonehenge Technique. A new method for aligning coherent bremsstrahlung radiators,” Nucl. Instrum. Meth. A 603, 205 (2009).
- (25) S. Gardner et al. [A2 Collaboration at MAMI], “Photon asymmetry measurements of for 320 – 650 MeV,” Eur. Phys. J. A 52, 333 (2016).
- (26) M. Pivk and F. R. Le Diberder, “SPlot: A Statistical tool to unfold data distributions,” Nucl. Instrum. Meth. A 555, 356 (2005).
- (27) W. Verkerke and D. P. Kirkby, “The RooFit toolkit for data modeling,” eConf C0303241, MOLT007 (2003).
- (28) The Bonn-Gatchina analyses are available through the Bonn website: http://pwa.hiskp.uni-bonn.de/ ; see also E. Gutz et al. [CBELSA/TAPS Collaboration], “High statistics study of the reaction ,” Eur. Phys. J. A 50, 74 (2014).
- (29) The MAID analyses are available through the Mainz web-site: http://wwwkph.kph.uni-mainz.de/MAID/ ; see also D. Drechsel, S. S. Kamalov, and L. Tiator, “Unitary isobar model - MAID2007,” Eur. Phys. J. A 34, 69 (2007).
- (30) R. L. Workman, M. W. Paris, W. J. Briscoe, and I. I. Strakovsky, “Unified Chew-Mandelstam SAID analysis of pion photoproduction data,” Phys. Rev. C 86, 015202 (2012).
- (31) A. V. Anisovich, E. Klempt, V. A. Nikonov, M. A. Matveev, A. V. Sarantsev, and U. Thoma, “Photoproduction of pions and properties of baryon resonances from a Bonn-Gatchina partial wave analysis,” Eur. Phys. J. A 44, 203 (2010).
- (32) R. A. Arndt, W. J. Briscoe, I. I. Strakovsky, and R. L. Workman, “Extended partial-wave analysis of scattering data,” Phys. Rev. C 74, 045205 (2006).
- (33) S. Agostinelli et al. “Geant4—a simulation toolkit” Nucl. Instrum. Meth. A 506, 250-303 (2003).