Sharp transition to strongly anomalous transport in unsaturated porous media
Abstract
The simultaneous presence of liquid and gas in porous media increases flow heterogeneity compared to saturated flows. However, so far the impact of saturation on flow statistics and transport dynamics remained unclear. Here, we develop a theoretical framework that captures the impact of flow reorganization on the statistics of pore-scale fluid velocities, due to the presence of gas in the pore space, which leads to the development of a highly-structured flow field. Preferential flow is distributed spatially through the denoted backbone and flow recirculation occurs in dead-end regions branching from it. This induces a marked change in the scaling of the velocity PDF compared to the saturated case, and a sharp transition to strongly anomalous transport. We develop a transport model based on the continuous time random walk theory that successfully predicts advective transport dynamics for all saturation degrees. Our results provide a new modelling framework linking phase heterogeneity to flow heterogeneity and to transport in unsaturated media.
Unsaturated porous media, where liquid and gas phases coexist, play a central role in a broad range of environmental [1, 2, 3] and industrial [4, 5, 6] applications. Under saturated conditions, i.e., for single-phase flow, structural heterogeneity in the solid phase leads to anomalous transport [7, 8, 9, 10, 11, 12, 13]. This typically translates to early solute arrival and longer tailing at a given control plane, as well as non-Fickian scaling of spatial solute spreading [14]. In unsaturated porous media, the presence of several immiscible or partially-miscible fluid phases in the pore space induces complex flow topologies, increasing flow tortuosity and resulting in more extreme high and low velocities [15, 16, 17]. However, the consequences of this heterogeneity to solute transport properties are controversial. Both an increase [18, 19, 20] and a decrease [21, 22] of dispersion with decreasing saturation have been reported.
Here, we use images from millifluidic experiments and pore-scale numerical simulations to derive a new theoretical framework linking parameters characteristic of the medium structure and saturation degree (fraction of the pore volume occupied by the liquid) to the probability density function (PDF) of both flow rates through pore throats and velocities, and to anomalous transport dynamics. We propose a model built on the partition of the pore space into two contrasting structures, a backbone of preferential flow paths, and dead-end regions of low velocity. The model captures the abrupt change the presence of dead-ends exerts on the velocity PDF scaling for unsaturated systems compared to fully saturated conditions. Based on this theory, we predict the emergent anomalous advective transport in unsaturated systems based on a continuous time random walk (CTRW) approach.
We employ experimental images of a horizontal quasi two-dimensional (2D) porous medium characterizing the arrangement of two immiscible phases (water and air) under different saturation degrees [16] and simulate flow at the pore scale. Four saturation degrees, , , , and , are analyzed. Experiments were performed for low capillary numbers, ranging from for to for . Therefore, viscous forces posed by liquid flow did not exceed the capillary resistance of the air clusters (non-wetting phase), remaining immobile [23]. The length of the system is , its width , and its thickness (vertical gap) . The average pore throat width (shortest distance between grains) , and the mean pore size (meeting point of pore throats) , leading to a porosity of , which is typical of 2D systems [24, 25, 26].
We numerically simulate 2D steady-state Stokes (i.e., low Reynolds number) flow, in which the flow of water around the solid grains and air bubbles, extracted from experimental images, is exclusively controlled by viscous dissipation. The effect of the third dimension on depth-averaged flow is introduced in the Stokes equation through a Darcy-like term [27] representing the drag force exerted on the liquid by the upper and lower walls in the experimental configuration [16]. A constant flow rate of for the saturated case and for the unsaturated cases is imposed at the inlet [16]. The pixel size is mm . Atmospheric pressure is imposed at the outlet. We assign a slip boundary condition (i.e., no tangential stress) to liquid–gas boundaries, and a no-slip boundary condition (i.e., zero velocity) to solid–liquid interfaces.

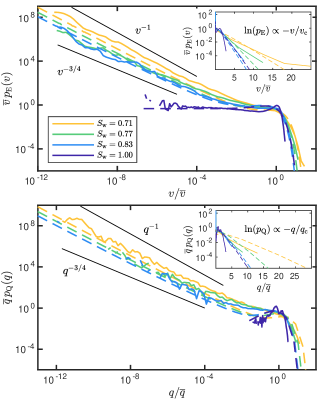
While the simulated velocity fields exhibit limited variability under saturated conditions (Fig. 1a), the flow heterogeneity is strongly enhanced in the unsaturated case (Fig. 1b). The introduction of air induces a partition of the flow field into two communicating flow structures [15]: a backbone of preferential flow paths, and dead-end regions (sometimes referred to as stagnation zones, although velocity is non-zero [16, 28]) that branch out from the backbone (Fig. 1c). This fundamental reorganization of flow compared to the saturated case leads to a marked change in the Eulerian velocity PDF , with a strong increase of the probability of low velocities (Fig. 2a). For all unsaturated cases, of low velocities is orders of magnitude larger than for the saturated system, as they are not only encountered close to the solid–liquid interfaces but also within dead-end regions (Fig. 1b). In the low-velocity range, undergoes a sharp transition from a plateau for to a power-law-like behavior for . High velocities follow an exponential trend characterized by a saturation-dependent characteristic velocity .
We partition the flow field into backbone and dead-end regions (Fig. 1c) by selecting a velocity threshold at the transition between the power-law and exponential velocity regimes. Given the large velocity gradient at the boundaries between backbone and dead-ends, the regions distribution do not change significantly when varying this threshold. Results suggest a more accentuated flow separation with lower saturation, with dead-end regions increasing both in size and number as decreases [29]. The dead-end area PDF decays as a power-law whose variation in scaling reflects the increase in dead-end areas as saturation decreases [29]. Note that previous experimental studies in 2D porous media have analyzed air cluster area distributions, rather than fluid dead-end area distributions, and found a power-law behavior with an exponential cutoff at large cluster sizes [16, 26].
To derive a theoretical framework for , we first consider the local flow rate through a pore throat, or pore flow rate . It is computed by integrating the pore-scale flow velocities over the cross section of the pore throat. For all unsaturated conditions, the PDF of pore flow rates over the ensemble of throats shows a scaling similar to that of for both low and high magnitudes (Fig. 2a). However, for , increases with at low values instead of the plateau observed for . In the saturated medium, is well captured by the flow rate PDF in the backbone , which follows a gamma distribution,
| (1) |
where the saturation-dependent characteristic flow rate controls the exponential high-flow tailing. This is consistent with the random aggregation model of [30], based on the random splitting and merging of flow throughout the pore network [31].
To model and for , we separately quantify the flow statistics in backbone () and dead-end () regions. We first determine the ratio of the area occupied by dead-end regions to the total medium area [29], which ranges from for to for . is then related to and through
| (2) |
Next, we determine . Simulation data suggest that flow-rate magnitudes within dead-end regions decay exponentially with depth [29], up to the total depth of the dead-end region, which extends from the contact with the backbone to the far liquid–gas boundary (see inset in Fig. 1c). Within each dead-end region, flow is driven by the pressure gradient across its connection to the backbone, which has a characteristic width on the order of the pore-throat size. Such exponential decay is consistent with the fundamental solutions of the Laplace equation for the propagation of a pressure perturbation applied on the boundary of a 2D domain [32]. We expect macroscopic pressure gradients within dead-ends regions to obey a Laplace equation resulting from Darcy’s law [33]. We thus approximate the flow rate decay along the depth as
| (3) |
where is the flow rate at the contact with the backbone and is the Heaviside step function. Taking to be distributed according to Eq. (1) for , we can now express the flow rate PDF in dead-ends given depth as
| (4) |
where corresponds to an intra-region flow rate PDF for a given depth and a given local flow rate .
Setting , with the dead-end area, and averaging over areas, we obtain [29]
| (5) |
We approximate the dead-end area PDF by a Pareto distribution [29],
| (6) |
where the exponent decreases with decreasing , indicating broader dead-end area variability. We consider the minimum area of a dead-end region to be equal to the area of one pore throat, approximated as .
Using the expressions for (Eq. (1)) and (Eq. (5)) in Eq. (2), we deduce an expression for [29]. In the low-flow regime, , the latter is controlled by the dead-end contribution as long as , corresponding to . Taylor expansion of Eq. (4) for together with Eq. (5) leads to
| (7) |
Thus, our model predicts that, under unsaturated conditions, scales for low flow rates as a power law, , corrected by a logarithmic factor. This factor is raised to a power controlled by through the exponent . In the particular case , corresponding to , Taylor expansion of (Eq. (1)) for low leads to , linear in . Proceeding similarly for , for which we must consider contributions from both and , we obtain the exponential decay
| (8) |
We now turn to , characterizing velocity variability across the medium. It results from the combined effect of and the intra-throat variability arising from the local velocity profile within each throat. Thus, these two PDFs are related by
| (9) |
where is the PDF of velocities associated with a pore throat characterized by the flow rate . Since pore throat widths are comparable in size to the channel thickness , we take into consideration the impact of the confinement by the top and bottom plaque in the third dimension on the intra-pore, depth-averaged 2D velocity profile. The latter differs from the parabolic profile expected in a purely-2D scenario [29]. Given the low variability of pore-throat sizes across the medium, we approximate throat widths by their average value . The Eulerian velocity PDF associated with the velocity profile across a pore throat with a corresponding local flow rate is then [29]
| (10) |
where , and is the maximum velocity within the pore throat, with
| (11) |
Under saturated conditions, the integral in Eq. (9) can then be approximated in the ranges and , respectively, by using Eq. (1), as [29]
| (12) | |||
| (13) |
Equation (12) describes a low-velocity plateau, while Eq. (13) encodes exponential tailing at large velocities.
Under unsaturated conditions, the previous derivation holds for the backbone component. Similar to the situation regarding the pore flow rates, for low velocities is dominated by the dead-end regions, while for the contribution of both backbone and dead-ends matters. The low-velocity behavior is controlled by low flow rates. For small , becomes arbitrarily narrow, because the maximum velocity is linear in , see Eq. (10). Accordingly, is well approximated for low by setting in Eq. (9), where is the Dirac delta, and using Eq. (7) for . We obtain, for the range ,
| (14) |
Analogously, for the range , can be computed using Eq. (8) for , and Taylor expanding Eq. (10) for high pore velocities , which leads to
| (15) |
where . Note that for large values compared to , Eqs. (12)–(15) reduce to expressions that correspond to those obtained under the assumption of a Poiseuille velocity profile (fully-2D case) [29].
Figure 2 shows the predictions (dashed lines) for both and . The model successfully captures the different regimes and scaling variation for the various . The low-velocity plateau for is also captured. The results shown here correspond to numerical computation of the full theoretical PDFs according to Eqs. (1), (2), (5), and (9). Further details on the regime scalings and parameter values can be found in [29].
To investigate the consequences of these broad velocity distributions for transport, we compute dispersion through advective particle tracking simulations. Details on these simulations are presented in [29]. Particle positions are tracked isochronically over fixed time steps (-Lagrangian sampling). We compute the time evolution of the variance of longitudinal particle positions. Lower saturation induces larger particle dispersion due to the increased velocity heterogeneity, as discussed above. At early times, a ballistic regime, is observed in Fig. 3, for all , and then transitions to an asymptotic superdiffusive regime. The crossover time between the ballistic and asymptotic regimes is also larger for smaller , i.e., the Lagrangian correlation length of velocities along the mean flow direction increases with decreasing saturation.
To develop a transport modeling framework that links the dispersion dynamics to hydrodynamics, we employ a CTRW approach [34, 35, 36]. The CTRW framework used here models transport in terms of Lagrangian particles taking fixed spatial steps of length along the mean flow direction (-Lagrangian sampling). Particle velocities remain constant over a step and are assumed to fully decorrelate between steps. The velocity variability in the underlying medium is treated statistically, and the particle velocity in each step is sampled independently from the equilibrium -Lagrangian velocity distribution, which is given by the flux-weighted Eulerian PDF, [35]. This approach captures the intermittent nature of the -Lagrangian velocity signal through the distributed waiting times to cross the fixed distance , arising from velocity variability sampled along streamlines [29].
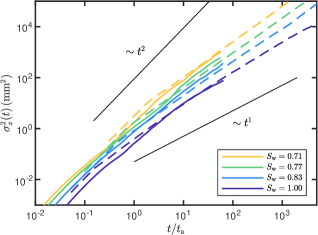
To assess the applicability of our theoretical model to predict advective transport, we employ defined from the predicted (dashed lines in Fig. 2a) in the CTRW description. Fig. 3 shows the dispersion computed from the resulting CTRW for each (dashed lines), together with computed from the fully-resolved particle tracking simulations. Dispersion is well predicted over both the ballistic and superdiffusive regimes, and so the impact of on the temporal scaling. A slight overestimation of early-time dispersion is visible for , which might be explained by the assumption of full velocity decorrelation beyond the correlation length . This discrepancy is less pronounced for . Late-time dispersion is well captured in all cases, exhibiting more pronounced superdiffusive behavior for the unsaturated cases. Overall, these results support the suitability of both our theoretical description of velocity statistics and the CTRW to predict advective transport in unsaturated porous media. This conclusion is also supported by similar findings obtained when comparing these results to a CTRW parameterized according to computed from the flow simulations [29].
The CTRW provides an efficient computational approach that permits calculations across time scales that may be prohibitively expensive for more traditional numerical approaches such as standard particle tracking based on the pore-scale velocity field. Furthermore, it provides a theoretical framework to quantify and understand the relationship between dispersive scalings and velocity variability. In particular, the late-time scalings are controlled by the low-velocity behavior of . If exhibits power-law decay near , with , late-time dispersion scales like [35], between the Fickian and ballistic limits and . The scalings found here for saturated and unsaturated conditions correspond to two contrasting edge-cases. Under saturated conditions, (Eq. (12)), which leads to logarithmically-enhanced Fickian dispersion [35]. Note that pure power-law decay characterized by is not integrable near , so this behavior cannot occur because it does not correspond to a well-defined . In this sense, unsaturated conditions are characterized by maximal variability of low velocities, described by logarithmic corrections to power-law decay with (Eq. (14)). This leads, in contrast to the minimally-superdiffusive saturated case, to logarithmically-inhibited ballistic dispersion. In light of these considerations, along with the fact that the unsaturated is extremely broad (Fig. 2), the apparent power-law scalings in Fig. 3 vary slowly with time, as logarithmic corrections and the effect of progressively lower velocities come into play. A rigorous derivation of asymptotic dispersion scalings is beyond the scope of this work and will be presented elsewhere.
Our findings uncover the role of flow architecture in unsaturated porous media in the emergence of anomalous transport dynamics. We have presented a new theoretical framework for the prediction of pore-scale flow PDFs and advective transport capturing the impact of liquid-phase saturation. Results reveal that the introduction of an immiscible gas phase leads to a shift in the scaling of the velocity PDFs that induces a sharp transition to strongly anomalous transport. Under saturated conditions, dispersion is quasi-Fickian. In contrast, even under slightly unsaturated conditions, dispersion becomes quasi-ballistic. In practice, this superdiffusive dispersion behavior is sustained until low-velocity cutoffs introduced by additional processes, such as diffusion, become relevant. The long-term residence time of a particle in a dead-end region is eventually controlled by molecular diffusion, effectively cutting off extreme slow velocities [15]. While in the presence of diffusion the transport is thus always asymptotically Fickian at sufficiently late times, the dispersive scalings related to the velocity variability remain relevant over significant time scales. Our CTRW formulation also opens the door to the quantification of nontrivial scalings of dispersion [37, 38].
The theoretical formulation developed here for flow and velocity PDFs depends only on a small set of parameters, which reflect characteristics of the porous medium ( and ), the spatial distribution of phases in the system ( and ), and flow properties ( and , along with the flow tailing scale , used to determine ). The dead-end area distribution is assumed to follow a power-law, as suggested by the numerical data. We expect this structure to be robust for (quasi-)2D systems, independently of the detailed pore geometry. In particular it holds for fully 2D systems, and so does the spatial distribution of pore flow rates in dead-end regions (Eq. (3)), so that our theory also provides valid predictions for fully 2D systems when considering the limit [29]. Generalization to 3D porous media may be undertaken with a similar approach, although we expect the topology of the backbone and dead-end regions to be significantly altered in 3D. We have studied a relatively homogeneous porous medium, and an important open question is the effect of broader pore size variability [39] under unsaturated conditions. Furthermore, the upscaling of flow and transport presented here is a first step towards theoretical assessment of mixing and chemical reactions in unsaturated porous media, which are essential processes for the analysis and optimization of environmental and industrial systems.
Acknowledgements.
A.V.-P. and J. J.-M. gratefully acknowledge the financial support from the Swiss National Science Foundation (SNF, grant Nr. 200021 178986). T.A. is supported by a Marie Skłodowska Curie Individual Fellowship, under the project ChemicalWalks 792041. Y.M. and T.L.B. acknowledge funding from ERC project ReactiveFronts 648377. Numerical flow simulations were performed using the software COMSOL Multiphysics.References
- Lahav et al. [2010] O. Lahav, M. Kochva, and J. Tarchitzky, Potential drawbacks associated with agricultural irrigation with treated wastewaters from desalinated water origin and possible remedies, Water Science and Technology 61, 2451 (2010).
- Sebilo et al. [2013] M. Sebilo, B. Mayer, B. Nicolardot, G. Pinay, and A. Mariotti, Long-term fate of nitrate fertilizer in agricultural soils, Proceedings of the National Academy of Sciences 110, 18185 (2013).
- Bouwer [2002] H. Bouwer, Artificial recharge of groundwater: Hydrogeology and engineering, Hydrogeology Journal 10, 121 (2002).
- Panfilov [2010] M. Panfilov, Underground storage of hydrogen: In situ self-organisation and methane generation, Transport in Porous Media 85, 841 (2010).
- Winograd [1981] I. Winograd, Radioactive waste disposal in thick unsaturated zones, Science 212, 1457 (1981).
- Barbier [2002] E. Barbier, Geothermal energy technology and current status: An overview, Renewable and Sustainable Energy Reviews 6, 3 (2002).
- de Anna et al. [2013] P. de Anna, T. Le Borgne, M. Dentz, A. M. Tartakovsky, D. Bolster, and P. Davy, Flow intermittency, dispersion, and correlated continuous time random walks in porous media, Physical Review Letters 110, 1 (2013).
- Le Borgne et al. [2011] T. Le Borgne, D. Bolster, M. Dentz, P. de Anna, and A. Tartakovsky, Effective pore-scale dispersion upscaling with a correlated continuous time random walk approach, Water Resources Research 47, 1 (2011).
- Holzner et al. [2015] M. Holzner, V. L. Morales, M. Willmann, and M. Dentz, Intermittent Lagrangian velocities and accelerations in three-dimensional porous medium flow, Physical Review E 92, 1 (2015).
- Morales et al. [2017] V. L. Morales, M. Dentz, M. Willmann, and M. Holzner, Stochastic dynamics of intermittent pore-scale particle motion in three-dimensional porous media: Experiments and theory, Geophysical Research Letters 44, 9361 (2017).
- Moroni et al. [2007] M. Moroni, N. Kleinfelter, and J. H. Cushman, Analysis of dispersion in porous media via matched-index particle tracking velocimetry experiments, Advances in Water Resources 30, 1 (2007).
- Kang et al. [2014] P. K. Kang, P. de Anna, J. P. Nunes, B. Bijeljic, M. J. Blunt, and R. Juanes, Pore-scale intermittent velocity structure underpinning anomalous transport through 3-D porous media, Geophysical Research Letters 41, 6184 (2014).
- Stoop et al. [2019] N. Stoop, N. Waisbord, V. Kantsler, V. Heinonen, J. S. Guasto, and J. Dunkel, Disorder-induced topological transition in porous media flow networks, Journal of Non-Newtonian Fluid Mechanics 268, 66 (2019).
- Bijeljic et al. [2011] B. Bijeljic, S. Rubin, H. Scher, and B. Berkowitz, Non-Fickian transport in porous media with bimodal structural heterogeneity, Journal of Contaminant Hydrology 120-121, 213 (2011).
- de Gennes [1983] P. G. de Gennes, Hydrodynamic dispersion in unsaturated porous media, Journal of Fluid Mechanics 136, 189 (1983).
- Jiménez-Martínez et al. [2017] J. Jiménez-Martínez, T. Le Borgne, H. Tabuteau, and Y. Méheust, Impact of saturation on dispersion and mixing in porous media: Photobleaching pulse injection experiments and shear-enhanced mixing model, Water Resources Research 53, 1457 (2017).
- Le Borgne et al. [2008] T. Le Borgne, M. Dentz, and J. Carrera, Lagrangian statistical model for transport in highly heterogeneous velocity fields, Physical Review Letters 101, 090601 (2008).
- Bromly and Hinz [2004] M. Bromly and C. Hinz, Non-Fickian transport in homogeneous unsaturated repacked sand, Water Resources Research 40, 1 (2004).
- Haga et al. [1999] D. Haga, Y. Niibori, and T. Chida, Hydrodynamic dispersion and mass transfer in unsaturated flow, Water Resources Research 35, 1065 (1999).
- Padilla et al. [1999] I. Y. Padilla, T.-C. J. Yah, and M. H. Conklin, The effect of water content on solute transport in unsaturated porous media, Water Resources Research 35, 3303 (1999).
- Birkholzer and Tsang [1997] J. Birkholzer and C.-f. Tsang, Solute channeling in unsaturated heterogeneous porous media, Water Resources Research 33, 2221 (1997).
- Vanderborght and Vereecken [2007] J. Vanderborght and H. Vereecken, Review of dispersivities for transport modeling in soils, Vadose Zone Journal 6, 29 (2007).
- Tang et al. [2019] J. Tang, M. Smit, S. Vincent-Bonnieu, and W. R. Rossen, New Capillary Number definition for micromodels: The impact of pore microstructure, Water Resources Research 55, 1167 (2019).
- Andrade, Jr. et al. [1997] J. S. Andrade, Jr., M. P. Almeida, J. Mendes Filho, S. Havlin, B. Suki, and H. E. Stanley, Fluid flow through porous media: The role of stagnant zones, Physical Review Letters 79, 3901 (1997).
- Karadimitriou et al. [2016] N. K. Karadimitriou, V. Joekar-Niasar, M. Babaei, and C. A. Shore, Critical role of the immobile zone in non-Fickian two-phase transport: A new paradigm, Environmental Science and Technology 50, 4384 (2016).
- Tallakstad et al. [2009] K. T. Tallakstad, G. Løvoll, H. A. Knudsen, T. Ramstad, E. G. Flekkøy, and K. J. Måløy, Steady-state, simultaneous two-phase flow in porous media: An experimental study, Physical Review E 80, 1 (2009).
- Ferrari et al. [2015] A. Ferrari, J. Jiménez-Martínez, T. Le Borgne, Y. Meheust, and I. Lunati, Challenges in modeling unstable two-phase flow experiments in porous micromodels, Water Resources Research 51, 1381 (2015).
- Jiménez-martínez et al. [2015] J. Jiménez-martínez, P. de Anna, H. Tabuteau, R. Turuban, T. L. Borgne, and Y. Méheust, Pore-scale mechanisms for the enhancement of mixing in unsaturated porous media and implications for chemical reactions, Geophysical Research Letters 42, 5316 (2015).
- [29] See Supplementary Material at [URL] for visualization of the flow field partitions for all four analyzed saturation degrees; PDF of the stagnation zone areas and the fitting of the Pareto distribution; velocity decay inside of a saturation zone; velocity profile along pore throats; detailed description of model formulation and single model fits for each velocity and flow rate magnitude range; autocorrelation function of longitudinal velocities, and comparison of evolution of dispersion in time for a CTRW approach computed with the numerical velocity PDF for each saturation.
- Alim et al. [2017] K. Alim, S. Parsa, D. A. Weitz, and M. P. Brenner, Local pore size correlations determine flow distributions in porous media, Physical Review Letters 119, 1 (2017).
- Coppersmith [1996] D. Coppersmith, Advances in Cryptology - EUROCRYPT ’96, Lecture Notes in Computer Science, Vol. 1070 (Springer, Berlin, 1996) pp. 155–165.
- Bland [1965] D. R. Bland, Solutions of Laplace’s Equation (Routledge, Plymouth, 1965).
- Whitaker [1986] S. Whitaker, Flow in porous media I: A theoretical derivation of Darcy’s law, Transport in Porous Media 1, 3 (1986).
- Berkowitz et al. [2006] B. Berkowitz, A. Cortis, M. Dentz, and H. Scher, Modeling Non-fickian transport in geological formations as a continuous time random walk, Reviews of Geophysics 44, 1 (2006).
- Dentz et al. [2016] M. Dentz, P. K. Kang, A. Comolli, T. Le Borgne, and D. R. Lester, Continuous time random walks for the evolution of Lagrangian velocities, Physical Review Fluids 1, 074004 (2016).
- Cortis and Berkowitz [2004] A. Cortis and B. Berkowitz, Anomalous Transport in “Classical” Soil and Sand Columns, Soil Science Society of America Journal 68, 1539 (2004).
- Bijeljic and Blunt [2006] B. Bijeljic and M. J. Blunt, Pore-scale modeling and continuous time random walk analysis of dispersion in porous media, Water Resources Research 42 (2006).
- Aquino and Le Borgne [2021] T. Aquino and T. Le Borgne, The diffusing-velocity random walk: a spatial-markov formulation of heterogeneous advection and diffusion, Journal of Fluid Mechanics 910, A12 (2021).
- de Anna et al. [2017] P. de Anna, B. Quaife, G. Biros, and R. Juanes, Prediction of the low-velocity distribution from the pore structure in simple porous media, Physical Review Fluids 2, 1 (2017).
- Bruus [2008] H. Bruus, Theoretical Microfluidics - Oxford Master series in condenser matter physics (Oxford University Press, 2008) pp. 48–51.