Detection of GeV -Ray Emission from supernova remnant SNR G15.9+0.2 with Fermi-LAT
Abstract
We first report GeV -ray emission from supernova remnant (SNR) G15.9+0.2 in this work. The results show that its power-law spectral index is 2.940.25 with a 6.47 significance level, and the -ray emission can be characterized by a two-dimensional (2D) Gaussian spatial distribution, which has a better improvement than the case of a point source. Moreover, we find that its likely counterparts from the radio, X-ray, and TeV energy bands are well coincident with its spatial location. We suggest that the new -ray emission may originate from SNR G15.9+0.2. Analyzing the variability from 12.4 years of the light curve (LC), we identify that this LC exists weak variability with a 2.69 variability significance level. We investigated the 2D Gaussian extended region and did not identify certified active galactic nuclei from the region of this SNR; thus, we suggest that the new -ray emission may originate from SNR G15.9+0.2. On this basis, we discussed the probable origins of its -ray radiation from leptonic and hadronic scenarios, respectively.
=1 \fullcollaborationNameThe Friends of AASTeX Collaboration
1 Introduction
Supernova remnant (SNR) is considered to be an efficient cosmic-ray factory. After the explosion of SNR, it is considered that the 10% kinetic energy of SNR transferred to CRs, and the maximum energy of cosmic-ray particles can be accelerated to approximately 1015 eV through the diffusive shock acceleration mechanism (Bell, 1978; Blandford & Eichler, 1987; Drury et al., 1994; Morlino & Caprioli, 2012). Their multiband spectra exhibit a typical bimodal structure through leptonic or/and hadronic processes (e.g., Zeng et al., 2019, 2021). For the radio-to-X-ray band, it is generally recognized that synchrotron radiation dominates (Allen et al., 1997, 1999; Uchiyama et al., 2007). For the GeV-to-TeV energy band, inverse Compton scattering and bremsstrahlung of relativistic electrons are generally considered to be important mechanisms (Vink, 2012). In addition, decay of neutral pions produced in the inelastic hadronic interaction becomes more and more important to explain the GeV and TeV emissions of SNRs (e.g., Xin et al., 2017, 2019; Yang et al., 2021; Xiang & Jiang, 2021). Detection of GeV -ray emission of SNR is very important for evaluating SNR’s contribution to cosmic-ray flux in Milky Way (Acero et al., 2016), and it can also help us explore the acceleration mechanism of cosmic-ray particles and limit the energy distribution of accelerated particles, which provides further understanding of the evolution process of cosmic-ray particles in SNRs (Zhang & Fang, 2007; Finke & Dermer, 2012; Tang et al., 2013). Thus far, only 24 SNRs have been firmly certified in the Fermi Large Telescope Fourth Source Catalog (4FGL; Abdollahi et al., 2020). Therefore, more GeV SNRs are required to recognize the nature of particle acceleration within SNRs.
Caswell et al. (1982) found a clear shell structure from SNR G15.9+0.2 at 1415 MHz with about 58 resolution using the Fleurs synthesis radio telescope. Based on the observations at 327.5 MHz and 1425 MHz from the NRAO VLA sky survey (NVSS), Dubner et al. (1996) found that the eastern border of SNR G15.9+0.2 had a bright shell feature; the northwest edge had two fainter knots; the north of the shell appeared an extension region of the radio emission with a 3 noise level at 1425 MHz. Through XMM-Newton observations, Maggi & Acero (2017) found the evidence of spatial variations by measuring the Fe K line features. They believed that SNR G15.9+0.2 with the lowest Fe K centroid energy is the core-collapse SNR. Moreover, they identified ejecta emission from this SNR by observing the Fe K line features. They identified that the progenitors of SNR G15.9+0.2 originated from a massive star, according to the observation the abundance ratios of Ca, Ar, S, Si, and Mg.
For the GeV band data, Acero et al. (2016) did not find significant GeV -ray emission of the SNR in the 1-100 GeV energy band using the Fermi Large Area Telescope (Fermi-LAT), and they provided its upper limits with the 95% and 99% confidence level for the power-law spectral indices of 2.0 and 2.5, respectively. For the TeV energy band, Abeysekara et al. (2017) found that the TeV source 2HWC J1819-150 is closer to SNR G15.9+0.2 with a position separation of 0∘.1. In addition, the differential flux at 7 TeV is 59.07.910-15 TeV-1 cm-2 s-1 with a spectral index of -2.880.10.
In this study, for the improvement and accumulation from the Fermi-LAT Pass 8 data and the update of -ray background models from galactic diffuse emission and the isotropic extragalactic emission (Abdollahi et al., 2020), the GeV -ray emission of SNR G15.9+0.2 was reanalyzed using approximately 12.4 years of the Pass 8 data. In the preliminary analysis, a likely GeV -ray emission from the region of SNR G15.9+0.2 was found, which strongly inspired us to explore the characteristics and origin of this GeV -ray emission in this study. Subsequent works include the introduction of data reduction in Section 2, the presentation of the analysis results in Section 3, and the discussion and conclusion about the likely origins of the GeV radiation in Section 4.
2 Data Reduction
Using Fermitools version v11r5p3222http://fermi.gsfc.nasa.gov/ssc/data/analysis/software/, we analyzed the GeV -ray emission from the region of SNR G15.9+0.2 by selecting the instrumental response function (IRF) “P8R3_SOURCE_V3” and the Pass 8 “Source” event class (evtype = 3 and evclass = 128). The observation period was selected to be from August 4, 2008, to December 29, 2020 (mission elapsed time (MET) 239557427-630970757). The energy range was selected to be 1-500 GeV to reduce contamination from the galactic diffuse emission for a large point spread function in the low-energy band. Photon events with the maximum zenith angles of were selected to suppress the pollution from the Earth Limb. A region of interest (ROI), centered at the position from SIMBAD (R.A., decl.= 274∘.72, -15∘.03) 333http://simbad.u-strasbg.fr/simbad/, was selected for this analysis. We selected the script make4FGLxml.py444https://fermi.gsfc.nasa.gov/ssc/data/analysis/user/ to generate a source model file, and sources from the 4FGL within the ROI of 30∘ were included in the model file. Then, we included a point source with a power-law spectrum at the SIMBAD location of SNR G15.9+0.2 to the model file. The binned likelihood tutorial555https://fermi.gsfc.nasa.gov/ssc/data/analysis/scitools/binned_likelihood_tutorial.html was followed in the analysis. Furthermore, spectral indexes and normalizations from sources within the range of the ROI were set as free in the model file. The normalizations from the isotropic extragalactic emission (iso_P8R3_SOURCE_V3_v1.txt) and the galactic diffuse emission (gll_iem_v07.fits)666http://fermi.gsfc.nasa.gov/ssc/data/access/lat/BackgroundModels.html were also set as free.
3 Source Detection
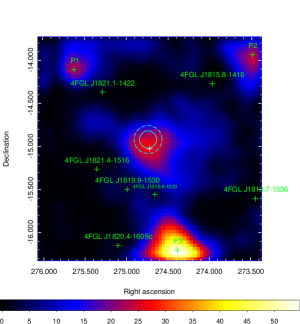
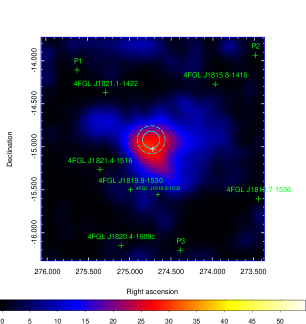
Running the command gttsmap, the test statistic (TS) map, which is centered at the SIMBAD location of SNR G15.9+0.2 in the 1-500 GeV energy band, was first calculated in this analysis. In the left panel of Figure 1, significant -ray radiation with a TS value = 30.20 was found in the region of SNR G15.9+0.2. Here, the TS value, defined as TS = 2log(L1/L0) from (Mattox et al., 1996), is calculated to quantify a significant source, and L1 and L0 represent maximum-likelihood values; L1 contains target source; L0 does not contain. In addition, we identified three significant -ray excesses from the locations of P1, P2, and P3. Then, we chose to add these three point sources, with power-law spectra in the local maxima of the TS map, to their locations777The location of P1: (R.A., decl.=275∘.63, -14∘.11); that of P2: (R.A., decl.=273∘.49, -13∘.99); that of P3: (R.A., decl.=274∘.39, -16∘.21). to subtract the three significant residual emissions within the TS map for all subsequent analyses. As shown in the right panel of Figure 1, the -ray radiation was still significant with the TS value of in the region of SNR G15.9+0.2.
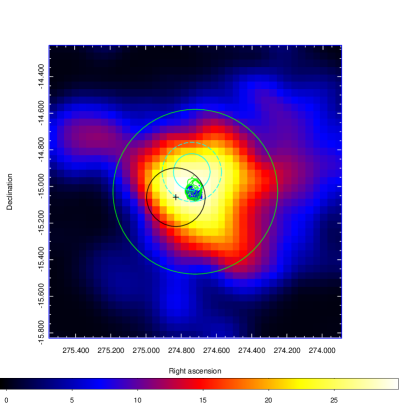
To further confirm that the region of SNR G15.9+0.2 does not have other significant -ray residual radiations within the TS map, we also deducted the emission from the region of SNR G15.9+0.2. Using gtfindsrc, we obtained the best-fit position of SNR G15.9+0.2 to be (R.A., decl. = 274∘.74, -14∘.92) with a 68% (95%) error circle of 0∘.10 (0∘.16) by assuming a point source with a power-law spectrum at its SIMBAD location. As shown in Figure 2, we found its contours of the 1.4 GHz radio and X-ray energy bands are all within the 68% and 95% error circles of the best position of SNR G15.9+0.2. Moreover, the region with a 1 statistical uncertainty from the location of the TeV source 2HWC J1819-150 (R.A., decl. = 274∘.83, -15∘.06; from Abeysekara et al. (2017) well overlaps with all the regions from three different energy bands. This indicates that these four sources from the radio to TeV bands are likely to be counterparts of SNR G15.9+0.2.
Using the uniform disk and two-dimensional (2D) Gaussian templates, we tested the different values of the radius and , which range from 0∘.1 to 1∘.5 with an increment of 0∘.05, to obtain the probable -ray spatial distribution of the new source. Then, we calculated the value of the TSext, using the formula of 2log(/) from Lande et al. (2012), where and represent the maximum log-likelihood values for the point source template and extended templates, respectively. We found that the 2D Gaussian template has a significant improvement with the highest value of TSext and a of 0∘.45 in the analysis. Therefore, we adopted the 2D Gaussian spatial template with a of 0∘.45 as the best spatial template to analyze the new -ray source in all subsequent analyses. The best-fit results with the highest TS values from the different templates were presented in Table 1.
| Spatial Model | Radius () | Spectral Index | Photon Flux | TS Value | TSext | Degrees of Freedom |
|---|---|---|---|---|---|---|
| degree | ||||||
| Point source | - | 2.940.51 | 0.390.10 | 29.61 | - | 4 |
| 2D Gaussian | 0∘.45 | 2.940.25 | 4.090.57 | 55.67 | 26.06 | 5 |
| uniform disk | 0∘.75 | 2.960.23 | 3.620.53 | 50.93 | 21.32 | 5 |
3.1 Spectral Analysis
In this analysis, we generated the spectral energy distribution (SED) in the 1-500 GeV energy band using a power-law spectrum model with the formula, , and the 2D Gaussian template for the new -ray source. The result of the global fit is = 2.940.25; its photon flux is (4.090.57) . The SED was divided into 10 equal logarithmic bins. Each energy bin was fitted using the binned likelihood analysis method. For the energy bins with the TS value 4, we calculated their upper limits with a 95% confidence level. Considering the subsequent energy bins with large statistical errors and the TS values 4, here we selected to provide two upper limits for the SED, as shown in Figure LABEL:Fig3.
![[Uncaptioned image]](/html/2103.07824/assets/x4.png)
3.2 Variability Analysis
To check the variability of the photon flux over 12.41 years for the new -ray source, we generated a light curve (LC) with 20 time bins in the 1-500 GeV energy band, as can be seen from Figure 4. Calculating the variability index TSvar defined by Nolan et al. (2012), we acquired 37.39 with a 2.69 variability significance level888Here, the variability significance level is calculated by the SciPy package (Virtanen et al., 2020).. The result implies that the new -ray source exhibits a hint of weak variation999 36.19 was used to identify variable sources at a 99% confidence level for the LC of 20 time bins (Xiang & Jiang, 2021)..

4 DISCUSSION
By analyzing the above TS maps of SNR G15.9+0.2, we found that the region of SNR G15.9+0.2 has the significant GeV -ray radiation with a 2D Gaussian spatial distribution and a significance level of 6.47. Its photon flux is (4.090.57) 10-9 ph cm-2 s-1 with = 2.940.25. We observed that almost all the radio and X-ray contours from SNR G15.9+0.2 are all within the 2 error circle of the best-fit location. In addition, the 1 error circle also contains some contours from the radio and X-ray energy bands. These results suggest that the position of the new -ray source well coincides with SNR G15.9+0.2.
Next, we analyzed the variability of approximately 12.4 years of the LC and found that the LC exits a weak variability with a significance level of 2.69. Thus far, the variability from LCs of SNRs in the Milky Way likely exists, such as iPTF14hls (Yuan et al., 2018), Supernova 2004dj (Xi et al., 2020), the Crab Nebula (Arakawa et al., 2020). In addition, we investigated the 4FGL and found three certified SNRs with TSvar 18.48101010The value of 18.48 over 12 intervals indicates that the source more than 99% chance is a variable source. Please refer https://heasarc.gsfc.nasa.gov/W3Browse/fermi/fermilpsc.html, including W 51C, W 44, and IC 443, which implies the variability from the LC of SNR G15.9+0.2 is likely. We considered that the most significant GeV radiations of the region are concentrated in the 2D Gaussian region with 0∘.45 radius, as displayed in Figure 2, and the LC of the region has weak variability. Then, we used SIMBAD 111111simbad.u-strasbg.fr/simbad/ and Aladin121212https://aladin.u-strasbg.fr/aladin.gml to investigate whether the 2D Gaussian extended region has certified active galactic nuclei (AGN). However, we did not find likely one; therefore, we suggest that the new GeV -ray emission is more likely to be from SNR G15.9+0.2.
We considered leptonic and hadronic scenarios to explain the GeV SED of SNR G15.9+0.2 from this work using a one-zone model from NAIMA (Zabalza, 2015, and references therein). Here we assumed leptonic and hadronic particle distributions satisfy the following two particle distributions:
(1) A power law model (PL):
| (1) |
(2) A power law with an exponential cutoff model (ECPL):
| (2) |
where is set to 10 GeV, represents the amplitude, is the particle energy, is the spectral index, represents the break energy (Aharonian et al., 2006; Ambrogi et al., 2019; Xin et al., 2019; Xiang & Jiang, 2021). In the fit, we used the Bayesian information criterion (BIC) to determine the goodness of fit of the two models (Schwarz, 1978; Ambrogi et al., 2019). The related formula of BIC is , where n represents the number of the observed data, k represents the number of parameters of the model, and is the maximum likelihood value. We assumed that the radiation fields of the leptonic and hadronic models come from the extended region of the SNR.
For the leptonic scenario, the presence of very-high-energy (VHE) electrons are confirmed in SNRs (e.g., Tanimori et al., 1998), and the GeV and TeV emissions of SNRs are also observed (e.g., Ackermann et al., 2017; Abdalla et al., 2018a). Subsequently, the inverse Compton scattering from leptons was widely used to explain the SEDs of high-energy bands from SNRs (e.g., Tang et al., 2013; Condon et al., 2017; Zeng et al., 2017, 2019, 2021). Therefore, the leptonic model, as a frequently-used model, is considered in the analysis. Additionally, the detection of the characteristic pion-decay signature in IC 443 and W44 confirms that cosmic-ray protons can be accelerated in SNRs (Ackermann et al., 2013). The proportion of proton composition of the observed CR spectrum on Earth is 99%, suggesting that the hadronic contribution for the -ray emission from SNRs cannot be ignored (Liu et al., 2015). Recent studies have shown that the multi-band SED of certain SNRs can be better explained when considering the contribution of hadrons than a pure leptonic scenario. E.g., Puppis A (Xin et al., 2017), SNR G106.3+2.7 (Xin et al., 2019; Yang et al., 2021), Kepler’s SNR (Xiang & Jiang, 2021). Consequently, we also considered the hadronic origin here.
The interaction between high-energy particles of SNR and the surrounding molecular cloud can serve as the important evidence for the hadronic origin (Wootten, 1977; Denoyer, 1979; Tatematsu et al., 1990; Green et al., 1997; Reach & Rho, 1999; Zhou et al., 2009; Kilpatrick et al., 2014). Here, we firstly investigated OH maser emission at 1720 MHz around SNR G15.9+0.2 from Green et al. (1997). However, we did not find the significant OH maser emission around SNR G15.9+0.2; thus, there is no convincing evidence to verify the interactions of SNR G15.9+0.2 with “OH” molecular clouds. In addition, Tian et al. (2019) proposed that the region of SNR G15.9+0.2 is likely to produce high-energy emissions, owing to the likely interactions between SNR G15.9+0.2 and the surrounding CO molecular clouds. Subsequently, we quickly investigated the past CO observations from Dempsey et al. (2013); we found dense CO molecular clouds in the 1 error circle of the best-fit position of SNR G15.9+0.2, as shown in Figure 5, which implies that this high-energy -ray radiation may originate from interactions between the high-energy particles of SNR G15.9+0.2 and the target particles of the nearby CO molecular clouds.

However, no broad CO emission lines were observed from the region in their works. Therefore, the interaction between SNR and surrounding CO molecules is uncertain and needs further observations to verify in the future.
Owing to the uncertainty of the interaction with the surrounding CO molecules, we assumed that the GeV radiation of the SNR comes from the interaction between the high-energy particles inside the forward shock and the surrounding interstellar medium of the SNR, and its related gas density = 0.7 cm-3 (Reynolds et al., 2006). For the distance of SNR G15.9+0.2, we took 8.5 kpc from Reynolds et al. (2006) for fitting the SED. Here, PYTHIA 8, which involves the cross-section of proton-proton interactions and pion production from Kafexhiu et al. (2014), was selected to perform the analysis.
The best-fit results of the two radiation models are shown in the two panels of Figure LABEL:Fig7 and Table 2, we found that leptonic and hadronic models with particle distributions of PL and ECPL can explain the SED with a reduced value of approximately 0. Moreover, we found that BIC values of PL and ECPL are close, with the values of approximately 3 and 5, respectively. Therefore, the goodness of fit of PL and ECPL cannot be distinguished thus far. The actual particle distribution of the SNR needs more high-energy observation data to infer in the future (e.g., continuous Fermi-LAT observation above 7 GeV). Furthermore, we found that both PL and ECPL models have soft indexes for leptonic and hadronic scenarios. Since the timescale of particle acceleration in SNR is approximately hundreds to thousands of years Yuan et al. (2018), considering the current age of the SNR is approximately 1000-3000 years (Reynolds et al., 2006), this may prevent the particles in the SNR from being accelerated to a very high energy level, resulting in a rapid truncation above 1 GeV and presenting a soft spectral feature.
![[Uncaptioned image]](/html/2103.07824/assets/x7.png)
![[Uncaptioned image]](/html/2103.07824/assets/x8.png)
| Model Name | Particle Distribution | -log | BIC | ||||
|---|---|---|---|---|---|---|---|
| GeV | |||||||
| Leptonic model | PL | — | -0.11 | 3.44 | |||
| ECPL | -0.03 | 4.89 | |||||
| Hadronic model | PL | — | -0.13 | 3.48 | |||
| ECPL | -0.10 | 5.03 |
4.1 Summary
-
1.
By analyzing approximately 12 years of Fermi-LAT Pass 8 data in the 1-500 GeV energy band, a new GeV source with 6.47 is found from the region of SNR G15.9+0.2; its photon flux is (4.090.57) with a soft spectral index of 2.940.25.
-
2.
Its spatial distribution can be described by a 2D Gaussian spatial model with .
-
3.
The GeV spatial position of SNR G15.9+0.2 is in good agreement with those of the radio, X-ray, and TeV bands. This result suggests that the new GeV source is likely to be a counterpart of SNR G15.9+0.2.
-
4.
Its LC presents a weak varibility, which is likely for the currently observed SNRs in Milky Way.
-
5.
Its SED can be explained by considering the leptonic and hadronic scenarios with PL and ECPL particle distribution models. For the hadronic origin, past observations show that there are dense CO molecular clouds around it, but such proton-proton interactions need to be further demonstrated in the future.
5 Acknowledgments
We sincerely thank the referee for his/her invaluable comments and appreciate the support for this work from the National Key R&D Program of China under Grant No. 2018YFA0404204, the National Natural Science Foundation of China (NSFC U1931113, U1738211, 11303012), the Foundations of Yunnan Province (2018IC059, 2018FY001(-003), 2018FB011), the Scientific Research Fund of Yunnan Education Department (2020Y0039).
References
- Abeysekara et al. (2017) Abeysekara, A. U. et al. 2017, APJ, 843, 40
- Abdalla et al. (2018a) Abdalla, H. et al. 2018a, A&A, 612, A1
- Abdollahi et al. (2020) Abdollahi, S. et al. 2020, ApJS, 247, 33
- Acero et al. (2016) Acero, F. et al. 2016b, ApJS, 224, 8
- Ackermann et al. (2013) Ackermann, M. et al. 2013, Sci, 339, 807
- Ackermann et al. (2017) Ackermann, M. et al. 2017, ApJ, 843, 139
- Aharonian et al. (2006) Aharonian, F. et al. 2006, A&A, 449, 223
- Allen et al. (1997) Allen, G. E. et al. 1997, ApJ, 487, L97
- Allen et al. (1999) Allen, G.E., Gotthelf, E.V., Petre 1999, in International Cosmic Ray Conference, 3, 480
- Ambrogi et al. (2019) Ambrogi, L., Zanin, R., Casanova, S., De Oa Wilhelmi, E., Peron, G., Aharonian, F. 2019, A&A, 623, A86
- Arakawa et al. (2020) Arakawa M., Hayashida M., Khangulyan D., Uchiyama Y., 2020, ApJ, 897, 33
- Bell (1978) Bell, A. R. 1978, MNRAS, 182, 147
- Blandford & Eichler (1987) Blandford, R., & Eichler, D., 1987, PhR, 154, 1
- Caswell et al. (1982) Caswell, J. L., Haynes, R. F., Milne, D. K., Wellington, K. J. 1982, MNRAS, 200, 1143
- Condon et al. (2017) Condon, B., Lemoine-Goumard, M., Acero, F., Katagiri, H. 2017, ApJ, 851, 100
- Dame et al. (2001) Dame, T., Hartmann, D., Thaddeus, P. 2001, ApJ, 547, 792
- Dempsey et al. (2013) Dempsey, J. T., Thomas, H. S., Currie, M. J. 2013, ApJS, 209, 8
- Denoyer (1979) Denoyer, L. K. 1979a, ApJL, 232, L165
- Drury et al. (1994) Drury, L. O., Aharonian, F. A., Vlk, H. J. 1994, A&A, 287, 959
- Dubner et al. (1996) Dubner, G. M., Giacani, E. B., Goss, W. M., Moffett, D. A., & Holdaway, M. 1996, AJ, 111, 1304
- Finke & Dermer (2012) Finke, J.D., & Dermer, C. D. 2012, ApJ, 751, 65
- Green et al. (1997) Green, A. J., Frail, D. A., Goss, W. M., Otrupcek, R. 1997, AJ, 114, 2058
- H.E.S.S. Collaboration (2018) H.E.S.S. Collaboration 2018, A&A, 612, A3
- Kafexhiu et al. (2014) Kafexhiu, E., Aharonian, F., Taylor, A. M., Vila, G. S. 2014, Phys. Rev., D90, 123014
- Kilpatrick et al. (2014) Kilpatrick, C. D., Bieging, J. H., Rieke, G. H. 2014, ApJ, 796, 144
- Lande et al. (2012) Lande, J. et al. 2012, ApJ, 756, 5
- Liu et al. (2015) Liu, B. et al. 2015, APJ, 809,102
- Maggi & Acero (2017) Maggi, P., & Acero, F. 2017, A&A, 597, A65
- Mattox et al. (1996) Mattox, J. R. et al. 1996, ApJ, 461, 396
- Morlino & Caprioli (2012) Morlino, G., & Caprioli, D. 2012, AIPC, 1505, 241
- Nolan et al. (2012) Nolan, P. L. et al. 2012, ApJS, 199, 31
- Reach & Rho (1999) Reach, W. T., & Rho, J. 1999, ApJ, 511, 836
- Reynolds et al. (2006) Reynolds, S. P. et al. 2006, ApJ, 652, L45
- Schwarz (1978) Schwarz, G. 1978, Ann. Stat., 6, 461
- Tang et al. (2013) Tang, Y.Y., Dai, Z.C., Zhang, L. 2013, RAA, 13, 537
- Tanimori et al. (1998) Tanimori, T. et al. 1998, APJ, 497, L25
- Tatematsu et al. (1990) Tatematsu, K., Fukui, Y., Iwata, T., Seward, F. D., Nakano, M. 1990, ApJ, 351, 157
- Tian et al. (2019) Tian, W. W. et al. 2019, PASP, 131, 114301
- Uchiyama et al. (2007) Uchiyama, Y., Aharonian, F. A., Tanaka, T., Takahashi, T., Maeda, Y. 2007, Nature, 449, 576
- Virtanen et al. (2020) Virtanen, P. et al. 2020, Nature Methods, 17, 261
- Vink (2012) Vink, J. 2012, A&ARv, 20, 49
- Wootten (1977) Wootten, H. A. 1977, ApJ, 216, 440
- Xi et al. (2020) Xi S.Q. et al., 2020, APJ, 901, 158
- Xiang & Jiang (2021) Xiang, Y.C., & Jiang, Z.J. 2021, APJ, 908, 22
- Xin et al. (2017) Xin, Y.L. et al. 2017, 843,90
- Xin et al. (2019) Xin, Y.L., Zeng, H.D., Liu, S.M., Fan, Y.Z., Wei, D.M. 2019, ApJ, 885, 162
- Yang et al. (2021) Yang, C.Y., Zeng, H.D., Bao, B.W., Zhang, L. 2021, preprint (arXiv:2106.02629)
- Yuan et al. (2018) Yuan Q. et al., 2018, ApJL, 854, L18
- Zabalza (2015) Zabalza, V. 2015, preprint (arXiv:1509.03319)
- Zeng et al. (2017) Zeng, H. et al. 2017, ApJ, 834, 153
- Zeng et al. (2019) Zeng, H., Xin, Y., Liu, S. 2019, ApJ, 874, 50
- Zeng et al. (2021) Zeng, H.D., Xin, Y.L., Zhang, S.N., Liu, S.M. 2021, ApJ, 910, 78
- Zhang & Fang (2007) Zhang, L., & Fang, J. 2007, ApJ, 666, 247
- Zhou et al. (2009) Zhou, X., Chen, Y., Su, Y., Yang, J. 2009, ApJ, 691, 516