Comprehensive and Comprehensible Data
Catalogs:
The What, Who, Where, When, Why, and How of
Metadata Management
Abstract.
Data management tasks require access to metadata, which is increasingly tracked by databases called data catalogs. Current catalogs are too dependent on users’ understanding of data, leading to difficulties in large organizations of users with different skills: catalogs either make metadata easy for users to store and difficult to retrieve, or they make it easy to retrieve, but difficult to store.
In this paper, we present 5W1H+R, a new catalog mental model that is comprehensive in the metadata it represents, and comprehensible in that it permits all users to locate metadata easily. We demonstrate these properties via a user study. We then discuss practical guidelines for implementing the new mental model. We conclude mental models are important to make data catalogs more useful and to boost metadata management efforts.
1. Introduction
In an increasingly data-driven world, a major data management challenge in industry, the sciences, and the civic sphere, is the lack of solutions to find relevant data (Discovery), manage data usage and access (Governance), combine data to multiply its value (Integration), and guarantee that data use is compliant with regulations (Compliance). A common denominator to all these challenges is that addressing them requires access to metadata: information about the datasets that cannot be found in their contents.
Many initiatives have appeared over the last few years to organize and represent metadata to help diverse data users address their data management tasks. The FAIR principles (Wilkinson et al., 2016) in the sciences have galvanized academics to complement data-sharing initiatives such as Dataverse (Crosas, 2011), and ICPSR (of Michigan, 2021) with metadata that facilitates their usage. The explosion of machine learning and its consequent pressure on data management has motivated efforts to catalog data assets in the form of datasheets (Gebru et al., 2018) and enterprise metadata management systems (Araki and Lorica, 2021; Carter, 2020). We call software solutions designed to store and retrieve metadata data catalogs, which are databases for metadata.
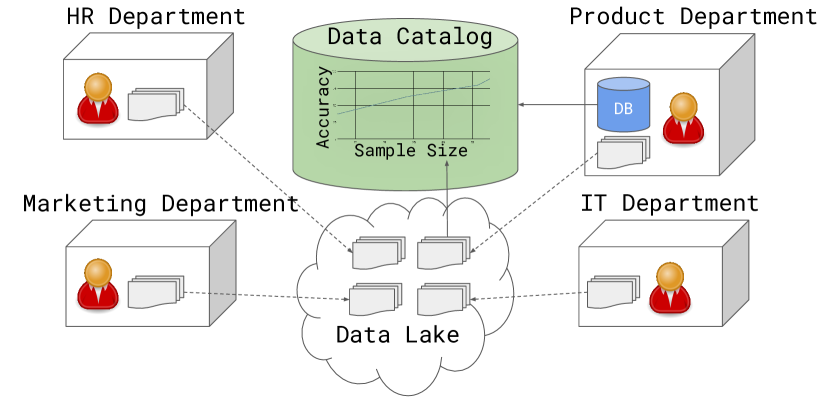
Many data management tasks greatly benefit from accessing a data catalog shared among a diverse group of data users who need to use each other’s data. For example, Fig. 1 illustrates a modern organization, where employees are organized in different units (e.g., departments, divisions) and do not necessarily know the data others own, even though they may need to use their data to solve data management tasks. These scenarios are challenging to navigate in the enterprise. Before using a dataset, employees must contact the data owners and understand the context before they can use such a dataset responsibly. It is precisely in these scenarios that a well-designed data catalog that centralizes metadata describing those datasets would be valuable. To be helpful, the catalog must be designed to provide a shared understanding of metadata to all users so they know where to store the metadata and how to retrieve it, making it easy to use. If the catalog does not induce a shared understanding, then employees will ultimately ignore the catalog and be back to ground zero. Consider the following stylized example that illustrates the aforementioned problem:
Example. Suppose Alice, a sales analyst, is in charge of predicting headphone sales for the incoming week, so the company can allocate the stock effectively. To build such a machine learning predictor, Alice searches for data she can use as a training dataset. Luckily, the company has recently set up a data catalog with a keyword search functionality. Using the search function Alice finds a possibly relevant dataset. Before committing to using this dataset, however, Alice, as a responsible engineer, wants to know a series of characteristics about the data that will ensure its use as part of the machine learning predictor is adequate and responsible. Alice would like to know: i) past use: was this dataset used successfully for prediction in the past? If it was, this may give Alice additional context on who to ask for advice; ii) schema details: whether the dataset contains relevant (and semantically meaningful) attribute names, and iii) creator details: whether the dataset was created by a trustworthy data engineer. When Alice looks at the metadata listed in the catalog, she finds a plethora of metadata fields with possibly relevant names, such as logs. However, Alice cannot tell whether these correspond to the information she is seeking. This semantic ambiguity naturally arises because of the distributed nature of the problem: those who populate the catalog may not use terminology that aligns with those who consume the information from the catalog.
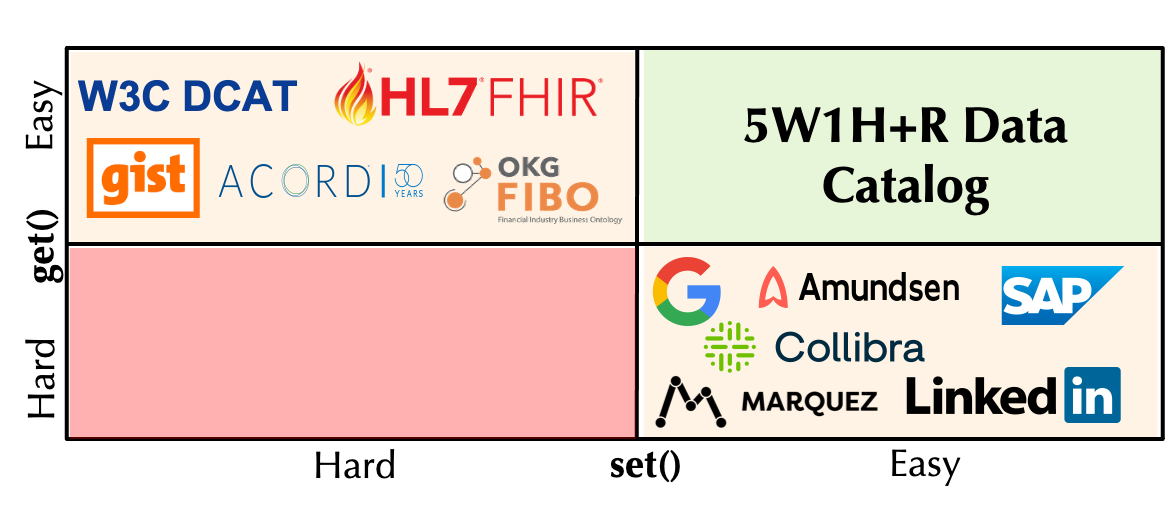
Alice finds it difficult to successfully search using her desired metadata because other users are allowed to store metadata using a flexible schema, which is provided by most enterprise data catalogs today. Different users may disagree on the meaning of metadata, and the terms that should be used to describe it. Therefore, metadata may be named differently, or have different meanings, depending on the users who provide it. This makes it easy to store metadata, but difficult to retrieve it. Current enterprise catalogs can be characterized this way (see Fig. 2, bottom right). This can be alleviated if there is a shared mental model (an agreed-upon set of terms) used for storage and retrieval of metadata. However, if this mental model is a large ontology or controlled vocabulary such as W3C DCAT, or a manually constructed business dictionary, then retrieving metadata is easy, but storing metadata is difficult (Fig. 2, upper left), because (i) any user must correctly match their metadata to the agreed-upon term for the metadata the user has in mind. Also, (ii) the ontology may not be comprehensive: it must be modified if it does not include any user’s metadata.
Therefore, a mental model must be: (1) comprehensive in the metadata it captures, (2) comprehensible: different users match the same metadata to the same term of the mental model (3) easy-to-use: the mental model should not have too many terms for users to match their metadata. A shared mental model with these properties would better facilitate data management tasks. Note, also, that such a mental model need not eliminate disagreements on metadata altogether (which may be undesirable, as different users may want to continue using their own terms). Rather, it should provide a shared set of terms to which all users can match their metadata in the same way, bounding disagreements within each term.
In this paper, we propose a comprehensive, comprehensible, easy-to-use mental model based on the 5W1H principles of journalism (Flint, 1917). We choose 5W1H not only because of its desirable properties, but also because it is a natural choice, given the success of 5W1H-based description frameworks in several other computational contexts, ranging from describing user events that should trigger applications (Jang et al., 2005) to providing a complete description of next-generation probiotics(Almeida et al., 2020). It is informed by an in-depth study of the kinds of DGIC questions that appear in the literature. The new mental model facilitates the storage/retrieval of metadata to technical (data scientists/engineers) and non-technical (business analysts, sales teams) users alike. We illustrate how this mental model can be implemented in a catalog by outlining practical guidelines for a catalog that preserves the mental model’s cognitive fit (Vessey, 1991) with user’s metadata specifications.
We conduct an IRB-approved user study to demonstrate the mental model benefits and compare the new mental model with those implicitly defined in existing catalogs, namely, Google Cloud Service’s (GCS) data catalog MM, and LinkedIn’s Datahub MM, which we can derive from the schemas they expose to users. Our results show that the new mental model makes it easier for users to store and retrieve metadata consistently, meaning that it can reduce the effort needed to find the metadata required for DGIC tasks. Our results further demonstrate this reduction of effort through difficulty ratings, that show that our mental model is easier to use. Further, our mental model has fewer cases where users state they do not know how they would use the mental model to find metadata, providing further evidence that our mental model is comprehensive.
Scope of this paper. The contribution of this paper are:
-
•
A study of the data catalog landscape and metadata needs (Section 2).
- •
-
•
A set of practical guidelines for implementing the mental model in a catalog in a way that preserves comprehensiveness and comprehensibility (Section 3.4).
-
•
A user study that demonstrates the benefits of well-designed mental models for metadata management (Section 4).
Out of scope topics. This paper also has some non-goals:
-
•
This paper does not propose a full-fledged data catalog. We claim that any catalog benefits from well-designed mental models and we demonstrate that by comparing other catalogs’ mental models to the new one we propose. Consequently, we do not address all the practical concerns associated with implementing a data catalog.
-
•
A UI can help catalog users store and retrieve metadata. We do not discuss the problem of designing UIs that expose a catalog mental model in this paper, and we do not discuss the UX/IX challenges associated with this.
Metadata for Data Management. Metadata management solutions store metadata before a user performs any data management task. Users can use metadata to better solve their data management tasks, either by enabling construction of context-specific data management solutions, or by better using the outputs of existing data management solutions. An example of the former: if a table description indicates that all instances of geospatial data were collected in the United States, then an analyst’s preprocessing step may be to remove data instances whose latitudes/longitudes do not correspond to United States locations. An example of the latter: using stored table descriptions for a data repository, a user can determine which overlap similarity-based joins discovered in the repository are sensible, according to analysts’ domain knowledge.
Users face substantial overheads in solving their data management tasks due to their varying domains and types of expertise, which make it difficult for them to understand metadata provided by others. The lack of metadata management solutions that handle this human aspect, and not just the system scalability aspect, hampers data management efforts. We have informed the motivation and contributions of this paper by consulting with a large number of industry and science stakeholders, and we make an effort in connecting our work to other initiatives with the aim of contributing to metadata management academically and practically. We show that this representation is more comprehensible and easy to use compared to those of enterprise catalogs.
Outline. Section 2 explains the characterization of data management questions into the DGIC categories, as well as the ecosystem of data catalog and cataloging solutions. We introduce our mental model and guidelines for its implementation in Section 3. Section 4 presents evaluation results, followed by related efforts and related work in Section 5, and conclusions in Section 6.
2. Landscape of Data Catalogs
Consider Alice, the sales analyst from the introduction. In order to find training data for sales prediction, she needs past use, creation details, and schema details metadata.
In the example, sentences in italics indicate intermediary tasks that need to be achieved to address the goal. Each intermediate task can be assisted with relevant metadata, such as a dataset annotation explaining its past use–this would make it easier for Alice to determine if the dataset should be used for training machine learning models. Without this metadata available, solving each of these tasks is usually a time-consuming, tedious, and ill-defined process that consumes much of data workers’ energy because they may need to identify and chase the right person in the organization with the answers to their questions (that is, their required metadata).
Making that metadata available requires: i) creating the metadata and, ii) representing metadata in a way that is useful to other data workers. Metadata can be created automatically, via software, or manually, and a catalog must accommodate both. In this paper we are primarily concerned with ii): how to represent metadata.
| Representatives of Common Data Questions | DGIC Category | 5W1H+R Partition | ||
|---|---|---|---|---|
| Q1 | For what purpose was the dataset created? | G (Gebru et al., 2018; Wells, 2020) | Why | |
| Q2 |
|
G,C (Gebru et al., 2018) | Why | |
| Q3 | Who created the dataset? | G,C (Gebru et al., 2018; Halevy et al., 2016b) | Who | |
| Q4 | Who was involved in the data creation process? | G,C (Gebru et al., 2018) | Who | |
| Q5 |
|
G (Gebru et al., 2018) | Who | |
| Q6 |
|
C (Lawrence, 2017) | Who | |
| Q7 | Is there an access control list for the dataset? | G,D (Halevy et al., 2016b) | Who | |
| Q8 | What is the reputation of the creator of a dataset? | G (Gregory et al., 2019) | Who | |
| Q9 | What do the instances of the dataset represent? | D,G,I (Gebru et al., 2018) | What | |
| Q10 | What is the size of the dataset? | D,G,I (Halevy et al., 2016b) | What | |
| Q11 | Are there errors in the dataset? | D,G,I (Gebru et al., 2018; Gregory et al., 2019; Lawrence, 2017) | What | |
| Q12 | Does the dataset have missing values? | D,G,I (Gregory et al., 2019) | What | |
| Q13 | What is the domain of the values in this dataset? | D,G,I (Holland et al., 2018) | What | |
| Q14 |
|
G,I (Gebru et al., 2018) | How | |
| Q15 |
|
G,C (Wells, 2020; Bapat, 2020) | What | |
| Q16 | What is the quality of the dataset? | G (Bapat, 2020; Collibra, 2020; Lawrenz et al., 2020; Atlas, 2020) | What | |
| Q17 |
|
G (Gebru et al., 2018) | How | |
| Q18 |
|
G (Lawrence, 2017) | How | |
| Q19 |
|
G (Gebru et al., 2018) | How | |
| Q20 | What is the dataset’s release date? | D,G,I (Holland et al., 2018) | When | |
| Q21 | Is there an expiration date for this dataset? | D,G (Atlas, 2020) | When | |
| Q22 | How often will the dataset be updated? | G,I (Gebru et al., 2018) | When | |
| Q23 | When was the data last modified? | D,G,I (Halevy et al., 2016b) | When | |
| Q24 | How easy is it to download and explore this dataset? | D (Gregory et al., 2019) | Where | |
| Q25 |
|
D (Lawrence, 2017) | Where | |
| Q26 | What is the provenance of this dataset? | I (Zhang and Ives, 2020) | Relationship | |
| Q27 |
|
D,G,I (Yakout et al., 2012) | Relationship |
We define metadata and mental models in Section 2.1, we discuss the metadata landscape in Section 2.2, and conclude with a discussion of current data catalogs in Section 2.3.
2.1. Metadata and Mental Models
Data assets are artifacts describable with metadata, including relational tables, such as tables in databases, spreadsheets, or CSV files, rows or columns of these tables, unstructured files, derived data products, others, or groups of any of these. A metadata-item (MI) is a key:value pair where the key indicates a property of interest and value contains its value. The property of interest describes a data asset or a group of data assets. MIs are stored in a catalog via set(key, value) operations and retrieved using a get(key) operation. A catalog stores the MIs that refer to data assets.
Applications may describe the same property of a data asset differently, leading to different MIs. Or they may express the MI values using different representations, e.g., different units. This flexibility lets applications describe data assets without constraints but makes retrieving metadata challenging because the MI key is not known a priori.
A mental model (MM) is a partitioning of the metadata items into subsets , where . Without a MM available, retrieving a MI without knowing its key requires searching through all MIs. If a MM is available, retrieving a MI requires i) finding the where it belongs, and ii) searching through all MIs in . Mappings between MIs and MM’s partitions do not exist a priori and depend on users’ and applications’ understanding of both MIs and the MM’s partitions, i.e., users of the MM decide where to map a MI. A good MM is one that leads two users to agree, on the partition where a MI belongs without explicit communication. Hence, agreeing on a mental model leads to consistent decisions even when MM users in different teams have different technical skills, use different terminology, and/or do not communicate with each other.
Quality Metrics of a MM. A MM is comprehensive in the metadata it describes if every MI can be placed in a partition of the MM. A MM is comprehensible if it generates agreement on the mapping between MIs and partitions among users of a catalog implementing that MM. A MM is easy to use if MM users find it easy to map MIs to partitions. Many catalogs include a catch-all partition meant to capture metadata that does not fit in any other partition. Although catch-all partitions increase the comprehensiveness of a mental model, they reduce its comprehensibility because any metadata applies to this partition. We account for catch-all partitions in the evaluation section by considering a mapping to this partition as a None response, that indicates no mapping exists.
2.2. The Metadata Landscape
In practice there are many possible MIs used to facilitate data management tasks. To gain intuition on those commonly used we have surveyed research about various data-intensive applications such as DBMSs and machine learning literature, data curation research and efforts, and industry data catalog use cases. We have also consulted with data employees. We have extracted 155 DGIC questions data workers often face that would be addressed with access to the right MIs. These questions illustrate the metadata landscape we consider in this paper. By grouping redundant or highly similar questions (e.g., questions that were more specific versions of other questions) together, we have summarized the 155 questions into 27, shown in Table 1. Note that classifying a question means identifying a partition where its answer MI should be stored.
The DGIC questions. We do not claim our DGIC definitions are universal, but we find them useful for explaining the kinds of data questions we find in the literature, and our contribution (our MM) does not depend on them. We synthesized the definitions from multiple sources: Discovery involves selecting a subset of datasets from a larger set to satisfy specific criteria (Castro Fernandez et al., 2018; Halevy et al., 2016a; Collibra, 2020). Governance involves ensuring that the purpose of a data asset, and the method used to fulfill that purpose are understood by all data users. Note that our definition of governance is more inclusive than existing definitions (Knight, 2017), which consider governance tasks to be related to decision rights and accountabilities regarding who uses data, and for what. Integration involves combining existing data assets, which may require preparation (Chen et al., 2018; Deng et al., 2017). Compliance involves ensuring that data assets with sensitive information meet regulatory requirements (Koch, 2020; Becerra, 2021). We show in Table 1 the question classification into DGIC.
2.3. Analysis of Today’s Data Catalogs
We study existing data catalogs to understand what features they provide to store and retrieve metadata. The results are shown in Table 2. Keyword (W) means the catalog provides a full-text search feature to search for metadata. Key (K) indicates the catalog explicitly provides a pre-specified collection of MI keys, e.g., when the catalog provides a collection of MI keys which one can search through. Partition (P) indicates the catalog provides a partition of a MM to classify a MI (e.g., by providing a field where all metadata of a type can be added).
| D | G | I | C | |
|---|---|---|---|---|
| Berkeley’s Ground (Hellerstein et al., 2017) | K | P | P | P |
| Microsoft Azure Data Catalog (Howell, 2019) | W | P | P | P |
| Apache Atlas (Atlas, 2020) | W | P | P | P |
| Denodo platform (denodo, 2021) | W | P | P | P |
| SAP Data Intelligence platform (SAP, 2021) | W | P | K | K |
| Boomi Data platform (boomi, 2021) | W | P | P | P |
| WeWork’s Marquez (WeWork, 2021) | K | P | P | P |
| Lyft’s Amundsen (Lyft, 2022) | W | P | P | P |
| Ataccama Data Catalog (Ataccama, 2022) | K | K | P | K |
| Atlan Data Catalog (atlan, 2022) | W | P | P | P |
| Linkedin’s Datahub (Lan, 2019) | W | P | P | P |
| Informatica’s Data Catalog (Informatica, 2022) | W | P | P | K |
Some catalogs were designed to address different areas of DGIC so have more support for those than others. Although we are not aware if catalogs were designed around a MM explicitly, we can derive their MM from their documentation by observing what users need to know to store and retrieve different MIs. All the analyzed catalogs implement a MM consisting of: (i) partitions for an explicitly specified set of key:value pairs of metadata; and (ii) a catch-all partition: a single partition for all key:value pairs the catalog does not describe. Catalogs provide this catch-all partition not only to allow for the tracking of metadata it does not capture explicitly, but also to allow users to define their own domain-specific (or tribally-known) terms (e.g., for use among team members).
While the catch-all partition allows these MMs to be comprehensive in the MI they describe, they lead to lack of comprehensibility because they accept any MI (Section 2.1). Therefore, these catalogs sit in the bottom right corner of Fig. 2: it is easy to store MIs but difficult to find them later, especially for other users who did not store these MIs.
On the other hand, controlled vocabularies such as W3C DCAT consist of many partitions, each with a single key:value pair. This makes it easy to query data catalogs implementing this ontology as a MM as long as the terms in the vocabulary are known by the user who submits the query. However, it is difficult to represent metadata with these catalogs because each MI needs to be annotated with one of the many partitions. As a consequence, we classify controlled vocabularies in the top left corner of the Fig. 2 quadrant. We discuss how to leverage ontologies as part of data catalogs in Section 5.1.
3. The 5W1H+R Mental Model
In this section, we introduce the new 5W1H+R mental model. The 5W1H component of the MM applies to MIs of individual data assets (Section 3.1) and the +R component applies to relationships between more than one data asset (Section 3.2). We explain why the MM is comprehensive, comprehensible and easy to use in Section 3.3. We conclude by offering an implementation guide of the MM in a catalog (Section 3.4). This guide illustrates that it is possible to implement the MM in a catalog without losing its properties.
3.1. 5W1H-Profiles
Given a MI that describes one data asset, the MI fits into one of the 5W1H partitions of the MM. We have included a column with the 5W1H partition in Table 1 to explain where the MI useful to answer those questions fits. Note that we call each 5W1H partition of a data asset a profile.
A mnemonic for the 5W1H MM is the following: ”Why, When, and How does Who use a Data Asset (located Where) whose contents are described by What?”
Who-profile. Items identifying persons or software that created, modified, or can access the data asset, and/or explaining their relationship with the data asset (e.g. role information, access privileges to the data asset). A data question falls in this partition if: i) the question can be answered by information about who used the data asset before; ii) the question can be answered by information about who can access the asset. For example, the contact information of a data owner would belong in this partition.
What-profile. Information that requires looking at the data. A question falls in this partition if: i) it can be answered by reading the data directly and/or performing computations on the data. ii) it can be answered through (existing) semantic information about the data, such as schema annotations or descriptions. For example, the most frequent product name that appears in a relational table of customer transaction data would belong in this partition.
When-profile. Temporal information about the data asset lifecycle: when it was created, modified, when does it expire, etc. A data question falls in this partition if: i) the question can be answered by information about data asset usage during a particular time period; ii) the question can be answered by information about when the data asset is available. For example, the frequency with which a data asset is updated would belong in this partition.
Why-profile. Explains why the data asset exists, its purpose, and intended use. A data question falls in this partition if: i) the question can be answered by information about why the data asset was used a certain way, including why the data asset was created and deleted; ii) the question can be answered by information related to the intended uses of the data asset. For example, the specific research question a data asset was designed to answer (Mao et al., 2019) would belong in this partition.
Where-profile. Physical location of the data asset and information about how it is accessed. A data question falls in this partition if: i) the question can be answered by information about how to access this data asset; ii) the question can be answered by information about the format of the data asset being stored (such as CSV file vs. postgres table vs. mysql table). iii) the question can be answered by information about the source where this data asset can be located. For example, the name of the database where the data asset is stored would belong in this partition.
How-profile. Information about the processes that produced, modified, or read the data asset. This includes data collection and preparation methods, as well as programs, queries, or artifacts that were run on the data asset. A data question falls in this partition if this question be answered by information about how a data asset has been used (read, modified, or created) for a task/application. For example, the script used to remove missing values from a CSV file so that accurate statistical analysis can be performed would belong in this partition.
3.2. Relationships Profile
When a MI refers to more than one asset we do not use a profile, but a relationship. Examples of such MIs that are already considered useful for facilitating discovery and integration come from the current data management literature on metadata extraction: the Jaccard similarity between 2 columns as data assets and containment (inclusion dependencies) between columns are used to guess whether the entities two columns represent are the same. This is used in data discovery systems such as Aurum (Fernandez et al., 2018) to allow users to search for columns that are similar. Another example is a link or reference to a dataflow graph describing provenance (the set of operations used to derive one data asset from another). This can be used to guess how raw data has been processed, and what processing may still be needed. This is also used in data discovery systems, such as Juneau (Zhang and Ives, 2020), to allow users to search for tables that are likely to have been generated by performing operations on a table the user is familiar with. Other examples come from literature on collaboration between data scientists, such as the team responsible for creating/maintaining multiple data assets (Koesten et al., 2019), or the specific tool/script used to run analysis on a group of data assets (Mao et al., 2019).
The MM includes a relationship partition (+R) to describe these MIs. As with individual items, it is useful to think about the types of relationships the MM should support in terms of the 5W1H partitions. For example, consider 2 columns as data assets. Their Jaccard similarity and containment (inclusion dependency) is a relationship on their What-Profiles because both can be computed by looking at the data. In fact, any properties that can be computed by reading one or more assets, such as Jaccard similarity and containment, are relationships on the What-Profiles of all assets involved. The 5W1H partitions can describe not only these types of metadata used to describe relational properties and similarities between columns and tables, but also other types of relationships. A PK/FK relationship can be represented as a Why-Profile if the table PK/FK columns were produced with the purpose of indicating a join relationship between two relations. Consider relations A and B, where B is a version of A. We can express their temporal relationship using a When-Profile, their provenance using a How-Profile, etc. We can relate assets according to who created them, or who accessed them using relationships on Who-Profiles. And we can store relationship MI as combinations of profiles of related assets.
Example. Consider our example from Section 1. If Alice could not only examine past use of one dataset, but find all datasets that are related in that they were used to train the same ML model (related on how-profiles), related in that they were created by the same trustworthy data engineer (related on who-profiles), and related in that all datasets contain relevant attribute names (related on what-profiles), Alice’s search is much easier than if she tries to view each individual dataset to see if it was used for training.
3.3. The 5W1H+R MM Rationale
The 5W1H+R MM bounds disagreements when setting/getting MIs by presenting users with a MM with high cognitive fit, i.e., one that leads users to implicitly agree on the mapping of a MI to a MM’s partition. On choosing the MM we strived to make it comprehensive, comprehensible, and easy-to-use:
-
•
Comprehensive. Journalists use 5W1H to cover news because it leads to a broad coverage of the event. We could represent all 155 DGIC questions extracted from the literature in the MM. We include the 5W1H+R partition along with the 27 questions that synthesize the corpus in Table 1.
-
•
Comprehensible. The 5W1H+R MM has high cognitive fit (Vessey, 1991) with any task involving the storage or retrieval of metadata. A MM has cognitive fit with a task if there is a common mapping among users performing the same task between a MM’s internal representation (the way the MM partitions metadata) and the external task representation (a user’s specification of the metadata required).
-
•
Easy-to-use. The 5W1H+R MM is explained in natural language. Most natural languages describe objects and events using 5W1H, making it a familiar set of terms to most people, technical and non-technical alike.
A MM with the above qualitative properties partitions metadata such that the overall communication effort of storing or retrieving metadata is low. We provide quantitative data substantiating the above, obtained through a user study, in Section 4.
3.4. Guide to Mental Model Implementation
The 5W1H+R MM is comprehensive and comprehensible, but one may implement it in a catalog in a way that loses these properties. In this section, we briefly illustrate how the 5W1H+R mental model can be implemented in a catalog without losing its comprehensiveness and comprehensibility by explaining the following practical guidelines for such a catalog, and explaining how current data management technologies can be used to implement them.
G1. Maintain cognitive fit. The catalog conceptual schema should explicitly represent the 5W1H+R profiles and relationships to maintain high cognitive fit (high comprehensibility). For example, in the catalog database schema, there should be a table for each 5W1H profile and relationships. If this guideline is not provided by the catalog, then users will map their metadata to other entities either before or instead of using the 5W1H+R partitions. If a user maps their metadata to another entity before using the 5W1H+R MM, then they must be able to map the entity into one 5W1H+R partition, which may not be possible (e.g., the entity consists of a user, the script run by the user, and the file repository where a data asset belongs). If a user maps their metadata to another entity instead of using 5W1H+R, then they lose the comprehensibility property that the 5W1H+R MM provides. In both these cases, the user potentially loses the comprehensibility of the 5W1H+R MM. Common schema design methodologies used in data management such as snowflake schemas(Singh, 2020) and data vault(Linstedt, 2015) accommodate this guideline.
G2. Preserve history. At any point, different users may be producing MIs about the same data asset. The catalog must represent all versions of MIs referring to the same data asset, and let the consumer of that metadata reconcile or decide which one to trust. This means that operations on the catalog are append-only and that updates should only be allowed in special circumstances, i.e., when a user wants to correct a mistake. For example, a user may choose the word ”uniques” to describe the number of unique values in a relation column but express the quantity with a ratio, while a software profiler may choose ”unique_number_values ” and store the absolute number instead. It is not the responsibility of a catalog to decide whether one of these names is preferred–the catalog implements a MM to bound disagreements (as opposed to eliminating them). The catalog should expose both versions to consumers, who may decide to run software that indicates statistical similarity above a threshold, resolve the ambiguity manually, or live with different definitions. To decide, consumers not only have the different versions available, but also the audit metadata associated with each entry. This brings us to our next guideline.
G3. Track audit metadata. Audit metadata is information about the set and get operations users perform on metadata in the catalog. Such audit metadata is stored in order to help catalog users better track and understand their metadata so they can perform tasks such as tracking how a property of a data asset evolved over time, or, as explained by (G2), they can reconcile differences in MIs that share the same key, but have different values (e.g., by trusting the MI with the later timestamp). A catalog schema must represent, in addition to the mental model, audit metadata that includes who (what user) is setting a MI, the version of the MI (to differentiate among existing ones), and the time at which the MI was stored. Many catalogs track this audit metadata already (Lan, 2019; Lyft, 2022), and even if they do not, there are event streaming solutions (Foundation, 2017) that can facilitate the tracking of audit metadata as well.
G4. Support for complex metadata. MIs can be represented in many different formats: primitive types may be sufficient to describe some MIs (e.g., the average of a numerical column of a CSV file), but other MIs may be better represented with more complex data types (e.g., the list of users who maintain a data asset). The catalog should accommodate complex values for metadata items so it must not impose a fixed primitive type. We can represent MIs as key:value pairs, which can be efficiently supported in modern database systems with a JSON type. This permits storing arbitrary objects in the value, including URLs to externally stored metadata.
A catalog implementing the above 4 guidelines, which can be obtained through existing technologies, can implement the 5W1H+R MM or any other comprehensive comprehensible MM. Specifically, such a catalog represents the MM profiles and relationships in its schema (e.g., by creating tables for each profile) (G1), is capable of uniquely identifying multiple versions of the same MI (G2) using audit metadata (G3) (e.g., by using event streaming to track audit metadata), and the MIs can be represented with a type compatible general key:value representation (e.g., as JSON objects) (G4).
4. Evaluation
In this section, we present the evaluation results. A good metadata mental model is comprehensive, comprehensible, and easy to use. The 5W1H+R MM is comprehensive: we could represent metadata items (MIs) answering all 27 questions (see Table 1) that were synthesized from 155 questions found in diverse literature, blog posts, and reports from data users. Then, in this section, we evaluate whether the mental model is comprehensible and easy to use. To achieve that we conduct a user study where we measure the comprehensibility and ease-of-use of the 5W1H+R MM, and compare it with that of Google’s(Google, 2020) and LinkedIn’s(Lan, 2019) catalog solutions. We first introduce the mental models we use in the user study in Section 4.1. We follow with the design of the user study in Section 4.2 and present the results in Section 4.3.
4.1. Target Mental Models
We compare the 5W1H+R MM with those of LinkedIn’s Datahub(Lan, 2019) and Google Data Catalog (GCS)(Google, 2020). Datahub and GCS are good representatives of both open-source catalogs such as Amundsen(Lyft, 2022), Marquez(WeWork, 2021), Apache Atlas(Atlas, 2020), and cloud service catalogs such as Microsoft Azure Data Catalog(Howell, 2019), Denodo Cloud Platform(denodo, 2021), and SAP Data Intelligence(SAP, 2021). Due to the increasing interest in data catalogs, new offerings appear frequently 111an industrial collaborator tells us they have tested 40 different catalogs, but these catalogs remain a good representation of today’s offerings.
Today’s catalogs do not have an explicitly designed mental model. Instead, data users learn the schemas exposed by these catalogs, e.g., via the UI or other APIs, and use those to store and retrieve metadata. Therefore, to extract a catalog mental model, we designed a rubric. Then, 3 of the authors applied the rubric to each of GCS and Datahub independently. Finally, we derived those catalogs’ mental model from the output of applying the rubric, and we used them for the study.
Rubric. The goal of the rubric is to provide guidelines to determine the list of metadata entities and attributes that a catalog exposes to data users. The rubric is as follows:

Step 1. Each author deploys the target catalog and inserts a data asset (i.e., table or spreadsheet) into the catalog. In the process of doing so, the author: (i) records the terminology provided by the catalog’s UI when inserting the asset (e.g., the names of the text fields for entering metadata). Each recorded term is an entity: a category of information about a data asset. We say a data asset ”has ”. (ii) Record terminology the data catalog generates for a data asset upon insertion (e.g., automatically-generated five-number summaries of numerical columns). (iii) Record any constructs for inserting further metadata a user may want to provide for a data asset. (e.g., a ”tags” page). Such constructs are catch-all partitions where users can store/retrieve any metadata the catalog’s schema does not explicitly represent.
Step 2. Each author examines how the catalog represents the inserted asset. They record the titles of groups of entities provided about an asset (e.g., ”Properties”, or ”Documentation”), as well as entities themselves. Groups normally come in the form of tabs, or headings. We say an asset ”has” , where is the title of a group of entities, and in turn ”has” entities as its attributes.

Step 3. Each author represents the MM using the list of entity-attribute statements that are of the form ” has ”. They start with statements of the form ”A data asset has ”. These groups represent the highest-level distinction a catalog makes about metadata. Therefore, the titles of these groups are the partitions that form the catalog’s MM.

4.2. Between-Subjects Study Design, Participant Recruitment, and Threats to Validity
We implement the user study as a survey distributed via Prolific (Prolific, 2021) to 160 participants. The high-level flow of the study is as follows. First, we present participants with the questions from Table 1 and ask them to rank familiarity with those questions. We only ask them questions about those questions they are very familiar with: this is how we ensure they are data users. Second, we present them one of the three MM, and make sure they were not familiar with the MM a priori to avoid confounding effects. Then, for each set of questions they claimed familiarity with and the assigned MM, we gather results on the two metrics of interest as follows.
Consistency: a measure of comprehensibility Each participant classifies the question to a MM’s partition. If they find no partition is adequate, they choose None, (analogous to selecting the catch-all partition in GCS or Datahub). As an example of this classification, consider the MI indicating whether a dataset contains PII. A user may classify this as a What-profile according to the 5W1H+R MM, since one needs to look at the data to determine this. A user may classify this as a Table Schema according to the GCS MM and Schema according to the Datahub MM, as schema details need to be known in order to determine whether any table attribute contains PII. Participants’ partition choices for a question provide a frequency distribution over the partitions of a MM. We use this frequency distribution to measure the extent to which participants chose the same partition (or the same few partitions) for a question. Concretely, if most participants classified a question into one partition, that indicates there is an agreement among users on where a MI belongs. Contrast that with an inconsistent MM that would cause users to be divided on which partition to choose in the worst case; the worst case being an even distribution of answers, leading to a uniform frequency distribution.
We use entropy as a metric of consistency. The uniform distribution (even distributed answers) leads to maximum entropy, while full agreement on 1 partition leads to lowest entropy. Then, a consistent mental model is one that produces a low entropy distribution on the answers to the DGIC questions.
Using Entropy Adequately. Using entropy introduces a challenge in comparing consistencies because different MMs contain different number of partitions. A lower entropy may be caused for the following reasons that would not correspond to high consistency: (I1) the MMs have vastly different numbers of partitions. The fewer partitions a MM has, the lower its entropy can be, so results would be skewed in favor of the smaller MM. (I2) there are fewer respondents than the number of partitions for a question. Then, low entropy may be misleading because at least one partition can never be chosen. We made sure none of these reasons apply to our setting. I1 does not apply because the number of MM partitions is roughly the same: 5W1H+R and GCS both have 7 partitions, and Datahub has 6. I2 does not apply because in all cases, we made sure there were more participants than number of partitions.
That said, we normalize the entropy to help interpret the results and address I1 above. This allows us to measure the extent to which a distribution differs from uniform on a scale from 0 to 1, where 0 indicates that the distribution is farthest from uniform, and 1 indicates that the distribution is exactly uniform. Therefore, we can compare the normalized entropies of two frequency distributions to conclude that the one with lower normalized entropy is farther from uniform (more consistent) than the other.
Finally, we also analyze None response frequency. A MM that causes participants to choose None more often is less comprehensible because it makes it less likely that data users will agree on a partition for storing/retrieving a MI.
Ease-of-Use: a MM’s ease-of-use for a data question is measured asking data users to score the difficulty, which we do using the standard Likert scale (a 1-5 difficulty rating, with 1 being ”Very Easy”, and 5 being ”Very Difficult”).
4.2.1. Participant Recruitment
We use Prolific for running the user study because it respects users’ privacy better, being based in UK and hence subject to GDPR and giving users the option to remove their data. Further, Prolific’s completion rate is higher than that of other crowd platforms. We use a combination of Prolific filters to make sure that only participants with formal education can participate, as we expect these are the ones in positions of data engineering, business analysts, and other data users. Furthermore, we make sure English is their first language because the study is written in English.
In addition to the Prolific filters, we run a thorough pre-screening survey. To identify real data users, we ask participants to rate their familiarity with our questions. We only ask them to classify questions they rather with high familiarity, thus avoiding confounding effects related to lack of understanding, lack of context, or lack of skill to answer a question. We also ask participants which catalogs they are familiar with and we do not show a participant the MM from a catalog they are familiar with.
4.2.2. Threats To Validity
We conducted several pilot studies with database researchers and non-technical people alike to hone the survey language and identify threats to validity. Based on our findings we implemented the following measures during the study design to avoid such threats:
Ordering and Learning Effects: We use a between-subjects study, which complicates our statistical analysis and data collection, but avoids learning effects of answering questions across MMs because each participant is shown only one MM.
Selection Effects: We use the prescreening questions and Prolific filters to select a homogeneous participant pool with data management familiarity. We assign MMs to participants in the pool randomly, and they only answer questions they understand.
Experimenter Bias: We mitigate the effects of experimenter bias by generating all MMs using the same procedure (Section 4.1), and presenting these MMs to participants with the same instructions on how to use each. Because the study is an online survey, participants are not further exposed to our bias.
Reactivity Effects: We ask participants to rate the difficulty of categorizing data questions. We mitigate the potential Hawthorne effect (Adair, 1984) by wording the questions carefully (after several pilot studies) and by explaining in the survey introduction that the survey is intended to evaluate the MMs and not the participants’ ability.
4.3. Study Results
We present the consistency and ease-of-use results. For all results, we say 5W1H+R MM is Better if it outperforms both MMs, Inconclusive if it outperforms only one, and Worse if it outperforms neither.
4.3.1. Consistency
The 5W1H+R MM is more consistent than the others: it achieves lower entropy and participants choose None significantly less frequently than in other MM.
| Better | Inconclusive | Worse | Average | |||||||||||||||||||||||||
|---|---|---|---|---|---|---|---|---|---|---|---|---|---|---|---|---|---|---|---|---|---|---|---|---|---|---|---|---|
| MM | Q1 | Q2 | Q3 | Q4 | Q8 | Q9 | Q10 | Q13 | Q15 | Q17 | Q18 | Q19 | Q22 | Q23 | Q27 | Q5 | Q6 | Q7 | Q11 | Q12 | Q14 | Q16 | Q20 | Q21 | Q24 | Q25 | Q26 | |
| 5W1H | 1.06 | 1.34 | 0.81 | 0.93 | 0.99 | 1.83 | 1.73 | 1.9 | 1.94 | 1.83 | 2 | 2.37 | 1.6 | 0.61 | 1.58 | 1.52 | 2.42 | 1.97 | 1.81 | 2.25 | 2.06 | 2.09 | 1.46 | 1.13 | 1.84 | 2.07 | 2.72 | 1.698 |
| GCS | 2.4 | 2.72 | 2.6 | 2.52 | 2.66 | 2.68 | 2.48 | 2.67 | 2.32 | 2.4 | 2.49 | 2.61 | 2.05 | 1.01 | 2.28 | 2.12 | 2.44 | 1.78 | 2.35 | 2.36 | 2.49 | 2.48 | 1.44 | 0.68 | 2.02 | 1.81 | 1.88 | 2.212 |
| Datahub | 2.27 | 2.15 | 1.65 | 1.34 | 1.8 | 2.36 | 2.18 | 2.52 | 2.01 | 2.25 | 2.37 | 2.38 | 1.91 | 1.23 | 1.66 | 1.41 | 2.02 | 1.92 | 1.73 | 2.03 | 1.63 | 1.87 | 2.06 | 1.64 | 1.65 | 1.67 | 1.81 | 1.903 |
| Better | Inconclusive | Worse | Average | |||||||||||||||||||||||||
|---|---|---|---|---|---|---|---|---|---|---|---|---|---|---|---|---|---|---|---|---|---|---|---|---|---|---|---|---|
| MM | Q1 | Q2 | Q3 | Q4 | Q8 | Q9 | Q10 | Q11 | Q13 | Q15 | Q17 | Q18 | Q19 | Q22 | Q23 | Q27 | Q5 | Q6 | Q7 | Q12 | Q14 | Q16 | Q20 | Q21 | Q24 | Q25 | Q26 | |
| 5W1H | 0.37 | 0.47 | 0.29 | 0.33 | 0.35 | 0.65 | 0.62 | 0.64 | 0.67 | 0.69 | 0.65 | 0.71 | 0.84 | 0.57 | 0.22 | 0.56 | 0.54 | 0.86 | 0.7 | 0.8 | 0.73 | 0.74 | 0.52 | 0.4 | 0.65 | 0.73 | 0.96 | 0.603 |
| GCS | 0.85 | 0.97 | 0.92 | 0.89 | 0.95 | 0.95 | 0.88 | 0.83 | 0.95 | 0.82 | 0.85 | 0.88 | 0.93 | 0.73 | 0.36 | 0.81 | 0.75 | 0.87 | 0.63 | 0.84 | 0.88 | 0.88 | 0.51 | 0.24 | 0.72 | 0.64 | 0.67 | 0.785 |
| Datahub | 0.86 | 0.82 | 0.63 | 0.51 | 0.68 | 0.9 | 0.83 | 0.66 | 0.96 | 0.77 | 0.86 | 0.9 | 0.91 | 0.73 | 0.47 | 0.63 | 0.54 | 0.77 | 0.73 | 0.77 | 0.62 | 0.71 | 0.78 | 0.63 | 0.63 | 0.64 | 0.69 | 0.727 |
| MM | Q1 | Q2 | Q3 | Q4 | Q5 | Q6 | Q7 | Q8 | Q9 | Q10 | Q11 | Q12 | Q13 | Q14 | Q15 | Q16 | Q17 | Q18 | Q19 | Q20 | Q21 | Q22 | Q23 | Q24 | Q25 | Q26 | Q27 | Nones | Responses | Proportions |
|---|---|---|---|---|---|---|---|---|---|---|---|---|---|---|---|---|---|---|---|---|---|---|---|---|---|---|---|---|---|---|
| 5W1H | 0.03 | 0.39 | 0.03 | 0.06 | 0.12 | 0.23* | 0.14 | 0.24 | 0.23 | 0.30 | 0.56* | 0.39* | 0.15 | 0.03 | 0.19 | 0.34* | 0.23 | 0.27 | 0.29* | 0.03 | 0.06 | 0.16 | 0.06 | 0.35* | 0.1 | 0.27* | 0.06 | 165 | 832 | 0.199 |
| GCS | 0.27* | 0.42* | 0.34* | 0.2 | 0.33* | 0.46* | 0.15 | 0.71* | 0.12 | 0.27* | 0.68* | 0.51* | 0.20* | 0.24* | 0.30* | 0.51* | 0.42* | 0.47* | 0.51* | 0.12 | 0.12 | 0.42* | 0.2 | 0.20 | 0.03 | 0.35* | 0.25* | 340 | 1033 | 0.329 |
| Datahub | 0.30* | 0.61* | 0.11 | 0.24 | 0.09 | 0.48* | 0.08 | 0.36* | 0.19 | 0.43* | 0.22 | 0.36* | 0.22* | 0.21 | 0.37* | 0.37* | 0.33* | 0.42* | 0.43* | 0.40* | 0.44* | 0.44* | 0.09 | 0.34 | 0.03 | 0.36* | 0.12 | 331 | 1109 | 0.298 |
Entropy. The entropy results of Table 3 show that the 5W1H+R MM has lower entropy than others in 15 questions, and is worse in only 2/27. When normalizing the entropy per number of concepts in the mental model, the results hold. Table 4 show the 5W1H+R MM has lower normalized entropy than others in 16 questions, and that it is worse in only 2/27. Furthermore, it has a lower average normalized entropy overall.
Choosing None. None answers indicate a weakness of a MM the greater their frequency, the less likely it is that MM users will agree on a partition from the MM for storing/retrieving a MI. Table 5 shows that participants using 5W1H+R chose this option with the lowest proportion out of all responses, and with the least absolute amount; less than half as frequently as in other MMs. In 18 out of 27 questions, the lowest proportion of participants chose it compared to other MMs. Finally, None was the most selected answer out of the MM partitions for only 7 questions when using the 5W1H+R MM, as opposed to 19 and 16 for GCS and Datahub, respectively.
Lower entropy and lower use of None demonstrate the 5W1H+R MM has higher consistency, and is therefore more comprehensible.
4.3.2. Consistency Results in Depth
In this section, we explain the results in greater depth by zooming in on details on the frequency distributions for 2 data questions where 5W1H+R outperforms others, and 1 data question where it does not. One potential threat to validity that may explain the success of 5W1H+R MM compared to other MMs is the similarity in keywords between 5W1H+R MM partitions and the questions we used in our experiments (e.g., a question that begins with What is a what-profile, Where is where-profile, etc.). While we do not observe this similarity (as we will see below), we also argue that this is not an actual threat to validity. Rather, it is another property of the 5W1H+R MM that can make it more comprehensible compared to other MMs.
| Better | Inconclusive | Worse | |||||||||||||||||||||||||
| MM | Q1 | Q2 | Q3 | Q4 | Q9 | Q18 | Q20 | Q27 | Q5 | Q6 | Q7 | Q8 | Q10 | Q12 | Q13 | Q14 | Q15 | Q16 | Q17 | Q19 | Q21 | Q22 | Q23 | Q24 | Q26 | Q11 | Q25 |
| 5W1H | 2** | 2** | 2** | 2** | 3* | 3* | 2* | 2* | 3 | 3* | 3* | 3 | 3 | 3 | 3** | 3** | 3 | 3 | 3 | 3* | 2* | 3** | 2 | 3* | 3 | 4 | 3 |
| GCS | 3 | 3 | 3 | 3 | 3.5 | 4 | 3 | 3.5 | 3 | 4 | 3 | 3 | 3 | 4 | 3 | 3.5 | 3 | 3 | 3 | 3 | 2 | 3 | 2 | 3 | 4 | 4 | 2 |
| Datahub | 3 | 3 | 3 | 3 | 3.5 | 3.5 | 3 | 3 | 3 | 3 | 3 | 3 | 3 | 3 | 3 | 3 | 3 | 3 | 3 | 4 | 3 | 3 | 2 | 3 | 3 | 3 | 3 |
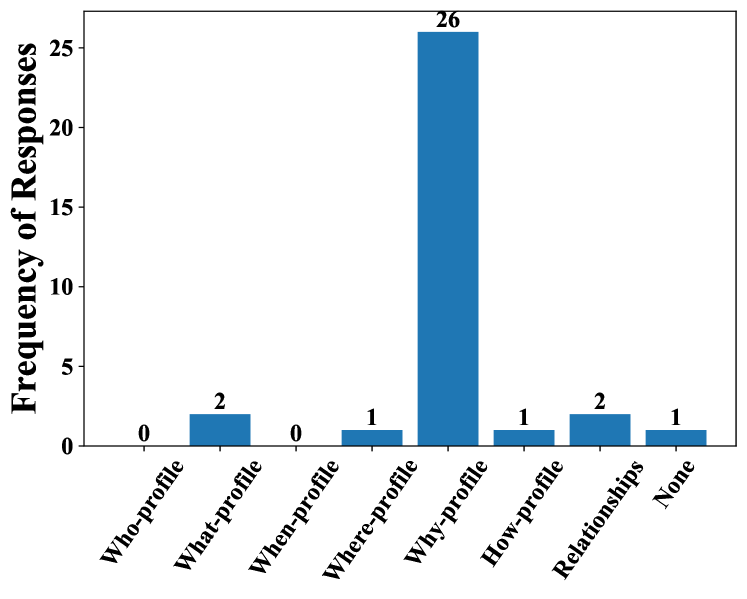
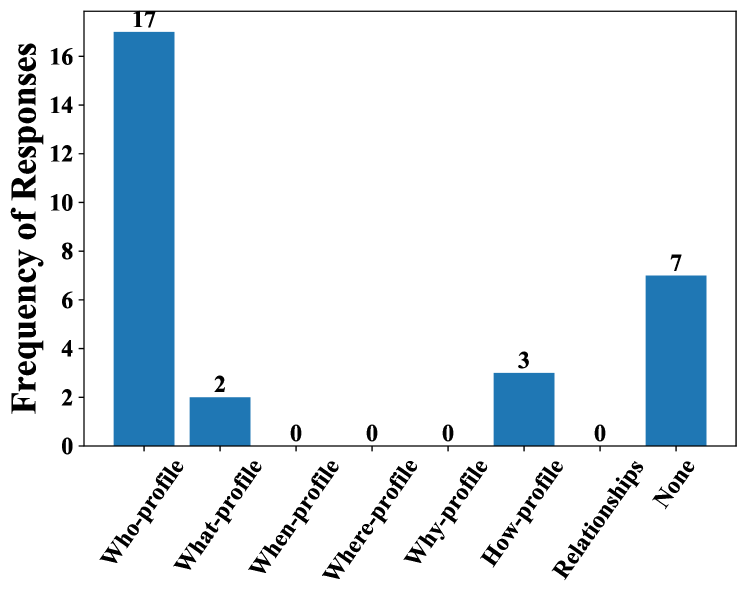
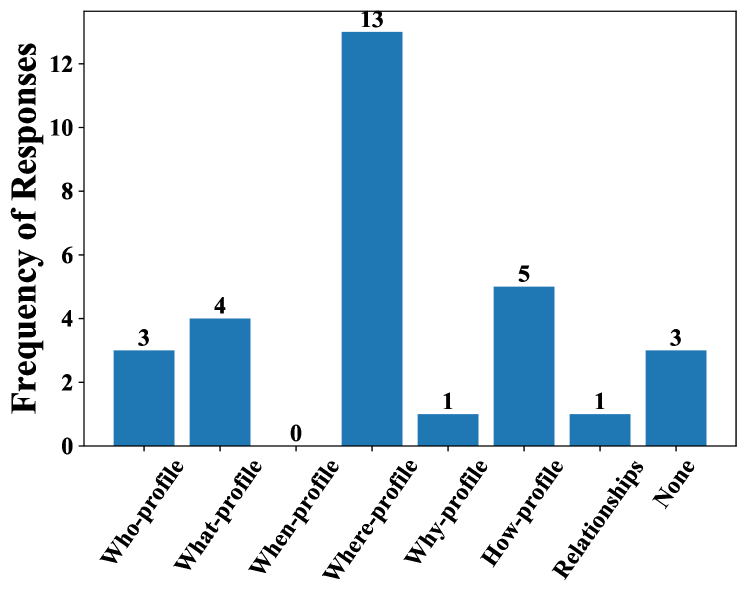
Q1-For what purpose was the dataset created?. From Table 3, we see that the entropy of the 5W1H+R MM is 1.06, whereas it is 2.4 for GCS, and 2.27 for Datahub, a difference of at least 1.21. It is obvious from the frequency distributions in Fig. 6 why 5W1H+R outperforms GCS and Datahub: most 5W1H+R participants chose Why-profile to answer this question, and very few others chose any other answer. In contrast, GCS and Datahub participants were more divided on this question.
We interpret the underlying reason for 5W1H+R’s better consistency in this case to be that it is more comprehensive compared to other MMs, because there is no partition in either GCS or Datahub that explicitly captures the purpose of a dataset, even though this information is commonly required in practice when machine learning engineers need to understand the origin of a training dataset (Gebru et al., 2018), or when scientists need to understand whether data they already have can be used for a new purpose (Neang et al., 2021). On the other hand, the definition of ”Why-profile” clearly includes this question. The higher number of Nones in the GCS and Datahub MMs further supports this interpretation: the 5W1H+R MM has only 1 None answer, but GCS and Datahub have 11 and 13, respectively.
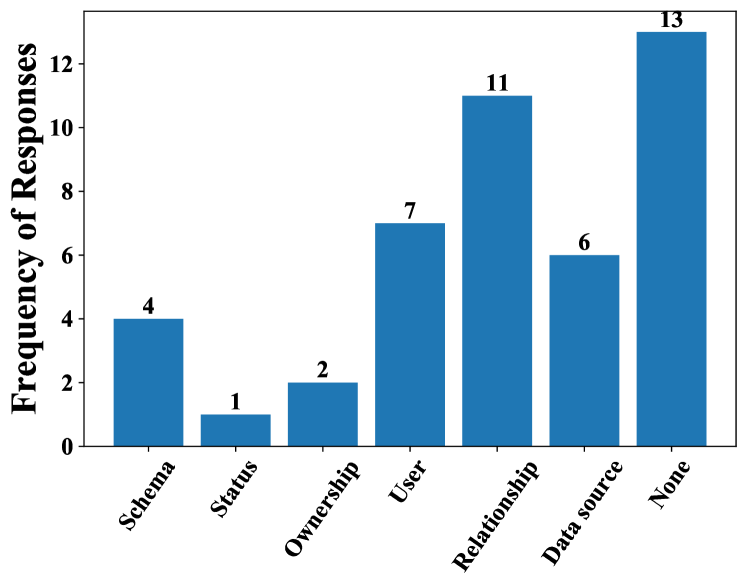
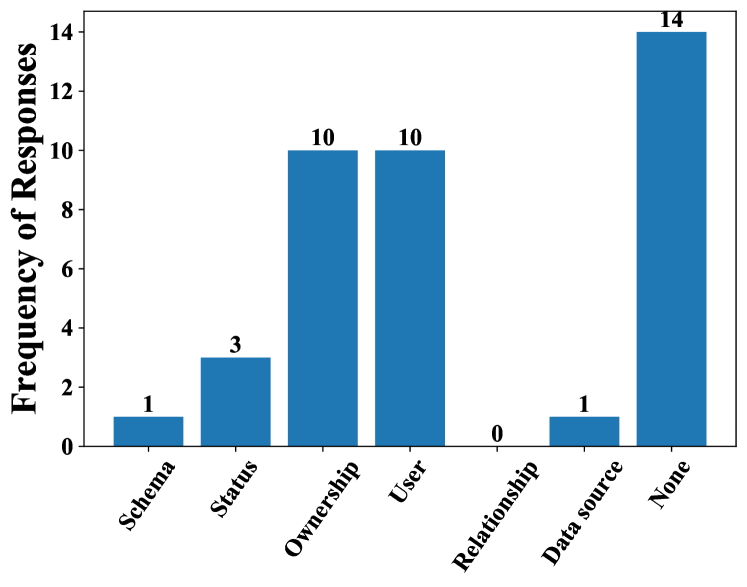
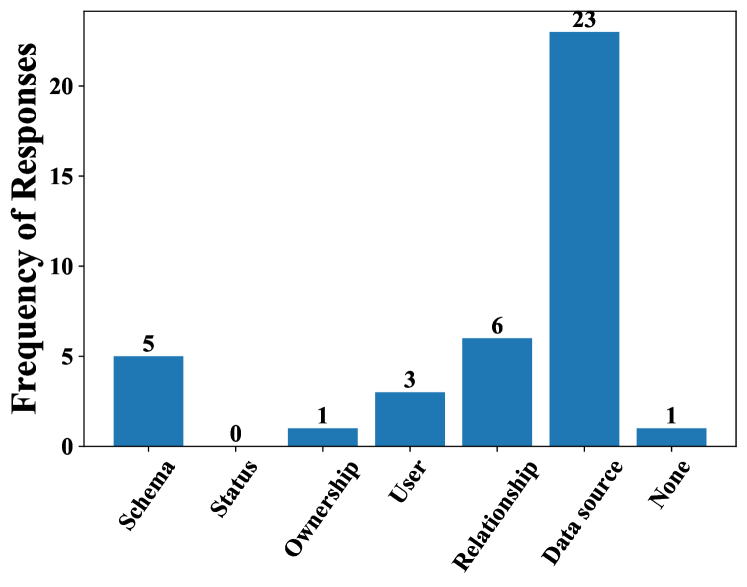
Q8-What is the reputation of the creator of a dataset?. From Table 3, we see that the entropy of the 5W1H+R MM is 0.99, whereas it is 2.66 for GCS and 1.8 for Datahub, a difference of at least 0.81. For this question, note that the Datahub frequency distribution in Fig. 7 has two peaks: one for the ”User” partition, and one for the ”Ownership” partition, whereas the most popular partition for the 5W1H+R MM is ”Who-profile”. Our interpretation of this is that participants deduced that reputation could be inferred from information about a user of a dataset. However, because there were two partitions for user-related metadata, participants could not agree on where this metadata would be found. This example illustrates how a catalog user who is trying to determine a dataset creator’s reputation can be confused about whether to find the creator’s most up-to-date details in ”Users”, or ”Ownership” if they have to rely on the Datahub MM. Therefore, our interpretation of the underlying reason for 5W1H+R’s better consistency in this case is that it has a single partition for metadata about data users (including creators of datasets). Therefore, there is no disagreement on where to find data-user-related metadata.
5W1H+R outperforms GCS for the same reason as before: there is no clear consensus from participants who chose a partition from GCS (Fig. 7), and None was the most popular answer. This indicates there is no partition that captures the reputation of the creator of a dataset in GCS.
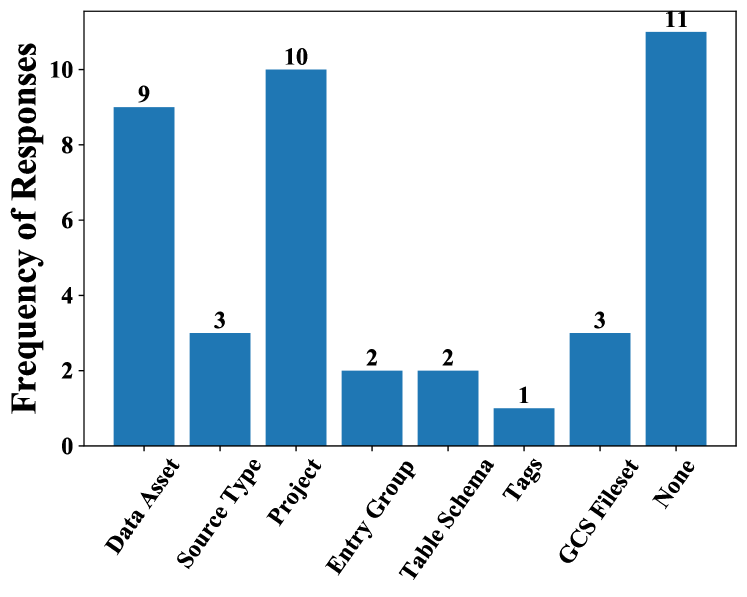
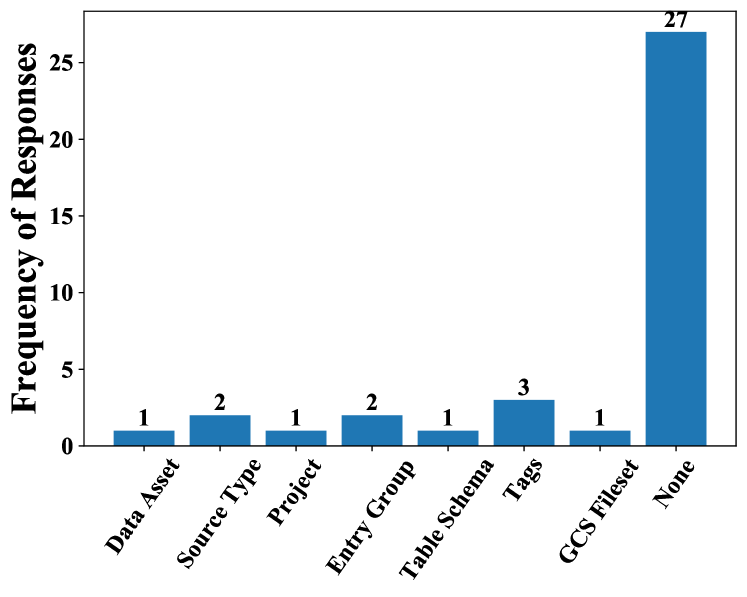
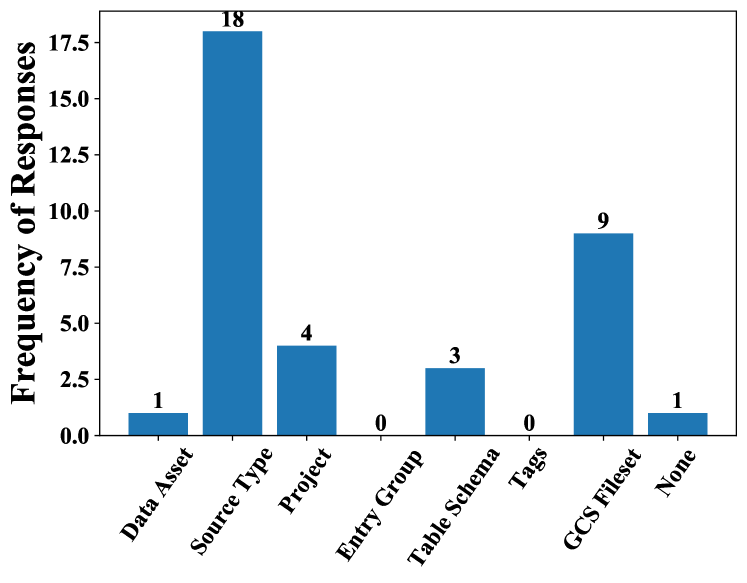
Q25-What is the format of the dataset, and what type of repository is the dataset located in?. We complement our in-depth analysis with a question where the 5W1H+R MM does worse than the others. From Table 3, we see that the entropy of the 5W1H+R MM is 2.07, whereas it is 1.81 in GCS, and 1.67 in Datahub, a difference of only 0.26. From the frequency distributions in Fig. 8, we see that 5W1H+R underperforms in this case: participants were more divided when using 5W1H+R than in the GCS case, where 18 participants chose the ”Source Type” partition, and very few participants chose any other partition, or the Datahub case, where 23 participants chose the ”Data source” partition, and very few participants chose any other answer. (But ”Where-profile” still appears to have been chosen over the other partitions).
We interpret the underlying reason for 5W1H+R’s worse consistency to be that the other MMs have partitions whose definitions explicitly capture the answer by using more concrete language: in Fig. 4 and Fig. 3, the definitions of ”Source Type” and ”Data source” clearly answers this question, and the term ”repository” appears in these definitions, along with examples of repository formats. In contrast, the ”Where-profile” partition definition does not explicitly say that a Where-profile records metadata about repositories and their formats. This is a case where the 5W1H+R MM suffers because it does not provide any entities for describing metadata beyond the profiles. We discuss how more specific entities from ontologies could be used to complement the 5W1H+R MM in Section 5.1.
4.3.3. Results: Ease of Use
Table 6 shows that the 5W1H+R MM has the same or lower median difficulty than the others for 25 out of the 27 questions. Further, using a Mann-Whitney U Test, we find that there is a significant difference between the 5W1H+R median difficulty rating and the median difficulty rating of at least one of the other MMs for 16 of the 25 questions. This result suggests that for most questions, the 5W1H+R MM is easier to use compared to other MMs. In summary, this means participants had an easier time deciding where to classify a question MI when using 5W1H+R than when using other MM.
DGIC Tasks with 5W1H+R. One may wonder if the above consistency and ease-of-use results apply similarly for each of the DGIC question categories. Stratifying the results of Tables 3 and 6 by DGIC category generates similar consistency and ease-of-use results within each category. This indicates the 5W1H+R MM reduces the effort required for DGIC tasks and is further indication of its comprehensiveness.
5. Existing Efforts & Related Work
We discuss how our MM complements existing metadata management efforts (Section 5.1) and related work (Section 5.2).
5.1. Connection to Metadata Efforts
We discuss how the 5W1H+R MM complements existing metadata management initiatives here:
FAIR Principles. Catalogs are designed to manage metadata, which is a keystone to making datasets findable, accessible, interoperable, and reusable. A comprehensive, comprehensible, easy-to-use MM for representing metadata can help provide data users with a common framework for understanding a dataset, facilitating reusability.
Ontologies. Although we have argued against ontologies as a catalog’s MM, they can annotate contents within a MI, hence complementing MMs by providing more specific terminology for MIs within a partition. Concretely, annotations describe the meaning of MI’s keys and values. For example, one can use W3C DCAT’s terms of ”dataset distribution”, and ”temporal coverage” as What-profile key names, since these can be found by looking at the data.
ML model tracking. MLFlow (Zaharia et al., 2020) and ModelDB (Hines et al., 2004) track the lifecycle of machine learning model engineering and deployment. Both systems produce metadata that describes training datasets and models. Such metadata can be represented in the 5W1H+R MM. First, models and datasets are data assets in the MM. The metadata generated can be mapped to partitions in the MM. For example, the location of the code file, model parameters, and metrics become How-profiles. A provenance Relationship captures the link between model and the data used to fit the model, as well as plots and other derived data products. Model annotations and descriptions can be represented using the What-profile table of a 5W1H+R data catalog. Finally, different runs fit well with the versioning of What-Profiles along with the use of When-Profiles.
Feature Stores. Many feature stores have been created to store features (Feast, 2022; Amazon, 2022; tecton, 2022; Hopsworks, 2022), along with all metadata required to choose features to build and train a model. However, users either store feature metadata in whichever format they wish, or in a way that is directly tied to their current ML workflow (tecton, 2022). A 5W1H+R data catalog can complement feature stores by allowing users to provide more comprehensive metadata about each feature. This would help users make a more holistic determination as to whether the feature should be included in their training data, and provide other users a rough understanding of the metadata provided for a feature.
Metadata Collection. Methods and standards for metadata collection include Montreal Data Licenses (Benjamin et al., 2019), Google Model Cards (Fang and Miao, 2020), Datasheets for Datasets (Gebru et al., 2018), CancerGrid (Davies et al., 2014), DLHub (Chard et al., 2018), and ISO/IEC 11179 Metadata Registry (Pon and Buttler, 2009).
A 5W1H+R data catalog complements these efforts. Metadata collected following those standards fits well into the 5W1H+R. For example, the Montreal Data License information could be stored in an asset’s Who-Profile and Why-profiles, as answers to who is allowed to access the data asset, and for what purposes. Datasheets (Gebru et al., 2018) and other metadata representation formats fit directly into the MM.
Metrics Layers. A metrics layer is a central repository for code to compute common metrics different users may need (i.e. KPIs)(Author, 2022). This concept is subsumed by the How-profile definition, but may be a useful category to include within the How-profile. In the How-profile, one would include not only metrics, such as KPIs, but also other types of usage, such as data preprocessing code. Making a separation between commonly computed metrics and other types of metadata about data usage may prove useful.
5.2. Related Work
Data Reuse Across Data Science Teams. Several studies concerning collaborations in data science have observed the need for data reuse across data science teams in an organization, but a lack of solutions that allow for its reuse (Kim et al., 2018; Passi and Jackson, 2018; Zhang et al., 2020; Muller et al., 2019; Hill et al., 2016). We partially tackle this larger problem by providing a mental model for metadata (information about data) which allows for information about data to be represented in a way that can be understood by a large and varied set of users. A comprehensive, comprehensible MM can help facilitate data reuse among data scientists by making it easier for them to develop a shared understanding about the metadata they have for a data asset.
Existing Metadata Definitions. Metadata definitions aim to clarify what metadata means. One approach to defining metadata is to differentiate ’business’ from ’technical’ metadata (George, 2020; Google, 2020). Ground proposes defining metadata as Application, Behavior, Context (Hellerstein et al., 2017). However, we do not regard many of these metadata definitions as MMs, because they are generally used to explain the features of a catalog rather than be implemented for metadata storage in a catalog. Although Ground (Hellerstein et al., 2017) implements its metadata definition for metadata storage, we do not consider it a MM because Ground’s ABC’s do not describe a method to partition the landscape of metadata that is useful for data management tasks. Instead, it focuses only on describing the functions of metadata in the data lifecycle.
Existing Metadata Models. Metadata models not only define metadata, but also implement that definition. While all models emphasize comprehensiveness, they each apply to different settings and solve various problems. HANDLE (Eichler et al., 2021) is a metadata model intended to be generic (similar to comprehensiveness) and respect data lake zones, which facilitate access control. MEDAL (Sawadogo et al., 2019) defines metadata with respect to several use cases including semantic enrichment, usage tracking, versioning, etc. M4DG (Spiekermann et al., 2018) defines metadata with respect to describing data goods in a marketplace.
While the 5W1H+R MM can be considered a metadata model, the 5W1H+R focuses on comprehensibility: providing a shared understanding of data among diverse sets of users. These works may implicitly assume comprehensibility, but do not formally define or evaluate it.
Cognitive Fit Theory. The theory of cognitive fit originates in information systems (IS) (Vessey, 1991), where it has been used to inform conceptual schemas (Khatri et al., 2006; Khatri et al., 2006), such as ER diagrams. To our knowledge the 5W1H+R MM is the first to use this theory to propose a MM for metadata management.
Metadata Extraction is complementary to storage. Landmark grammars have been used to more effectively solve web data extraction problems (Cetorelli et al., 2021). Glean is used to extract structured information from templatic documents (Tata et al., 2021). (Ciaccia et al., 2021) extracts metadata about taxonomical data to answer logic-based preference queries. Aurum ingests and processes structured data to discover relationships between similar datasets, which it models as an enterprise knowledge graph (Fernandez et al., 2018). Juneau (Zhang and Ives, 2020) discovers related tables using workflows provided by Jupyter notebooks. Pytheas (Christodoulakis et al., 2020) discovers tables from CSV files using a flexible rule set. Survey work (Abedjan et al., 2015) has explained some useful dataset profiles, which we call metadata.
Data Provenance Tuple provenance uses terminology similar to the 5W1H+R MM, why-, how-, and where-provenance, even though the meaning is different (Cheney et al., 2009). In the ontology space, the PROV-O ontology for data provenance (W3C, 2020) also uses similar terminology although for a different purpose. These concepts and applications are orthogonal to those discussed in this work.
Comparisons of Catalog Implementations. Reports compare existing data catalog implementations using metrics such as UIs and machine learning (i.e., how many tasks are automated) such as the Forrester Wave(Goetz, 2020) and the Gartner Magic Quadrant (Guido De Simoni and Dayley, 2020). We do not compare catalog implementations in this work.
Other High-Level Modeling Frameworks. Microsoft Repository(Bernstein et al., 1997) provides a model for storing data that is intended to reduce the number of new terms that the large and varied base of ActiveX users must learn to store data, while also being extensible, so users can define their own methods to store data in the way they think is best. We see parallels between these goals and the ones we propose in this paper: a comprehensive, comprehensible MM is a model that reduces the number of terms catalog users must learn to store metadata, while remaining ”extensible” in the sense that users can define metadata however they wish within its partitions.
Other 5W1H-based Frameworks. 5W1H-based frameworks have been proposed for describing various scientific and computational scenarios, such as describing user events that should trigger applications (Jang et al., 2005), providing a complete description of next-generation probiotics (Almeida et al., 2020), generating information threads and identifying temporal relationships (Narvala et al., 2023), and creating public service ontologies (Benaddi et al., 2022). However, these works are similar to the 5W1H+R MM proposed in this paper only at a high level. This work proposes the novel concept of using a 5W1H-based mental model for metadata that can be implemented in data catalogs to store metadata.
6. Conclusion
As data management percolates more organizations and reaches more people than ever, many human problems are surfacing. Metadata management is a critical task to effectively extract value from data. In this paper, we identified that data catalogs without a well-defined mental model do not generate agreement among data users, who must collaborate (in storing and retrieving metadata) to complete their tasks. We then proposed a new MM for metadata management, informed by an in-depth study of existing catalog technology. We justified the use of the MM based on the cognitive fit theory. We evaluated the new MM with a user study. All in all, we consider our work to help shed some light in the vast area of metadata management.
References
- (1)
- Abedjan et al. (2015) Ziawasch Abedjan, Lukasz Golab, and Felix Naumann. 2015. Profiling Relational Data: A Survey. The VLDB Journal 24, 4 (Aug. 2015), 557–581. https://doi.org/10.1007/s00778-015-0389-y
- Adair (1984) John G Adair. 1984. The Hawthorne effect: a reconsideration of the methodological artifact. Journal of applied psychology 69, 2 (1984), 334.
- Almeida et al. (2020) Diana Almeida, Daniela Machado, José Carlos Andrade, Sónia Mendo, Ana Maria Gomes, and Ana Cristina Freitas. 2020. Evolving trends in next-generation probiotics: a 5W1H perspective. Critical Reviews in Food Science and Nutrition 60, 11 (2020), 1783–1796. https://doi.org/10.1080/10408398.2019.1599812 arXiv:https://doi.org/10.1080/10408398.2019.1599812 PMID: 31062600.
- Amazon (2022) Amazon. 2022. Amazon SageMaker Feature Store: A fully managed service for machine learning features. https://aws.amazon.com/sagemaker/feature-store/?sagemaker-data-wrangler-whats-new.sort-by=item.additionalFields.postDateTime&sagemaker-data-wrangler-whats-new.sort-order=desc
- Araki and Lorica (2021) Assaf Araki and Ben Lorica. 2021. The Growing Importance of Metadata Management Systems. https://gradientflow.com/the-growing-importance-of-metadata-management-systems/?utm_campaign=DC_Thurs&utm_medium=email&_hsmi=111418530&_hsenc=p2ANqtz-9z0vq2HiKarPuqhQ2HZ47ftKjSkvTyQqBa4PhQUA3GGASaEIIlFbSQDCoV9wMsENFILo9g43LGlO2h_7OE7PWm_1sy1A&utm_content=111418602&utm_source=hs_email
- Ataccama (2022) Ataccama. 2022. The first fully automated Data Catalog. https://www.ataccama.com/platform/data-catalog
- atlan (2022) atlan. 2022. atlan: The new way for data-driven teams to discover, understand, trust, and collaborate on data assets. https://atlan.com/
- Atlas (2020) Apache Atlas. 2020. Apache Atlas: Overview. https://atlas.apache.org/#/
- Author (2022) Guest Author. 2022. The metric layer: Why you need it, examples, and how it fits into the modern data stack. https://blog.transform.co/data-talks/the-metric-layer-why-you-need-it-examples-and-how-it-fits-into-your-modern-data-stack/
- Bapat (2020) Shekhar Bapat. 2020. Discover, understand and manage your data with Data Catalog, now GA. https://cloud.google.com/blog/products/data-analytics/data-catalog-metadata-management-now-generally-available
- Becerra (2021) Xavier Becerra. 2021. California Consumer Privacy Act (CCPA). https://oag.ca.gov/privacy/ccpa
- Benaddi et al. (2022) Hanane Benaddi, Naziha Laaz, Elyoussfi El Kettani, and Yaâcoub Hannad. 2022. Ontology Model for Public Services in Morocco Based on 5W1H Approach: PSOM-eGovMa. Procedia Computer Science 198 (2022), 429–434. https://doi.org/10.1016/j.procs.2021.12.265 12th International Conference on Emerging Ubiquitous Systems and Pervasive Networks / 11th International Conference on Current and Future Trends of Information and Communication Technologies in Healthcare.
- Benjamin et al. (2019) Misha Benjamin, Paul Gagnon, Negar Rostamzadeh, Chris Pal, Yoshua Bengio, and Alex Shee. 2019. Towards Standardization of Data Licenses: The Montreal Data License. arXiv:1903.12262 [cs.CY]
- Bernstein et al. (1997) Phil Bernstein, Brian Harry, Paul Sanders, David Shutt, and Jason Zander. 1997. The Microsoft Repository. In VLDB 1997. Morgan Kaufmann Publishers. https://www.microsoft.com/en-us/research/publication/uploads-prod-1997-08-vldb97-pdf/
- boomi (2021) boomi. 2021. Data Catalog and Preparation. https://boomi.com/platform/data-catalog-and-preparation/#/706e6e/home
- Carter (2020) John Carter. 2020. Data Vault Automation with erwin and Snowflake: Building and Automating a Scalable Data Warehouse Based on Data Vault 2.0. https://www.snowflake.com/blog/data-vault-automation-with-erwin-and-snowflake-building-and-automating-a-scalable-data-warehouse-based-on-data-vault-2-0/
- Castro Fernandez et al. (2018) R. Castro Fernandez, Z. Abedjan, F. Koko, G. Yuan, S. Madden, and M. Stonebraker. 2018. Aurum: A Data Discovery System. In 2018 IEEE 34th International Conference on Data Engineering (ICDE). 1001–1012. https://doi.org/10.1109/ICDE.2018.00094
- Cetorelli et al. (2021) Valerio Cetorelli, Paolo Atzeni, Valter Crescenzi, and Franco Milicchio. 2021. The Smallest Extraction Problem. Proc. VLDB Endow. 14, 11 (jul 2021), 2445–2458. https://doi.org/10.14778/3476249.3476293
- Chard et al. (2018) Ryan Chard, Zhuozhao Li, Kyle Chard, Logan T. Ward, Yadu N. Babuji, Anna Woodard, Steven Tuecke, Ben Blaiszik, Michael J. Franklin, and Ian T. Foster. 2018. DLHub: Model and Data Serving for Science. CoRR abs/1811.11213 (2018). arXiv:1811.11213 http://arxiv.org/abs/1811.11213
- Chen et al. (2018) Chen Chen, Behzad Golshan, Alon Y. Halevy, Wang Chiew Tan, and AnHai Doan. 2018. BigGorilla: An Open-Source Ecosystem for Data Preparation and Integration. IEEE Data Eng. Bull. 41 (2018), 10–22.
- Cheney et al. (2009) James Cheney, Laura Chiticariu, and Wang-Chiew Tan. 2009. Provenance in Databases: Why, How, and Where. Found. Trends Databases 1, 4 (April 2009), 379–474. https://doi.org/10.1561/1900000006
- Christodoulakis et al. (2020) Christina Christodoulakis, Eric B. Munson, Moshe Gabel, Angela Demke Brown, and Renée J. Miller. 2020. ¡i¿Pytheas¡/i¿: Pattern-Based Table Discovery in CSV Files. Proc. VLDB Endow. 13, 12 (July 2020), 2075–2089. https://doi.org/10.14778/3407790.3407810
- Ciaccia et al. (2021) Paolo Ciaccia, Davide Martinenghi, and Riccardo Torlone. 2021. Preference Queries over Taxonomic Domains. Proc. VLDB Endow. 14, 10 (jun 2021), 1859–1871. https://doi.org/10.14778/3467861.3467874
- Collibra (2020) Collibra. 2020. What is a data catalog? https://www.collibra.com/data-catalog
- Crosas (2011) Mercé Crosas. 2011. The Dataverse Network®: An Open-Source Application for Sharing, Discovering and Preserving Data. 17, 1 (2011). https://doi.org/10.1045/january2011-crosas
- Davies et al. (2014) Jim Davies, Jeremy Gibbons, Steve Harris, and Charles Crichton. 2014. The CancerGrid Experience: Metadata-Based Model-Driven Engineering for Clinical Trials. Science of Computer Programming 89B (September 2014), 126–143. https://doi.org/10.1016/j.scico.2013.02.010
- Deng et al. (2017) Dong Deng, Raul Castro Fernandez, Ziawasch Abedjan, Sibo Wang, Michael Stonebraker, Ahmed K Elmagarmid, Ihab F Ilyas, Samuel Madden, Mourad Ouzzani, and Nan Tang. 2017. The Data Civilizer System.. In CIDR.
- denodo (2021) denodo. 2021. Denodo Platform Overview: Denodo Platform goes beyond every other data virtualization solution. https://www.denodo.com/en/denodo-platform/overview
- Eichler et al. (2021) Rebecca Eichler, Corinna Giebler, Christoph Gröger, Holger Schwarz, and Bernhard Mitschang. 2021. Modeling metadata in data lakes—A generic model. Data & Knowledge Engineering 136 (2021), 101931. https://doi.org/10.1016/j.datak.2021.101931
- Fang and Miao (2020) Huanming Fang and Hui Miao. 2020. Introducing the Model Card Toolkit for Easier Model Transparency Reporting. https://ai.googleblog.com/2020/07/introducing-model-card-toolkit-for.html
- Feast (2022) Feast. 2022. Feast: Serve Your Machine Learning Features in Production. https://feast.dev/
- Fernandez et al. (2018) Raul Castro Fernandez, Ziawasch Abedjan, Famien Koko, Gina Yuan, Samuel Madden, and Michael Stonebraker. 2018. Aurum: A data discovery system. In 2018 IEEE 34th International Conference on Data Engineering (ICDE). IEEE, 1001–1012.
- Flint (1917) Leon Nelson Flint. 1917. Newspaper writing in high schools, containing an outline for the use of teachers. University of Kansas.
- Foundation (2017) Apache Software Foundation. 2017. Apache Kafka. https://kafka.apache.org/
- Gebru et al. (2018) Timnit Gebru, Jamie Morgenstern, Briana Vecchione, Jennifer Wortman Vaughan, Hanna Wallach, Hal Daumeé III, and Kate Crawford. 2018. Datasheets for datasets. arXiv preprint arXiv:1803.09010 (2018).
- George (2020) Lars George. 2020. Technical vs. Business Metadata Management. https://www.okera.com/blogs/technical-vs-business-metadata-management/
- Goetz (2020) Michele Goetz. 2020. The Forrester Wave™: Machine Learning Data Catalogs, Q4 2020- Tools And Technology: The Data Management Playbook. https://www.forrester.com/report/The+Forrester+Wave+Machine+Learning+Data+Catalogs+Q4+2020/-/E-RES157467
- Google (2020) Google. 2020. Data Catalog. https://cloud.google.com/data-catalog#all-features
- Gregory et al. (2019) Kathleen Gregory, Paul Groth, Andrea Scharnhorst, and Sally Wyatt. 2019. Lost or found? Discovering data needed for research. arXiv preprint arXiv:1909.00464 (2019).
- Guido De Simoni and Dayley (2020) Ankush Jain Guido De Simoni, Mark Beyer and Alan Dayley. 2020. Gartner Magic Quadrant for Metadata Management Solutions. https://www.gartner.com/en/documents/3993025
- Halevy et al. (2016a) Alon Halevy et al. 2016a. Goods: Organizing Google’s Datasets. In SIGMOD.
- Halevy et al. (2016b) Alon Halevy, Flip Korn, Natalya F Noy, Christopher Olston, Neoklis Polyzotis, Sudip Roy, and Steven Euijong Whang. 2016b. Goods: Organizing google’s datasets. In Proceedings of the 2016 International Conference on Management of Data. 795–806.
- Hellerstein et al. (2017) Joseph M Hellerstein, Vikram Sreekanti, Joseph E Gonzalez, James Dalton, Akon Dey, Sreyashi Nag, Krishna Ramachandran, Sudhanshu Arora, Arka Bhattacharyya, Shirshanka Das, et al. 2017. Ground: A Data Context Service.. In CIDR.
- Hill et al. (2016) Charles Hill, Rachel Bellamy, Thomas Erickson, and Margaret Burnett. 2016. Trials and tribulations of developers of intelligent systems: A field study. In 2016 IEEE Symposium on Visual Languages and Human-Centric Computing (VL/HCC). 162–170. https://doi.org/10.1109/VLHCC.2016.7739680
- Hines et al. (2004) Michael L. Hines, Thomas Morse, Michele Migliore, Nicholas T. Carnevale, and Gordon M. Shepherd. 2004. ModelDB: A Database to Support Computational Neuroscience. Journal of computational neuroscience 17, 1 (2004), 7–11. https://doi.org/10.1023/B:JCNS.0000023869.22017.2e 15218350[pmid].
- Holland et al. (2018) Sarah Holland, Ahmed Hosny, Sarah Newman, Joshua Joseph, and Kasia Chmielinski. 2018. The dataset nutrition label: A framework to drive higher data quality standards. arXiv preprint arXiv:1805.03677 (2018).
- Hopsworks (2022) Hopsworks. 2022. Hopsworks: Feature Store Goes Serverless. https://www.hopsworks.ai/
- Howell (2019) Jason Howell. 2019. Azure Data Catalog common scenarios. https://docs.microsoft.com/en-us/azure/data-catalog/data-catalog-common-scenarios
- Informatica (2022) Informatica. 2022. Informatica: Cloud Data Governance and Catalog. https://www.informatica.com/products/data-governance/cloud-data-governance-and-catalog.html
- Jang et al. (2005) Seiie Jang, Woontack Woo, et al. 2005. 5W1H: Unified user-centric context. In The 7th International Conference on Ubiquitous Computing.
- Khatri et al. (2006) V. Khatri, I. Vessey, S. Ram, and V. Ramesh. 2006. Cognitive fit between conceptual schemas and internal problem representations: the case of geospatio-temporal conceptual schema comprehension. IEEE Transactions on Professional Communication 49, 2 (2006), 109–127. https://doi.org/10.1109/TPC.2006.875091
- Khatri et al. (2006) Vijay Khatri, Iris Vessey, V. Ramesh, Paul Clay, and Sung-Jin Park. 2006. Understanding Conceptual Schemas: Exploring the Role of Application and IS Domain Knowledge. Information Systems Research 17, 1 (2006), 81–99. http://www.jstor.org/stable/23015782
- Kim et al. (2018) Miryung Kim, Thomas Zimmermann, Robert DeLine, and Andrew Begel. 2018. Data Scientists in Software Teams: State of the Art and Challenges. IEEE Transactions on Software Engineering 44, 11 (2018), 1024–1038. https://doi.org/10.1109/TSE.2017.2754374
- Knight (2017) Michelle Knight. 2017. What is Data Governance? https://www.dataversity.net/what-is-data-governance
- Koch (2020) Richie Koch. 2020. Everything you need to know about GDPR compliance. https://gdpr.eu/compliance/
- Koesten et al. (2019) Laura Koesten, Emilia Kacprzak, Jeni Tennison, and Elena Simperl. 2019. Collaborative Practices with Structured Data: Do Tools Support What Users Need? Association for Computing Machinery, New York, NY, USA, 1–14. https://doi.org/10.1145/3290605.3300330
- Lan (2019) Mars Lan. 2019. DataHub: A generalized metadata search and discovery tool. https://engineering.linkedin.com/blog/2019/data-hub
- Lawrence (2017) Neil D. Lawrence. 2017. Data Readiness Levels. arXiv:1705.02245 [cs.DB]
- Lawrenz et al. (2020) Sebastian Lawrenz, Priyanka Sharma, and Andreas Rausch. 2020. The significant role of metadata for data marketplaces. In International Conference on Dublin Core and Metadata Applications. 95–101.
- Linstedt (2015) Dan Linstedt. 2015. Data Vault Basics. http://danlinstedt.com/solutions-2/data-vault-basics/
- Lyft (2022) Lyft. 2022. Open source data discovery and metadata engine. https://www.amundsen.io/
- Mao et al. (2019) Yaoli Mao, Dakuo Wang, Michael Muller, Kush R. Varshney, Ioana Baldini, Casey Dugan, and Aleksandra Mojsilović. 2019. How Data ScientistsWork Together With Domain Experts in Scientific Collaborations: To Find The Right Answer Or To Ask The Right Question? Proc. ACM Hum.-Comput. Interact. 3, GROUP, Article 237 (Dec. 2019), 23 pages. https://doi.org/10.1145/3361118
- Muller et al. (2019) Michael Muller, Ingrid Lange, Dakuo Wang, David Piorkowski, Jason Tsay, Q. Vera Liao, Casey Dugan, and Thomas Erickson. 2019. How Data Science Workers Work with Data: Discovery, Capture, Curation, Design, Creation. Association for Computing Machinery, New York, NY, USA, 1–15. https://doi.org/10.1145/3290605.3300356
- Narvala et al. (2023) Hitarth Narvala, Graham McDonald, and Iadh Ounis. 2023. Identifying chronological and coherent information threads using 5W1H questions and temporal relationships. Information Processing & Management 60, 3 (2023), 103274. https://doi.org/10.1016/j.ipm.2023.103274
- Neang et al. (2021) Andrew B. Neang, Will Sutherland, Michael W. Beach, and Charlotte P. Lee. 2021. Data Integration as Coordination: The Articulation of Data Work in an Ocean Science Collaboration. Proc. ACM Hum.-Comput. Interact. 4, CSCW3, Article 256 (Jan. 2021), 25 pages. https://doi.org/10.1145/3432955
- of Michigan (2021) University of Michigan. 2021. ICPSR: Sharing data to advance science. https://www.icpsr.umich.edu/web/pages/
- Passi and Jackson (2018) Samir Passi and Steven J. Jackson. 2018. Trust in Data Science: Collaboration, Translation, and Accountability in Corporate Data Science Projects. Proc. ACM Hum.-Comput. Interact. 2, CSCW, Article 136 (Nov. 2018), 28 pages. https://doi.org/10.1145/3274405
- Pon and Buttler (2009) Raymond K. Pon and David J. Buttler. 2009. Metadata Registry, ISO/IEC 11179. Springer US, Boston, MA, 1724–1727. https://doi.org/10.1007/978-0-387-39940-9_907
- Prolific (2021) Prolific. 2021. Prolific: Quickly find research participants you can trust. https://www.prolific.co
- SAP (2021) SAP. 2021. SAP Business Technology Platform: Turn data chaos into data value with data intelligence. https://www.sap.com/products/data-intelligence.html
- Sawadogo et al. (2019) Pegdwendé N. Sawadogo, Étienne Scholly, Cécile Favre, Éric Ferey, Sabine Loudcher, and Jérôme Darmont. 2019. Metadata Systems for Data Lakes: Models and Features. In ADBIS.
- Singh (2020) Vijay Singh. 2020. Star Schema in Data Warehouse. https://hackr.io/blog/star-schema-in-data-warehouse
- Spiekermann et al. (2018) Markus Spiekermann, Daniel Tebernum, Sven Wenzel, and Boris Otto. 2018. A Metadata Model for Data Goods.
- Tata et al. (2021) Sandeep Tata, Navneet Potti, James B. Wendt, Lauro Beltrao Costa, Marc Najork, and Beliz Gunel. 2021. Glean: Structured Extractions from Templatic Documents. In Proceedings of the VLDB Endowment. 997–1005.
- tecton (2022) tecton. 2022. tecton: Feature Platform for Real-Time Machine Learning. https://www.tecton.ai/
- Vessey (1991) Iris Vessey. 1991. Cognitive Fit: A Theory-Based Analysis of the Graphs Versus Tables Literature*. Decision Sciences 22, 2 (1991), 219–240. https://doi.org/10.1111/j.1540-5915.1991.tb00344.x arXiv:https://onlinelibrary.wiley.com/doi/pdf/10.1111/j.1540-5915.1991.tb00344.x
- W3C (2020) W3C. 2020. Data Catalog Vocabulary (DCAT) - Version 3. https://www.w3.org/TR/vocab-dcat-3/
- Wells (2020) Dave Wells. 2020. A Data Architect’s Guide to the Data Catalog. https://www.alation.com/blog/a-data-architects-guide-to-the-data-catalog/
- WeWork (2021) WeWork. 2021. Marquez: Collect, aggregate, and visualize a data ecosystem’s metadata. https://marquezproject.github.io/marquez/
- Wilkinson et al. (2016) Mark D. Wilkinson, Michel Dumontier, IJsbrand Jan Aalbersberg, Gabrielle Appleton, Myles Axton, Arie Baak, Niklas Blomberg, Jan-Willem Boiten, Luiz Bonino da Silva Santos, Philip E. Bourne, Jildau Bouwman, Anthony J. Brookes, Tim Clark, Mercè Crosas, Ingrid Dillo, Olivier Dumon, Scott Edmunds, Chris T. Evelo, Richard Finkers, Alejandra Gonzalez-Beltran, Alasdair J.G. Gray, Paul Groth, Carole Goble, Jeffrey S. Grethe, Jaap Heringa, Peter A.C ’t Hoen, Rob Hooft, Tobias Kuhn, Ruben Kok, Joost Kok, Scott J. Lusher, Maryann E. Martone, Albert Mons, Abel L. Packer, Bengt Persson, Philippe Rocca-Serra, Marco Roos, Rene van Schaik, Susanna-Assunta Sansone, Erik Schultes, Thierry Sengstag, Ted Slater, George Strawn, Morris A. Swertz, Mark Thompson, Johan van der Lei, Erik van Mulligen, Jan Velterop, Andra Waagmeester, Peter Wittenburg, Katherine Wolstencroft, Jun Zhao, and Barend Mons. 2016. The FAIR Guiding Principles for scientific data management and stewardship. Scientific Data 3, 1 (15 Mar 2016), 160018. https://doi.org/10.1038/sdata.2016.18
- Yakout et al. (2012) Mohamed Yakout, Kris Ganjam, Kaushik Chakrabarti, and Surajit Chaudhuri. 2012. Infogather: entity augmentation and attribute discovery by holistic matching with web tables. In Proceedings of the 2012 ACM SIGMOD International Conference on Management of Data. 97–108.
- Zaharia et al. (2020) Matei Zaharia, Andrew Chen, Aaron Davidson, Ali Ghodsi, Sue Ann Hong, Andy Konwinski, Siddharth Murching, Tomas Nykodym, Paul Ogilvie, Mani Parkhe, Fen Xie, and Corey Zumar. 2020. Accelerating the Machine Learning Lifecycle with MLflow. https://databricks.com/research/accelerating-the-machine-learning-lifecycle-with-mlflow
- Zhang et al. (2020) Amy X. Zhang, Michael Muller, and Dakuo Wang. 2020. How Do Data Science Workers Collaborate? Roles, Workflows, and Tools. Proc. ACM Hum.-Comput. Interact. 4, CSCW1, Article 022 (May 2020), 23 pages. https://doi.org/10.1145/3392826
- Zhang and Ives (2020) Yi Zhang and Zachary G Ives. 2020. Finding Related Tables in Data Lakes for Interactive Data Science. In Proceedings of the 2020 ACM SIGMOD International Conference on Management of Data. 1951–1966.