Using Relative Lines of Code to Guide Automated Test Generation for Python
Abstract.
Raw lines of code (LOC) is a metric that does not, at first glance, seem extremely useful for automated test generation. It is both highly language-dependent and not extremely meaningful, semantically, within a language: one coder can produce the same effect with many fewer lines than another. However, relative LOC, between components of the same project, turns out to be a highly useful metric for automated testing. In this paper, we make use of a heuristic based on LOC counts for tested functions to dramatically improve the effectiveness of automated test generation. This approach is particularly valuable in languages where collecting code coverage data to guide testing has a very high overhead. We apply the heuristic to property-based Python testing using the TSTL (Template Scripting Testing Language) tool. In our experiments, the simple LOC heuristic can improve branch and statement coverage by large margins (often more than 20%, up to 40% or more), and improve fault detection by an even larger margin (usually more than 75%, and up to 400% or more). The LOC heuristic is also easy to combine with other approaches, and is comparable to, and possibly more effective than, two well-established approaches for guiding random testing.
1. Introduction
Lines of code (LOC) is an extremely simple way to measure the size or complexity of a software system or component. It has clear disadvantages. First, unless care is taken, the measure itself is ambiguous, in that “lines of code” may mean number of carriage returns or number of statements, may include comments, and so forth. Second, lines of code are not comparable across languages: 10 lines of C and 10 lines of Haskell are not the same, which is evident even in the size of faults in these languages (Gopinath et al., 2014b). Finally, even within the same language, two different programmers may express the same functionality using different amounts of code. E.g., in a language like Python, the same list may be constructed using a five LOC loop or a single LOC list comprehension. In some cases, such differences in LOC for the same functionality will signify a difference in complexity, but in other cases the conceptual and computational complexity will be identical, despite LOC differences (e.g., chaining vs. sequential styles in DSLs, as discussed by Fowler (Fowler, 2010)).
Is measuring lines of code, then, pointless, except for very coarse purposes such as establishing the approximate size of software systems: e.g., Mac OS X at 50 million LOC is much larger than Google Chrome at 5 million LOC, which is much larger than an AVL tree implementation at 300 LOC? We argue that, to the contrary, counting LOC is the basis for a powerful heuristic for improving automated test generation methods based on random testing. In particular, we show that measuring relative LOC between components of a software system does provide useful information for test generation. By relative LOC we mean that we are not so much concerned with the absolute LOC size of a program element, but with whether one program element is larger or smaller than another, and by how much. Our claim is that, while LOC is certainly imprecise as a measure of code complexity or importance, the assumption that relatively larger functions are usually more complex, more error-prone, and more critical for exploring system state is actionable: we show that using LOC to bias random testing is an effective heuristic approach for generating tests for Python APIs.
1.1. Small-Budget Automated Test Generation
QuickCheck (Claessen and Hughes, 2000) and other increasingly popular property-based testing tools (Papadakis and Sagonas, 2011; MacIver, 2013) offer very rapid automatic testing of software, on the fly, based on random testing (Hamlet, 1994; Arcuri et al., 2010). For the Software Under Test (SUT), a property-based testing tool allows a user to specify some correctness properties (and usually includes some default properties, such as that executions do not throw uncaught exceptions), and generates random input values for which the properties are checked. Developers seem to expect such tools to conduct their testing within at most a minute, in order to provide rapid feedback on newly introduced faults during development, when the fault is easiest to identify and fix. The claim that a minute is a typical expectation derives the default one minute timeout for the very widely adopted Python Hypothesis (MacIver, 2013) testing tool (one of the most sophisticated QuickCheck variants, used in more than 500 open source projects (MacIver and PyPI, [n.d.])), and the fact that the original QuickCheck and many imitators such as ScalaCheck (Nilsson et al., 2016), PropEr (Papadakis and Sagonas, 2011), and the Racket version of QuickCheck use a default of only 100 random tests, which will typically require far less than a minute to perform. Tools for generating Java unit tests, such as EvoSuite (Fraser and Arcuri, 2011) and Randoop (Pacheco et al., 2007) also have default timeouts of one minute and 100 seconds per class to be tested, respectively. In fact, to our knowledge, all automated testing tools in wide adoption use a default budget close to 60 seconds or 100 tests, with the exception of fuzzers like afl-fuzz (Zalewski, 2014) intended to detect subtle security vulnerabilities. Testing with a limited budget is critical for using property-based testing in a continuous integration setting, where testing time per-task on a large project is limited (CI, [n.d.]) to ensure rapid feedback (Harman and O’Hearn, 2018).
Unfortunately, one minute is often not enough time to effectively generate tests for an SUT using pure random testing. It is unlikely that low-probability faults will be exposed. Moreover, for techniques relying on genetic algorithms (McMinn, 2004) or other machine-learning techniques (Groce et al., 2012b, a), the overhead of learning, or lack of sufficient training data, may still result in poor coverage or fault detection in a short testing run. Even if developers sometimes perform hour-long or overnight automated testing runs, it is still desirable to find faults or cover code as quickly as possible; poor 60 second performance is in a sense equivalent in property-based testing to having a very slow compiler in code development.
1.2. The High Cost of Code Coverage
A further key issue in lightweight automated test generation (Groce et al., 2012b), is that many programmers use languages that lack sophisticated or efficient coverage instrumentation (Yang et al., 2007; Chilakamarri and Elbaum, 2004). In Python, computing coverage using the coverage.py (Batchelder, 2015) library (the only mature coverage tool for the language) to guide testing often adds a large overhead, despite its use of a low-level C tracing implementation. Collecting coverage in Python often results in performing far less testing for the same computational budget; in Section 3.5 we show that turning off code coverage often results in performing at least 10% more, and up to 50 times as many test actions (e.g. method calls) in practice, with median improvement in SUTs we studied of 2.03x (and mean improvement of 6.12x). Is the advantage of coverage-directed testing sufficient to overcome this cost? Even if the answer is affirmative for C or Java, with fast coverage tools, the answer may often be “no” for languages with higher overheads. Python is not even the worst case: a newly popular language may lack any effective coverage tool at all; for a long time Rust lacked any convenient way to measure coverage (Seonghoon, 2015). Even “good” coverage tools may not have a low enough overhead (Ohmann et al., 2016; Tikir and Hollingsworth, 2002; Agrawal, 1994) or conveniently provide fast enough access to on-the-fly coverage for efficient testing.
Moreover, testing methods that use coverage information, or even more expensive (and powerful) tools such as symbolic execution (Godefroid et al., 2005; Cadar et al., 2008) face an inherent limitation. As Böhme and Soumya (Böhme and Paul, 2014) argue, given even a perfect method for partitioning system behavior by faults, if the method has a cost (over that of random testing), it will be less effective than random testing, for some test budgets. Real-world techniques are not perfect in their defect targeting, and often impose considerable costs—this is why performing symbolic execution only on seed tests, generated by some other method, is now a popular approach in both standard automated test generation and security-based fuzzing (Zhang et al., 2014; Marinescu and Cadar, 2012; Person et al., 2011; Goodman, 2016). Small-budget automated test generation, therefore, stands in need of more methods that improve on pure random testing but require no additional computational effort. Ideally, such methods should be able, like random testing, to work even without code coverage support. How can we discover such methods? In a sense, we are searching for the testing equivalent of a “credit score”—while less accurate than simply making a loan (that is, running a test) to see how well it performs, it is also much less costly. The bound on the cost of computing a credit score, or measuring LOC, is constant and proportionally much smaller than the cost of making a (large) loan or performing extensive testing. A credit score or rough LOC count is also likely more stable over time than the details of each proposed loan or set of test executions. In essence, we want to equate examining program source code in simply ways with performing a (fast, approximate) credit check.
The problem is most easily understood when simplified to its essence. Imagine that you have two functions, f and g. Furthermore, imagine that you can only test one of these functions, once. Which do you test? Knowing nothing further, you have no way to rationally choose. What might you know about f and g that would allow you, in the sense of expected-value, to make a more intelligent decision? You might, of course, wish to know things such as how calling f and g would typically contribute to improving code coverage for the SUT, or which is more closely related to critical aspects of the specification, or (most ideally) which one contains a bug. These are usually, unfortunately, very expensive things to discover, and we have already stipulated that you have very little time—only time to run one test of either f or g. If we can propose a very inexpensive-to-compute heuristic for the “f or g?” question, we have a plausible way to bias small-budget automated test generation. Of course, we will seldom be faced with testing only f or g, but we will always face the question of which functions to test more often, in such a setting, and we will always have to choose some final function to test when our testing budget is about to run out. Even techniques that are more complex than pure random testing, such as those used in EvoSuite and Randoop, rely on the basic building block of choosing an arbitrary method to call.
1.3. Solution: Count Relative Lines of Code
The central proposal of this paper is that, if you know only that f has more LOC than g, you should prefer testing f to testing g. LOC allows you to approximate some kind of expectation (though not a lower bound–it might be easy to cover most of g’s code, and hard to cover more than a line or two of f) of gain in code coverage, of course, but it should, more importantly, approximate complexity and influence on program state. Not being a lower bound is useful here: we do not want to bias against functions that have hard-to-cover code; they are precisely the functions we may we need to test most.
Longer functions are generally more complex, and presumably have more room for programmers to make mistakes. This is assumed in, for example, mutation testing (Andrews et al., 2005; Offutt and Abdurazik, 2000), where the LOC size of a function is strongly correlated with the number of mutants generated for that function. However, even when a longer function does not have any faults, it is still, we claim, usually more important to test. Longer functions, we expect, perform more computation. In stateful systems, longer functions tend to modify system state more than shorter ones. Even if a modification is correct, it may cause other, incorrect, functions to fail. Even for functions with no side effects, we hypothesize that longer pure functions, on average, either take more complex data types as arguments, or return more complex data types as results than shorter ones. In fact, very short functions in many cases are getters and setters. These need to be tested, and sometimes need to be called to detect faults in more complex code, but are seldom, we suspect, themselves faulty.
Of course, other than the general correlation detected in various studies between defects and LOC at the function, module, or file level (Zhang, 2009; Ostrand et al., 2005; Fenton and Ohlsson, 2000; Olague et al., 2007; Andersson and Runeson, 2007), it is difficult to know to what precise extent length matters. However, if our f/g answer is reasonable, it follows that biasing the probabilities for calling functions/methods in random testing based on the relative LOC in those functions/methods should improve the effectiveness of random testing, for most SUTs. Some caution is required: if a function f is itself short, but always or almost always calls h, which is long and complex, then in practice perhaps f is a “long” function. Or, one may argue that since f is longer, it also likely takes more time to run than g, making it “correct” to choose f, but a different problem than selecting a next action in random testing. The alternative to f may not be testing g, but perhaps testing g three times, or testing g, h, and i, all of which are much shorter than f. Whether our proposed bias is actually useful in practice is an empirical question, despite having a sound analytical basis, thanks to these confounding factors, and can be resolved only by experimentation.
The experiments in this paper, based on a simple linear bias in favor of test actions with relatively more LOC, demonstrate that our proposed solution to the “f or g?” question is a useful one in that it often improves both coverage and fault detection. We also thus demonstrate the general method of moving from a plausible answer to the “f or g?” question to improving the effectiveness of automated test generation.
In fact, we show that for many Python SUTs we examined, the LOC heuristic, despite not using expensive coverage information, is better than a coverage-based approach, and has better mean coverage over all SUTs, even though we impose the (unnecessary) cost of collecting coverage on LOC-guided testing; further, incorporating the LOC heuristic into the coverage-based approach improves results over using coverage alone, for a large majority of SUTs. The basic technique is very simple: we first run (pure, unguided) random testing on the SUT once, for a short period (two minutes, in our experiments) and, for each function or set of function calls that constitute a single testing action, compute the mean total LOC in all SUT functions and methods executed while taking that type of test action. Note that this is not the same as measuring coverage: we measure (only counting each function once) how large each function executed is, in total LOC, even if the majority of the code is not executed. The “sizes” in LOC are then used to bias probabilities for selecting test actions so that actions with higher LOC counts are chosen more often in all future testing. Unlike dynamic code coverage-based methods, these sizes do not need to be recomputed for each test run; we show that the technique is robust to even very outdated LOC estimates.
1.4. Contributions
We propose a novel and powerful heuristic for use in (small-budget) automated generation of property-based Python unit tests, based on counting lines of code in functions under test. We evaluate the heuristic (and its combination with other testing methods) across a set of 14 Python libraries, including widely-used real-world systems. Overall, the LOC heuristic improves testing effectiveness for most subjects. The LOC heuristic also combines well with other test generation heuristics to increase their effectiveness. It is often more effective than unbiased random testing by a large margin (20%-40% or more improvement in branch/statement coverage, 30%-400% or more gain in fault detection rates). The LOC heuristic, or a combination of the LOC heuristic and another approach, is the best method for testing more SUTs than any non-LOC approaches, and is worse than random testing for fewer SUTs than the other two (established and widely used) test generation methods we tried. Even if the overhead for coverage were negligible, a user would be best off using the LOC heuristic or the LOC heuristic plus a coverage-guided genetic algorithm, for most SUTs. Our results also present a strong argument for exploring the use of simple, almost static (thus available without learning cost at testing time) metrics of source code to guide small-budget automated test generation, especially in languages such as Python, where coverage instrumentation is either very costly or unavailable.
2. LOC-Based Heuristics
We present our basic approach in the context of the TSTL (Holmes et al., 2017; Groce and Pinto, 2015) tool for property-based unit testing of Python programs for several reasons. First, Python is a language with expensive (and coarse-grained: there is no support for path coverage or coverage counts) code coverage tools. Second, TSTL is the only tool, to our knowledge, that is focused on generating unit tests (sequences of value choices, method/function calls, and assertions) yet is essentially a property-based testing tool (Claessen and Hughes, 2000), where users are expected to provide guidance as to what aspects of an interface are to be tested and frequently define custom generators or implement complex properties, in exchange for fast random testing to quickly detect semantic faults in code. A property-based testing tool is seldom seen as a test suite generator (unlike Randoop or EvoSuite), even though most property-based tools can also be used to produce test suites. QuickCheck, Hypothesis, PROPER, or TSTL is usually executed to generate new tests after every code change. It is in this setting, where generating new, effective tests within a small test budget is a frequently performed task, that the need for better heuristics is largest.
Before proceeding to the detailed Python implementation, we define the general class of LOC-based heuristics: a LOC based heuristic biases the probability of method or function call choices in random testing proportionally to the measured lines of code in the method(s) or function(s) called. In this paper, we present one instantiation of this general idea, tuned to Python test generation.
2.1. General LOC Heuristic Definition
The general algorithm for LOC heuristics is most easily described by understanding how it changes the selection of a test action. Assume that test actions are normally chosen with uniform probability, i.e., . Using LOC, instead, the probabilities are determined based on both an action set and a LOC-mapping, , where is a measure (possibly approximate) of the lines of code potentially (rather than actually) covered by executing . If is a simple function that calls no other functions, then should be the number of lines in the implementation of the function . Given , when using LOC, where should be a monotonically increasing function, except in the special case that , as discussed below. It is the monotonically increasing nature of that produces the desired bias. In this paper, we consider only the case where is a simple linear mapping.
2.2. Python Implementation
-
@import avl
pool: <int> 4
pool: <avl> 3
property: <avl>.check_balanced()
<int> := <[1..20]>
<avl> := avl.AVLTree()
<avl>.insert(<int>)
<avl>.delete(<int>)
In TSTL, tests are composed of a series of actions. An action is a fragment of Python code, usually either an assignment to a pool value (Andrews et al., 2010) (variables assigned during the test to store either input values for testing or objects under test), or a function or method call, or an assertion. Actions basically correspond to what one might expect to see in a single line of a unit test. Constructing a test in TSTL is essentially a matter of choosing the lines that will appear in a constructed unit test. Actions are grouped into action classes, defined in one line of a TSTL test harness (Groce and Erwig, 2012) file. Figure 1 shows part of a simple TSTL harness, for testing an AVL tree (with no properties beyond that the tree is balanced and does not throw any exceptions). The line of TSTL code <int> := <[1..20]> defines an action class that includes many actions: int0 = 2, int1 = 3, and int3 = 10, and so forth. The AVL harness defines 4 action classes (one for each line after the property). Of these, the first calls no SUT code (hence would be 0), while the other three call the AVLTree constructor or an AVLTree object method, and would be based on the code in those methods. The same (top-level) method is called for each action in an action class, in most, but not all cases; we examined our SUTs for cases where this was not the case, and found that the top-level method called could vary in about 20% of all actions. Our heuristic is simple, and operates in two phases: first, a measure of LOC for each action class (a construction of ) is needed, and then the LOC measures must be transformed into probabilities for action classes, to bias random testing in favor of actions with higher LOC values (a function is defined).
2.2.1. Estimating LOC in Test Actions
-
def traceLOC(frame, event, arg):
# inputs are provided by the Python runtime
# - frame is the current stack frame
# - event is one of ’call’, ’line’, ’return’, or ’exception’
# - arg is specific to the event type
# We care only about function ’call’s; on a call, iff the function was not
# previously seen, we 1) mark it as seen in this action and 2) add the
# LOC count for the function to the global thisLOCs count, which is
# reset before each action in the TSTL testing. Otherwise, we just return.
# In any case, we return this function, since Python’s tracing requires
# the tracer to return the tracer to use in the future.
global thisLOCs, seenCode
if event != "call": return traceLOC
co = frame.f_code
fn = co.co_filename
if (co.co_name, co.co_filename) in seenCode:
return traceLOC
if fn == sut.__file__.replace(".pyc",".py"):
return traceLOC
seenCode[(co.co_name, fn)] = True
thisLOCs += len(inspect.getsourcelines(co)[0])
return traceLOC
To bias probabilities by LOC, we need to collect a mapping from action classes to the LOC in SUT code called by the actions in the class. In theory, this could be based on static analysis of the call graph; however, in Python determining an accurate call graph can be very difficult, due to the extremely dynamic nature of the language. Moreover, we are generally interested only in functions that have a non-negligible chance of being called during short-budget testing; calling some functions may not even be possible given the test harness and input ranges used. Our efforts to collect reliable information statically, based on matching the textual names in actions to a static list of function sizes generated using Python’s inspection tools, produced a large improvement in testing for one SUT, but it was generally not very helpful, and sometimes greatly reduced the effectiveness of testing compared to pure random testing; we report on this in more detail below. The primary cause was simple inaccuracy, e.g., if an action class varies which method or function it calls depending on the type of an object in a pool (a fairly common pattern in TSTL), the tool simply counted LOC for the wrong code. The dynamic nature of Python, which is exploited heavily in TSTL harnesses, simply defeats a purely-static approach.
Inspecting the incorrect results also helped us see that simply counting LOC in a top-level function is inappropriate for TSTL/Python. TSTL harnesses seldom include all methods of a class; instead the testing is focused on the high-level APIs actually used by users, not other functions, and these are often very small wrappers that dispatch to a more complex method. In TSTL, most coverage can only be obtained indirectly (Gay, 2018).
We therefore used Python’s system tracing and introspection modules to collect a one-time estimate111In Section 3.8 we show that the one-time aspect is likely not important; results appear to be robust even to large code changes, and thus certainly to mere sample variance. of “total LOC” for each action class for each SUT by detecting function calls during actions and then measuring LOC reported by Python’s getsourcelines for every such function, using Python’s settrace feature, as shown in Figure 2; comments in the code describe the algorithm and some implementation details. It is important to understand that this does not measure code coverage—it simply collects the total LOC (as counted by Python’s notion of code lines, which includes blank spaces and comments222Including comments and blank lines is not a problem for our basic hypothesis: we also expect that code with more comments (or even more blank lines) is, all things being equal, more interesting to test.) for any Python function or method entered during execution of a test action, even if almost none of the code for that function/method is executed. The value recorded for an action is the sum of function/method LOCs, with each one only counting once (e.g., if f has 30 LOC and is called 40 times by an action, it only adds 30 to the LOC count for that action). The tracing function is installed with sys.settrace before each action is executed. In order to ensure that all action classes are measured, the sampling tool always selects any enabled actions whose class has not yet been sampled at least once. After each action class is sampled once, sampling is random until a fixed time limit is reached. The value recorded for each action class’s LOC count is the mean of all samples: , where is the set of all values computed using traceLOC for that action class. Taking the mean is required because, again, due to the highly dynamic nature of TSTL test harnesses, the same action class may not even be calling the same top-level method in every case. Since we cannot distinguish such cases statically, we want to know on average “how big” each action class is in terms of LOC. All action classes could be sampled effectively, multiple times, with 120 seconds of sampling for all of our experimental subjects. Any action classes that cannot be sampled within 120 seconds, using a strong bias in favor of unsampled classes, are highly unlikely to ever be covered during small-budget testing, in any case. After one such sampling run, the probabilities can be used in any number of future testing runs, as we show below.
2.2.2. Biasing Probabilities for Action Classes
Given this one-time mapping from action classes to LOC counts, we need to produce a biased probability distribution for action classes to be selected in future random testing. Additionally, there must be some way to handle action classes that do not cover any SUT LOC. These action classes cannot be excluded from testing: most harnesses need to generate simple input data, such as integers or booleans, where generating data does not cover any code under test. Our solution is simple: we evenly distribute 20% of the probability distribution among all action classes that do not call any SUT code (where the LOC value is 0). The remaining 80% is distributed to action classes with a non-zero LOC count in proportion to their share of the total LOC count for all action classes. This means that our heuristic does not care about absolute LOC at all, only relative LOC: it does not matter how long a function is, only how much longer (or shorter) it is than other functions to be tested. The core idea of our heuristic is this linear bias in favor of test choices proportional to their share of total LOC count. Formally, we define:
That is, is the number of actions (or, here, action classes) with 0 measured LOC, and is the total sum of all LOC measures for actions/action classes whose LOC estimate is non-zero (of course, since in these cases, we could also include them in the total).
We can then define , for the special case of zero-LOC action classes and for other action classes, thus:
For example, consider a TSTL harness with only three action classes: <int> := <[1..20]>, f(<int>), and g(<int>). The first action class does not call any SUT code: it simply assigns a value to be used in later testing. Assume that f calls no functions, but has 30 LOC, and g has 6 LOC itself and always calls h, which has 14 LOC, twice. Using the (mean) LOC counts of 0, 30, and 20, respectively, we get the following probabilities for the action classes, according to the LOC heuristic:
| Action class | Mean LOC | Formula | P(class) |
|---|---|---|---|
| <int> := <[1..20]> | 0 | 0.20 | |
| f(<int>) | 30 | 0.48 | |
| g(<int>) | 20 | 0.32 |
If we add another action class that does not call any code, and a direct call to h (with 14 LOC), the probabilities change to:
| Action class | Mean LOC | Formula | P(class) |
|---|---|---|---|
| <int> := <[1..20]> | 0 | 0.100 | |
| <ch> := <[’r’,’w’]> | 0 | 0.100 | |
| f(<int>) | 30 | 0.375 | |
| g(<int>) | 20 | 0.250 | |
| h(<ch>) | 14 | 0.175 |
One objection to this sampling approach is that it pays a non-negligible measurement cost, unlike purely static measurement. This is true, but in another sense there is a fundamental difference between essentially constant-time approaches (measuring LOC in source or fixed-time LOC sampling) and, e.g., coverage instrumentation that imposes a cost that will always be (at best) linear in the number of test actions executed. Even so, why not simply run for 120 seconds and measure code coverage instead of LOC, and use that measure? There are two answers. First, the general LOC idea remains static; in a less dynamic language than Python, it should even be possible to statically measure the LOC count for a method and the methods it calls, though this would lose the probability of calling non top-level methods. Second, and more importantly, using coverage is worse, for our purposes, than using LOC: any single short run is likely to only cover a small part of the code for any complex function with many hard-to-take branches. LOC is a much better way to estimate maximum possible coverage, since most runs will not cover the interesting (hard to cover) part of a function. Of course, biasing exploration by coverage is a very useful test-generation method; however, coverage is so dependent on actual test sequence and values, unlike LOC, that it is only effective in an approach, such as the Genetic Algorithm (GA) we compare with below, using runtime context and online instrumentation. To clarify the point, consider using our sampling approach to determine a “size” for a function f that takes a list s as an argument. Even if the function is very complex and lengthy, in a single short test run, most calls to it may be made with an empty list as an argument. That is, if the function looks like:
-
if len(s) == 0:
return 0
...
40 lines of complex destructuring and tabulation of the list
then the mean coverage for the action calling f will be very low, but the LOC count will reflect the fact that when called with a non-empty list the function will perform complex computation, even if the sampling never calls the function with a non-empty list. Traditional coverage-driven test generation using, e.g., a GA, relies on the context of a test with a non-empty list to identify the action calling f as interesting; in fact, such methods usually don’t identify a single action as interesting itself, but only a test as interesting. The price to be paid, however, is that coverage must be collected for every test at runtime. Our approach only instruments test execution during a one-time sampling phase, and thereafter uses that data to bias test generation. However, as we show, such a contextless LOC-based overapproximation of size is often, even ignoring this price, a better way to bias testing than a GA, for small test budgets.
3. Experimental Evaluation
3.1. Research Questions
Our primary research questions concern the utility of the LOC heuristic.
-
•
RQ1: How does test generation for 60 second budgets using the LOC heuristic compare to random testing, in terms of fault detection and code coverage?
- •
-
•
RQ3: How does combining orthogonal generation approaches (e.g., a Genetic Algorithm (GA), but using the LOC heuristic) for 60 second budgets compare to using only one test generation heuristic, for fault detection and code coverage? Is biasing a more sophisticated heuristic by also applying the LOC heuristic useful?
Our hypothesis is that using LOC to guide testing will be useful, outperforming, in terms of increased code coverage and/or fault detection for a fixed, small, testing budget, random testing alone for over 60% of SUTs, and outperforming (by the same measure) established heuristics/methods for at least 50% of SUTs studied. Further, combining LOC with compatible heuristics will frequently provide additional benefits, improving code coverage and/or fault detection for a given budget.
We also provide limited, exploratory, experimental results to supplement these primary results, covering a set of related issues; in particular:
-
•
What is the typical cost of measuring code coverage in Python using the best known tool, the coverage.py library?
-
•
How does test generation for 60 second budgets using the LOC heuristic compare to using afl-fuzz (Zalewski, 2014) via the python-afl module?
-
•
Can the LOC heuristic improve the effectiveness (as measured by code coverage) of feedback-directed random testing (Pacheco et al., 2007) in Java?
-
•
What is the impact of using outdated dynamic estimates of lines of code on the performance of the LOC heuristic?
-
•
Do the coverage advantages provided by the LOC heuristic over random testing persist over time, or are they limited to small budget testing?
3.2. Experimental Setup and Methodology
All experiments were performed on a Macbook Pro 2015 15” model with 16 GB of RAM and 2.8GHz Quad-core Intel Core i7, running OS X 10.10 and Python 2.7; experiments only used one core.
3.2.1. Evaluation Measures
We report results for both coverage and fault detection for our core question, small (default) budget test generation effectiveness. The reasons for the use of two core measures are simple. Fault detection essentially needs no justification: it is the end-goal of software testing, in that a test effort that fails to detect a fault in its scope has failed at its primary task. However, it is important to also measure code coverage for a number of reasons. First, small budget testing aims to detect just-introduced problems, and in a setting where simply covering all code is difficult, the best way to determine which defects will be detected will often be code coverage: the kinds of bugs detected in this way may not ever make it into committed/released software and thus not be represented by defects in externally visible code. Given this context, developers performing small budget testing are plausibly interested in simply covering as much of the code under test as possible as quickly as possible. For property-based testing, furthermore, developers often have sufficiently strong oracles (e.g., differential (McKeeman, 1998; Groce et al., 2007) ones) that mere coverage is more often sufficient for fault detection (Staats et al., 2011), especially for just-introduced faults, which are often easy to trigger, we suspect. Previous work on weaknesses of automatically generated tests showed that failure to cover the faulty code is often a critical problem: 36.7% of non-detected faults were simply never covered by any test (Shamshiri et al., 2015a).
A second reason it is dangerous to rely on only fault detection for evaluation is that defect sets are unfortunately typically quite small (e.g., Defects4J (Just et al., 2014) covers just 6 projects and about 400 bugs), and, more importantly for our purposes, are heavily biased towards bugs that lasted long enough to appear in bug databases, and usually only contain Java or C programs. As Dwyer et al. (Dwyer et al., 2006) showed, using a small set of defects can produce unreliable evaluations of testing methods, since so much depends on the exact faults used. Where there are significant differences in branch or statement coverage, correlation with fault detection for (what we use in every case) fixed-size test suites is known to be strong. Even work questioning the value of coverage (Inozemtseva and Holmes, 2014) tends to confirm the relationship for suites of the same fixed size, with Kendall usually 0.46 or better, often 0.70 or better (Inozemtseva, [n.d.]); i.e. higher coverage is highly likely to indicate higher bug/mutant detection (Gligoric et al., 2013; Gopinath et al., 2014a). We therefore demonstrate effectiveness using both coverage and limited fault-based evaluations.
BugSwarm (Tomassi et al., 2019) does provide a larger number of faults, and includes (unlike other data sets) Python examples. Unfortunately, when we examined the BugSwarm defects, the subjects and bug types were seldom easily translatable to a property-driven test harness, unless we were to undertake to essentially use our knowledge of the bug to carve out a portion of the Python API to test, and properties to check. This does not accurately reflect typical use of property-based testing, and would inevitably introduce bias. Using general-purpose harnesses for testing the libraries, developed without bug knowledge (and with developer input in some cases), is more realistic. The TSTL harnesses used in this paper were all, first and foremost, designed to reflect typical use of property-based testing, rather than to detect a specific bug, or for use as experimental subjects. These are all realistic test harnesses a developer might produce, in our opinion.
That is, while (mostly) written by authors of this paper, these harnesses were written A) to focus on important parts of API, to find bugs, not automatically generated with no understanding of the likely usage of the methods and B) with manually constructed, but simple, oracles, similar in style and power to those found throughout both the literature of property-based testing and real-world usage. The pyfakefs harness has benefitted from considerably commentary and examination by the pyfakefs developers, who made contributions to the TSTL code in order to support better TSTL testing of pyfakefs. Feedback from SymPy developers contributed in a lesser way to tuning that harness. We also examined a large number of real-world Hypothesis test harnesses to better understand real-world developer uses of property-based testing in Python. Furthermore, one of the authors originally used TSTL as a developer/tester only, not a researcher, in the course of pursuing an MS in Geographic Information Systems, focusing on testing the widely used ArcPy library for GIS, and either contributed to harnesses or vetted them as similar to her own efforts in a purely QA/development role.
Following the advice of Arcuri and Briand (Arcuri and Briand, 2014), we do not assume that statistical distributions involved in random testing are normal, and thus use the Mann-Whitney test for determining significance of non-paired comparisons (e.g., within-SUT runs), and the Wilcoxon test for determining significance of paired comparisons (per-SUT overall results, where the matching by SUT is important). We believe the 100 runs used for all experiments are (more than) sufficient sample size to effectively compare the impacts of various test generation methods, for each SUTs. The large sample size of runs per SUT, relative to significant but not unbounded variance in results we observed, allows us to detect, with very high probability, any differences between generation methods, and their effect size and direction—in short, the expected distributions of coverage and fault detection results for each SUT/method pair—unless the differences are very small.
We measured code coverage, both in our core experiments and in measures of the overhead of code coverage, using version 4.5.2 of the widely-used, essentially standard, coverage.py Python module333GitHub reports that over 80000 Python projects use coverage.py.. To our knowledge, coverage.py is practically the only Python coverage library used in practice, and is at least as low-overhead and efficient as any other Python coverage tool. Version 4.5.2 is not the most recent coverage.py release, but the changes in the two most recent 4.5 releases only concern packaging metadata and multiprocessing support in Python 3.8, neither of which affects overhead or is relevant to this paper’s concerns (https://coverage.readthedocs.io/en/coverage-5.0/changes.html). The 5.0 release similarly does not appreciably change measured overheads. All versions we used are based on a fast native C tracing implementation.
3.2.2. Experimental Subjects
| SUT | Size | Source | Stars / Uses |
|---|---|---|---|
| arrow | 2707 | https://github.com/crsmithdev/arrow | 5900 / 10400 |
| AVL | 225 | TSTL example (user1689822, 2012) | N/A |
| heap | 56 | Hypothesis example (MacIver, 2016) | N/A |
| pyfakefs | 2788 | https://github.com/jmcgeheeiv/pyfakefs | 281 / 398 |
| sortedcontainers | 2017 | http://www.grantjenks.com/docs/sortedcontainers/ | 1600 / Not reported |
| SymPy | 227959 | http://www.sympy.org/en/index.html | 6500 / 14600 |
| bidict | 569 | http://pythonhosted.org/bidict/home.html | 535 / Not reported |
| biopython | 81386 | https://github.com/biopython/biopython.github.io/ | 2000 / 3500 |
| C Parser | 5033 | https://github.com/albertz/PyCParser | 1900 / Not reported |
| python-rsa | 1597 | https://github.com/sybrenstuvel/python-rsa | 219 / Not reported |
| redis-py | 2722 | https://github.com/andymccurdy/redis-py | 8200 / 62900 |
| simplejson | 2811 | https://simplejson.readthedocs.io/en/latest/ | 1200 / 35400 |
| TensorFlow | 193374 | https://github.com/tensorflow/tensorflow | 140000 / 60100 |
| z3 | 10501 | https://github.com/Z3Prover/z3 | 5000 / 20 |
| XML | Tests consistently hit exponential case or bug causing loop; TSTL does not support action timeouts so this makes experiments impossible to perform. |
|---|---|
| arcpy | Each test action requires more than 60 seconds on average to perform; also most code under test is compiled C++ without coverage instrumentation, and only available on Windows. |
| bintrees | harness detects bug that consistently causes timeout; also, development stopped and replaced by sortedcontainers. |
| danluuexample | Toy example, with only one function to call. |
| datarray_inference | Coverage saturates in 60 seconds, and bug is only detectable using nondeterminism checks. |
| dateutil | Bug consistently causes timeout. |
| eval | Actual test of SUT is via subprocess execution, so coverage not possible, also only one test function. |
| gmpy2 | Code under test is almost entirely C code, not Python code. |
| kwic | Toy example from the classic Parnas problem, used in a software engineering class. Coverage saturates easily in 60s with random testing, and there are no bugs. |
| maze | Toy example with only one function to call. |
| microjson | Only call to SUT is in a property. |
| numpy | Average test action requires more than 60 seconds to run, and timeouts exceeding test budget are extremely frequent, along with crashes due to memory consumption. |
| nutshell | Toy example for TSTL Readme, with no actual code to test. |
| oldAVL | This is simply a less-readable version of the AVL harness included in our SUTs. |
| perfsort | Only calls one SUT function. |
| pysplay | Bug consistently causes timeout. |
| pystan | Only calls one SUT function (essentially a compiler test). |
| solc | Only calls one SUT function (essentially a compiler test). |
| stringh | Code under test is C code, not Python. |
| tictactoe | Toy example, code of interest only in property, and saturates coverage/detection of “fault” in 60 seconds. |
| trivial | Toy/contrived examples to test corner cases of test reduction. Saturates coverage/detection of “fault” in 60 seconds. |
| turtle | Toy example, no “testing” involved but an effort to produce interesting random art using test generation. |
| water | Toy example, no actual function calls at all. |
We applied the LOC heuristic, pure random testing, and two established test generation heuristics (a coverage-driven Genetic Algorithm (GA) and swarm testing) discussed below, to testing a set of Python libraries (Table 1) with test harnesses provided in the TSTL GitHub repository (Groce et al., 2015). Two of our SUTs (AVL and heap) are toy programs with hard-to-detect faults, used in TSTL or Hypothesis documentation and benchmarking; the remaining programs are popular Python libraries, with many GitHub stars indicating popularity. We could have omitted the “toy” examples as unrealistic, but included them because, while not of real-world code, both are extremely similar to property-based harnesses for real-world containers, which are frequently the target of property-based testing efforts. Moreover, the relatively small APIs in both cases made understanding the differences between test generation method performance easier (and thus made it easier to construct hypotheses about causes of method effectiveness for more complex SUTs).
Table 2 provides information on the faults in SUTs for which we investigated fault detection. Most faults in this table were detected by at least one of our core experimental runs. The exception is for SymPy, where the most faults detected by any single run was 2, and there were only 14 detected faults for our core experiments. We know of 12 additional detectable faults not found by any of the core experimental runs, as well; the set of 26 noted in the table is for all saved TSTL output for that version of SymPy, e.g., including our hour long experimental runs. A single recursion-depth error accounted for the largest fraction of detected faults, about half of all detections. Many faults were detected only three times out of 1250 experimental runs.
To avoid bias, we attempted to apply our approach to all of the example test harnesses included with the TSTL distribution at the time we performed our experiments, omitting only those where the experiments would be meaningless or give our approach an unfair advantage. Reasons for omission were limited to:
-
(1)
Python is almost completely an interface to underlying C code or an executable (e.g., gmpy2, eval), and so LOC of Python functions contains no useful information.
-
(2)
The SUT consistently enters an infinite loop (which makes it impossible to perform our 60 second budget experiments, since TSTL locks up and does not produce coverage summaries).
-
(3)
The minimum reasonable budget for testing is much longer than 60 seconds (e.g., for ESRI ArcPy, simple GIS operations often take more time than the entire test budget).
-
(4)
The harness is clearly a toy, without any real testing functionality (e.g., an implementation of a puzzle, or a tool for producing random turtle art), relevant coverage targets, or any (even fake) bugs.
-
(5)
All methods consistently completely saturate coverage within 60 seconds, and detect all faults.
-
(6)
Either no actions call SUT code (possible when all SUT interactions are via the property), or only one action calls SUT code (which would usually give an unfair advantage to our approach, which would automatically give that call 80% of the test budget).
Table 3 explains the reason for omission for every harness in the TSTL examples directory at the time we performed our experiments for which we did not report results; in some cases several of the above reasons apply. Obviously, harnesses introduced after we performed our experiments were not included (and most would be rejected for other reasons as well).
TSTL has been used to report real faults (later corrected by the developers) for pyfakefs, SymPy, and sortedcontainers. The pyfakefs effort is ongoing, with more than 80 detected and corrected defects to date, and one error discovered not in pyfakefs but in Apple’s OS X implementation of POSIX rename. Note that LOC for each SUT is usually much greater than coverage below. This is in part due to our focus on 60 second testing, in part due to the coverage tool not considering function/class definition code (e.g., def or class lines) as covered, and in part due to a more complex cause: most of the test harnesses only focus on easily specified, high-criticality interface functions, and omit functions whose output cannot effectively be checked for correctness, that are very infrequently used in practice, or that are easily completely verified by simple unit tests. These harnesses, for the portion of each SUT’s API tested, usually provide considerable oracle strength beyond that offered by Randoop or EvoSuite style test generation. The AVL, pyfakefs, bidict, and sortedcontainers harnesses provide complete differential testing with respect to a reference implementation in the standard Python library or the operating system, and the heap, SymPy, python-rsa, and simplejson harnesses provide round-trip or other semantic correctness properties.
A full implementation of the LOC heuristic approach evaluated in this paper has been available in the release version of TSTL since 2017, using the --generateLOC and --biasLOC options. In general, to reproduce our results, no special replication package is needed; using the current release of TSTL plus appropriate versions of tested Python modules is all that is required; experiments were performed on mac OS X, but should work in any Unix-like environment. The GitHub repository https://github.com/agroce/LOCtests contains our raw TSTL output files used for all analysis in this paper, and the exact configuration of TSTL used can be extracted by examining the first line of those files, plus version information to help with installation of appropriate versions of SUT libraries. The scripts directory in this repository contains our analysis scripts, though we warn the user that these are tuned to a local TSTL install and Python environment, and were not developed to be re-usable. The state of the code means that using your own analysis scripts may be more useful; they do show how to parse TSTL output, however. Note that the swarm dependency computation recently changed (https://blog.regehr.org/archives/1700), so the --noSwarmForceParent option must be used to match the older swarm results.
3.3. Results Comparing Test Generation Methods Supported by TSTL (RQs 1, 2, and 3)
| SUT | branch | stmt | faults | =branch |
|---|---|---|---|---|
| with detectable faults | ||||
| arrow | -6.47% | -5.20% | +75.9% | 9.5 |
| AVL | +2.95% | +3.30% | +37.5% | 98.2 |
| heap | 0.00% | 0.00% | +190.0% | 60.0 |
| pyfakefs | +0.09% | +0.13% | +403.7% | 95.2 |
| sortedcontainers | +33.03% | +33.34% | +INF*% | 186.6 |
| SymPy | +25.28% | +24.87% | -15.4% | 216.5 |
| * using older version of sortedcontainers with two faults; | ||||
| random testing never detected these faults; hence % gain INF; | ||||
| LOC produced 0.1 mean faults / 60s | ||||
| without detectable faults | ||||
| bidict | -6.18% | -7.21% | N/A | 8.8 |
| biopython | -13.52% | -13.66% | N/A | 9.9 |
| C Parser | +41.17% | +40.35% | N/A | 1108.9 |
| python-rsa | +0.40% | +0.41% | N/A | 66.1 |
| redis-py | +16.95% | +15.52% | N/A | 237.0 |
| simplejson | -15.45% | -13.81% | N/A | 19.4 |
| sortedcontainers | +35.43% | +35.27% | N/A | 268.7 |
| TensorFlow | +7.71% | +7.26% | N/A | 121.5 |
| z3 | +11.20% | +8.48% | N/A | 979.9 |
We ran each test generation method 100 times for 60 seconds on each SUT, and used those runs as a basis for evaluation. Table 4 gives an overall picture of the difference between unguided random testing and LOC heuristic-guided testing, divided between SUTs with detectable faults and those without. The second and third columns show mean changes in coverage. For those SUTs with faults detectable by the test harness, the faults column shows changes in number of faults detected. The final column, =branch shows the time required to obtain the mean 60 second branch coverage achieved using LOC, using pure random testing. Very roughly speaking, 60 seconds of testing with the LOC heuristic is as effective (at least in terms of branch coverage) as this amount of pure random testing. This is computed by taking the LOC coverage, then repeatedly running random testing until it reaches the same coverage, and taking the mean of the runtimes over 30 runs. This value is more informative than the simple percent improvement in coverage, since different branches are not equally hard to cover: for many SUTs 60-80% or more of all branches covered by any test are covered in the first few seconds of every test, but covering all branches covered by any test may take more than an hour, even with the most effective methods. For example, while z3 has one of the smaller percent improvements in coverage, it takes more than 16 minutes on average for random testing to cover the missing 11% of branches. For all columns, values in italics indicate differences that were not statistically significant (by Mann-Whitney U test (Arcuri and Briand, 2014)); values in bold indicate a statistically significant improvement over random testing, and SUTs in bold indicate that all significant changes for that SUT were improvements. There are two versions of sortedcontainers; the latest, and an older version before TSTL testing, with two very hard-to-detect faults (first detected by hours of random testing).
For 11 of the 15 SUTs and 9 of the 13 non-toy SUTs, all statistically significant differences from random testing were improvements, and often very large improvements (RQ1). In every case where there was a significant change in fault detection rate, there was an improvement, and the improvements were all larger than the single (not significant) negative change. Note that because of the time taken to process failing tests, when LOC improves fault detection, it pays a price in coverage proportional to the gain.
We also tried using the purely static method for estimating LOC discussed above. While this still often improved on random testing, it was statistically significantly much worse (by over 1000 branches/statements, and a large corresponding decrease in fault detection) than random testing for pyfakefs, and statistically significantly worse (but in a less dramatic fashion) than the dynamic sampling approach for both kinds of coverage for all other SUTs except redis-py. For redis-py, the static method was actually better than the dynamic approach, perhaps because there is almost no dynamic element to the types in the harness and the interesting code is primarily in top-level wrappers; inspection suggests that it also may simply be that an inaccurate estimate here has a beneficial effect, due to the dependencies between methods. Such a result for static LOC is, we see, unusual, at least among our SUTs, and the cost of dynamic sampling seems acceptable, given the benefits for all but one SUT.
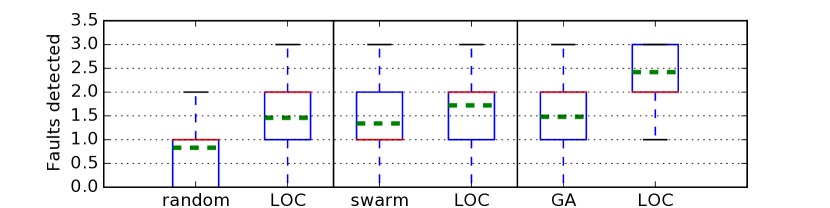
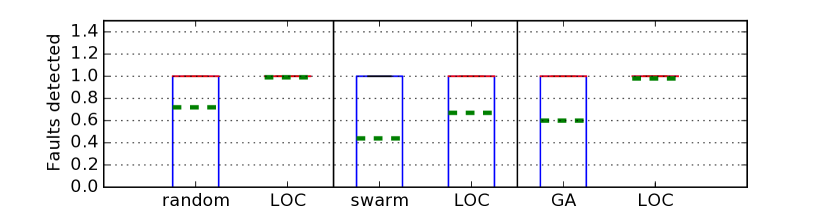
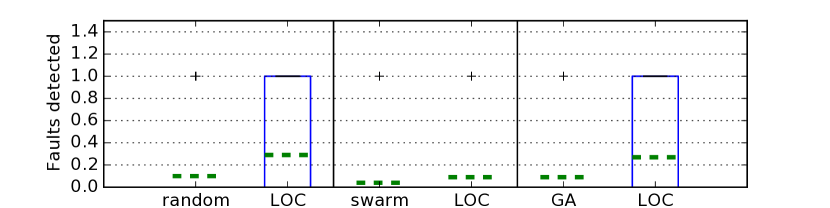
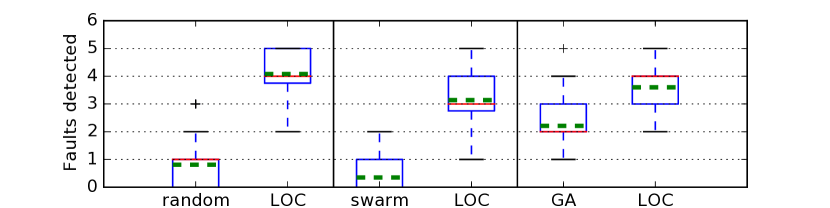
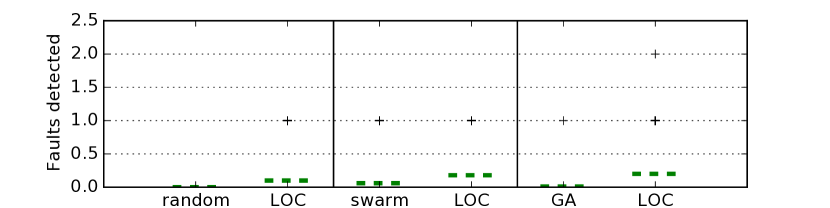
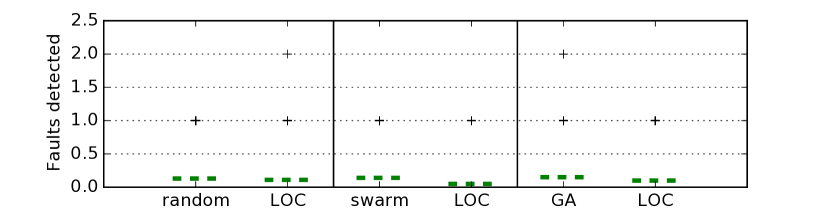
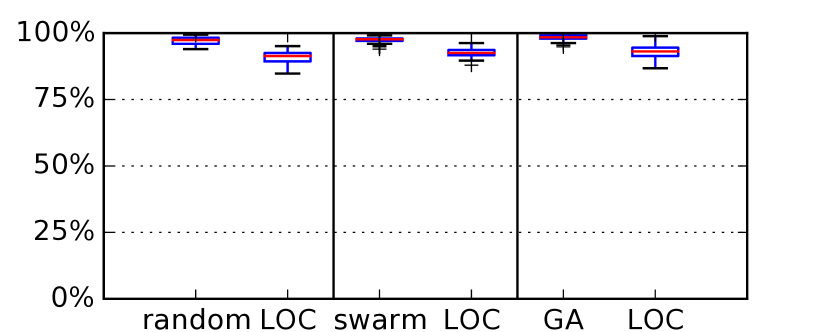
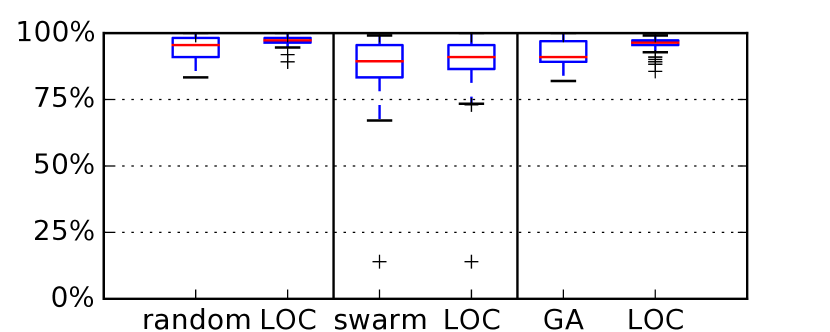
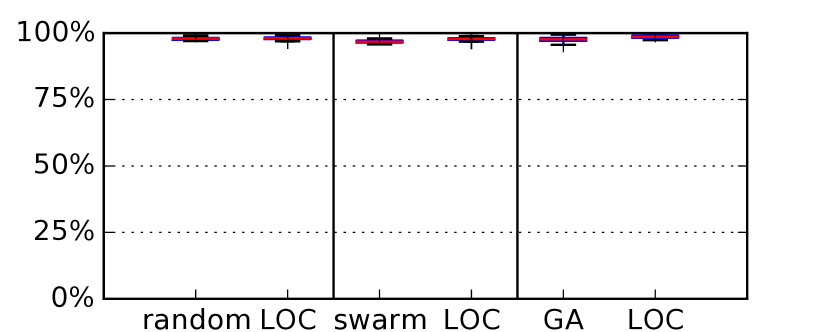
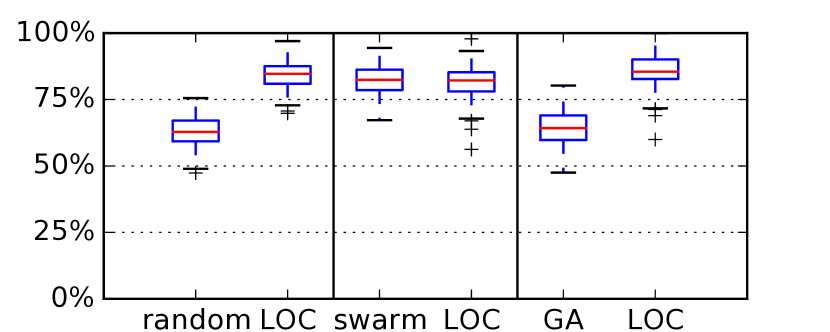
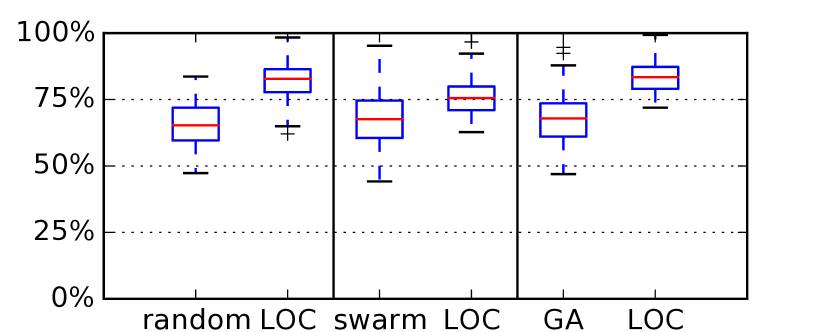
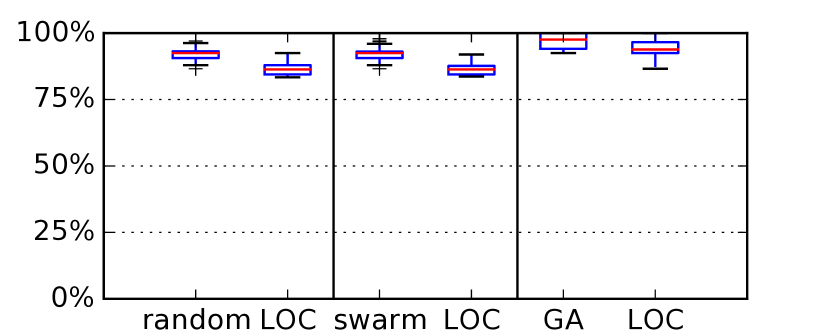
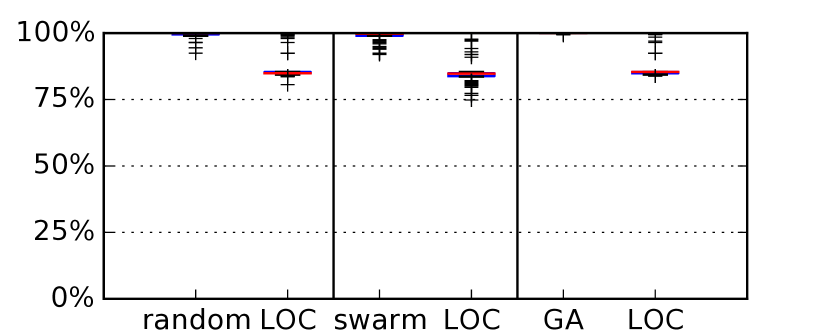
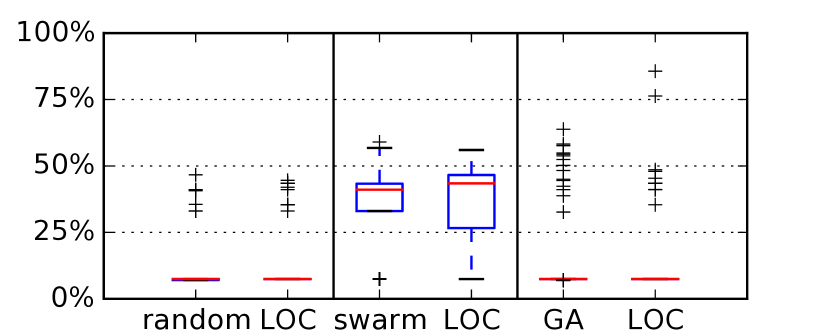
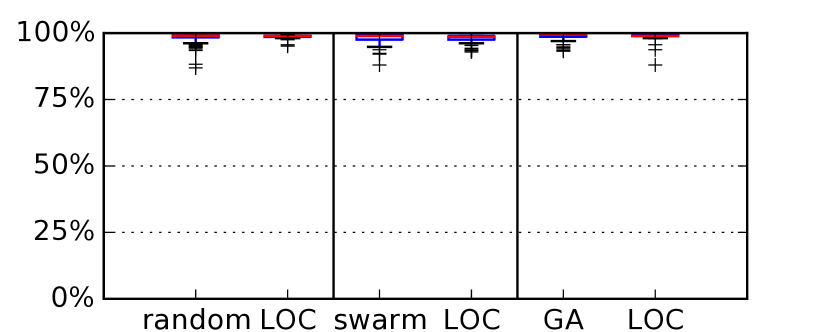
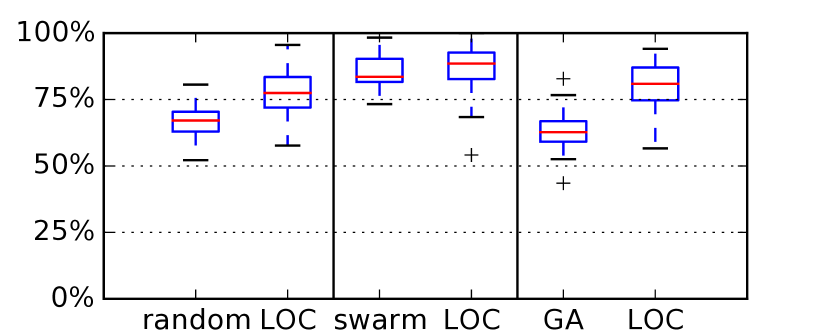
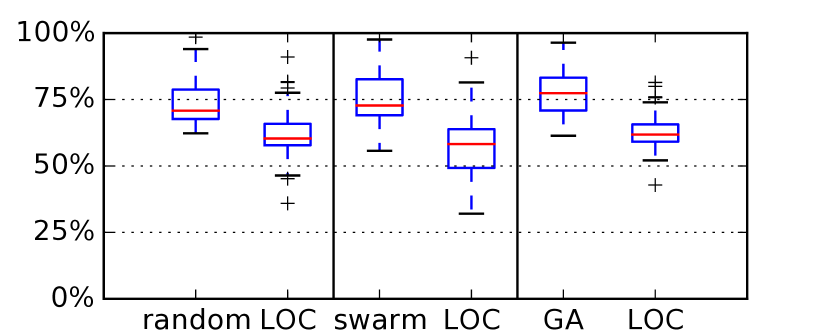
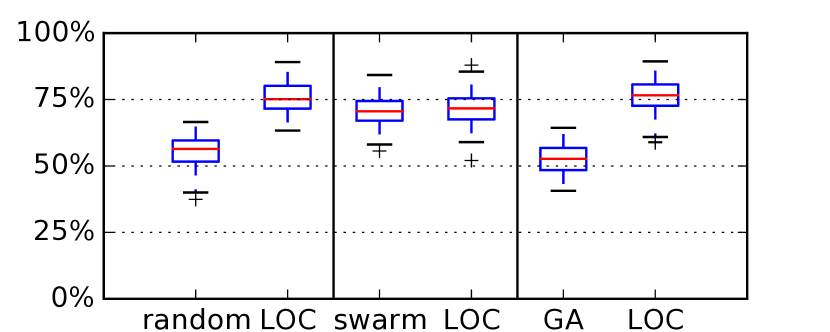
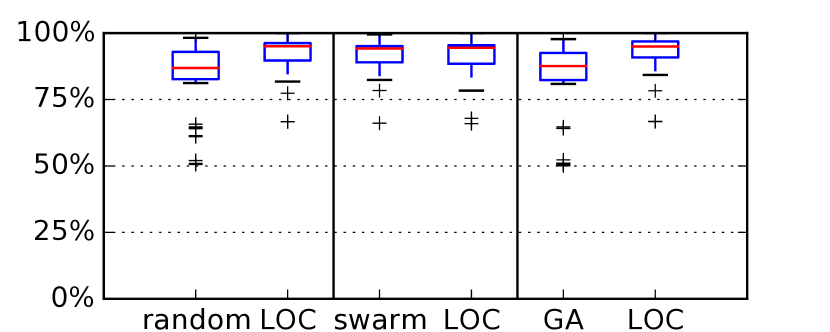
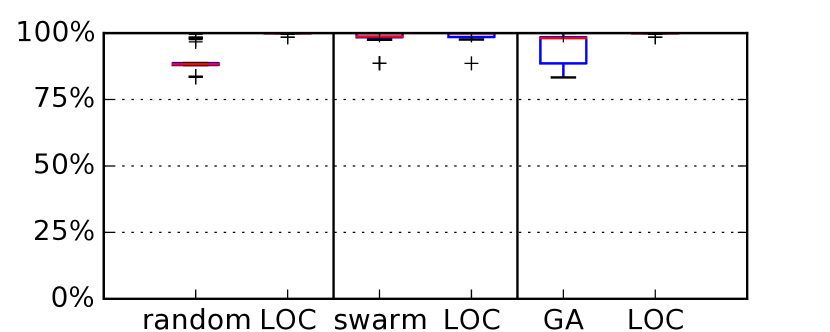
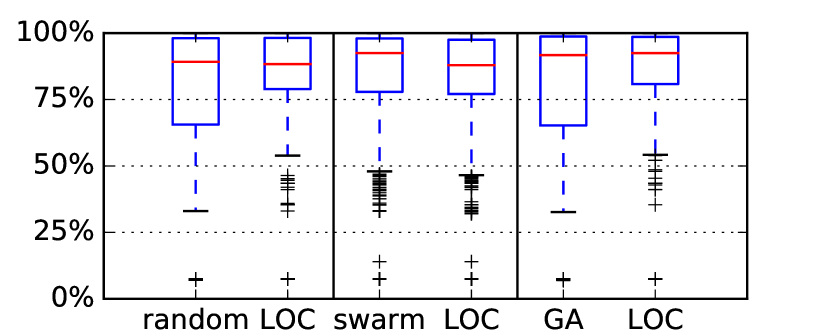
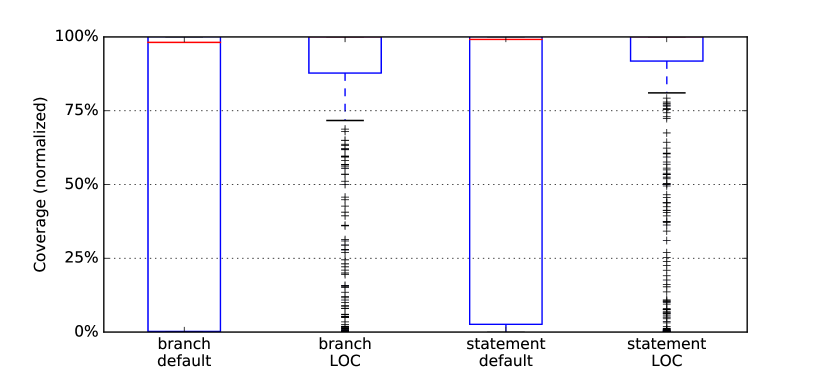
Figures 3 and 4 show more detailed results for applying the LOC heuristic, with each graphic structured to show pairs of methods, with the LOC-biased version in the second (right) position of each pair, to visualize results for RQ1-RQ3444The odd graph for Figure 4(c) means all runs always hit 100% branch coverage.. We omit statement coverage results, as the graphs are essentially not distinguishable from branch coverage results555The graph for heap is difficult to read because all methods always obtain 100% coverage.. The leftmost pair (random and LOC) corresponds to the data in Table 4. Coverage results in Figure 4 are normalized to % of maximum coverage obtained in any run, while faults are shown as actual number of faults detected. For fault detection, we added a dashed green line showing mean, since the small range of values (0-3) for most subjects produces similar median values even when results are quite different. In addition to pure random testing, these graphs show results for combining LOC with two other heuristics provided by TSTL. Because the LOC heuristic simply biases the actions chosen by the core random selection mechanism, it can be combined with many other testing methods, so long as they do not require setting action (class) probabilities. The middle and rightmost comparisons are for, without and with LOC bias:
-
•
Swarm (Groce et al., 2012c), before each test, randomly disables a set of action classes (with 50% probability) for each test. The TSTL swarm testing implementation also uses dependencies between action classes to improve the performance of swarm testing over the previously published method.
-
•
GA is a typical coverage-driven genetic algorithm (Fraser and Arcuri, 2011; McMinn, 2004; Aburas and Groce, 2016), mixing 20% random generation with mutation, crossover, and extension of high-fitness (as measured by code coverage, without branch distances) tests. It allows us to directly compare with search-based testing/mutational fuzzing driven by dynamic coverage measures. The TSTL GA implementation is tuned to small-budget testing: 20% of the time, or if there are no high-fitness tests in the population, it generates a new random test instead of choosing a test from the pool, and can extend a test rather than mutating it. This mixes initial population selection with population refinement and allows the system to escape local minima.
All three methods (LOC, swarm, and GA) are useful; it is never best to stick to pure random testing. Swarm often made testing worse666This is because swarm testing increases test diversity, which may make individual tests less effective, and not pay off in only 60 seconds., but when it was effective, it was highly effective, for three of the most difficult to test SUTs, the C parser, redis-py, and z3 (swarm’s origins in compiler testing show in that it helps with constructing structured, program-like, inputs). However, in all three cases, also using LOC makes swarm perform even better, so that swarm is never “the best” method.
For fault detection, all methods detected all faults in at least one run for arrow, AVL, heap, and pyfakefs. For pyfakefs, note that while every method found every fault at least once, only LOC-based methods were reliably able to detect most faults, and only LOC alone consistently found most of the faults, most of the time (see Figure 3(d)). Using LOC alone is statistically significantly better than all other methods (all differences with LOC and with random are significant, with ), detecting a mean of 4.07 faults per run. The next best method, the GA with LOC, only detected a mean of 3.6 faults/run. No method not using LOC detected more than 2.3 of the faults per run, on average. Random testing and swarm without LOC detected less than one fault, on average.
Using LOC also made detection rates and mean number of faults found higher for arrow, AVL, and heap, but in a less dramatic fashion (see Figure 3). For all subjects with detectable faults, except SymPy, the method detecting the most faults was either the LOC heuristic or a combination of the LOC heuristic with the GA, and the difference in fault detection rates for SymPy was not statistically significant between methods (RQ2-3).
For sortedcontainers and sympy total fault detection results were more interesting. Pure random testing never discovered either fault in sortedcontainers. LOC alone discovered one fault only, 30 times out of all runs; GA discovered only the other fault, and only 3 times; swarm testing found both faults, but detected a fault at all about half as often as LOC (6 detections for the fault the GA found, and 12 for the fault LOC found). Combining methods, swarm with the LOC found the fault LOC detected 66 times, and using the GA with LOC also found that same fault 66 times, and additionally detected the fault detected by GA 3 times. The story for SymPy was even more complex. Pure random testing found the most diverse fault set, but still only 7 of the 14 total detected faults. The LOC heuristic only found 3 different faults, but two of these were ones not found using pure random testing; one was not detected by any other approach. The GA found 4 different faults, two of which were not found using pure random testing, and one of which only it detected. Swarm testing found 4 different faults, again including one not found by random testing, but none unique among methods. Combining the GA with LOC made it possible to detect 5 faults, none of which were unique to that approach, and combining swarm with LOC found 3 different faults, of which one was unique. These results suggest that for finding faults, diversity of approach may be critical, a generalization of the reasoning behind swarm testing and swarm verification (Holzmann et al., 2011), but these overall detection results are not statistically validated in any sense: lumping all runs together essentially produces one large run.
Absolute differences in coverage varied for RQ1, but were often large. The mean mean gain in branches covered, for LOC vs. pure random testing, was 219.1 branches, with a median mean gain of 146.1 branches; mean loss when LOC was ineffective was only 27.9 branches (mean) or 29 branches (median). For 8 of 11 branch coverage improvements the gain was more than branches.
| random | LOC | GA | GA+LOC | swarm | swarm+LOC | |
|---|---|---|---|---|---|---|
| branch coverage | 0 | 1 | 5 | 7 | 0 | 2 |
| statement coverage | 0 | 2 | 4 | 7 | 0 | 2 |
| fault detection | 0 | 2 | 1 | 3 | 0 | 0 |
Perhaps the simplest way to compare methods for all of RQ1-RQ3 is to ask “For how many SUTs was a particular method the best approach for coverage?” and “For how many SUTs was a particular method the best approach for fault detection?” ignoring statistical significance. Table 5 shows the results. This analysis also reflects probabilites that, based on trial runs, a user would select each method for use in testing, an important point we consider further in Section 4.3. The combination of a GA with the LOC heuristic is clearly the best method, but we should always recall that this imposes the costly overhead of collecting coverage; below we attempt to estimate how the methods would compare if LOC were given the advantage of not having to compute coverage. Moreover, when LOC improved on random testing, it almost always improved GA and swarm to use LOC, as well (RQ3). The exceptions were that for branch coverage, adding LOC did not improve on GA for the C parser, did not improve on swarm for the buggy version of sortedcontainers, and did not improve either GA or swarm for python-rsa. For python-rsa, however, all values were so similar that this disagreement was not statistically significant. For fault detection, improvement over random was always accompanied by improvement when added to GA and swarm. It is clear that the LOC heuristic is a low-cost way to improve the performance of a GA in most cases, and that, ignoring the cost of code coverage, combining methods is often very useful.
We summarize the answers to RQ1-RQ3 in terms of individual SUTs more succinctly in Section 4.1 below, as a prelude to discussing the overall meaning and possible causes for our results.
3.4. Analysis Combining All Subjects (RQ1-RQ3)
Using normalized coverage data allows analysis of all subjects together, both those where LOC helped and those where it was harmful (Figure 4(p), which includes subjects with and without faults). Considering the impact of LOC on each SUT, and how often it was helpful is generally a more important way to understand the results, but the combined analysis provides some additional insights into the effect sizes for the various heuristics, and makes the comparison with pure random testing (RQ1) even clearer. The means for LOC were 83.0% of maximum branch coverage and 83.2% of maximum statement coverage. The means for pure random testing were 79.3% branch coverage and 79.6% statement coverage (RQ1). All differences were significant by Wilcoxon test at . LOC was also better for branch and statement coverage than GA (80.2% branch coverage, 80.4% statement coverage, ) (RQ2). This is particularly notable: despite also paying the (unnecessary) overhead of coverage, using random testing with the LOC bias outperformed a GA using code coverage results to drive testing. Combining the GA and LOC (RQ3) produced mean branch coverage of 84.2% and mean statement coverage of 84.5%. It is not clear that combining LOC and GA would even improve on LOC, if LOC did not pay the (high) overhead of code coverage; that is, the advantage of adding the GA may be overwhelmed by coverage costs for many SUTs. Swarm without LOC had the best coverage means (85.2% for both kinds), despite never being the method for best branch or statement coverage for any SUT (RQ2). Swarm with LOC performed slightly better than LOC alone in terms of coverage (83.2% branch coverage, 83.4% statement coverage) (RQ3). Again, we emphasize that for the very subjects where swarm testing was neccessary for producing good results, swarm with LOC was always better than swarm alone (RQ3). Swarm’s higher mean is entirely due to the very poor performance of LOC (or swarm with LOC) on a few subjects, and for these subjects swarm was also always less effective than GA (RQ2).
We similarly normalized fault detection by counting failed tests (hence probability of detecting any faults at all), and using the maximum number of failed tests as 100% (RQ1-RQ3). Swarm testing had the worst fault detection results by a large margin, with a mean of only 5.8% of maximum failures, faring badly compared to LOC (20.1%), GA (11.1%), LOC+GA (24.8%) and even pure random testing (6.3%). Presumably, this is partly because our faulty SUTs and “compiler-like” SUTs did not overlap. Swarm with LOC improved this, but only to 10.6%. LOC and LOC+GA, with 11.1% and 21.6%, respectively, were the only methods with median values better than 0.0%, i.e., with median detection of any faults (RQ1-RQ3).
There was not a compelling correlation between SUT size and either branch coverage () or fault detection () effectiveness for LOC compared to random testing. The directions of correlations are also opposite (positive for coverage, negative for faults). Using maximum statement coverage to measure “effective size of tested surface” instead of actual SUT LOC, produced similar results (, ).
3.5. The Cost of Coverage
A key assumption of this paper (and factor in choosing Python as the target language) is that, despite Python’s popularity, and years of work on testing tools for Python, such as unit testing libraries, the overhead of collecting coverage information in Python is large.
Table 6 shows a simple measure of the cost of coverage: for each SUT we ran 60 seconds of testing with and without coverage instrumentation, provided by the state-of-the-art coverage.py tool, for the same random seeds, 10 times, and recorded the total number of test actions taken in each case. The table shows the average ratio between total actions without coverage and total actions with coverage. The cost ranges from negligible (arrow) to exorbitant (biopython). Improving Python coverage costs is non-trivial, as discussions of the issues (and the fact that these overheads persist despite years of development on coverage.py) suggest (MacIver, 2017, ober).
The second column of results in Table 6 is for execution using the Python JIT (Just-In-Time compiler) pypy. Overhead for coverage is similar, except for biopython, where the cost is still significant at well over 2x more test operations when running without coverage instrumentation; it is merely reasonable compared to the exorbitant 50x fewer test operations with coverage, when not using the JIT. The mean is considerably reduced, due to biopython, but median cost is similar. We attempted to investigate why the overhead for biopython is so extreme when running without a JIT, but were unable to determine what the source of the problem is, based on profiler information. Dropping it as an outlier, considering only median overheads, it seems safe to say that with or without a JIT, in Python, measuring code coverage will usually effectively reduce the test budget considerably. We also tried re-running our experiments with the just released (Dec 14, 2019) stable non-alpha coverage.py 5.0, though none of the changes seemed likely to be relevant. As expected, results were within 10% of those for version 4.5.2, with no consistent improvement (or degradation). It is difficult to say what the cost of coverage would be, using the most sophisticated methods available in the literature; some are not appropriate, in that coverage-driven methods need to check every test executed for at least lower-frequency targets, and are likely to tolerate even infrequent “misses” poorly. Furthermore, given the popularity and development effort involved in coverage.py, including effort spent reducing overhead, we do not expect to see any less costly approaches available in Python for the forseeable future. The dynamic nature of the language, even under a JIT (as shown above) may preclude reaching the low overheads sometimes seen for C and Java code.
It is important to note that GA is the only method in our experiments that actually requires measuring code coverage during testing. However, in order to report coverage results as an evaluation, all methods were run with code coverage collection turned on. Again, we emphasize that in practice, a user interested in actual testing would run without code coverage, when not using GA, obtaining higher test throughput. Determining the exact impact of coverage overhead is difficult; we can record tests generated during execution without coverage instrumentation, and run the tests later to determine what coverage they would have obtained; however, the cost of recording all tests is itself very high, since some SUTs can generate thousands of tests in a minute, and storing thoses tests is expensive. In this paper, we simply compare results as if all testing methods were required to collect coverage data, but this over-reports the effectiveness of GA compared to other methods, including pure random testing. While we cannot effectively compare the LOC heuristic to GA for code coverage, without measuring code coverage, we can examine fault detection. LOC already detected significantly more faults than any other method for some SUTs (AVL, heap, and pyfakefs), and allowing for more test actions by disabling coverage only increased the gap. When we re-ran without code coverage, LOC also significantly () outperformed all GA-based methods for SymPy, detecting 0.24 mean faults per 60 second run, compared to 0.1 for the LOC+GA combination, or 0.15 for the GA alone (the best performing method when coverage was collected). For arrow and sortedcontainers, on the other hand, the cost of coverage was too low to enable LOC alone to outperform the previously best-performing LOC+GA combination. The primary determination for whether it is worth collecting code coverage in our experimental results seems to be the cost of coverage, rather than the effectiveness of GA. That is, when coverage is very cheap to collect, it is worth paying that cost to add GA to LOC, and when coverage is expensive, at least in our results, it seems that “paying for GA” may not be a good idea, even if GA is, ignoring that cost, a useful addition to LOC.
| SUT | ||
|---|---|---|
| (tests executed with pypy) | ||
| arrow | 1.00 | 1.01 |
| AVL | 6.41 | 4.66 |
| heap | 4.98 | 5.07 |
| pyfakefs | 2.03 | 2.11 |
| sortedcontainers | 1.09 | 1.17 |
| SymPy | 2.30 | 1.88 |
| bidict | 1.48 | 1.24 |
| biopython | 50.07 | 2.16 |
| C Parser | 1.04 | 1.02 |
| python-rsa | 1.14 | 1.22 |
| redis-py | 1.02 | 1.06 |
| simplejson | 1.47 | 1.09 |
| TensorFlow | 9.54 | 9.62 |
| z3 | 2.14 | 2.11 |
| Mean | 6.12 | 2.53 |
| Median | 2.03 | 1.56 |
3.6. Comparison with python-afl
American Fuzzy Lop (AFL), commonly known as afl-fuzz (Zalewski, 2014), is an extremely popular coverage-driven fuzzer (essentially using a GA over path coverage). python-afl (https://github.com/jwilk/python-afl) makes it possible to fuzz Python programs using AFL. Because TSTL supports generating tests using python-afl in place of TSTL itself, we were able to perform an additional comparison with the AFL algorithm (and python-afl’s instrumentation, designed to be low-overhead, with a C implementation) for test generation. TSTL in this setting is only used for test execution and property checking, not for test generation. We know from past experience that python-afl can find faults that TSTL cannot (e.g., https://github.com/jmcgeheeiv/pyfakefs/issues/378).
Because AFL requires a corpus of initial inputs on which to base fuzzing (it is a mutational fuzzer), we gave AFL 60 seconds to fuzz after using pure TSTL random testing for 20 seconds to produce an initial corpus. This in theory gives python-afl a substantial advantage over our TSTL-only tests.
Pure random testing with TSTL essentially always dramatically outperformed python-afl in terms of branch coverage, even though python-afl had the advantage of incorporating results from 20 seconds of TSTL random generation. For example, mean branch coverage for the simple AVL example decreased by 11%, while it decreased by almost 15% for sortedcontainers, and nearly 80% for sympy. The path coverage-based GA of AFL did produce improvements over pure random testing for some of the toy examples, e.g. improving fault detection rates by about 1% over random testing for the AVL example, and from 10% to 29% for hypothesis_heaps. However, this was still much worse than the LOC heuristic fault detection rates of 99% and 71%, respectively. Unsurprisingly, given the huge loss in code coverage, python-afl was unable to find the faults in sortedcontainers and sympy.
Rather than elaborate on these results, we simply note that it is unfair to compare against python-afl under our experimental settings and for the use case considered in this paper. Modern mutation-based fuzzers are primarily intended to be used in runs of at least 24 hours (Klees et al., 2018). They are, despite very sophisticated algorithms, extensive tuning, and high-performance instrumentation, not useful for quick turnaround property-based testing. Random testing is, at least in the Python setting, for this problem, a better baseline. As would be expected, given that LOC generally performs much better than random, it also outperforms python-afl, including in some cases where it performs worse than pure random generation.
3.7. Comparison with Feedback-Directed Random Testing
We would also like to compare to the feedback-directed random testing algorithm of Pacheco et al. (Pacheco et al., 2007). Unfortunately, perhaps due to reset or object equality overheads, it and related methods (Yatoh et al., 2015) are known to perform poorly in Python (Kaneoka, 2017). We therefore performed a preliminary experiment using the Randoop Java implementation.
The implementation was simple: we measured LOC (unlike with Python, only for non-comment, non-blank lines) for each method in the Class Under Test (CUT) using the Understand (Scientific Toolworks, Inc., 2017) tool, and then used Randoop’s ability to take as input a list of methods to test to bias probabilities accordingly. That is, in place of simply listing all methods of the CUT, we duplicated each method in the list a number of times equal to its LOC, thus biasing the probability in favor of larger methods in exactly the same way as with the Python testing. Unlike with Python, there was no dynamic sampling, consideration of additional methods called by a top-level method, or need to specify probabilities for “actions” not calling CUT code. Simply measuring top-level method LOC is reasonable in the Randoop context, since Randoop is not performing property-based testing with complex actions, but testing at the method level.
For our experiments, we used a set of 1177 Java classes taken from 27 projects hosted on GitHub and used in previous work on measuring testedness (Ahmed et al., 2016)777Thus projects known to compile, pass all tests, and be analyzable by Understand.. We randomly selected projects until we had classes, then applied Randoop to all of each project’s classes, first using the standard Randoop settings, and then again with no changes except use of LOC to bias method choice. Note that here measurement of LOC is a purely static, nearly zero cost, activity, and there is no coverage measurement during test generation for any approach. Coverage was measured by instrumenting and executing generated unit tests.
The results are, at a high level, similar to those for Python: the LOC heuristic is sometimes harmful, but more often produces an improvement in test effectiveness. Using the LOC heuristic increased mean branch coverage in unit tests for these classes produced by Randoop from 1640.7 branches to 1,924.1 branches (a 17.3% improvement), and mean statement coverage from 16010.8 statements to 18241.4 statements (a 13.9% improvement). The changes in median coverage were from 72.0 to 479.0 branches and from 234.0 to 6963.0 statements. These results were significant by Wilcoxon test (Arcuri and Briand, 2014), with . Figure 5 shows coverage, over all classes, normalized. Normalization means that we consider the maximum coverage for either the default Randoop or LOC heuristic suite to be “100% coverage.” This allows us to show results for very different class sizes using a consistent scale. The graph makes it clear that, while there were many classes where LOC was not useful, overall the effect was striking, with coverage much more tightly clustered close to the maximum observed. Median coverage (both kinds) for LOC was 100%; default coverage fell to 98.1% (branch) and 99.1% (statement). Mean branch coverage improved from 65.7% to 78.1% using the LOC heuristic, and mean statement coverage from 67.5% to 81.3%. Normalized results are significant with .
At the project level, coverage change was significant for only six projects (in part because most projects do not have very many classes). For five of these projects, branch (+4.9%, +10.2%, +12.5%, +33.0%, +112.6%) and statement coverage (+10.3%, +11.6%, +10.1%, +33.8%, +87.6%) both improved significantly, and absolute gains were larger than a mean of 1,000 branches/statements (in one case more than 10K statements) for all but one project. The other project had a significant decrease of 23.6% in branch coverage only, about 1,000 branches. The largest gain from using LOC at project level was 200% improvement in mean branch and statement coverage. More than 47 individual classes (across 11 different projects) had gains of 2000% or more, however.
3.8. Using Outdated LOC Estimates
In order to estimate the impact of the quality of the LOC estimates, where a large impact would force programmers to frequently re-analyze their code, we ran the exact same experiment as for RQ1-RQ3, except using probabilities sampled from older versions of the system, for all of the SUTs where (1) the LOC heuristic was more effective than random testing and (2) there existed significantly older versions of the code compatible with the test harness. In each case, we used as old a version as was compatible with the API of the latest version of the system with respect to the test harness.
For SymPy we were able to revert all the way from the 1.0 release (2016-3-8) to the 0.7.6 release (2014-11-20); difference of 3559 commits with total diff size, measured in lines, of 214125). For python-rsa we based probabilities on version 3.1.1 (2012-06-18; 131 commits/diff size 6338), nearly 4 years older than the current version 3.4.2 (2016-03-29). With redis-py we reverted to version 2.10.0 (2014-06-01; 90 commits/diff size 1380) in place of the current version, 2.10.5 (2015-11-2). Finally, for sortedcontainers, we only reverted to version 1.5.2 (2016-05-28; 21 commits/diff size 1090) in place of version 1.5.7 (2016-12-22); earlier versions removed a few interesting functions to test, and we wanted to see if a somewhat closer-to-latest version changed results in an obvious way. In all cases, the results were either very similar and statistically indistinguishable (), or, for SymPy, superior to, results using recent, more accurate, counts.

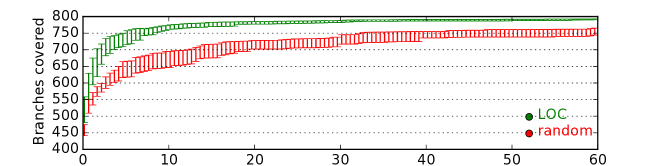
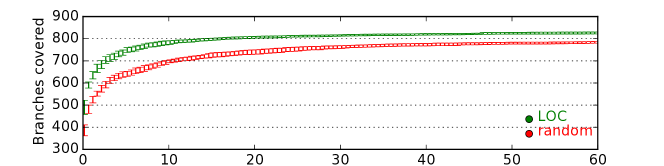
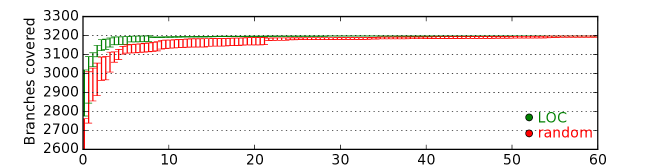
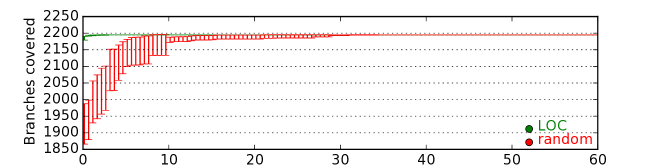
3.9. Using LOC with Larger Test Budgets
In order to check whether the LOC heuristic remains viable for longer test budgets, we also ran 1 hour of testing on the SUTs where LOC was effective for small budgets, coverage is not close to 100% at 60 seconds (and does not saturate reliably within two minutes, at least), and there are no faults. Our expectation was that while LOC is generally useful for improving coverage of both code and state-space, its tendency to focus on high-heuristic-value methods might eventually cause those portions of the code to become saturated, and some low-LOC methods or functions (especially ones that have few LOC but can, under unusual circumstances, call high-LOC methods not included in the dynamic estimate) to be under-covered. In all cases LOC continued to improve on pure random testing for much larger test budgets. Figures 6(a)-6(e) show the results of 15 runs for both LOC and pure random testing, with 95% confidence intervals888In order to make the saturation points more visible, we cut off the bottom of the very first confidence interval for TensorFlow: pure random can sometimes cover as few as 2200 branches.. In most cases, even after an hour, LOC was better than pure random testing, often by a large, significant, margin. With TensorFlow (Figure 6(d)) and z3 (Figure 6(e)), there was saturation, in that coverage reliably reached the maximum obtained within a few minutes (10 for TensorFlow and 2 for z3); however, random testing required more than 30 minutes to reliably hit the same set of branches. Results for statement coverage were (except for absolute numbers) essentially identical to those for branch coverage. For SymPy, not shown in the graphs, most 1 hour runs encountered an infinite loop fault, which may produce skewed results over completed runs; however, LOC covered 16,569 branches vs. random testing’s 11,038 branches, for the one successful run for each we eventually collected.
We confirmed that after 20 minutes (and usually after less than 60 seconds), all action classes had been chosen many times, so the differences here are not plausibly attributable to the low-hanging-fruit nature of larger functions. Instead, these gains must be due to hard-to-cover branches being more common in longer functions and the greater impact of longer functions on system state.
4. Summary and Discussion
4.1. Core Research Questions
For our core research questions (RQ1-3), we generally found that the LOC heuristic was effective. RQ1 could be clearly answered by saying that, in general, the LOC heuristic performs better than random testing without use of the heuristic to bias probabilities. For five of the six SUTs with faults, using the LOC heuristic significantly improved fault detection over pure random testing. The LOC heuristic had a negative impact on fault detection for the remaining SUT, but the change was not (unlike the improvements) statistically significant. The effect sizes in improvements were large; ignoring the one case where only using LOC allowed detection of any faults, the mean improvement was 176.8%. Using the LOC heuristic significantly improved branch coverage over pure random testing for 8 of the 15 SUTs, and significantly decreased it for 4 of the SUTs. The mean significant improvement effect size (+21.7%) was more than twice than the mean significant decrease (-10.4%). Using the LOC heuristic also significantly improved statement coverage for 10 of the 15 SUTs, and significantly decreased it for 4 of the SUTs. Mean significant improvement was 16.9%, compared to mean decrease of 10.0%. Our hypothesis was that LOC would outperform random testing by either a code coverage or fault localization meeasurefor 60% of SUTs; LOC significantly improved on random testing by some measure for 80% of SUTs.
The results for comparing to more sophisticated strategies (RQ2) were also good. LOC was significantly better for fault detection than the coverage-driven mutational GA for four SUTs and worse for only one SUT, with mean effect sizes of +375.6% and -90%, respectively. LOC was significantly better than GA for branch coverage for 8 of the SUTs and significantly worse for 6 of the SUTs, with mean effect sizes of +17.4% and -11.0%, respectively. For statement coverage, LOC was significantly better for 9 SUTs and worse for 5 SUTs, with mean significant effect sizes of +15.1% and -12.9%, respectively. LOC was significantly better than swarm for fault detection for three SUTs and worse for no SUTs, with mean effect size of +134.9%. LOC was significantly better than swarm for branch coverage for 7 of the SUTs and significantly worse for 6 of the SUTs, with mean effect sizes of +6.4% and -34.3%, respectively. For statement coverage, LOC was significantly better for 7 SUTs and worse for 6 SUTs, with mean significant effect sizes of +6.7% and -34.4%, respectively.
For GA, the comparison is clearly favorable for the LOC heuristic; it was better by some measure for more than 80% of SUTs. For swarm testing, LOC was better more often for all measures (improving on some measure for 66% of SUTs), and swarm was not useful for finding the bugs in our faulty SUTs, but, as noted above, when swarm is effective for coverage, it can be highly effective, with a greater positive impact than LOC had.
As to why LOC performed better or worse than GA or swarm, the explanation can be divided into two parts. For the SUTs where LOC is actually harmful, that is, worse than pure random testing, it unsurprisingly is also worse than more effective testing methods than random testing. We discuss possible causes for LOC performing worse than random testing below. This explains most of the cases where LOC performs worse than GA and swarm, simply: it performs worse when it is generally a bad idea to bias based on LOC, even compared to pure random testing. That is, the best way to predict if LOC will be more or less useful than the other two methods is to see if it is helpful compared to random testing. When LOC is worse than than random, it is likely to lose to methods that tend to do better than random. This point is not quite as tautological as it might seem: the other two cases for worse branch coverage are explained by GA or swarm providing a large benefit LOC cannot match, although LOC is useful. Swarm testing is, as noted, very powerful for compiler-like SUTs, and a search-based mutational approach is sometimes the only way to hit a hard-to-reach part of an SUT’s code, unsurprisingly. This is why these methods are established; they provide substantial, hard-to-duplicate benefits in some cases. LOC could have performed worse than GA and swarm in all cases, even if it was almost always a useful method, because they are even more powerful methods in general. This was not what we observed; instead, when LOC was helpful, it was often more helpful than the other methods, but LOC also has cases where it is not helpful, even compared to a “bad” method such as pure random testing.
Finally, combining methods (RQ3) was often useful. The GA using the LOC heuristic was the most effective method overall, for both branch coverage and fault detection, and swarm with LOC was the best method for branch coverage twice, while swarm alone was never the best method for any SUT. In particular, combining the GA and the LOC heuristic was significantly better than LOC alone for 2 SUTs and worse for one for fault detection, and better than LOC alone for 6 SUTs and worse for 1 for both branch and statement coverage. It was significantly better than the GA alone for 3 SUTs and worse for 2 SUTs for fault detection, and significantly better for 11 SUTs and worse for 3 SUTs for both branch and statement coverage. Combining with swarm testing was less effective; it was significantly better than the LOC heuristic alone for 2 SUTs and worse for 3 for fault detection, and significantly better for 3 SUTs and worse for 10 for both branch and statement coverage. Similarly, it was significantly better than swarm alone for 1 SUT and worse for 3 SUTs for fault detection, significantly better for 3 SUTs and worse for 7 SUTs for branch coverage, and significantly better for only 2 SUTs and worse for 8 SUTs for statement coverage. Thus, while swarm and LOC certainly can cooperate (recall that LOC improved swarm performance for the three SUTS that were most improved by swarm, the C parser, redis-py, and z3), they often do seem to work poorly together. We speculate that in some cases, LOC, by focusing testing on high-LOC functions, frustrates the increased test diversity provided by swarm testing; that is, if a configuration includes one high-LOC function, that function may consistently get the lion’s share of testing, reducing the impact of swarm (tests look more alike, despite different configurations). Swarm on the other hand frustrates LOC’s goal, by often removing all high-LOC functions from the set of available actions. However, given that LOC improved swarm performance for just those SUTs where swarm was most useful, this negative effect may only matter when swarm testing itself is not highly effective.
4.2. Supplemental and Exploratory Results
While these results are more exploratory than for our primary questions, we also can draw some additional conclusions. First, we believe that using the current-state-of-the-art tool (coverage.py) even in its latest version, and with a JIT, there is a substantial overhead for computing dynamic coverage in Python. Not instrumenting for coverage allows a testing tool to perform more than half again as much testing (that is, to execute more test actions, by a factor of 1.5), in the median case, even using a JIT. This is not a small advantage. Second, python-afl shows that using an off-the-shelf fuzzer, even a sophisticated one, does not compete with even a pure random tester for this type of short-budget property-based testing, at least without substantial additional effort. The LOC heuristic also seems to be able to improve code coverage for Java testing as well, when used to bias the Randoop tool’s generation method. Outdated LOC estimates seem to have little (negative or positive) impact on effectiveness of results, even across fairly large code changes, so long as the tested API itself is not altered. Finally, for some of our SUTs, the utility of the LOC heuristic extends to much larger testing budgets.
4.3. Discussion
Is the LOC heuristic likely to be universally effective for improving testing in settings with expensive code coverage instrumentation? No; it yields worse results for some of our Python SUTs. For large budget testing, this would be a real problem. In practice few, if any, test generation heuristics are close to universally effective, and the chance that a given, usually useful, heuristic may prove harmful, which cannot be easily predicted or detected (since we may only have time to run one technique) is frustrating with large test budgets. For instance, in our experiments, such established methods as a coverage-driven GA and swarm testing both perform worse than pure random testing in terms of branch coverage for 5 SUTs, and worse in terms of fault detection for 3 and 2 SUTs, respectively. This obviously does not mean these are “bad” methods, merely that they are heuristic. We note that the corresponding “worse than random” numbers for the LOC heuristic are 4 for branch coverage and 1 for fault detection, so a standard that would reject it would also presumably dismiss other well-established test generation approaches.
An expert performing an automated code audit for security testing has strong incentive to choose the most powerful fuzzing technique, but may have little way of knowing up front which method will perform best on a previously untested SUT, and lack resources to try multiple methods with full effect. In contrast, if a heuristic is often effective for small test budgets, and if effectiveness tends to be consistent for the same SUT over time, then it is easy to try several different techniques, measure coverage for them all, and configure the testing to apply the best technique. Our experimental results show that in such a setting the LOC heuristic would often be chosen, either by itself or in combination with another method.
Moreover, we can sometimes predict when the LOC heuristic will not be effective. When we examined the simplejson harness, we predicted that LOC would not work well. There are only four action classes that call any SUT code, and these four action classes only call two different methods, dumps and loads. The majority of the interesting behavior during testing is the generation of Python values to be encoded as JSON. The simplejson harness includes a property that calls both loads and dumps (to check that basic encoding and decoding work properly for all generated Python values). Properties are checked after every action, ensuring that the important functions to test are called. Actions call loads and dumps with various optional parameters, but LOC does not help distinguish which of these are most important to test, since they all rely on the same functions. When most testing of the SUT is accomplished by a property, not by actions, the LOC heuristic is likely to be useless or even harmful.
On the other hand, bidict is very similar to sortedcontainers, except that sortedcontainers has many more action classes (due to being larger and more complex). We do not know why the LOC heuristic makes bidict testing less effective, but speculate that all of the high probability actions calling the same function (via wrappers) may be responsible. The LOC heuristic thus concentrates too much on the update method. The sortedcontainers high probability action classes are much more diverse, including list slice and index modifications, the constructor for a SortedDict, a copy method, set union, and dictionary keys counting. A similar problem may explain the poor performance on biopython: more than 30% of the probability distribution is split between just two action classes, both of which call complex (and potentially computationally expensive) algorithms with no impact on object state, and both of which do not actually offer much in terms of coverage, since the harness has trouble producing non-trivial inputs that satisfy their preconditions (most inputs generated seem to be valid but uninteresting, the equivalent of empty lists). Finally, arrow has worse performance for LOC, as far as we can tell, almost entirely due to the fault LOC finds so much more frequently; unfortunately, due to the nature of the fault itself, it is hard to make TSTL not slower, even if we ignore the failing tests (restarting testing due to these faults is costly).
A better question might be, why is the LOC heuristic so effective, when it works? One possibility is that during a 30 or 60 second test run, not all action classes are explored by pure random testing. The LOC heuristic ensures that the action classes never chosen will usually be ones with a small LOC count—if you can’t cover everything, at least cover the “big” actions. In some cases this is critical; for example, in the C parser, making sure that every test run at least attempts to parse a program is essential to effective testing, and explains most of the difference between LOC and pure random testing for 30-60 second budgets. Alternative methods for avoiding failing to cover important action classes (such as the bias in our LOC sampling) are likely to impose a much larger overhead on testing than the LOC heuristic.
However, this does not explain the results for every SUT, and obviously does not explain the continued utility of the LOC heuristic over longer runs as shown in Figures 6(a)-6(c). For redis-py all action classes are easily covered after as little as five minutes of random testing, on average. The C parser’s actions (with the exception of one action that never calls any SUT code, and appears to only exist to reset uninteresting completed programs that do not contain any conditionals) are similarly usually covered in ten minutes or less. Only sortedcontainers poses a challenge for random testing, in terms of action-class coverage, due to a very large number of action classes, and even for it, 25 minutes of testing almost always suffices for complete action class coverage. While the gap between pure random testing and the heuristic arguably closes somewhere near the point when all classes have been tested, it does not disappear, in any of these cases, and for redis-py and sortedcontainers, the gap never disappears, even after an hour of testing.
We include the AVL and heap examples precisely because they feature extremely small interfaces, with only a few test actions, and saturate (or come close to saturating) coverage even during a 60 second run. For the heap example, pure random testing executes the least-taken action class about 40 times on average, during 30 second runs, and for AVL the only action class with a significant probability of not being taken is the action of displaying an AVL tree (which is not in any way helpful in detecting the fault); the next least-frequently executed action class is executed about 10 times during 30 seconds of random testing. Why is LOC able to triple the fault detection rates for these simple SUTs? The best explanation we can propose is that our assumptions discussed in the introduction to this paper are frequently true for individual SUTs: longer functions modify system state more, and perform more complex computation. All things being equal, they contribute more to test effectiveness, and calling such functions more frequently helps detect faults, both by modifying system state in more complex ways, and performing complex computations that expose erroneous state. An alternative way of seeing the same effect is to observe that the LOC heuristic decreases the frequency with which tests perform simple query actions, such as AVL tree traversal, checking emptiness of a container, or drawing a random byte in a cryptography library. And, indeed, when we investigate the details of the faults found much more easily for sortedcontainers, arrow, pyfakefs, and the toy examples, the bugs are located in unusually large functions that also have ways to execute very little code (conditions under which they do very little), just as we would expect. Such code is probably quite common, in that “do nothing for simple inputs (e.g., empty lists), do a lot for complex inputs (e.g., nested lists)” is a common pattern in many algorithms. LOC seems to help hit the first case.
More generally, one overall take-away from this paper should be that test generation heuristics are not equally effective for all SUTs and test harnesses; rather, performance varies widely by the structure of the input and state space. This is not a novel observation, of course (Shamshiri et al., 2015b, 2018). In a sense, this goes with the territory of heuristics, vs. mathematically proven optimizations of testing (alas, the latter are rarely possible) (Groce and Visser, 2004; Groce et al., 2012b). Examining methods in isolation is also insufficient to obtain maximally effective testing: while combining methods sometimes reduced effectiveness, a combination of some method with LOC was often the most effective approach. Assuming effectiveness ranking is stable for each SUT over time (at least over days or weeks, which seems highly likely), we believe that projects seeking effective automated test generation should run simple experiments to determine good test generation configurations once, and then re-use those settings, perhaps parameterized by test budget (e.g., different settings may be needed for testing during development, ten minute “coffee break” testing, “lunch-hour” testing, and overnight runs). Because it is performed most frequently, and is most useful for debugging (faults are easiest to fix just after introduction), it is fortunate that tuning very small test budgets is quite easy. In our Python experiments, we note that the most effective method seldom changed between results for as few as 10 tests and for the full 100-test experiments. Effect sizes that matter can be detected in less than an hour.
We therefore propose a simple, one-time, method for choosing a standard property-based testing approach for an SUT under development/test. Run pure random testing, LOC alone, the GA, and swarm, 10 times each, for 1 minute. This requires 40 minutes, a reasonable cost for a one-time decision that can improve small-budget testing for a long development period. If LOC performs worse than pure random testing, use whichever method is best (and perhaps combine GA and swarm if both outperform pure random testing, though we have no experimental data on this combination). If LOC is better than pure random testing, combine it with GA, or swarm, or perhaps both, if they also improved on random testing. Finally, and critically, if the approach chosen does not include use of the GA, run testing without coverage instrumentation to take advantage of the higher throughput LOC and swarm allow.
Moreover, there is often no reason to find “the best method.” In modern security fuzzing, there is a growing awareness that predicting the best method is difficult, and ensemble methods are highly effective (Chen et al., 2019); tools from firms performing security audits are beginning to reflect this wisdom (https://blog.trailofbits.com/2019/09/03/deepstate-now-supports-ensemble-fuzzing/). Running LOC, GA, GA+LOC, and swarm+LOC for 15 seconds each might well be the best use of 60 seconds of test budget for an SUT. Certainly for larger test budgets, this is likely to be the case, due to the diversity effect seen in security fuzzing, and in our fault detection results. This diversity effect, after all, is the inspiration for highly successful swarm verification (Holzmann et al., 2011) and testing (Groce et al., 2012c) methods, themselves.
Finally, despite the wide variance of heuristic performance, our results for Python and Java were surprisingly similar, given that we used the LOC heuristic in combination with quite different underlying random testing methods, for different languages, different styles of testing (property-based with a harness and more complex oracle vs. automatic unit test generation for classes), and even different notions of LOC (dynamic sampling vs. purely static, and with comments/blank lines vs. code only). We believe this provides a strong argument that LOC does provide a good, if rough, measure of the ability of “test actions” (broadly conceived) to explore SUT/CUT behavior. In other words, our results support our belief that, while there may be even better answers to the “f or g?” question (though we suspect even these would take function size into account as one among a number of factors), testing the function with more LOC is a good, and practically useful, approach.
5. Threats to Validity
Internal Validity: For our SUTs, we believe the causal relationships for primary RQs are unlikely to be spurious; we used 100 runs, and compared results using appropriate statistical tests that do not assume normality (Arcuri and Briand, 2014). We do not claim that the LOC heuristic is uniformly effective, only that, for the SUTs considered it often improves fault detection, branch, and statement coverage by a significant amount. The Java experiments are highly preliminary, essentiallly exploratory, since they do not include fault detection results.
External Validity: The primary threats are to external validity. The Python results are based on a limited set of programs with harnesses already existing in the TSTL repository when we began this investigation. We did not modify the harnesses, and only used harnesses covering a realistic subset of library behavior (test harnesses that might be used in practice, and in three cases that have been used to report real faults). Two of the subjects are essentially small toy examples. The remaining SUTs are popular real-world Python libraries with a large number of GitHub stars or pip downloads, but only three of the projects (SymPy, biopython, and TensorFlow) are extremely large. However, in practice, property-based testing is usually focused on a smaller subset of a system, and the 500-5000 LOC size of most of the subjects (around 2KLOC for most) is likely a reasonable approximation of the size of SUT where small budget testing is likely to be highly effective (and reflects the size of many important Python libraries with subtle behaviors: Python is a highly compact language with similarities to Haskell in terms of density (Gopinath et al., 2014b)). The Java projects were chosen (Ahmed et al., 2016; Just et al., 2014; Shamshiri et al., 2015a) to be representative open source Java projects, but may be subject to bias due to GitHub’s unknown selection methods. While the exact cross-method comparisons are unlikely to be preserved, we think it is highly unlikely that LOC is not at least frequently a useful bias to impose on any test method that chooses from a random set of actions representing method or function calls.
Construct Validity: The test generation methods use a common code base in TSTL, and the coverage.py tool for collecting Python coverage data. The threats to our results would arise from either (1) an incorrect implementation of one of our test generation methods, meaning that we evaluate a different testing approach than we claim to, or (2) an error in coverage.py that somehow favors one method over another. We inspected the implementations of the testing methods in TSTL carefully, and they have been tested on multiple SUTs, including simple ones where we were able to follow the data structures used by approaches and compare to expected results and tests. The coverage.py library is very widely used, and it is further unlikely that any subtle bugs in it favor one testing approach more than another. However, it is possible that errors in these implementations did bias our results. We welcome independent re-implementations to check for the possibility of remaining consequentual errors. The Java experiment relies only on the ability of Understand to count LOC and Randoop to bias probabilities using a method list: any errors in Randoop itself would only change the context of the comparison, not the impact of using LOC.
6. Related Work
There is a long line of work investigating relationships between static code measures such as LOC and defects in code, though usually at the module or file level, and never in the context of test generation. Radjenović et al. (Radjenović et al., 2013) provide a detailed literature review of metrics used for fault prediction. Zhang (Zhang, 2009) showed that 20% of the largest modules studied contained 51-63% of the defects. Ostrand et al. (Ostrand et al., 2005) showed that the largest 20% of files contained between 59% to 83% of of the faults. Koru et al. (Koru et al., 2009) and Syer et al. (Syer et al., 2015) reported that defect proneness increases with module size, but at a slower rate. Other studies (Fenton and Ohlsson, 2000; Olague et al., 2007; Andersson and Runeson, 2007) also showed that LOC correlates with the number of faults. In general, all of this work aims to advise developers to keep code small, rather than to aid testing; it has never proven a highly useful method even for default prediction, compared to less generic techniques (Menzies et al., 2002; Fenton and Ohlsson, 2000; Graves et al., 2000; Zimmermann and Nagappan, 2008). There are also a large number of metrics designed specifically for object oriented programs. Some (referred to as CBO, WMC and RFC, in the relevant papers) have been proposed as useful predictors of pre-release faults (Basili et al., 1996; Briand et al., 2001; Gyimothy et al., 2005; Olague et al., 2007; Pai and Dugan, 2007), while other measures, such as LCOM, DIT, and NOC, did not perform well (Zhou and Leung, 2006; Gyimothy et al., 2005; Olague et al., 2007, 2007; Pai and Dugan, 2007). Olague et al. (Olague et al., 2007) claimed that the QMOOD metrics (Bansiya and Davis, 2002) were suitable for fault prediction, while the MOOD suite of metrics (e Abreu and Carapuça, 1994; e Abreu and Melo, 1996) was not. Cohesion metrics (LCC and TCC) (Bieman and Kang, 1995) had modest effectiveness for predicting future faults (Briand et al., 2001; Marcus et al., 2008), and coupling metrics, proposed by Briand et al. (Briand et al., 1999) were good predictors of future faults (Briand et al., 1999; Briand et al., 2001; Briand and Wüst, 2002; El Emam et al., 2001). Our work, rather than demonstrating a coarse, weak correlation between code entity size and defects detected, uses code size to drive test generation, improving code coverage and fault detection. As discussed in the conclusion, it would be interesting to use some of the above measures, or other (semi-)static measures, than LOC to bias testing, or in combination with LOC, including ones not highly useful in isolation. Further possible interesting measures to investigate include code changes/revision history (Ekelund and Engström, 2015; Saha et al., 2015; Buchgeher et al., 2013; White et al., 2008; White and Robinson, 2004; Engström et al., 2010; Wikstrand et al., 2009; Gligoric et al., 2014), source file (Saha et al., 2015; White et al., 2008; White and Robinson, 2004; Hirzel and Klaeren, 2016; Carlson et al., 2011), number of contributors (Herzig et al., 2015), class dependencies (Skoglund and Runeson, 2005), component changes (Zheng et al., 2006, 2007), estimated execution time (Tahvili et al., 2016; Srivastava and Thiagarajan, 2002), or filed-issue-related metrics (Engström et al., 2010; Wikstrand et al., 2009; Herzig et al., 2015; Marijan et al., 2013; Marijan, 2015).
LOC has sometimes been used as a independent variable or as an objective function in search-based-software engineering. Fatinegun et el. (Fatiregun et al., 2004) looked at heuristics to reduce the size of program, and Dolado et al. (Dolado, 2000) proposed a technique to estimate the final LOC size of a program. Again, the purposes of these uses (or estimations) of LOC are completely different than our proposed heuristic to guide random test generation.
Previous approaches to tuning probabilities in random testing, such as Nighthawk (Andrews et al., 2007) and ABP (Groce et al., 2012b) learned probabilities based on coverage feedback, rather than assigning fixed probabilities based on a simple (and essentially static) metric of the tested code, the core novel concept presented in this paper. Randoop (Pacheco et al., 2007) and other feedback-based approaches (Yatoh et al., 2015) arguably obtain part of their effectiveness from an indirect avoidance of short functions that do not modify state, but pay the cost of determining if a call produces no state change. To our knowledge the size of functions/methods has never been used as even a factor in the decision of which API calls to make in automated test generation. Arguably, an approach such as that taken by VUzzer (Rawat et al., 2017), a fuzzer where code regions with “deep” and “interesting” paths are prioritized, based on static analysis of control features, bears some abstract, high-level, resemblance to our method, but the actual heuristics used and settings are utterly different. The methods with which we compare in this paper, a genetic algorithm-based approach, and the swarm approach, are based on alternative proposed methods for guiding this type of random testing, in particular evolutionary approaches such as EvoSuite (Fraser and Arcuri, 2011) and the swarm testing concept of configuration diversity (Groce et al., 2012c), which was originally inspired by the use of diverse searches in model checking (Holzmann et al., 2008b, a, 2011). The swarm notion of diversity also informed our decision to evaluate combinations of orthogonal heuristics, under the assumption that no single method for guiding testing is likely to be best in all, or even most, cases.
7. Conclusions and Future Work
This paper argues that simply counting the relative LOC of software components can provide valuable information for use in automated test generation. We show that biasing random testing probabilities by the LOC counts of tested functions and methods can improve the effectiveness of automated test generation for Python. The LOC heuristic often produces large, statistically significant, improvements in both code coverage and fault detection. As future work, we propose to further investigate the LOC heuristic, including for larger test budgets, given the promise shown in a few longer runs.
More generally, the LOC heuristic opens up a new approach to biased random test generation, based on the “f or g?” thought experiment. For instance, one promising next step is to modify the heuristic to also bias testing towards executing code that has been the subject of a static analysis tool warning, is less tested in existing tests, or is otherwise anomalous (Ray et al., 2016); alternatively, we can use cyclomatic complexity (McCabe, 1976; Landman et al., 2016) or another more “sophisticated” measure (e.g., number of mutants) in place of simple LOC, or use various measures discussed in Section 6 to refine the LOC estimate of desirability of a test action. For instance, for what is perhaps property-based unit testing’s most important goal—detecting errors newly introduced into code during development—an integration with directed swarm testing (Alipour et al., 2016) to target recently changed code is both feasible and very promising.
References
- (1)
- Aburas and Groce (2016) Ali Aburas and Alex Groce. 2016. A Method Dependence Relations Guided Genetic Algorithm. In Search Based Software Engineering - 8th International Symposium, SSBSE 2016, Raleigh, NC, USA, October 8-10, 2016, Proceedings. 267–273.
- Agrawal (1994) Hiralal Agrawal. 1994. Dominators, Super Blocks, and Program Coverage. In Proceedings of the 21st ACM SIGPLAN-SIGACT Symposium on Principles of Programming Languages (Portland, Oregon, USA) (POPL ’94). ACM, New York, NY, USA, 25–34. https://doi.org/10.1145/174675.175935
- Ahmed et al. (2016) Iftekhar Ahmed, Rahul Gopinath, Caius Brindescu, Alex Groce, and Carlos Jensen. 2016. Can Testedness Be Effectively Measured?. In Proceedings of the 2016 24th ACM SIGSOFT International Symposium on Foundations of Software Engineering (Seattle, WA, USA) (FSE 2016). ACM, New York, NY, USA, 547–558. https://doi.org/10.1145/2950290.2950324
- Alipour et al. (2016) Mohammad Amin Alipour, Alex Groce, Rahul Gopinath, and Arpit Christi. 2016. Generating Focused Random Tests Using Directed Swarm Testing. In Proceedings of the 25th International Symposium on Software Testing and Analysis (Saarbrücken, Germany) (ISSTA 2016). ACM, New York, NY, USA, 70–81. https://doi.org/10.1145/2931037.2931056
- Andersson and Runeson (2007) C. Andersson and P. Runeson. 2007. A Replicated Quantitative Analysis of Fault Distributions in Complex Software Systems. IEEE Transactions on Software Engineering 33, 5 (May 2007), 273–286. https://doi.org/10.1109/TSE.2007.1005
- Andrews et al. (2007) James Andrews, Felix Li, and Tim Menzies. 2007. Nighthawk: A Two-Level Genetic-Random Unit Test Data Generator. In Automated Software Engineering. 144–153.
- Andrews et al. (2010) Jamie Andrews, Yihao Ross Zhang, and Alex Groce. 2010. Comparing Automated Unit Testing Strategies. Technical Report 736. Department of Computer Science, University of Western Ontario.
- Andrews et al. (2005) James H. Andrews, L. C. Briand, and Y. Labiche. 2005. Is Mutation an Appropriate Tool for Testing Experiments?. In International Conference on Software Engineering. 402–411.
- Arcuri and Briand (2014) Andrea Arcuri and Lionel Briand. 2014. A hitchhiker’s guide to statistical tests for assessing randomized algorithms in software engineering. Software Testing, Verification and Reliability 24, 3 (2014), 219–250.
- Arcuri et al. (2010) Andrea Arcuri, Muhammad Zohaib Z. Iqbal, and Lionel C. Briand. 2010. Formal Analysis of the effectiveness and predictability of random testing. In International Symposium on Software Testing and Analysis. 219–230.
- Bansiya and Davis (2002) J. Bansiya and C. G. Davis. 2002. A hierarchical model for object-oriented design quality assessment. IEEE Transactions on Software Engineering 28, 1 (Jan 2002), 4–17. https://doi.org/10.1109/32.979986
- Basili et al. (1996) V. R. Basili, L. C. Briand, and W. L. Melo. 1996. A validation of object-oriented design metrics as quality indicators. IEEE Transactions on Software Engineering 22, 10 (Oct 1996), 751–761. https://doi.org/10.1109/32.544352
- Batchelder (2015) Ned Batchelder. 2015. Coverage.py. https://coverage.readthedocs.org/en/coverage-4.0.1/.
- Bieman and Kang (1995) James M. Bieman and Byung-Kyoo Kang. 1995. Cohesion and Reuse in an Object-oriented System. SIGSOFT Softw. Eng. Notes 20, SI (Aug. 1995), 259–262. https://doi.org/10.1145/223427.211856
- Böhme and Paul (2014) Marcel Böhme and Soumya Paul. 2014. On the Efficiency of Automated Testing. In Proceedings of the 22nd ACM SIGSOFT International Symposium on Foundations of Software Engineering (Hong Kong, China) (FSE 2014). ACM, New York, NY, USA, 632–642. https://doi.org/10.1145/2635868.2635923
- Briand and Wüst (2002) Lionel C. Briand and Jürgen Wüst. 2002. Empirical Studies of Quality Models in Object-Oriented Systems. Advances in Computers, Vol. 56. Elsevier, 97 – 166. https://doi.org/10.1016/S0065-2458(02)80005-5
- Briand et al. (1999) Lionel C. Briand, Jürgen Wüst, Stefan V. Ikonomovski, and Hakim Lounis. 1999. Investigating Quality Factors in Object-oriented Designs: An Industrial Case Study. In Proceedings of the 21st International Conference on Software Engineering (Los Angeles, California, USA) (ICSE ’99). ACM, New York, NY, USA, 345–354. https://doi.org/10.1145/302405.302654
- Briand et al. (2001) Lionel C. Briand, Jürgen Wüst, and Hakim Lounis. 2001. Replicated Case Studies for Investigating Quality Factors in Object-Oriented Designs. Empirical Software Engineering 6, 1 (2001), 11–58. https://doi.org/10.1023/A:1009815306478
- Buchgeher et al. (2013) G. Buchgeher, C. Ernstbrunner, R. Ramler, and M. Lusser. 2013. Towards Tool-Support for Test Case Selection in Manual Regression Testing. In 2013 IEEE Sixth International Conference on Software Testing, Verification and Validation Workshops. 74–79. https://doi.org/10.1109/ICSTW.2013.16
- Cadar et al. (2008) Cristian Cadar, Daniel Dunbar, and Dawson Engler. 2008. KLEE: Unassisted and Automatic Generation of High-Coverage Tests for Complex Systems Programs. In Operating System Design and Implementation. 209–224.
- Carlson et al. (2011) R. Carlson, H. Do, and A. Denton. 2011. A clustering approach to improving test case prioritization: An industrial case study. In 2011 27th IEEE International Conference on Software Maintenance (ICSM). 382–391. https://doi.org/10.1109/ICSM.2011.6080805
- Chen et al. (2019) Yuanliang Chen, Yu Jiang, Fuchen Ma, Jie Liang, Mingzhe Wang, Chijin Zhou, Xun Jiao, and Zhuo Su. 2019. EnFuzz: Ensemble fuzzing with seed synchronization among diverse fuzzers. In 28th USENIX Security Symposium (USENIX Security 19). 1967–1983.
- Chilakamarri and Elbaum (2004) Kalyan-Ram Chilakamarri and Sebastian Elbaum. 2004. Reducing coverage collection overhead with disposable instrumentation. In Software Reliability Engineering, 2004. ISSRE 2004. 15th International Symposium on. IEEE, 233–244.
- CI ([n.d.]) Travis CI. [n.d.]. Customizing the Build: Build Timeouts. https://docs.travis-ci.com/user/customizing-the-build/#Build-Timeouts.
- Claessen and Hughes (2000) Koen Claessen and John Hughes. 2000. QuickCheck: a lightweight tool for random testing of Haskell programs. In ICFP. 268–279.
- Dolado (2000) J. J. Dolado. 2000. A validation of the component-based method for software size estimation. IEEE Transactions on Software Engineering 26, 10 (Oct 2000), 1006–1021. https://doi.org/10.1109/32.879821
- Dwyer et al. (2006) Matthew B. Dwyer, Suzette Person, and Sebastian Elbaum. 2006. Controlling factors in evaluating path-sensitive error detection techniques. In Foundations of Software Engineering. 92–104.
- e Abreu and Carapuça (1994) Fernando Brito e Abreu and Rogério Carapuça. 1994. Object-Oriented Software Engineering: Measuring and Controlling the Development Process. In Proc. Int’l Conf. Software Quality (QSIC).
- e Abreu and Melo (1996) F. Brito e Abreu and W. Melo. 1996. Evaluating the impact of object-oriented design on software quality. In Proceedings of the 3rd International Software Metrics Symposium. 90–99. https://doi.org/10.1109/METRIC.1996.492446
- Ekelund and Engström (2015) E. D. Ekelund and E. Engström. 2015. Efficient regression testing based on test history: An industrial evaluation. In 2015 IEEE International Conference on Software Maintenance and Evolution (ICSME). 449–457. https://doi.org/10.1109/ICSM.2015.7332496
- El Emam et al. (2001) Kalhed El Emam, Saïda Benlarbi, Nishith Goel, and Shesh N. Rai. 2001. The Confounding Effect of Class Size on the Validity of Object-Oriented Metrics. IEEE Trans. Softw. Eng. 27, 7 (July 2001), 630–650. https://doi.org/10.1109/32.935855
- Engström et al. (2010) E. Engström, P. Runeson, and G. Wikstrand. 2010. An Empirical Evaluation of Regression Testing Based on Fix-Cache Recommendations. In 2010 Third International Conference on Software Testing, Verification and Validation. 75–78. https://doi.org/10.1109/ICST.2010.40
- Fatiregun et al. (2004) D. Fatiregun, M. Harman, and R. M. Hierons. 2004. Evolving transformation sequences using genetic algorithms. In Source Code Analysis and Manipulation, Fourth IEEE International Workshop on. 65–74. https://doi.org/10.1109/SCAM.2004.11
- Fenton and Ohlsson (2000) N. E. Fenton and N. Ohlsson. 2000. Quantitative analysis of faults and failures in a complex software system. IEEE Transactions on Software Engineering 26, 8 (Aug 2000), 797–814. https://doi.org/10.1109/32.879815
- Fowler (2010) M. Fowler. 2010. Domain-Specific Languages. Addison-Wesley Professional.
- Fraser and Arcuri (2011) Gordon Fraser and Andrea Arcuri. 2011. EvoSuite: automatic test suite generation for object-oriented software. In Proceedings of the 19th ACM SIGSOFT Symposium and the 13th European Conference on Foundations of Software Engineering (ESEC/FSE ’11). ACM, 416–419.
- Gay (2018) Gregory Gay. 2018. To Call, or Not to Call: Contrasting Direct and Indirect Branch Coverage in Test Generation. In Proceedings of the 11th International Workshop on Search-Based Software Testing (Gothenburg, Sweden) (SBST ’18). ACM, New York, NY, USA, 43–50. https://doi.org/10.1145/3194718.3194719
- Gligoric et al. (2013) Milos Gligoric, Alex Groce, Chaoqiang Zhang, Rohan Sharma, Amin Alipour, and Darko Marinov. 2013. Comparing Non-Adequate Test Suites using Coverage Criteria. In International Symposium on Software Testing and Analysis. 302–313.
- Gligoric et al. (2014) Milos Gligoric, Stas Negara, Owolabi Legunsen, and Darko Marinov. 2014. An Empirical Evaluation and Comparison of Manual and Automated Test Selection. In Proceedings of the 29th ACM/IEEE International Conference on Automated Software Engineering (Vasteras, Sweden) (ASE ’14). Association for Computing Machinery, New York, NY, USA, 361–372. https://doi.org/10.1145/2642937.2643019
- Godefroid et al. (2005) Patrice Godefroid, Nils Klarlund, and Koushik Sen. 2005. DART: directed automated random testing. In Programming Language Design and Implementation. 213–223.
- Goodman (2016) Peter Goodman. 2016. A fuzzer and a symbolic executor walk into a cloud. https://blog.trailofbits.com/2016/08/02/engineering-solutions-to-hard-program-analysis-problems/.
- Gopinath et al. (2014a) Rahul Gopinath, Carlos Jensen, and Alex Groce. 2014a. Code Coverage for Suite Evaluation by Developers. In Proceedings of the 36th International Conference on Software Engineering (Hyderabad, India) (ICSE 2014). ACM, New York, NY, USA, 72–82. https://doi.org/10.1145/2568225.2568278
- Gopinath et al. (2014b) Rahul Gopinath, Carlos Jensen, and Alex Groce. 2014b. Mutations: How Close Are They to Real Faults?. In International Symposium on Software Reliability Engineering. 189–200.
- Graves et al. (2000) Todd L. Graves, Alan F. Karr, J. S. Marron, and Harvey Siy. 2000. Predicting Fault Incidence Using Software Change History. IEEE Transactions on Software Engineering 26, 7 (July 2000), 653–661. https://doi.org/10.1109/32.859533
- Groce and Erwig (2012) Alex Groce and Martin Erwig. 2012. Finding Common Ground: Choose, Assert, and Assume. In International Workshop on Dynamic Analysis. 12–17.
- Groce et al. (2012a) Alex Groce, Alan Fern, Martin Erwig, Jervis Pinto, Tim Bauer, and Amin Alipour. 2012a. Learning-Based Test Programming for Programmers. In International Symposium on Leveraging Applications of Formal Methods, Verification and Validation. 752–786.
- Groce et al. (2012b) Alex Groce, Alan Fern, Jervis Pinto, Tim Bauer, Amin Alipour, Martin Erwig, and Camden Lopez. 2012b. Lightweight Automated Testing with Adaptation-Based Programming. In IEEE International Symposium on Software Reliability Engineering. 161–170.
- Groce et al. (2007) Alex Groce, Gerard Holzmann, and Rajeev Joshi. 2007. Randomized Differential Testing as a Prelude to Formal Verification. In International Conference on Software Engineering. 621–631.
- Groce and Pinto (2015) Alex Groce and Jervis Pinto. 2015. A Little Language for Testing. In NASA Formal Methods Symposium. 204–218.
- Groce et al. (2015) Alex Groce, Jervis Pinto, Pooria Azimi, Pranjal Mittal, Josie Holmes, and Kevin Kellar. 2015. TSTL: the template scripting testing language. https://github.com/agroce/tstl.
- Groce and Visser (2004) Alex Groce and Willem Visser. 2004. Heuristics for model checking Java programs. Software Tools for Technology Transfer 6(4) (2004), 260–276.
- Groce et al. (2012c) Alex Groce, Chaoqiang Zhang, Eric Eide, Yang Chen, and John Regehr. 2012c. Swarm Testing. In International Symposium on Software Testing and Analysis. 78–88.
- Gyimothy et al. (2005) T. Gyimothy, R. Ferenc, and I. Siket. 2005. Empirical validation of object-oriented metrics on open source software for fault prediction. IEEE Transactions on Software Engineering 31, 10 (Oct 2005), 897–910. https://doi.org/10.1109/TSE.2005.112
- Hamlet (1994) Richard Hamlet. 1994. Random testing. In Encyclopedia of Software Engineering. Wiley, 970–978.
- Harman and O’Hearn (2018) Mark Harman and Peter O’Hearn. 2018. From Start-Ups To Scale-Ups: Open Problems, Challenges And Myths In Static And Dynamic Program Analysis For Testing And Verification. In IEEE International Working Conference on Source Code Analysis and Manipulation.
- Herzig et al. (2015) Kim Herzig, Michaela Greiler, Jacek Czerwonka, and Brendan Murphy. 2015. The Art of Testing Less without Sacrificing Quality. In Proceedings of the 37th International Conference on Software Engineering - Volume 1 (Florence, Italy) (ICSE ’15). IEEE Press, 483–493.
- Hirzel and Klaeren (2016) Matthias Hirzel and Herbert Klaeren. 2016. Graph-Walk-based Selective Regression Testing of Web Applications Created with Google Web Toolkit. In Gemeinsamer Tagungsband der Workshops der Tagung Software Engineering 2016 (SE 2016), Wien, 23.-26. Februar 2016. 55–69. http://ceur-ws.org/Vol-1559/paper05.pdf
- Holmes et al. (2017) Josie Holmes, Alex Groce, Jervis Pinto, Pranjal Mittal, Pooria Azimi, Kevin Kellar, and James O’Brien. 2017. TSTL: the Template Scripting Testing Language. International Journal on Software Tools for Technology Transfer (2017). Accepted for publication.
- Holzmann et al. (2008a) Gerard Holzmann, Rajeev Joshi, and Alex Groce. 2008a. Swarm Verification. In Automated Software Engineering. 1–6.
- Holzmann et al. (2008b) Gerard Holzmann, Rajeev Joshi, and Alex Groce. 2008b. Tackling Large Verification Problems with the Swarm Tool. In SPIN Workshop on Model Checking of Software. 134–143.
- Holzmann et al. (2011) Gerard Holzmann, Rajeev Joshi, and Alex Groce. 2011. Swarm Verification Techniques. IEEE Transactions on Software Engineering 37, 6 (2011), 845–857.
- Inozemtseva ([n.d.]) Laura Inozemtseva. [n.d.]. Supplemental results for ”Coverage is not Correlated…”. http://inozemtseva.com/research/2014/icse/coverage. Viewed May 2017; site appears to no longer be available, though referred to in text of the paper.
- Inozemtseva and Holmes (2014) Laura Inozemtseva and Reid Holmes. 2014. Coverage is Not Strongly Correlated with Test Suite Effectiveness. In Proceedings of the 36th International Conference on Software Engineering (Hyderabad, India) (ICSE 2014). ACM, New York, NY, USA, 435–445. https://doi.org/10.1145/2568225.2568271
- Just et al. (2014) René Just, Darioush Jalali, and Michael D Ernst. 2014. Defects4J: A database of existing faults to enable controlled testing studies for Java programs. In Proceedings of the 2014 International Symposium on Software Testing and Analysis. ACM, 437–440.
- Kaneoka (2017) Kazuki Kaneoka. 2017. Feedback-Based Random Test Generator for TSTL. Technical Report MS thesis. Oregon State University.
- Klees et al. (2018) George Klees, Andrew Ruef, Benji Cooper, Shiyi Wei, and Michael Hicks. 2018. Evaluating Fuzz Testing. In Proceedings of the 2018 ACM SIGSAC Conference on Computer and Communications Security (Toronto, Canada) (CCS ’18). ACM, New York, NY, USA, 2123–2138. https://doi.org/10.1145/3243734.3243804
- Koru et al. (2009) A. G. Koru, D. Zhang, K. El Emam, and H. Liu. 2009. An Investigation into the Functional Form of the Size-Defect Relationship for Software Modules. IEEE Transactions on Software Engineering 35, 2 (March 2009), 293–304. https://doi.org/10.1109/TSE.2008.90
- Landman et al. (2016) Davy Landman, Alexander Serebrenik, Eric Bouwers, and Jurgen J. Vinju. 2016. Empirical analysis of the relationship between CC and SLOC in a large corpus of Java methods and C functions. Journal of Software: Evolution and Process 28, 7 (2016), 589–618. https://doi.org/10.1002/smr.1760
- MacIver (2013) David R. MacIver. 2013. Hypothesis: Test faster, fix more. http://hypothesis.works/.
- MacIver (2016) David R. MacIver. 2016. Rule Based Stateful Testing. http://hypothesis.works/articles/rule-based-stateful-testing/.
- MacIver (2017) David R. MacIver. 2017. Python Coverage could be fast. https://www.drmaciver.com/2017/09/python-coverage-could-be-fast/.
- MacIver (ober) David R. MacIver. October. Coverage adds a lot of overhead when the base test is fast. https://github.com/HypothesisWorks/hypothesis/issues/914.
- MacIver and PyPI ([n.d.]) David R. MacIver and PyPI. [n.d.]. Usage stats for hypothesis on PyPI. https://libraries.io/pypi/hypothesis/usage.
- Marcus et al. (2008) Andrian Marcus, Denys Poshyvanyk, and Rudolf Ferenc. 2008. Using the Conceptual Cohesion of Classes for Fault Prediction in Object-Oriented Systems. IEEE Trans. Softw. Eng. 34, 2 (March 2008), 287–300. https://doi.org/10.1109/TSE.2007.70768
- Marijan (2015) D. Marijan. 2015. Multi-perspective Regression Test Prioritization for Time-Constrained Environments. In 2015 IEEE International Conference on Software Quality, Reliability and Security. 157–162. https://doi.org/10.1109/QRS.2015.31
- Marijan et al. (2013) D. Marijan, A. Gotlieb, and S. Sen. 2013. Test Case Prioritization for Continuous Regression Testing: An Industrial Case Study. In 2013 IEEE International Conference on Software Maintenance. 540–543. https://doi.org/10.1109/ICSM.2013.91
- Marinescu and Cadar (2012) Paul Dan Marinescu and Cristian Cadar. 2012. make test-zesti: a symbolic execution solution for improving regression testing. In International Conference on Software Engineering. 716–726.
- McCabe (1976) T. J. McCabe. 1976. A Complexity Measure. IEEE Trans. Softw. Eng. 2, 4 (July 1976), 308–320. https://doi.org/10.1109/TSE.1976.233837
- McKeeman (1998) William McKeeman. 1998. Differential testing for software. Digital Technical Journal of Digital Equipment Corporation 10(1) (1998), 100–107.
- McMinn (2004) Phil McMinn. 2004. Search-based Software Test Data Generation: A Survey. Software Testing, Verification and Reliability 14 (2004), 105–156.
- Menzies et al. (2002) T. Menzies, J. S. Di Stefano, M. Chapman, and K. McGill. 2002. Metrics that matter. In 27th Annual NASA Goddard/IEEE Software Engineering Workshop, 2002. Proceedings. 51–57. https://doi.org/10.1109/SEW.2002.1199449
- Nilsson et al. (2016) Rickard Nilsson, Shane Auckland, Mark Sumner, and Sanjiv Sahayam. 2016. ScalaCheck User Guide. https://github.com/rickynils/scalacheck/blob/master/doc/UserGuide.md.
- Offutt and Abdurazik (2000) J. Offutt and A. Abdurazik. 2000. In Mutation 2000: Mutation Testing in the Twentieth and the Twenty First Centuries.
- Ohmann et al. (2016) Peter Ohmann, David Bingham Brown, Naveen Neelakandan, Jeff Linderoth, and Ben Liblit. 2016. Optimizing customized program coverage. In Automated Software Engineering (ASE), 2016 31st IEEE/ACM International Conference on. IEEE, 27–38.
- Olague et al. (2007) Hector M. Olague, Letha H. Etzkorn, Sampson Gholston, and Stephen Quattlebaum. 2007. Empirical Validation of Three Software Metrics Suites to Predict Fault-Proneness of Object-Oriented Classes Developed Using Highly Iterative or Agile Software Development Processes. IEEE Transactions on Software Engineering 33, 6 (June 2007), 402–419. https://doi.org/10.1109/TSE.2007.1015
- Ostrand et al. (2005) T. J. Ostrand, E. J. Weyuker, and R. M. Bell. 2005. Predicting the location and number of faults in large software systems. IEEE Transactions on Software Engineering 31, 4 (April 2005), 340–355. https://doi.org/10.1109/TSE.2005.49
- Pacheco et al. (2007) Carlos Pacheco, Shuvendu K. Lahiri, Michael D. Ernst, and Thomas Ball. 2007. Feedback-directed Random Test Generation. In International Conference on Software Engineering. 75–84.
- Pai and Dugan (2007) G. J. Pai and J. Bechta Dugan. 2007. Empirical Analysis of Software Fault Content and Fault Proneness Using Bayesian Methods. IEEE Transactions on Software Engineering 33, 10 (Oct 2007), 675–686. https://doi.org/10.1109/TSE.2007.70722
- Papadakis and Sagonas (2011) Manolis Papadakis and Konstantinos Sagonas. 2011. A PropEr Integration of Types and Function Specifications with Property-Based Testing. In Proceedings of the 2011 ACM SIGPLAN Erlang Workshop. ACM Press, New York, NY, 39–50.
- Person et al. (2011) Suzette Person, Guowei Yang, Neha Rungta, and Sarfraz Khurshid. 2011. Directed Incremental Symbolic Execution. In Proceedings of the 32Nd ACM SIGPLAN Conference on Programming Language Design and Implementation (PLDI ’11). 504–515.
- Radjenović et al. (2013) Danijel Radjenović, Marjan Heričko, Richard Torkar, and Aleš Živkovič. 2013. Software Fault Prediction Metrics. Information and Software Technologies 55, 8 (Aug. 2013), 1397–1418. https://doi.org/10.1016/j.infsof.2013.02.009
- Rawat et al. (2017) Sanjay Rawat, Vivek Jain, Ashish Kumar, Lucian Cojocar, Cristiano Giuffrida, and Herbert Bos. 2017. VUzzer: Application-aware Evolutionary Fuzzing.. In Network and Distributed Security Symposium (NDSS).
- Ray et al. (2016) Baishakhi Ray, Vincent Hellendoorn, Saheel Godhane, Zhaopeng Tu, Alberto Bacchelli, and Premkumar Devanbu. 2016. On the ”Naturalness” of Buggy Code. In Proceedings of the 38th International Conference on Software Engineering (Austin, Texas) (ICSE ’16). ACM, New York, NY, USA, 428–439. https://doi.org/10.1145/2884781.2884848
- Saha et al. (2015) Ripon K Saha, Lingming Zhang, Sarfraz Khurshid, and Dewayne E Perry. 2015. An information retrieval approach for regression test prioritization based on program changes. In 2015 IEEE/ACM 37th IEEE International Conference on Software Engineering, Vol. 1. IEEE, 268–279.
- Scientific Toolworks, Inc. (2017) Scientific Toolworks, Inc. 2017. Understand™ Static Code Analysis Tool. https://scitools.com/.
- Seonghoon (2015) Kang Seonghoon. 2015. Tutorial: How to collect test coverages for Rust project. https://users.rust-lang.org/t/tutorial-how-to-collect-test-coverages-for-rust-project/650.
- Shamshiri et al. (2015a) Sina Shamshiri, Rene Just, Jose Miguel Rojas, Gordon Fraser, Phil McMinn, and Andrea Arcuri. 2015a. Do automatically generated unit tests find real faults? an empirical study of effectiveness and challenges (t). In Automated Software Engineering (ASE), 2015 30th IEEE/ACM International Conference on. IEEE, 201–211.
- Shamshiri et al. (2015b) Sina Shamshiri, José Miguel Rojas, Gordon Fraser, and Phil McMinn. 2015b. Random or Genetic Algorithm Search for Object-Oriented Test Suite Generation?. In Proceedings of the 2015 Annual Conference on Genetic and Evolutionary Computation (Madrid, Spain) (GECCO ’15). Association for Computing Machinery, New York, NY, USA, 1367–1374. https://doi.org/10.1145/2739480.2754696
- Shamshiri et al. (2018) Sina Shamshiri, José Miguel Rojas, Luca Gazzola, Gordon Fraser, Phil McMinn, Leonardo Mariani, and Andrea Arcuri. 2018. Random or evolutionary search for object-oriented test suite generation? Software Testing, Verification and Reliability 28, 4 (2018), e1660.
- Skoglund and Runeson (2005) M. Skoglund and P. Runeson. 2005. A case study of the class firewall regression test selection technique on a large scale distributed software system. In 2005 International Symposium on Empirical Software Engineering, 2005. 10 pp.–. https://doi.org/10.1109/ISESE.2005.1541816
- Srivastava and Thiagarajan (2002) Amitabh Srivastava and Jay Thiagarajan. 2002. Effectively Prioritizing Tests in Development Environment. SIGSOFT Softw. Eng. Notes 27, 4 (July 2002), 97–106. https://doi.org/10.1145/566171.566187
- Staats et al. (2011) Matt Staats, Michael W. Whalen, and Mats P.E. Heimdahl. 2011. Programs, tests, and oracles: The foundations of testing revisited. In ICSE 2011 - 33rd International Conference on Software Engineering, Proceedings of the Conference (Proceedings - International Conference on Software Engineering). 391–400. https://doi.org/10.1145/1985793.1985847 33rd International Conference on Software Engineering, ICSE 2011 ; Conference date: 21-05-2011 Through 28-05-2011.
- Syer et al. (2015) M. D. Syer, M. Nagappan, B. Adams, and A. E. Hassan. 2015. Replicating and Re-Evaluating the Theory of Relative Defect-Proneness. IEEE Transactions on Software Engineering 41, 2 (Feb 2015), 176–197. https://doi.org/10.1109/TSE.2014.2361131
- Tahvili et al. (2016) Sahar Tahvili, Wasif Afzal, Mehrdad Saadatmand, Markus Bohlin, Daniel Sundmark, and Stig Larsson. 2016. Towards earlier fault detection by value-driven prioritization of test cases using fuzzy TOPSIS. In Information Technology: New Generations. Springer, 745–759.
- Tikir and Hollingsworth (2002) Mustafa M. Tikir and Jeffrey K. Hollingsworth. 2002. Efficient Instrumentation for Code Coverage Testing. In Proceedings of the 2002 ACM SIGSOFT International Symposium on Software Testing and Analysis (Roma, Italy) (ISSTA ’02). ACM, New York, NY, USA, 86–96. https://doi.org/10.1145/566172.566186
- Tomassi et al. (2019) David A. Tomassi, Naji Dmeiri, Yichen Wang, Antara Bhowmick, Yen-Chuan Liu, Premkumar T. Devanbu, Bogdan Vasilescu, and Cindy Rubio-González. 2019. BugSwarm: mining and continuously growing a dataset of reproducible failures and fixes. In ICSE. IEEE / ACM, 339–349.
- user1689822 (2012) user1689822. 2012. python AVL tree insertion. http://stackoverflow.com/questions/12537986/python-avl-tree-insertion.
- White et al. (2008) Lee White, Khaled Jaber, Brian Robinson, and Václav Rajlich. 2008. Extended Firewall for Regression Testing: An Experience Report. J. Softw. Maint. Evol. 20, 6 (Nov. 2008), 419–433.
- White and Robinson (2004) L. White and B. Robinson. 2004. Industrial real-time regression testing and analysis using firewalls. In 20th IEEE International Conference on Software Maintenance, 2004. Proceedings. 18–27. https://doi.org/10.1109/ICSM.2004.1357786
- Wikstrand et al. (2009) G. Wikstrand, R. Feldt, J. K. Gorantla, W. Zhe, and C. White. 2009. Dynamic Regression Test Selection Based on a File Cache An Industrial Evaluation. In 2009 International Conference on Software Testing Verification and Validation. 299–302. https://doi.org/10.1109/ICST.2009.42
- Yang et al. (2007) Qian Yang, J Jenny Li, and David M Weiss. 2007. A survey of coverage-based testing tools. Comput. J. 52, 5 (2007), 589–597.
- Yatoh et al. (2015) Kohsuke Yatoh, Kazunori Sakamoto, Fuyuki Ishikawa, and Shinichi Honiden. 2015. Feedback-controlled Random Test Generation. In Proceedings of the 2015 International Symposium on Software Testing and Analysis (Baltimore, MD, USA) (ISSTA 2015). ACM, New York, NY, USA, 316–326. https://doi.org/10.1145/2771783.2771805
- Zalewski (2014) Michal Zalewski. 2014. american fuzzy lop (2.35b). http://lcamtuf.coredump.cx/afl/.
- Zhang et al. (2014) Chaoqiang Zhang, Alex Groce, and Mohammad Amin Alipour. 2014. Using Test Case Reduction and Prioritization to Improve Symbolic Execution. In International Symposium on Software Testing and Analysis. 160–170.
- Zhang (2009) H. Zhang. 2009. An investigation of the relationships between lines of code and defects. In 2009 IEEE International Conference on Software Maintenance. 274–283. https://doi.org/10.1109/ICSM.2009.5306304
- Zheng et al. (2006) Jiang Zheng, Brian Robinson, Laurie Williams, and Karen Smiley. 2006. Applying Regression Test Selection for COTS-Based Applications. In Proceedings of the 28th International Conference on Software Engineering (Shanghai, China) (ICSE ’06). Association for Computing Machinery, New York, NY, USA, 512–522. https://doi.org/10.1145/1134285.1134357
- Zheng et al. (2007) Jiang Zheng, Laurie Williams, and Brian Robinson. 2007. Pallino: Automation to Support Regression Test Selection for Cots-Based Applications. In Proceedings of the Twenty-Second IEEE/ACM International Conference on Automated Software Engineering (Atlanta, Georgia, USA) (ASE ’07). Association for Computing Machinery, New York, NY, USA, 224–233. https://doi.org/10.1145/1321631.1321665
- Zhou and Leung (2006) Yuming Zhou and Hareton Leung. 2006. Empirical Analysis of Object-Oriented Design Metrics for Predicting High and Low Severity Faults. IEEE Transactions on Software Engineering 32, 10 (Oct 2006), 771–789. https://doi.org/10.1109/TSE.2006.102
- Zimmermann and Nagappan (2008) T. Zimmermann and N. Nagappan. 2008. Predicting defects using network analysis on dependency graphs. In 2008 ACM/IEEE 30th International Conference on Software Engineering. 531–540. https://doi.org/10.1145/1368088.1368161