University of Vienna, Faculty of Physics, 1090 Vienna, Austria \altaffiliationDepartment of Chemistry, Brown University, RI, USA
The C(3P) + O2() CO2 CO()+ O(1D)/O(3P) Reaction: Thermal and Vibrational Relaxation Rates from 15 K to 20000 K
Abstract
Thermal rates for the C(3P) + O2() CO()+ O(1D)/O(3P) reaction are investigated over a wide temperature range based on quasi classical trajectory (QCT) simulations on 3-dimensional, reactive potential energy surfaces (PESs) for the 1A′, A′, 1A′′, 3A′ and 3A′′ states. The forward rate matches measurements at 15 K to 295 K whereas the equilibrium constant determined from the forward and reverse rates are consistent with those derived from statistical mechanics at high temperature. Vibrational relaxation, O+CO() O+CO, is found to involve both, non-reactive and reactive processes. The contact time required for vibrational relaxation to take place is fs for non-reacting and fs for reacting (oxygen atom exchange) trajectories and the two processes are shown to probe different parts of the global potential energy surface. In agreement with experiments, low collision energy reactions for the C(3P) + O2(, ) CO()+ O(1D) lead to CO(, ) with an onset at eV, dominated by the 1A′ surface with contributions from the 3A′ surface. Finally, the barrier for the COA() + OB(3P) COB() + OA(3P) atom exchange reaction on the 3A′ PES yields a barrier of kcal/mol (0.300 eV), consistent with an experimentally reported value of 6.9 kcal/mol (0.299 eV).
1 Introduction
Reactions involving carbon and oxygen atoms play important roles in
combustion, hypersonic flow, and planetary
atmospheres.1 Among those, the thermal rates for the
C(3P)+O2(), O(3P)+CO(), and
O(1D)+CO() reactions going through various electronic
states of CO2 (see Figure 1) are particularly
relevant. Similarly, the vibrational deactivation of CO()
through collisions with O(3P) is a relevant pathway for relaxation
and redistribution of energy in nonequilibrium
flow.2
Several independent studies have determined thermal rates for the
forward C(3P) + O2()
reaction.3, 4, 5 Using the CRESU
(Cinétique de Réaction en Ecoulement Supersonique Uniforme)
technique5 the thermal rate from experiments between
15 and 295 K was measured. At 298 K the rate was cm3 molecule-1 s-1 which is within a factor of two to three of other,
previous
experiments.3, 6, 7, 4 In
all three laval nozzle experiments it was found that the rate
increases with decreasing temperature between 15 and 295
K.5, 8, 9 The product
detection techniques included vacuum ultraviolet laser-induced
fluorescence5, 9, and
chemiluminescence8.
Shock tube experiments of the C+O2 reactions were also carried out
at higher temperatures (from 1500 to 4200 K) and reported a rate of
cm3
mol-1 s-1 (corresponding to cm3 molecule-1 s-1 ) with an overall uncertainty of %
and a standard deviation for the activation energy of % and
%, respectively.10 Yet earlier emission spectra
in a discharge flow found that the C(3P) +
O2() reaction generates CO in high
vibrationally excited states (up to ) and that the transition
state has the configuration COO rather than OCO.11
Such a COO intermediate was also proposed from the interpretation of
the C+O2 reaction12 and has been described in
multiconfiguration SCF calculations.13 Also, no
evidence was found that the C+O2 reaction passes through the region
where the quenching of O(1D) to O(3P) by CO occurs as a
non-adiabatic process, as had been proposed
earlier.14, 15
For the reverse reactions, O(3P)+CO(), and
O(1D)+CO() leading to C(3P) +
O2(), the onset for the rates to form
C+O2 is expected to occur at considerably higher temperature than
that for due to the large energy difference of eV
between the O+CO and the C+O2 asymptotes, see Figure
1. There are, however, computational investigations of
the oxidation of CO to form CO2 following the O(3P) + CO() CO2() route, usually
involving a third particle M.16 The rates for formation
of CO2 along the 3A′ and 3A′′ pathways starting from
O(3P)+CO() ranged from to cm3
molecule-1 s-1, depending on temperature, compared with
cm3 molecule-1 s-1 from earlier
work.17 These were non-Born-Oppenheimer dynamics
simulations of the O(3P)+CO() CO2() reaction involving the 1A′, 3A′, and
3A′′ potential energy surfaces (PESs).16 The
spin-forbidden fraction in this study was, however, found to be small
( %). Experimentally, the forward reaction has not been
probed so far, to the best of our knowledge. Direct experiments
involving [O(3P), O(1D)] and CO() concern the
vibrational deactivation of CO upon collision with atomic
oxygen.18, 19, 2, 20, 21
Finally, the rate for collisional spin relaxation for the O(1D) to
O(3P) spin relaxation by CO() at temperatures between
113 and 333 K was determined.22 The rates were found
to vary monotonically from about to cm3 molecule-1 s-1 over the temperature
range. Earlier modeling based on collisions with CO and other small
molecules obtained a rate of cm3 molecule-1
s-1.23
Computationally, the ground and excited state PESs for CO2 have
been studied in some
detail.24, 13, 25, 26, 27, 28, 29
Early configuration interaction calculations
established24 that there must be four states (two
singlet and two triplet) of CO2 below the
CO()O(3P) asymptote which is also what is found in
the present work (Figure 1). CO2 does not show strong
absorptions below 11 eV24 which makes direct
comparison difficult also, because often vertical and not adiabatic
transition energies were measured. A low-lying adiabatic electronic
transition to a triplet state was reported at 39412 cm-1 (4.89
eV) above the ground state,30 in qualitative agreement
with the position of the 3A′ state, 4.62 eV above the ground
state, see Figure 1.
An early classical MD study31 of the forward reaction
using an analytical potential energy surface found a rate of cm3 molecule-1 s-1. In dynamics
studies18, 32, 16, 28, 33
the reference energies from electronic structure calculations were
either represented as parametrized
fits,18, 32, 33 cubic
splines,28 or interpolated moving least
squares.16 Reference calculations were carried out at
the CASSCF-MP2/631G+(d),18 and MRCI+Q/aug-cc-pVQZ
levels of theory.16, 28, 33 The
dynamics simulations either concerned the O-induced collisional
dissociation of CO,33 CO vibrational
relaxation,18 the O-exchange dynamics in reactive
O+CO collisions, non-Born-Oppenheimer effects in CO2 formation from
O+CO collisions,16 or the final state distributions
from the O+CO reactive scattering32 but not the
entire C(3P) + O2()
CO2 CO()+ O(1D)/O(3P)
reaction involving several electronic states.
A schematic of the states derived from the present calculations and
considered in the present work is provided in Figure
1. The left hand side is the C(3P) +
O2() (entrance) channel which connects to all
bound CO2 states in the middle. This asymptote is 11.22 eV above
the global minimum which is the linear CO2(1A′) structure. The
right hand side of Figure 1 shows the two product
channels considered: the lower CO() + O(3P)
state, 5.30 eV above the minimum energy of the CO2(1A′) ground
state, and the CO() + O(1D) asymptote another
1.97 eV higher in energy. The final state involving O(3P)
connects with the triplet states (3A′ and 3A′′) of CO2
whereas that leading to O(1D) correlates with the 1A′,
1A′′, and A′ states, see Figure 1.
Except for the shock tube experiments35 on C+O2
O+CO (1500-4200 K) and the computations16
for CO2 formation from O+CO (between 1000 K and 5000 K) there is
little information on the high-temperature dynamics of either, the
C+O2 or the O+CO reactive processes. The present work extends this
by performing QCT simulations on the 5 lowest states of CO2,
represented as a reproducing kernel Hilbert space
(RKHS),36, 37 and focusing on the forward and
reverse reactions and vibrational relaxation. First, the methods are
presented and the potential energy surfaces for all 5 states are
discussed. Then the thermal rates are determined along the singlet
pathway. Next, vibrational relaxation for the O+CO collision is
considered for CO and CO and the distributions for
relaxing/nonrelaxing reactive/nonreactive trajectories are mapped onto
the PES. Finally, conclusions are drawn.
2 Computational Methods
This section presents the generation and representation of the potential energy surfaces and the methodologies for the QCT simulations and their analysis.
2.1 Electronic Structure Calculations
All PESs are computed at the multi reference CI singles and doubles
(MRCISD) level of theory38, 39 including the
Davidson quadruples correction40 (MRCISD+Q) together
with the aug-cc-pVTZ basis set41 using the MOLPRO
2019.1 software.42 In order to consistently describe
all relevant states and avoid numerical instabilities due to
closely-lying states of the same symmetry, state-averaged
CASSCF43, 44, 45, 46 calculations
including the two lowest states of each symmetry (two spin symmetries
and two spatial symmetries) were carried out. Hence, in total eight
states are included in the CASSCF reference wave function. MRCI+Q
calculations for both asymptotic channels followed for the 5 lowest
CO2 states, namely 1A′, 3A′, 3A′′, 1A′′, and
A′, see Figure 1.
The energies were computed on a grid defined by Jacobi coordinates
where is the separation of the diatomic, is the
distance between the atom and the center of mass of the diatomic and
is the angle between the two unit vectors and
. For channel I (C(3P) + O2()) the
grid included 28 points between 1.4 and 11 a0 and the
distance was covered by 20 points between 1.55 and 4.10 a0
whereas for channel II (O(3P/1D) + CO()) the
grid included 26 points between 1.8 and 11 a0, and the
distance was covered by 20 points between 1.55 and 4.00
a0. The angular grid for both channels contained 13 angles from a
Gauss-Legendre quadrature (169.796∘, 156.577∘,
143.281∘, 129.967∘, 116.647∘, 103.324∘,
90.100∘, 76.676∘, 63.353∘, 50.033∘,
36.719∘,23.423∘, 10.204∘).
The reference points are then represented using reproducing kernel Hilbert space (RKHS) techniques.36, 47, 37 The quality of the representation is further checked using energies from additional, off-grid geometries. The global, reactive 3D PES for an electronic state is constructed by summing the weighted individual PESs for each channel
| (1) |
using an exponential switching function with weights
| (2) |
Here, are switching function parameters for channels I
and II. These parameters were optimized by a least squares fit and
yielded values of (0.90, 1.00, 1.00) a0, (1.10, 1.05, 1.05) a0,
(0.9, 1.00, 1.00) a0, (0.85, 1.25, 1.25) a0 and (1.05, 1.00,
1.00) a0 for the 1A′, A′, 1A′′, 3A′, and
3A′′ PESs, respectively.
2.2 Quasi-Classical Trajectory Simulations
The QCT simulations used in the present work have been extensively
described in the literature50, 51, 52, 53.
Here, Hamilton’s equations of motion are solved using a fourth-order
Runge-Kutta method. The time step was fs which
guarantees conservation of the total energy and angular
momentum. Initial conditions for the trajectories are sampled using
standard Monte Carlo methods.50 The reactant and product
ro-vibrational states are determined following semiclassical
quantization with quantum bound state calculations for the two
diatomics. Since the ro-vibrational states of the product diatom are
continuous numbers, the states need to be assigned to integer values
for which a Gaussian binning (GB) scheme was used. For this, Gaussian
weights centered around the integer values with a full width at half
maximum of 0.1 were used.54, 55, 52 It is
noted that using histogram binning (HB) was found to give comparable
results for a similar system.53
The thermal rate for an electronic state () at a given temperature () is then obtained from
| (3) |
where is the electronic degeneracy factor of state ‘’,
is the reduced mass of the collision system, is the
Boltzmann constant, and, depending on the specific process considered,
is the number of reactive or vibrationally relaxed
trajectories. In the rate coefficient calculations, the initial
ro-vibrational states and relative translational energy (collision
energy ) of the reactants for the trajectories are sampled
from Boltzmann and Maxwell-Boltzmann distributions at given ,
respectively. The sampling methodology is discussed in detail in
Ref. 53
For the forward C(3P) + O2() CO()+ O(1D) and reverse reactions CO()+ O(1D) C(3P) + O2() with rates and , respectively, the degeneracy factor is
| (4) |
where the terms are the degeneracies of the states for which the energy differences between the ground and the excited states are –23.6 K and –62.4 K, respectively. For the reactions leading to O(3P) and going through triplet CO2 the degeneracies are . From and the equilibrium constant
| (5) |
is determined.
3 Results and Discussion
3.1 The Potential Energy Surfaces
Two-dimensional contour plots of the PESs are shown in Figure
2 and the positions and relative energies of the critical
points are summarized in Table 1. The left hand column in Figure
2 reports the PESs for the C+O2 asymptote whereas the
right hand column that for the CO+O channel, including the linear
ground state structure for CO2 (Figure 2b). All PESs
for the C+O2 asymptote are manifestly symmetric with respect to
with moderate anisotropies for the 1A′ and
3A′ states and increased anisotropies for all other
PESs. Conversely, all PESs for the O+CO channel are single-minima PESs
with their minima around , except for the 1A′ state
which has a minima for the OCO and OOC
structures, see also Figure S2. The energy of the OOC
state is 170.0 kcal/mol (7.37 eV) above the OCO minimum and the
barrier height for transition between the OOC and OCO minima is 8.5
kcal/mol (0.369 eV). In addition, the existence of the local OOC
minimum was confirmed at the MRCI+Q and CCSD(T) levels of theory and
was suggested earlier from experiments12, 11
and calculations.13
The quality of the RKHS representations is reported in Figure
S3. All root mean squared errors for both, on-grid and
off-grid points are below 1 kcal/mol (0.043 eV), except for the
1A′′ PES for which it is 1.04 kcal/mol (0.045 eV), all evaluated
on the mixed PESs, see Eqs. 1 and 2. For
the individual channels the performance of the RKHS is even
better. One dimensional cuts for an OCO angle of directly
comparing the reference points and the RKHS are shown in Figure
S4 for the lowest five states. Importantly, for off-grid
points which were not used to construct the PESs but to independently
validate the RKHS representations, the RMSEs are all below 1 kcal/mol
(0.043 eV), too.
| Present Work | Literature16, 18, 58, 57, 56 | |||||||
| PES | (COA) | (COB) | (OCO) | (eV) | (OCO) | (eV) | ||
| A′ MIN | 2.368 | 2.368 | 119.0 | 0.23 | – | – | – | – |
| 1A′′ MIN | 2.374 | 2.374 | 130.5 | –0.13 | – | – | – | – |
| 3A′′ MIN | 2.374 | 2.374 | 130.6 | –0.14 | 2.364 2.399 | 2.364 2.399 | 127.2 127.0 | –0.23 –0.22 |
| 3A′′ TS | 2.165 | 3.431 | 135.8 | 0.47 | 2.147 2.192 | 3.515 3.496 | 126.2 122.0 | 0.35 0.30 |
| 3A′ MIN | 2.356 | 2.356 | 126.3 | –0.69 | 2.381 2.349 | 2.381 2.349 | 118.0 118.0 | –0.94 –0.92 |
| 3A′ TS | 2.163 | 3.544 | 116.3 | 0.39 | 2.143 2.192 | 3.628 3.779 | 120.8 112.0 | 0.28 0.20 |
| 1A′ (Global-M) | 2.206 | 2.206 | 180.0 | –5.30 | 2.196 2.194 | 2.196 2.194 | 180.0 180.0 | –5.45 –5.64 |
| 1A′ (MIN1) | 2.527 | 2.527 | 70.6 | 0.74 | 2.522 | 2.522 | 72.9 | 0.61 |
| 1A′ (MIN2) | 2.192 | 4.798 | 0.0 | 1.88 | 2.220 | 4.716 | 0.0 | 1.72 |
| 1A′ (TS1) | 2.502 | 2.430 | 88.4 | 1.05 | 2.600 | 2.309 | 91.8 | 1.04 |
| 1A′ (TS2) | 2.164 | 4.279 | 68.9 | 2.15 | 2.203 | 4.537 | 41.0 | 2.22 |
For a better understanding of the shapes of the PESs, the
SA-CASSCF/aug-cc-pVTZ wave functions were analyzed in more detail for
the different states at a bent geometry (), see
Figure 3, for a0 and varying
. Figure 3A shows the valence molecular orbitals that
are relevant for the description of the eight states in the SA-CASSCF
calculations along the CO2 CO + O dissociation for
this bent geometry. Figure 3B depicts the dominant
configuration state functions along this dissociation path. All states
except for the energetically high lying (2)3A′ state resolve with
one dominant CASSCF configuration state function for the eight
computed states of SA-CASSCF and keep their characteristic
configuration along the entire dissociation path. Hence, no avoided
crossing of two states with the same symmetry is observed. Figure
3C shows the relative energetics (taking the C(3P) +
O(3P) + O(3P) ground state computed with the same level of
theory as the reference).
Upon bending, the doubly degenerate non-bonding [doubly
occupied in 1A′], as well as the antibonding
[unoccupied in 1A′] orbitals for collinear CO2 undergo a
splitting due to the lifted degeneracy. This results in a Jahn-Teller
splitting of the states 1A′′, 3A′′, 3A′, and
(2)1A′ of CO2 with their energy minimum at a bent geometry,
see right hand column in Figure 2. The splitting of the
degenerate HOMO and LUMO orbitals upon bending leads to three
frontier orbitals, similar in energy, and with overall occupation of
four electrons in all five energetically low-lying states (red frames
in Figure 3A). One of these three frontier orbitals has
character along the O-O bond (see Figure 3A) and
is somewhat higher in energy. States that involve double occupation of
this orbital lie higher in energy. Along the same line, states that
involve single occupation of one of the strongly bonding orbitals
below the frontier orbitals also lie energetically higher.
The 3A′ and 3A′′ states are lower in energy than the
1A′ state for certain bent geometries (see Figures 2
and 3C), as the triplet states gain from increased Pauli
exchange, as well as reduced Coulomb repulsion due to the single
occupations of orbitals. The corresponding open shell singlet states
[(2)1A′ and 1A′′] lie slightly higher in energy than their
triplet counterparts due to reduced Pauli exchange.
All CO2 singlet states connect to CO()+O(1D) upon
dissociation whereas the 3A′, 3A′′, and (2)3A′′ states
connect to the CO()+O(3P) state. On the other hand,
the (2)3A′ connects to the energetically high-lying excited
CO+O(3P) state. The low-lying triplet CO2 states have
no or rather low barriers towards their dissociation across the entire
PES (see Figure 2 and Figure 3C). Specifically,
the (2)3A′′ state connects to the ground state of CO + O and
crosses the singlet states upon dissociation. The crossing should
nevertheless only lead to negligible non-adiabatic transition rates,
as they are spin-forbidden. Since this state involves double
occupation of an orbital with character of the O-O bond, it
correlates with high lying excited states in the C + O2 channel and
is energetically well separated from the 3A′′ state whenever
there are short O-O distances. It is therefore sufficient to take its
occupation only into account via the degeneracy of O(3P) in the
quasi-classical treatment of the CO + O dissociation channel.
3.2 Forward and Reverse Rates and the Equilibrium Constants
The forward reaction C(3P) + O2()
(Figure 1) generates ground and excited state oxygen
(3P and 1D). The pathway to yield 3P involves the 3A′
and 3A′′ CO2 PESs whereas that to form 1D goes through the
1AA′, and 1A′′ states. For each of the reactions
on each PES a minimum of trajectories was run at each
temperature.
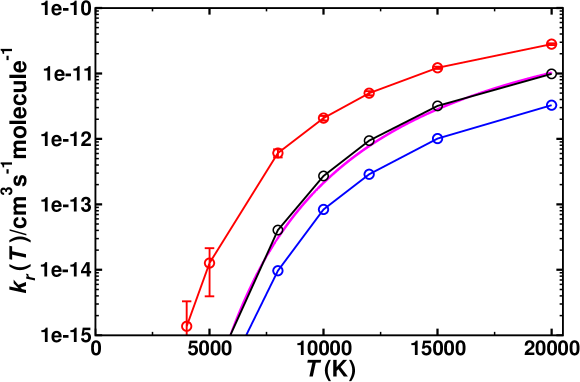
Figure 4 shows the total thermal rates for formation
of O(1D) and O(3P). The rates for formation of O(1D) start at
cm3 molecule-1 s-1 at 15 K, drop to cm3 molecule-1 s-1 for K and then monotonically
increase to cm3 molecule-1 s-1 for higher temperatures,
see red line for the total rate in Figure 4 with
explicit numerical values reported in Table S1
which also reports the number of reactive trajectories that contribute
to the rate. Experimentally, the total rate for this process was
determined over the temperature range from 1500 K to 4000
K. 35 Evaluating the reported expression cm3 molecule-1 s-1 at 1500 K
and 4000 K yields rates of cm3 molecule-1 s-1 and cm3 molecule-1 s-1 . This compares with
cm3 molecule-1 s-1 and cm3 molecule-1 s-1 , respectively, from the present simulations. A
high temperature measurement at 8000 K, associated with a substantial
uncertainty, yields
cm3 molecule-1 s-1 .59
The inset of Figure 4 reports the low-temperature
results. Starting at 15 K the rate first decreases, goes through a
minimum (at K) before it raises again for higher
temperatures. Such a behaviour is indicative of a submerged
barrier62 which, based on the rates for individual
surfaces, appears to be dominated by the 1A′ and 3A′ states,
as seen in Figure S5. Compared with experiments all
computed rates are within 2 % to 20 % at 50 K and 30 % to 40 % for
Ref. 9 and 4 % to 30 % at 300 K for
Ref.5 which can be considered good agreement. For the
process to yield O(3P) the individual rates from the contribution
of both triplet PESs (3A′ and 3A′′) as well as the total
weighted sum from the process to yield O(1D) and O(3P) are also
reported in Figure 4 (blue and black lines), with
numerical values given in Table S2.
For the reverse reaction, CO()+
O(1D)/O(3P) C(3P) +
O2(), similar simulations were carried out. As
this is an uphill process (Figure 1), this channel only
opens at higher temperature, see Figure 5. The
dynamics for CO()+ O(1D) C(3P) +
O2() involves the 1A′, A′, and
1A′′ states (for numerical values see Table
S3), whereas that for CO()+
O(3P) C(3P) + O2() is
related to the 3A′ and 3A′′ states, given in Table
S4. Compared with the forward rates, those for
the reverse reaction are typically 1 to 5 orders of magnitude
smaller. The reverse rates starting from O(1D) are larger by 1 to 2
orders of magnitude at high than those from O(3P) which is
consistent with the Boltzmann-weighted energy difference for the two
asymptotes.
| Forward | |||
| C(3P) + O2() CO()+ O(1D) | 4.12 | 0.45 | 2209 |
| 2.42 | 0.40 | 116 | |
| 1.21 | 0.47 | 4506 | |
| 1.06 | 0.27 | 6639 | |
| C(3P) + O2() CO()+ O(3P) | 3.50 | 0.22 | 3513 |
| 1.60 | 0.22 | 1891 | |
| 5.49 | 0.11 | 6789 | |
| Total | 1.56 | 0.30 | 3018 |
| Reverse | |||
| O(1D) + CO() C(3P) +O2() | 1.15 | 0.11 | 49965 |
| 1.25 | 0.42 | 42273 | |
| 4.60 | 0.32 | 50111 | |
| 5.28 | 0.53 | 46836 | |
| O(3P) + CO() C(3P) +O2() | 1.52 | 0.50 | 68903 |
| 8.92 | 0.70 | 64167 | |
| 7.80 | –0.37 | 83013 | |
| Total | 1.55 | 0.09 | 71735 |
Table 2 summarizes the parameters from fitting the raw
data to a modified Arrhenius expression for the forward and reverse processes for all
five PESs. It is noted that all forward processes involve a
comparatively small activation energy of a few hundred to a
few thousand Kelvin. All reverse rates have activation energies that
are at least one order of magnitude larger. The number of trajectories
that contribute to these rates varies from less than 1 % to 55
%. For the slowest process, the reverse reaction on the 3A′ and
3A′′ PESs originating from O(3P), at least an additional trajectories were run at each temperature between 3000 K
and 20000 K and close to trajectories for K.
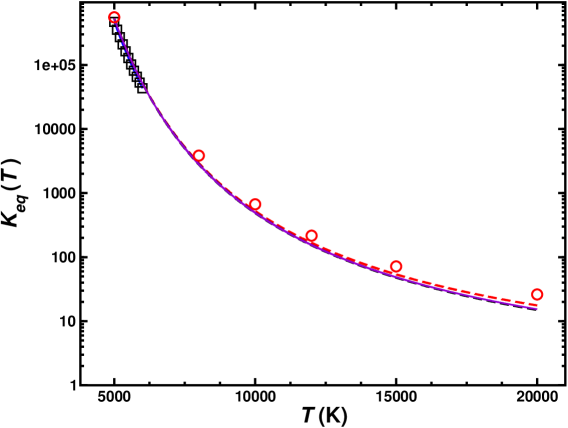
From the forward and reverse rates the equilibrium constant can also be determined, see Figure 6. This
equilibrium constant was determined from the total forward and reverse
fluxes of the weighted sum of the singlet and triplet pathways
according to the data summarized in Table 2. Error bars
for the individual rates have been determined from bootstrapping and
are compared with results determined from statistical mechanics. The
equilibrium constant is only reported for temperatures 5000 K and
higher as the reverse reaction only opens at these temperatures, see
Figure 5.
A final process considered is the atom exchange reaction COA()+ OB(3P) COB()+ OA(3P). For this process, on
the 3A′ state, rates ranging from cm3
molecule-1 s-1 to cm3
molecule-1 s-1 between 500 K and 20000 K were found, see
Table S5 and Figure S6. The rate
increases monotonically from values , consistent with
those measured experimentally,64 as a function of
and is smaller than the measurement at 1820 K.65 This
experimental value was an indirect measurement that required the
decomposition rate for N2O and is presented without derived error
bars. The barrier for the atom exchange reaction inferred from the
low-temperature experiments is 6.9 kcal/mol (0.299 eV), which is also
what is found from the present work (Figures S7
and S8).
A summary of all forward and reverse rates is provided in Figure
S5, and Tables S1 to
S5 report all numerical values for the temperature
dependent rates.
3.3 Vibrational Relaxation
Vibrational relaxation (VR) of CO in its and states was
investigated for both, the singlet and triplet manifolds
separately. VR was investigated by running
trajectories at each temperature, ranging from 300 K to 5000 K, see
Table S6. The final vibrational state was determined
using Gaussian binning (GB) which has been shown to yield similar
results as histogram binning.54, 55, 66
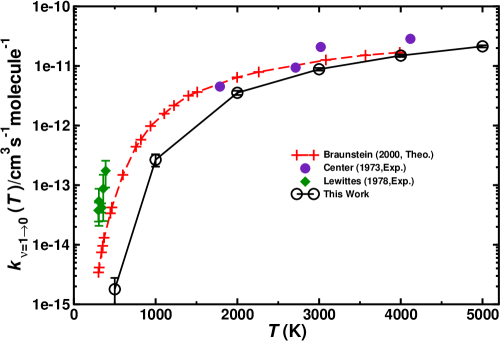
Figure 7 compares the individual and total VR rates with
those measured experimentally and Table 3 reports the
rates. The computed rates are consistently lower than those from
experiments at lower temperatures. For K the rates are in
good agreement with experiments, though. In order to verify that the
underestimation is not due to neglect of higher electronically excited
states, the A′′ PES was also determined. This PES (not shown)
is mainly repulsive. Therefore, the VR rates for this state only
contribute % of the rates for the 3A′ and 3A′′
states at the highest temperatures. Hence, the differences between
experiment and simulations at lower temperatures are not due to
neglect of contributions from higher-lying electronic states.
| 500 K | 1000 K | 2000 K | 3000 K | 4000 K | 5000 K | |
| 3A′ | 0.01 | 1.51 | 18.61 | 43.62 | 74.44 | 101.95 |
| 3A′′ | 0.01 | 1.08 | 14.90 | 39.70 | 67.00 | 99.30 |
| A′′ | 0.00 | 0.07 | 1.90 | 4.71 | 7.83 | 11.73 |
| Total | 0.02 | 2.66 | 35.41 | 88.03 | 149.27 | 212.98 |
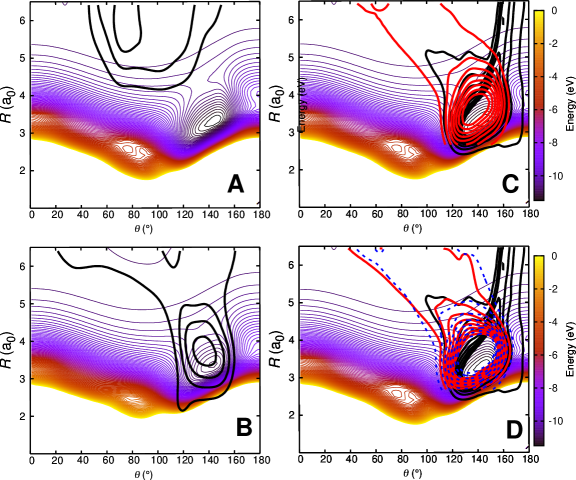
In order to better characterize to which parts of the PESs the
individual processes are sensitive to, density maps were determined as
follows. For each initial condition a trajectory can be attributed to
one of the 4 possible outcomes: a) no vibrational relaxation, no
reaction: O+CO() O+CO() b) vibrational
relaxation without reaction: O+CO()
O+CO(), c) no vibrational relaxation but with atom exchange:
OA+COB() OB+COA(), and d) vibrational relaxation with atom exchange:
OA+COB() OB+COA(). Then, all trajectories for a given class were
combined and a 2-dimensional histogram was generated and smoothed
using kernel density estimation (KDE).67 The resulting
2-dimensional distribution was then projected onto the relaxed PES for
the corresponding state, see Figure 8.
| relaxing | nonrelaxing | ||||
| reacting | |||||
| 300 | 230 | 681 | 340 | 745 | |
| 210 | 207 | 333 | 241 | 301 | |
| non-reacting | |||||
| 480 | 440 | 1579 | 65790 | 117367 | |
| 67 | 155 | 156 | 33 | 36 | |
Panel 8A shows that nonrelaxing trajectories sample
regions in the long range without penetrating into the strongly
interacting region around . Contrary to that, nonreactive, relaxing trajectories of
the type O+CO() O+CO() access the
strongly interacting region and sample it before leaving this region
again, see Figure 8B. For the reactive trajectories
(OA+COB OB+COA), see
Figures 8C and D, all trajectories enter the strongly
interacting region along (black density).
After the reaction, the product (COA) can either remain
vibrationally excited (Figure 8C; no relaxation), or its
vibrational state can change (COA() or COA()). The highest vibrational state in the products after
reaction in these trajectories (run at 1000 K) is . The
probability distributions of the products from reactive collisions in
Figures 8C and D are in red (for , relaxation) and
in blue (for , further excitation). The shape of the red and
blue probability distributions in Figures 8C and D can
already be anticipated from the relaxed PES for the CO+O channel, see
Figure S9. Starting from around the minimum on the
PES at these densities follow the
path indicated by the green isocontour at –10.5 eV in Figure
S9 through the constriction indicated as a red
cross. A different perspective that could be taken is to refer to all
reactive trajectories as “vibrationally relaxing” because the quanta
initially present in COB are destroyed upon dissociation of
COB. However, experimentally, the final states CO and CO can not be distinguished. Hence
separation into 4 separate cases is meaningful in analyzing the
trajectories.
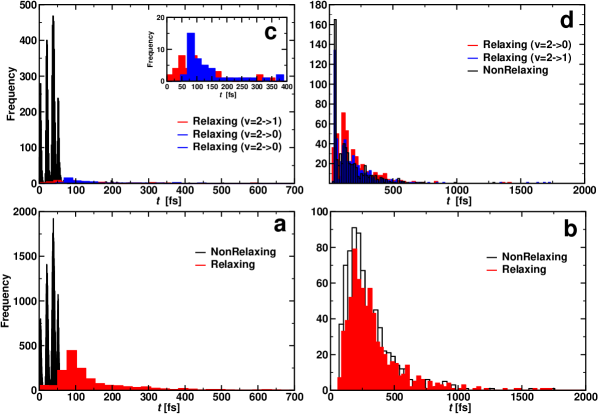
It is also of interest to consider the distribution of contact times
for each of the scenarios. This quantity was taken as the
first instance along the trajectory for which the sum of all
three atom distances is smaller than 12 a0 in the entrance channel
until the point at which a0 along the exit
channel. This was done for CO initially in its and states,
respectively. The average contact times are reported in Table
4 and their distributions are shown in Figure
9. It should, however, be noted that the average
only incompletely characterize the underlying distribution
because the distributions are either structured (Figures
9a and c) or extend to times more than 10 times the
most probable value as in Figures 9b and d.
For reacting trajectories and non-reacting but relaxing trajectories,
the contact time decreases with increasing vibrational
excitation. This differs for non-reacting, relaxing
trajectories. Their average contact times appear to be determined by
the final vibrational state. For relaxation to the average
vibrational relaxation time is fs which shortens to fs for relaxation to with initial . This is in
contrast to the non-relaxing non-reacting trajectories which appear to
be independent of vibrational excitation. The for these
trajectories is of the order of 30 fs which is roughly the minimum
time required for one collision.
When considering the lifetime distributions it is found that those
involving reacting trajectories display a regular pattern of peaks,
see Figures 9a and c. The specific case for
relaxation from is shown in Figure
S10. It is noticeable that the probability to find
trajectories that react but do not relax can be zero and
reaches maximal values for other values for the lifetime. Fourier
transformation of this signal yields frequencies between 1824
cm-1 and 2529 cm-1, see Figure S10. These
frequencies, which are in the range of typical CO stretch frequencies,
can be understood as “gating modes” that allow the reaction to
occur, similar to what was found for proton transfer in protonated
ammonia dimer.69
It is also of interest to consider the geometries sampled for the
C+O CO+O(1D) reaction on the 1A′ PES
depending on the temperature from which the initial conditions were
generated. This was done for K and K. For reactive
trajectories at low temperature the global minimum is extensively
sampled (see Figure S11A) whereas at high
temperature this region is not sampled at all as shown in Figure
S11B. Hence, collisions at different temperatures
are expected to sample complementary regions of the 3d PES.
4 Discussion and Conclusions
The present work reports thermal and vibrational relaxation rates from
QCT simulations on the five lowest PESs of the [COO]
systems. Comparison with experiment is favourable for thermal rates
and vibrational relaxation rates at high temperatures. For the atom
exchange rate, agreement is rather more qualitative, with an overall
offset in the energetics of 300 K (0.026 eV). Additional analyses are
carried out in the following to provide an understanding of remaining
disagreements between experiment and simulations.
One interesting comparison can be made with state-to-state cross
section measurements for the C(3P) + O2()
CO()+ O(1D) reaction at small
collision energies.34 These experiments used a pulsed
nozzle through which the O2 expanded into the vacuum. The O2
internal state distribution was not measured directly but expected to
be very cold.34 Hence, it is likely that mostly
O2() with low was populated. Such experiments
found that excitation of CO() occurs for all collision energies
whereas population of CO() is only possible with an
excess of eV. Using bound state energies for CO
derived from experiment70 and accounting for the 0.04
eV required to open the CO channel, the energy difference
between CO and CO is 4.037 eV. Including zero point
energy for CO and O2, the difference between the C(3P)+O2 and
CO+O(3P) channels from experimental data is 4.075 eV. This differs
by 0.085 eV from the value at the MRCI level of theory which is 3.990
eV.
From semiclassical calculations on the present PESs the CO()
state is at 4.140 eV. This compares with the difference in electronic
energies (3.990 eV) and differences in the CO and O2 zero point
energies of 3.952 eV. Hence, eV
is required to open the CO() channel. QCT simulations starting
from Boltzmann-distributed initial conditions find that the
population of the CO() decays exponentially with increasing
(Figure S12 left panel) which is
consistent with experiments.34 Because expansion
through a nozzle does not necessarily yield Boltzmann-distributed
initial conditions and the experimental beam was deemed “very
cold”,34 the final state distributions were also
separated into those originating from O (open circles in
Figure S12) and those from O (solid line
in Figure S12). For CO() all distributions
follow the same overall behaviour.
Conversely, for CO() considering the final state distribution
from initial O has an onset at eV (inset Figure
S12 right panel) with a dependence on
consistent with experiment34 whereas including all
initial states for O2 and those starting from O
again show a decaying probability distribution with increasing . Because both, initial and are probably “cold”, it is
meaningful to consider final CO() distributions originating
from different values for the parent O2
molecule. With decreasing the CO() channel opens
with increasing values of . For , the onset occurs at 0.05 eV and shifts to eV for
, which is consistent with the estimate of
0.188 eV based entirely on energetic arguments above. A temperature
of K corresponds to O but the corresponding
(nonequilibrium) distribution probably extends to higher
values. Hence an estimated onset of generating CO for
eV is expected from the present
simulations. This corresponds to a difference of 0.01 eV to 0.06 eV
from experiment on a scale of 4 eV, which is an error of 1 % at
most.
For the deactivation of O(1D) to O(3P) in the atmosphere early
models performed well for the observed data available at that
time.23 The CO case was categorized as one that is
dominated by the configuration of a critical region where a crossing
between the single PESs originating from the O(1D) channel cross
the triplet PESs leading to O(3P). For the crossing dynamics a
Landau-Zener model was assumed. This simple approach lead to a
predicted rate of cm3 molecule-1 s-1 at 300K which was
within the error of experimental measurements of 7.6 and cm3 molecule-1 s-1 .14, 71 Following this,
the deactivation of O(1D) by CO was measured and the rate obtained
was fit by the expression which yields a rate of cm3 molecule-1 s-1 at 300 K. Assuming cm3 molecule-1 s-1 for the
collision rate, this implies a % efficiency for
deactivation of O(1D) to O(3P) at 300 K. Based on this low
efficiency the crossings between the singlet and triplet manifolds are
not expected to have a large impact on the formation, exchange or
relaxation of the reaction.
As Tully pointed out, deactivation depends on the specific crossing
geometry of the PESs; in this case the singlet and triplet
surfaces. Figures S13 and S14 show
the crossings of the 3A with the 1A surfaces on PESs evaluated
at the inner (Figure S13) and outer (Figure S13) turning points for the CO()
vibration. When starting from the COA+OB side of the
reaction, as was previously mentioned, Figure 8 shows
that the active reactions sample a channel near that
brings the outgoing OA atom into approximately
a0. At low temperature, starting from CO+O(3P), it would be
possible to cross from any of the 3A surfaces onto the 1A′
surface to lead to ground state CO2. However, in a collisionless
environment the complex will still have sufficient energy to return to
the 1A′ PES and will have to cross with a 3A surface to leave
as O(3P). This may affect vibrational energy transfer or the
exchange reaction and may be the reason for the shifts in the onset
seen between the experiment and QCT such as in Figure 7 at
low temperature. Starting from CO+O(1D) and traveling along the
1A′ surface crosses all 3A surfaces while the (2)1A′ and
1A′′ surfaces only cross the repulsive (2)3A′′ surface. At
temperatures lower than that required to form C(3P)+O2 these
trajectories can potentially cross on to the 3A surfaces and then
return to the CO+O(3P) state although it would be at high CO
vibrational state.
One finding of the present work is the role “gating” plays in the
different processes considered here. For one, vibrational relaxation
with atom exchange displays gating in the contact time distributions
which hints at a time-dependent barrier in the [COO] collision
complex. This is explicitly seen in the barriers for the COA() + OB(3P) COB() + OA(3P) atom exchange reaction
on the 3A′ PES (Figure S8). Depending on the
phase of the CO vibration at which the impinging oxygen atom collides
with the diatomic molecule, the barrier for formation of the collision
complex is either high or low. Such processes are particularly
susceptible to zero-point vibrational effects which can not be
captured in QCT simulations. Specifically, the vibrational
wavefunction does not produce the same spatial probability
distribution at low as the classical trajectory. This results in
differences in sampling times for when the gate is open versus
closed. The rates from QCT simulations should, therefore,
underestimate the true rates, in particular at low temperatures. This
is indeed found for vibrational relaxation, see Figure 7
and for the atom exchange reaction S6. As the
vibrational relaxation rates include both, processes with and without
atom exchange, and the CO vibration-dependent barriers only affect
trajectories with atom exchange, it is conceivable that vibrational
relaxation without atom exchange is not affected by these effects.
Including zero-point effects is likely to improve the comparison
between calculations and experiments. Furthermore, nonadiabatic
effects may further improve comparison with experiment, in particular
for the processes leading from CO2 to the O+CO asymptotes. Analysis
of vibrational relaxation demonstrates that depending on the process
considered (with or without reaction), different parts of the
fully-dimensional PES are sampled. This is also true for reactions at
low (15 K) and higher (1000 K) temperatures, respectively. Together
with suitable information from experiment the underlying PESs could be
further improved from techniques such as
morphing72, 73 or Bayesian
inference.74
In conclusion, the present work provides a comprehensive characterization of the energetics and dynamics of the reactive [COO] system involving the lowest five electronic states. Many findings provide good agreement between simulations and experiments but it is also found that disagreements can be traced back to neglecting quantum mechanical effects at low temperatures. Additional experiments for this important system will provide a more complete understanding of the reactions involving both asymptotes.
Acknowledgments
This work was supported by the Swiss National Science Foundation through grants 200021-117810, and the NCCR MUST.
References
- Sharma et al. 2010 Sharma, M.; Swantek, A. B.; Flaherty, W.; Austin, J. M.; Doraiswamy, S.; Candler, G. V. Experimental and Numerical Investigation of Hypervelocity Carbon Dioxide Flow over Blunt Bodies. J. Thermophys. Heat Transf. 2010, 24, 673–683
- Lewittes et al. 1978 Lewittes, M. E.; Davis, C. C.; McFarlane, R. A. Vibrational deactivation of CO() by oxygen atoms. J. Chem. Phys. 1978, 69, 1952–1957
- Husain and Young 1975 Husain, D.; Young, A. N. Kinetic investigation of ground state carbon atoms, C(23P). J. Chem. Soc., Faraday Trans. 2 1975, 71, 525–531
- Bergeat et al. 1999 Bergeat, A.; Calvo, T.; Dorthe, G.; Loison, J. Fast-flow study of the C plus NO and C+O2 reactions. Chem. Phys. Lett. 1999, 308, 7–12
- Geppert et al. 2000 Geppert, W. D.; Reignier, D.; Stoecklin, T.; Naulin, C.; Costes, M.; Chastaing, D.; Le Picard, S. D.; Sims, I. R.; Smith, I. W. M. Comparison of the cross-sections and thermal rate constants for the reactions of C(3P) atoms with O2 and NO. Phys. Chem. Chem. Phys. 2000, 2, 2873–2881
- Becker et al. 1988 Becker, K. H.; Brockmann, K. J.; Weisen, P. Spectroscopic identification of C(3P) atoms in halogenomethane + H flame systems and measurements of C(3P) reaction rate constants by two-photon laser-induced fluorescence. J. Chem. Soc., Faraday Trans. 2 1988, 84, 455–461
- Dorthe et al. 1991 Dorthe, G.; Caubet, P.; Vias, T.; Barrere, B.; Marchais, J. Fast flow studies of atomic carbon kinetics at room temperature. J. Phys. Chem. 1991, 95, 5109–5116
- Chastaing et al. 1999 Chastaing, D.; L. James, P.; R. Sims, I.; W. M. Smith, I. Neutral–neutral reactions at the temperatures of interstellar clouds: Rate coefficients for reactions of atomic carbon, C(3P), with O2, C2H2, C2H4 and C3H6 down to 15 K. Phys. Chem. Chem. Phys. 1999, 1, 2247–2256
- Chastaing et al. 2000 Chastaing, D.; Le Picard, S. D.; Sims, I. R. Direct kinetic measurements on reactions of atomic carbon, C(3P), with O2 and NO at temperatures down to 15 K. J. Chem. Phys. 2000, 112, 8466–8469
- Dean et al. 1991 Dean, A. J.; Davidson, D. F.; Hanson, R. K. A shock tube study of reactions of carbon atoms with hydrogen and oxygen using excimer photolysis of C3O2 and carbon atom atomic resonance absorption spectroscopy. J. Phys. Chem. 1991, 95, 183–191
- Ogryzlo et al. 1973 Ogryzlo, E.; Reilly, J.; Thrush, B. Vibrational excitation of CO from the reaction C+ O2. Chem. Phys. Lett. 1973, 23, 37–39
- Dubrin et al. 1964 Dubrin, J.; MacKay, C.; Pandow, M.; Wolfgang, R. Reactions of atomic carbon with -bonded inorganic molecules. J. Inorg. Nuc. Chem. 1964, 26, 2113–2122
- Xantheas and Ruedenberg 1994 Xantheas, S. S.; Ruedenberg, K. Potential energy surfaces of carbon dioxide. Int. J. Quantum Chem. 1994, 49, 409–427
- Heidner et al. 1973 Heidner, R. F.; Husain, D.; Wiesenfeld, J. R. Kinetic investigation of electronically excited oxygen atoms, O(21D2), by time-resolved attenuation of atomic resonance radiation in the vacuum ultra-violet. Part 2. Collisional quenching by the atmospheric gases N2, O2, CO, CO2, H2O and O3. Faraday Discuss. 1973, 69, 927–938
- Heidner and Husain 1973 Heidner, R.; Husain, D. Quenching of O() by atmospheric gases. Nat. Phys. Sci. 1973, 241, 10–11
- Jasper and Dawes 2013 Jasper, A. W.; Dawes, R. Non-Born–Oppenheimer molecular dynamics of the spin-forbidden reaction O(3P) + CO(X) CO2(X). J. Chem. Phys. 2013, 139, 154313
- Troe 1975 Troe, J. Fifth Symp. (Int.) Combust. 1975, 15, 667–679
- Braunstein and Duff 2000 Braunstein, M.; Duff, J. W. Electronic structure and dynamics of O(3P) + CO() collisions. J. Chem. Phys. 2000, 112, 2736–2745
- Kozlov et al. 2000 Kozlov, P.; Makarov, V.; Pavlov, V.; Shatalov, O. Experimental investigation of CO vibrational deactivation in a supersonic cooling gas flow. Shock Waves 2000, 10, 191–195
- Center 1973 Center, R. E. Vibrational relaxation of CO by O atoms. J. Chem. Phys. 1973, 58, 5230–5236
- Kelley and Thommarson 1977 Kelley, J. D.; Thommarson, R. L. Vibrational deactivation and atom exchange in O(3P) + CO(X) collisions. J. Chem. Phys. 1977, 66, 1953–1959
- Davidson et al. 1978 Davidson, J. A.; Schiff, H. I.; Brown, T. J.; Howard, C. J. Temperature dependence of the deactivation of O(1D) by CO from 113 to 333 K. J. Chem. Phys. 1978, 69, 1216–1217
- Tully 1975 Tully, J. C. Reactions of O(1D) with atmospheric molecules. J. Chem. Phys. 1975, 62, 1893–1898
- Winter et al. 1973 Winter, N. W.; Bender, C. F.; Goddard III, W. A. Theoretical assignments of the low-lying electronic states of carbon dioxide. Chemical Physics Letters 1973, 20, 489–492
- Grebenshchikov and Borrelli 2012 Grebenshchikov, S. Y.; Borrelli, R. Crossing Electronic States in the Franck-Condon Zone of Carbon Dioxide: A Five-Fold Closed Seam of Conical and Glancing Intersections. J. Phys. Chem. Lett. 2012, 3, 3223–3227
- Grebenshchikov 2013 Grebenshchikov, S. Y. Photodissociation of carbon dioxide in singlet valence electronic states. II. Five state absorption spectrum and vibronic assignment. J. Chem. Phys. 2013, 138, 224107
- Grebenshchikov 2013 Grebenshchikov, S. Y. Photodissociation of carbon dioxide in singlet valence electronic states. I. Six multiply intersecting ab initio potential energy surfaces. J. Chem. Phys. 2013, 138, 224106
- Schmidt et al. 2013 Schmidt, J. A.; Johnson, M. S.; Schinke, R. Carbon dioxide photolysis from 150 to 210 nm: Singlet and triplet channel dynamics, UV-spectrum, and isotope effects. Proc. Natl. Acad. Sci. 2013, 110, 17691–17696
- Zhou et al. 2013 Zhou, B.; Zhu, C.; Wen, Z.; Jiang, Z.; Yu, J.; Lee, Y.-P.; Lin, S. H. Topology of conical/surface intersections among five low-lying electronic states of CO2: Multireference configuration interaction calculations. J. Chem. Phys. 2013, 139
- Dixon and Porter 1963 Dixon, R. N.; Porter, G. The carbon monoxide flame bands. Proc. R. Soc. Lond. A. 1963, 275, 431–446
- Kinnersly and Murrell 1977 Kinnersly, S.; Murrell, J. A classical dynamical study of the reaction between C(3P) and O2(). Mol. Phys. 1977, 33, 1479–1494
- Brunsvold et al. 2008 Brunsvold, A. L.; Upadhyaya, H. P.; Zhang, J.; Cooper, R.; Minton, T. K.; Braunstein, M.; Duff, J. W. Dynamics of Hyperthermal Collisions of O(3P) with CO. J. Phys. Chem. A 2008, 112, 2192–2205
- Schwenke et al. 2016 Schwenke, D. W.; Jaffe, R. L.; Chaban, G. M. Collisional dissociation of CO: ab initio potential energy surfaces and quasiclassical trajectory rate coefficients. ”unpublished” 2016, 1–56
- Costes and Naulin 1998 Costes, M.; Naulin, C. State-to-state cross sections for the C(3PJ)+ O2(X) CO(X)+ O(1D2) reaction at kinetic energies between 4.4 and 90 meV. Comptes Rendus de l’Académie des Sciences-Series IIC-Chemistry 1998, 1, 771–775
- Dean et al. 1991 Dean, A. J.; Davidson, D. F.; Hanson, R. K. A shock tube study of reactions of carbon atoms with hydrogen and oxygen using excimer photolysis of C3O2 and carbon atom atomic resonance absorption spectroscopy. J. Phys. Chem. 1991, 95, 183–191
- Ho and Rabitz 1996 Ho, T.-S.; Rabitz, H. A general method for constructing multidimensional molecular potential energy surfaces from ab initio calculations. J. Chem. Phys. 1996, 104, 2584
- Unke and Meuwly 2017 Unke, O. T.; Meuwly, M. Toolkit for the Construction of Reproducing Kernel-Based Representations of Data: Application to Multidimensional Potential Energy Surfaces. J. Chem. Inf. Model 2017, 57, 1923–1931
- Werner and Knowles 1988 Werner, H.-J.; Knowles, P. J. An efficient internally contracted multiconfigurationreference configuration interaction method. J. Chem. Phys. 1988, 89, 5803–5814
- Knowles and Werner 1988 Knowles, P. J.; Werner, H.-J. An efficient method for the evaluation of coupling coefficients in configuration interaction calculations. Chem. Phys. Lett. 1988, 145, 514 – 522
- Langhoff and Davidson 1974 Langhoff, S.; Davidson, E. Configuration interaction calculations on nitrogen molecule. Int. J. Quant. Chem. 1974, 8, 61–72
- Dunning 1989 Dunning, T. H. Gaussian basis sets for use in correlated molecular calculations. I. The atoms boron through neon and hydrogen. J. Chem. Phys. 1989, 90, 1007–1023
- Werner et al. 2019 Werner, H.-J.; Knowles, P. J.; Knizia, G.; Manby, F. R.; et al., M. S. MOLPRO, version 2019.1, A package of ab initio programs. 2019
- Werner and Knowles 1985 Werner, H.-J.; Knowles, P. J. A second order multiconfiguration SCF procedure with optimum convergence. J. Chem. Phys. 1985, 82, 5053–5063
- Knowles and Werner 1985 Knowles, P. J.; Werner, H.-J. An efficient second-order MC SCF method for long configuration expansions. Chem. Phys. Lett. 1985, 115, 259 – 267
- Werner and Meyer 1980 Werner, H.-J.; Meyer, W. A quadratically convergent multiconfiguration–self‐consistent field method with simultaneous optimization of orbitals and CI coefficients. J. Chem. Phys. 1980, 73, 2342–2356
- Kreplin et al. 2019 Kreplin, D. A.; Knowles, P. J.; Werner, H.-J. Second-order MCSCF optimization revisited. I. Improved algorithms for fast and robust second-order CASSCF convergence. J. Chem. Phys. 2019, 150, 194106
- Ho and Rabitz 2000 Ho, T.-S.; Rabitz, H. Proper construction of ab initio global potential surfaces with accurate long-range interactions. J. Chem. Phys. 2000, 113, 3960–3968
- Henkelman et al. 2000 Henkelman, G.; Uberuaga, B.; Jonsson, H. A climbing image nudged elastic band method for finding saddle points and minimum energy paths. J. Chem. Phys. 2000, 113, 9901–9904
- Larsen and Mortensen 2017 Larsen, A. H.; Mortensen, J. J. The atomic simulation environment—a Python library for working with atoms. J. Phys. Condens. Matter 2017, 29, 273002
- Truhlar and Muckerman 1979 Truhlar, D. G.; Muckerman, J. T. In Atom - Molecule Collision Theory; Bernstein, R. B., Ed.; Springer US, 1979; pp 505–566
- Henriksen and Hansen 2011 Henriksen, N. E.; Hansen, F. Y. Theories of Molecular Reaction Dynamics; Oxford, 2011
- Koner et al. 2016 Koner, D.; Barrios, L.; González-Lezana, T.; Panda, A. N. State-to-State Dynamics of the Ne + HeH NeH + He Reaction. J. Phys. Chem. A 2016, 120, 4731–4741
- Koner et al. 2018 Koner, D.; Bemish, R. J.; Meuwly, M. The C(3P) + NO(X) O(3P) + CN(X), N(2D)/N(4S) + CO(X) reaction: Rates, branching ratios, and final states from 15 K to 20 000 K. J. Chem. Phys. 2018, 149, 094305
- Bonnet and Rayez 1997 Bonnet, L.; Rayez, J.-C. Quasiclassical Trajectory Method for Molecular Scattering Processes: Necessity of a Weighted Binning Approach. Chem. Phys. Lett. 1997, 277, 183–190
- Bonnet and Rayez 2004 Bonnet, L.; Rayez, J.-C. Gaussian Weighting in the Quasiclassical Trajectory Method. Chem. Phys. Lett. 2004, 397, 106–109
- 56 Shen, V. K.; Siderius, D. W.; Krekelberg, W. P.; ; Hatch, H. W.; Eds., NIST Chemistry WebBook, NIST Standard Reference Database Number 69
- Hwang and Mebel 2000 Hwang, D.-Y.; Mebel, A. M. Ab initio study of spin-forbidden unimolecular decomposition of carbon dioxide. cp 2000, 256, 169 – 176
- Braunstein and Duff 2009 Braunstein, M.; Duff, J. W. Classical Collision Spectrum of O + CO. J. Phys. Chem. A 2009, 113, 10795–10802
- Fairbairn and Gaydon 1969 Fairbairn, A. R.; Gaydon, A. G. The dissociation of carbon monoxide. Proc. Royal Soc. Lond. A. 1969, 312, 207–227
- Bergeat et al. 1999 Bergeat, A.; Calvo, T.; Dorthe, G.; Loison, J. Fast-flow study of the C+NO and C+O2 reactions. Chem. Phys. Lett. 1999, 308, 7–12
- Husain and Young 1975 Husain, D.; Young, A. N. Kinetic investigation of ground state carbon atoms, C(23P). J. Chem. Soc., Faraday Trans. 2 1975, 71, 525–531
- Sims 2013 Sims, I. R. Low-Temperature Reactions Tunnelling in space. Nat. Chem. 2013, 5, 734–736
- Malcolm W. Chase 1998 Malcolm W. Chase, J. NIST-JANAF thermochemical tables; Fourth edition. Washington, DC: American Chemical Society ; New York : American Institute of Physics for the National Institute of Standards and Technology, 1998
- Jaffe and Klein 1966 Jaffe, S.; Klein, F. S. Isotopic exchange reactions of atomic oxygen produced by the photolysis of NO2 at 3660 Å. Trans. Faraday Soc. 1966, 62, 3135–3141
- Garnett et al. 1969 Garnett, S. H.; Kistiakowsky, G. B.; O Grady, B. V. Isotopic Exchange between Oxygen and Carbon Monoxide in Shock Waves. J. Chem. Phys. 1969, 51, 84–91
- Koner 2016 Koner, D. Scattering studies of proton transfer reactions between rare gas atoms; Indian Institute of Technology Guwahati, 2016
- Parzen 1962 Parzen, E. On Estimation of a Probability Density Function and Mode. The Annals of Mathematical Statistics 1962, 33, 1065–1076
- Team 2017 Team, R. C. R: A Language and Environment for Statistical Computing. R Foundation for Statistical Computing: Vienna, Austria, 2017
- Meuwly and Karplus 2002 Meuwly, M.; Karplus, M. Simulation of proton transfer along ammonia wires: An “ab initio” and semiempirical density functional comparison of potentials and classical molecular dynamics. J. Chem. Phys. 2002, 116, 2572–2585
- Chandra et al. 1996 Chandra, S.; Maheshwari, V.; Sharma, A. Einstein A-coefficients for vib-rotational transitions in CO. Astronomy and Astrophysics Supplement Series 1996, 117, 557–559
- Braun et al. 1973 Braun, W.; Brown, R. L.; Garvin, D.; Herron, J. T.; Huie, R. E.; Kurylo, M. J.; Laufer, A. H.; McKinley, J. D.; Okabe, H.; Scheer, M. D.; Tsang, W.; Stedman, D. H. Survey of Photochemical and Rate Data for Twenty‐eight Reactions of Interest in Atmospheric Chemistry. Journal of Physical and Chemical Reference Data 1973, 2, 267–312
- Meuwly and Hutson 1999 Meuwly, M.; Hutson, J. Morphing ab initio potentials: A systematic study of Ne-HF. J. Chem. Phys. 1999, 110, 8338–8347
- Bowman and Gazdy 1991 Bowman, J. M.; Gazdy, B. A simple method to adjust potential energy surfaces: Application to HCO. J. Chem. Phys. 1991, 94, 816–817
- Venturi et al. 2020 Venturi, S.; Jaffe, R. L.; Panesi, M. A Bayesian Machine Learning Approach to the Quantification of Uncertainties on Ab Initio Potential Energy Surfaces. J. Phys. Chem. A 2020, 124, 5129–5146