Enhanced lattice fluctuations prior to a nonmagnetic ferroelectric order in an ionic spin-chain system
Abstract
We investigated microscopic lattice states in the donor-acceptor ionic Mott insulator, TTF-BA, by 79Br-NQR spectroscopy to explore cross-correlated fluctuations between spin, charge and lattice. A ferroelectric transition with lattice dimerization is captured by a NQR line splitting with the critical exponent of 0.40, as expected in the 3D Ising universality class, and a peak formation in the spin-lattice relaxation rate at the transition temperature, , of 53 K. Notably, does not obey the conventional law expected for the Raman process of phonons even far above , indicating the emergence of extraordinary lattice fluctuations. They are very probably associated with polar fluctuations in the paraelectric and paramagnetic phase of TTF-BA and explain the previous observation of the anomalously suppressed paramagnetic spin susceptibility, which was conjectured to be due to the local spin-singlet pairing prior to the nonmagnetic ferroelectric order [K. Sunami ., Phys. Rev. Res. 2, 043333 (2020)].
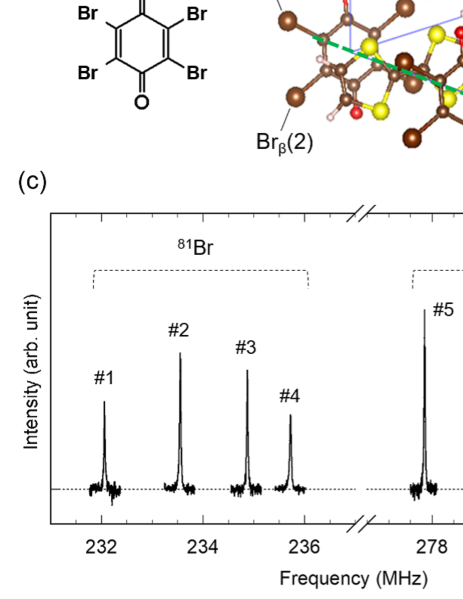
Magnetoelectric cross coupling leads to the control of electric polarizations and magnetic orders by nonconjugate fields in multiferroics [1, 2]. One-dimensional (1D) donor-acceptor ionic spin chain is a promising system for giving rise to spin-singlet driven ferroelectricity because an electric polarization is induced by a symmetry-breaking lattice dimerization with spin singlet [3, 4]. The organic charge-transfer complex, TTF-BA (tetrathiafulvalene-bromanil) is composed of 1D mixed stacks of donor molecules, TTF, and acceptor molecules, BA [Figs. 1(a) and 1(b)] and is in a highly ionic state (TTF+ρ-BA-ρ with 0.95) due to the charge transfer from TTF to BA molecules [5]. TTF-BA is in the paramagnetic and paraelectric state with a spin 1/2 on each molecule in the uniform 1D ionic chains at room temperature and exhibits a nonmagnetic dimerization (spin-Peierls) transition accompanied by ferroelectricity at = 53 K [5, 6, 7]. These behaviors are quite different from those of the analogous material, TTF-CA (tetrathiafulvalene-chloranil), showing a neutral-ionic (NI) transition from a neutral phase ( 0.3) to a ferroelectric ionic phase ( 0.6-0.7) at 81 K under ambient pressure [8, 9].
It was reported that ferroelectricity near is suppressed by applying a pulsed magnetic field of 50 T, which suggests that the ferroelectricity is coupled to the spin-singlet formation in TTF-BA [6]. On the other hand, a 1H-NMR study reveals that, in the paramagnetic phase above , the spin susceptibility does not obey the Bonner-Fisher curve expected in 1D Heisenberg spin systems, and is substantially reduced from the values of the Bonner-Fisher model in a wide temperature range below ambient temperature [10]. It is proposed that this suppression of the susceptibility is driven by polar fluctuations coupled with lattice dimerization inherent in the ionic spin-chain system [10]; however, the nature of lattice states has not been explored yet.
In the present study, we aim to unveil the microscopic lattice states of TTF-BA potentially hosting the cross-correlated fluctuations between spin, charge and lattice by 79Br-NQR spectroscopy, which probes the static and dynamical properties of lattice. We found prominent lattice fluctuations, which are not explainable by either conventional phonons or critical slowing down prior to the ferroelectric order in TTF-BA.
We performed 79,81Br-NQR (nuclear spin = 3/2) measurements on the polycrystalline sample of TTF-BA, in which there are four crystallographically nonequivalent Br sites in the paraelectric state as shown in Fig. 1(b). We employed the spin-echo pulse sequence to obtain NQR signals. The spin-lattice relaxation rate was determined by fitting the single exponential function to the relaxation curve of the nuclear magnetization obtained using the standard saturation recovery method.
At room temperature, we observed two sets of four spectra in the frequency ranges of 270-304 MHz and 231-240 MHz [labelled by #1 to #8 from the lowest-frequency peak as shown in Fig. 1(c)]. Br nuclei have two stable isotopes, 79Br ( = 3/2, natural abundance = 50.7 %, quadrupolar moment = 0.33110-24 cm2) and 81Br ( = 3/2, natural abundance = 49.3 %, quadrupolar moment = 0.27610-24 cm2) [11]. The NQR frequency is proportional to both of the electric-field gradient (EFG) at the nuclear position and the nuclear quadrupolar moment. Therefore, each of the four inequivalent sites gives two (79Br and 81Br) NQR lines with the resonance-frequency ratio, /, equal to / = 1.199. Actually, the observed frequencies of eight spectra, (1)-(8), give (5)/(1) (6)/(2) (7)/(3) (8)/(4) 1.197; thus, the lines of (5)-(8) and (1)-(4) are assigned to the 79Br and 81Br NQR lines, respectively. In what follows, we present the temperature profile of the highest-frequency peak (line #8) because all of the lines behave similarly.
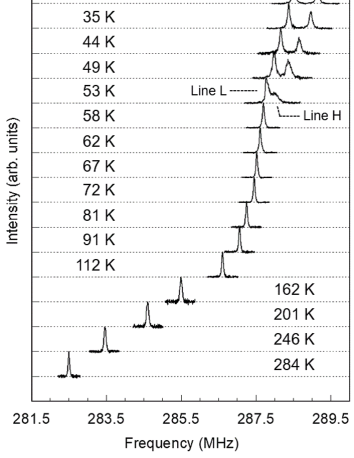
Upon cooling, the peak position is shifted to higher frequencies [Figs. 2 and 3(a)], which is well understandable in terms of the thermal-averaging effect of EFG [12, 13, 14, 15, 16, 17, 18]. The spectrum splits into the line H () and line L () at of 53 K, indicative of the loss of inversion center on a BA molecule due to the symmetry-breaking ferroelectric transition [6, 7]. The line splitting width (= ) plotted in Fig. 3(b) sharply increases just below , consistent with the continuous phase transition [5, 6, 10]. characterizes the degree of dimerization and is supposed to be proportional to the order parameter of ferroelectricity. Its critical behavior is described by with the critical exponent and the reduced temperature . Fitting the form to the data in 0.02 0.2 yields = 0.40 [Fig. 3(b)], which is close to = 0.33 for the 3D Ising universality class [19]. This is reasonable because, in the present system, the electric polarization has Ising-like anisotropy.
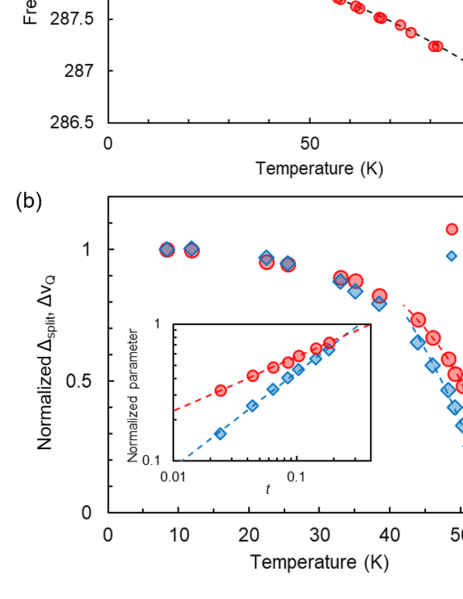
Besides the splitting, the value is additionally influenced by the ferroelectric dimerization transition. As shown in Fig. 3(a), upon cooling from room temperature, increases and, below , the averaged value of , [=()/2], shows a further rise with a kink at . It is considered that the smooth increase in below room temperature originates from the thermal-averaging effect of EFG and the additional increase starting at is an EFG increase at both nuclear sites of the split lines due to the dimerization transition. It is known that the temperature variation of due to the thermal-averaging effect of EFG is well described by the empirical formula, = [13]. We fit this form to the values in 100 K to extrapolate the fitting curve at lower temperatures; the deviation of from the fitting curve, , below is plotted as a function of temperature in Fig. 3(b) and its inset, which show that is well described by the form of with = 0.69. This value is larger than = 0.40 for . As is assumed proportional to the molecular displacement , it turns out that . This exponent indicates that is a higher order correction to with respect to . It is likely due to the intramolecular charge density redistribution and a change in possibly caused by the dimerization-enhanced hybridization between the HOMO (highest occupied molecular orbital) of TTF and the LUMO (lowest unoccupied molecular orbital) of BA. The former, which is directly related to symmetry breaking, should be proportional to , whereas the latter is expected to have a square dependence on because should be an even function with respect to without any discontinuity at = 0; should vary smoothly with the molecular displacement across = 0. It may be the case that the sum of the two contribution gives the intermediate exponent between one and two in the fitting. We note that is not the order parameter of the ferroelectric (dimerization) transition and therefore the change of is not directly related to the symmetry breaking.
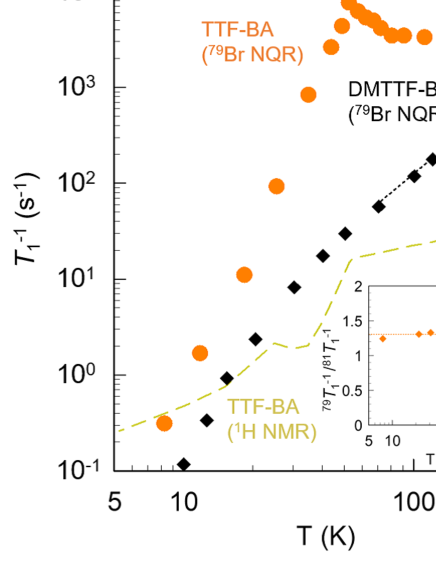
The temperature dependence of spin-lattice relaxation rate of line #8 is shown in Fig. 4. moderately decreases with temperature down to 100 K and, in turn, increases on approaching , followed by a sharp peak at , which is reminiscent of the critical behavior typical of the second-order transition. The behavior is different from that of 1H-NMR relaxation rate (Fig. 4) probing the magnetic relaxation owing to no quadrupole moment [10]. This means that the 79Br-NQR mainly probes lattice fluctuations through quadrupole interaction instead of magnetic fluctuations through hyperfine interaction. Indeed, the isotope ratio of 79Br and 81Br-NQR relaxation rates 79/81 is 1.31 0.11 independent of temperature [inset of Fig. 4], which is near the squared isotope ratio of quadrupole moments, (/)2 = 1.44 for quadrupole relaxation rather than that of gyromagnetic ratio, (79/81)2 = 0.86 for magnetic relaxation. In general, the phonon-induced NQR should obey the law due to the two-phonon Raman process for , where is the Debye temperature [20]. Actually, an analogous but ferroelectricity-free material, DMTTF-BA, shows 79Br-NQR that follows the law above 100 K, as shown in Fig. 4 [21]. However, the temperature dependence of in the paramagnetic phase of TTF-BA does not follow the law and the absolute values are largely enhanced from those of DMTTF-BA. These results strongly suggest that the extraordinary lattice fluctuations are developed in the paramagnetic phase of TTF-BA. Usually, the enhancement of due to the critical slowing down of lattice fluctuations toward the phase transition is observable well below 2, above which is proportional to [16, 18]. The present enhancement of observed around room temperature ( 5-6) is obviously out of the conventional behavior.
What is the origin of the extraordinary lattice fluctuations in the paramagnetic and paraelectric phase of TTF-BA? In the ionic spin-chain system, the local donor-acceptor pairing is associated with the polar fluctuations due to the displacement of cations and anions, evoking a view that these polar fluctuations promote the local dimer fluctuations even above and cause the precursory spin-singlet formation even in the paramagnetic phase, consistent with the suppression of the spin-susceptibility reported in Ref. [10]. The local lattice dimerization can be detected by infrared (IR) spectroscopy; the mode of BA molecule is activated when the inversion center on the BA molecule is lost due to the dimerization. Remarkably, the mode keeps being activated even up to 120 K far above [5, 6]; however, it fades out above 120 K. The apparent discrepancy between the NMR/NQR and IR results at high temperatures may stem from different sensitivities of magnetism (singlet formation) and molecular vibration ( mode activation) to the dimerization. Another manifestation of distinct lattice states above is the frequency-dependent dielectric constants in the paraelectric phase [22]. Such a behavior is often observed in the symmetry-broken phase, where fluctuations of ferroelectric domain walls with the characteristic time scale of kHz leads to the dielectric dispersion [22, 23]. However, in TTF-BA, the prominent frequency dependence of dielectric constants is detected in the paraelectric phase with the uniform 1D chains. This may suggest a case in which dimer singlets fluctuate in the form of domains containing several donor-acceptor pairs in the paraelectric phase.
In conclusion, 79Br-NQR spectroscopy revealed that the donor-acceptor ionic spin-chain system, TTF-BA, hosts extraordinary lattice fluctuations prior to the nonmagnetic ferroelectric order. The spectral splitting and the peak formation of spin-lattice relaxation rate evidence the ferroelectric transition at 53 K. The critical exponent of the order parameter yields 0.40, which is close to the exponent of the 3D Ising universality class, 0.33. In the paramagnetic phase, however, the temperature evolution of does not follow the law expected with the conventional phonon mechanism. This points to anomalously enhanced lattice fluctuations possibly coupled with the polar fluctuations inherent in the ionic spin-chain system. The present results lend supports to the emergence of distinct cross-correlated fluctuations between spin, charge and lattice in a charge-transfer organic complex, TTF-BA.
Acknowledgements.
This work was supported by the JSPS Grant-in-Aids for Scientific Research (grant nos. JP18H05225, JP19H01846, JP20K20894 and JP20KK0060).References
- [1] T. Kimura, T. Goto, H. Shintani, K. Ishizaka, T. Arima, and Y. Tokura, Nature 426, 55 (2003).
- [2] N. Hur, S. Park, P. A. Sharma, J. S. Ahn, S. Guha, and S. W. Cheong, Nature 429, 392 (2004).
- [3] R. E. Peierls, Quantum Theory of Solids (Clarendon Press, 1955).
- [4] M. C. Cross and D. S. Fisher, Phys. Rev. B 19, 402 (1979).
- [5] A. Girlando, C. Pecile, and J. B. Torrance, Solid State Commun. 54, 753 (1985).
- [6] F. Kagawa, S. Horiuchi, M. Tokunaga, J. Fujioka, and Y. Tokura, Nat. Phys. 6, 169 (2010).
- [7] P. García, S. Dahaoui, P. Fertey, E. Wenger, and C. Lecomte, Phys. Rev. B 72, 104115 (2005).
- [8] J. B. Torrance, J. E. Vazquez, J. J. Mayerle, and V. Y. Lee, Phys. Rev. Lett. 46, 253 (1981).
- [9] J. B. Torrance, A. Girlando, J. J. Mayerle, J. I. Crowley, V. Y. Lee, P. Batail, and S. J. LaPlaca, Phys. Rev. Lett. 47, 1747 (1981).
- [10] K. Sunami, Y. Sakai, R. Takehara, H. Adachi, K. Miyagawa, S. Horiuchi, and K. Kanoda, Phys. Rev. Research 2, 043333 (2020).
- [11] P. Raghavan, Atomic Data and Nuclear Data Tables 42, 189 (1989).
- [12] H. Bayer, Z. Phys. 130, 227 (1951).
- [13] A. A. Koukoulas and M. A. Whitehead, Chem. Phys. Lett. 167, 379 (1990).
- [14] M. Gourdji, L. Guib, A. Pneau, J. Gallier, B. Toudic, and H. Cailleau, Solid State Commun. 77, 609 (1991).
- [15] J. Gallier, B. Toudic, Y. Delugeard, H. Cailleau, M. Gourdji, A. Pneau, and L. Guib, Phys. Rev. B 47, 11688 (1993).
- [16] F. Iwase, K. Miyagawa, S. Fujiyama, K. Kanoda, S. Horiuchi, and Y. Tokura, J. Phys. Soc. Jpn. 76, 073701 (2007).
- [17] R. Takehara, K. Sunami, F. Iwase, M. Hosoda, K. Miyagawa, T. Miyamoto, H. Okamoto, and K. Kanoda, Phys. Rev. B 98, 054103 (2018).
- [18] K. Sunami, F. Iwase, K. Miyagawa, S. Horiuchi, K. Kobayashi, R. Kumai, and K. Kanoda, Phys. Rev. B 99, 125133 (2019).
- [19] H. W. J. Blote, E. Luijten, and J. R. Heringa, J. Phys. A. Math. Gen. 28, 6289 (1995).
- [20] A. Abragam, The Principles of Nuclear Magnetism (Oxford University Press, Oxford, 1961).
- [21] F. Iwase, K. Miyagawa, K. Kanoda, S. Horiuchi, and Y. Tokura, J. Phys. Soc. Jpn. 79, 043709 (2010).
- [22] Y. Tokura, S. Koshihara, Y. Iwasa, H. Okamoto, T. Komatsu, T. Koda, N. Iwasawa, and G. Saito, Phys. Rev. Lett. 63, 2405 (1989).
- [23] F. Kagawa, S. Horiuchi, H. Matsui, R. Kumai, Y. Onose, T. Hasegawa, and Y. Tokura, Phys. Rev. Lett. 104, 227602 (2010).