Abstract
At colliders, Weakly Interacting Massive Particles (WIMPs) are candidates for dark matter (DM) and can be searched for using as tag a photon from initial state radiation. The potential for detecting DM at the Compact Linear Collider (CLIC) is investigated at 3 TeV. The sensitivity of the search is estimated by computing the 95% confidence level upper limit cross section as a function of the dark matter mass. Left-handed (right-handed) polarised beams increase (decrease) respectively the Standard Model backgrounds and are essential to characterize the WIMPs properties and control the systematic errors. Using right-handed polarised beams is decreasing significantly the 95% confidence level cross section. Using the ratio of the energy distributions for left-handed and right-handed polarised beams, systematic errors cancel out. Computing the 95% confidence level upper limit cross section using the ratio requires a model assumption to compute the expected number of signal events. Exclusion limits for dark matter are derived using dark matter Simplified Models for two values of the e-e-mediator vertex coupling, a mediator width of 10 GeV and for a fixed value of the mediator-DM-DM coupling. For a mediator mass of 3.5 TeV, the measurement of the differential distribution of the significance as a function of the photon energy for the process X X allows the discrimination between different dark matter mediators and the measurement of the WIMP mass to nearly half the centre-of-mass energy. For a 1 TeV WIMP, the mass is determined with a 1% accuracy.
1 Introduction
The Compact Linear Collider (CLIC) is a mature option for a future TeV-scale collider. CLIC is proposed to run according to a staging scenario with different centre-of-mass energies, =380 GeV, 1.5 TeV and 3 TeV. The baseline machine allows for up to 80% electron polarisation. The lowest energy stage will concentrate on Higgs and Top physics [1], [2] collecting data corresponding to an integrated luminosity of [3].
At all centre-of-mass energies, Beyond Standard Model (BSM) searches will also be performed, among which are searches for dark matter (DM). The existence of DM has been firmly established through observation of its gravitational effects, but its nature is not established. A widely accepted hypothesis on the form for dark matter is that it is composed of weakly interacting massive particles (WIMPs) that interact only through gravity and the weak force. There are alternative hypotheses that attempt to account for the observations without invoking additional matter. WIMP searches at colliders are complementary to the direct and indirect searches and to the hadron collider searches. As the WIMP escapes detection, in collisions the signature is a photon radiated off the initial-state leptons and missing energy. Searches for single and multiphoton final states with missing energy have been performed by LEP experiments [4], [5] [6], [7] and investigated at the International Linear Collider [8]. The main background processes are and . The neutrino background is irreducible, but can be enhanced or reduced by changing the beam polarisation. Radiative Bhabha scattering has a large cross section and mimics the signal if both leptons are undetected. For the reduction of this background, excellent hermiticity in the forward region of the detector is required. To assess the CLIC physics potential, the 95% confidence level upper limit on the cross section is determined as a function of dark matter mass for different polarisation conditions. The 95% confidence level upper limit cross section as a function of dark matter mass is then used to derive exclusion limits in the framework of dark matter Simplified Models (DMSMs) [9], [10], [11]. Simplified models are designed to grab the basic details of collider phenomenology found in rigorously-derived theories of new physics, without the complexity of the full theory. They are used to compare hadron and lepton collider physics potential. These simplified models assume that DM is a Dirac fermion X and there is an additional heavy particle mediating the SM-DM interaction, the “mediator Y ”. In the most basic set of these models, the mediator is a vector, an axial-vector, a scalar or a pseudo-scalar boson. In this study, CLICdp focused on the subset of the models where the mediator is exchanged in the s-channel. In the presence of the signal, using the photon energy distribution, the distribution of the significance as a function of , is computed for pseudo-data and for different mediator templates coupling to dark matter. The between the significance of pseudo-data and templates is computed. It is used to discriminate among different mediator hypotheses and to determine the dark matter mass.
2 Dark Matter exclusion limits at 3 TeV
2.1 Event simulation and selection at 3 TeV
Cross-section calculation and event generation are done using the WHIZARD 2 program [12]. The cross sections are calculated at 3 TeV without and with beam polarisation. Beamstrahlung effects on the luminosity spectrum are included using results of the CLIC beam simulation for the 3 TeV accelerator parameters. There are three sources of the centre-of-mass energy spread: the momentum spread in the linac, the beamstrahlung which creates a long tail, and initial state radiation (ISR). The first two are collectively refered to as “luminosity spectrum”. The luminosity spectrum is obtained from the GuineaPig [13] beam simulation, it is interfaced to WHIZARD using circe2 [12]. The standard procedure to take ISR effects into account when generating events with WHIZARD is to use the built-in lepton ISR structure function which includes all orders of soft and soft-collinear photons as well as up to the third order in high-energy collinear photons. However, this approach allows only for a proper modelling of the kinematics of the hard scattering, but is not suitable when we expect photons to be detected in the experiment. For proper description of the photon kinematics, hard non-collinear photon emission should be included in the generation of the background processes on the matrix element level. To obtain a realistic distribution of the photon polar angle, up to three photons are included in the matrix element. Events with ISR photons emitted in the same kinematic region as matrix element (ME) photons are rejected using a merging procedure [14]. Table 1 shows the integrated luminosity assumptions at =3 TeV for different beam polarisation conditions. It shows also the cross sections of the two main Standard Model processes for different beam polarisation conditions requiring 0.02, and without ISR/ME merging cut. and are the polar angle and the transverse momentum of the photon respectively. is the longitudinal degree of polarisation of the beam, > 0 (right-handed polarisation) No additional selection cut is applied for the cross section calculation and event generation. The ISR/ME merging efficiency is 70% for and 69% for .
| Polarisation | No | , | , |
|---|---|---|---|
| -80 , 0 | +80 , 0 | ||
| Integrated luminosity | 5 | 4 | 1 |
| ( ()) [fb] | |||
| ( ()) [fb] |
A fast simulation is used to compute the expected () and () backgrounds. To take into account the detector resolution, the momentum and energy of the particles are randomly modified using Gaussian resolution parameters according to the particle type. Table 2 shows the angular coverage of the different detectors used for the analysis, the simulation parameters and parameter values used for the fast simulation of electrons and photons. is the polar angle of the particle, electron or photon. The parameter values are obtained from full simulation studies. Details about CLIC event simulation and detector performance can be found in [15], [16] and methods of the background simulation and electron reconstruction are described in [17] and [18].
| Detector | Angular region | Particle | |||
| mrad | GeV | % | |||
| BeamCal | e, | 1000 | 0.1 | ||
| LumiCal | e, | 500 | 99 | ||
| ECal No tracking | e, | 50 | 99 | ||
| ECal and tracking | e | 20 | F( 1) | 99.5 | |
| ECal and tracking | 20 | 99 |
is the minimum energy required to compute the energy of the particle and apply a detection efficiency. is the energy resolution, and is the detection efficiency. In the BeamCal, =0.1 [] and the detection efficiency is a function of the energy and of the angle of the particle. The efficiency is computed using the ElectronEfficiency library developed for the CLIC CDR [19]. In the LumiCal, = [] and the detection efficiency is =99%. In the Ecal region without tracking system, = [] and the detection efficiency is =99%. In the "signal region", , the energy resolution and the detection efficiency are different for electrons and photons. For the electrons, the momentum resolution function is:
| (1) |
the parameter a, b and c represents the contribution from the curvature measurement, from the multiple-scattering and from the angular resolution respectively. The values were obtained by fitting the resolution of fully simulated charged particle data as a function of the [15]. For , , and . For tracks measured in the tracker barrel and parameter is independent of . For tracks measured in the end cap disks the path length L depends on and therefore depends on . The detection efficiency is =99.5%. For the photons, = [] and the detection efficiency is =99%. With these parameters, listed in Table 2, the fake rate due to beam-induced backgrounds, is well below in all detector regions.
The mono-photon selection requires an isolated photon with an energy greater than 60 GeV in the signal region and little energy in the other parts of the detector. This selection includes:
-
•
A photon isolation selection based on the observable defined as:
(2) is the photon energy and is the energy sum of the particles in a cone of width =0.4 around the photon direction with
(3) -
•
A missing energy selection requiring little energy in addition to the photon energy
(4) is the total energy of the event.
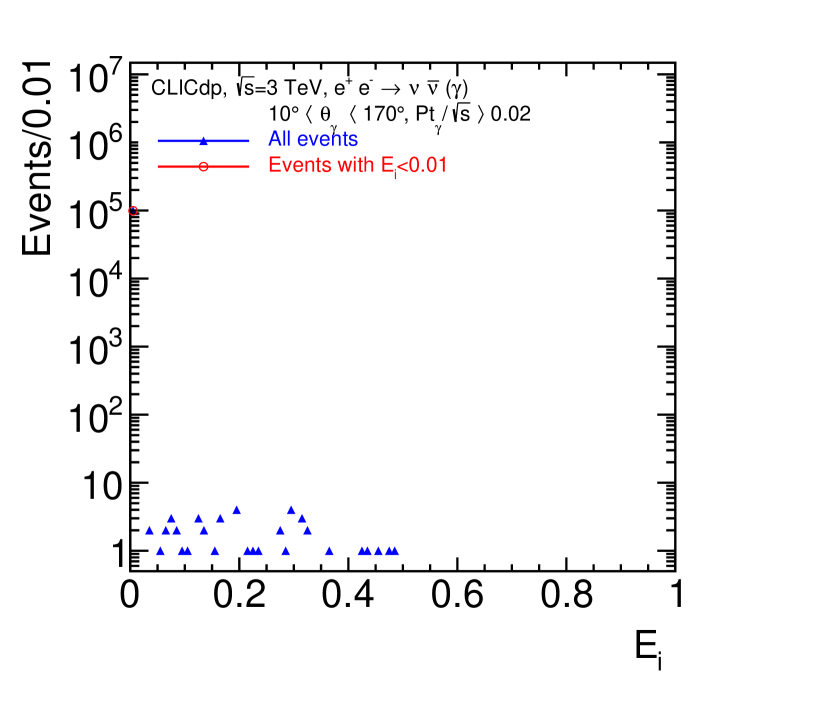
When there are several photons in the signal region the photons are sorted by energy. The energy of the most energetic photon is considered to be the energy of the signal photon and is randomly modified using the photon energy resolution of the signal region. The particles outside the signal region cannot be identified and are considered as electrons. To compute and , the energy of the remaining particles are considered if their energy is greater than . For all these particles the energy is randomly modified using the energy resolution of the detector region where the particle is detected and the detection efficiency is taken into account when computing and . Figure 1(a) shows for the process (), the distribution of the observable used for the photon isolation selection. The events with >0.01 are events for which the energy of an additional photon is measured in the cone around the high energy signal photon. Figure 1(b) shows the distribution of the observable used for the missing energy selection.
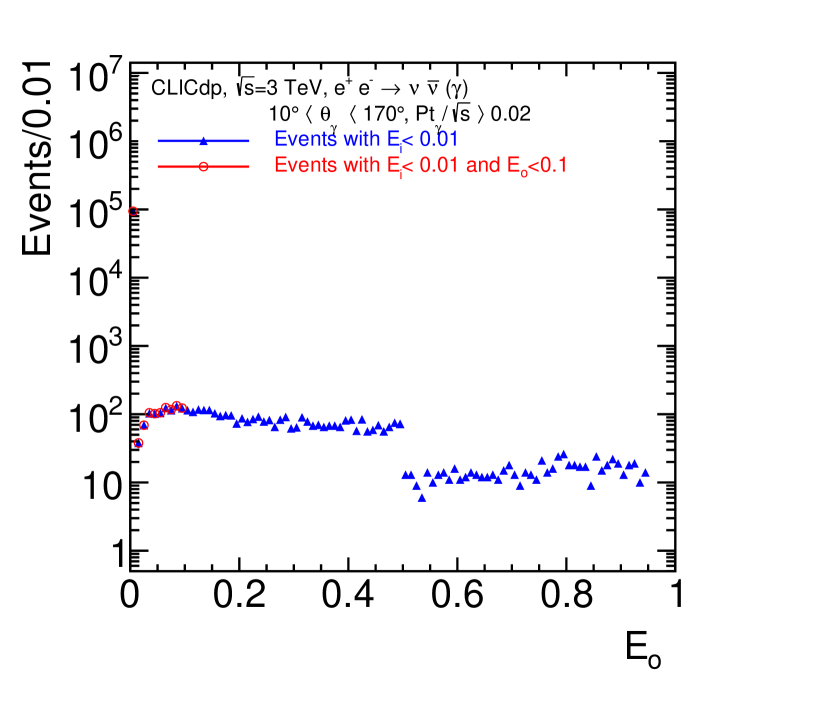
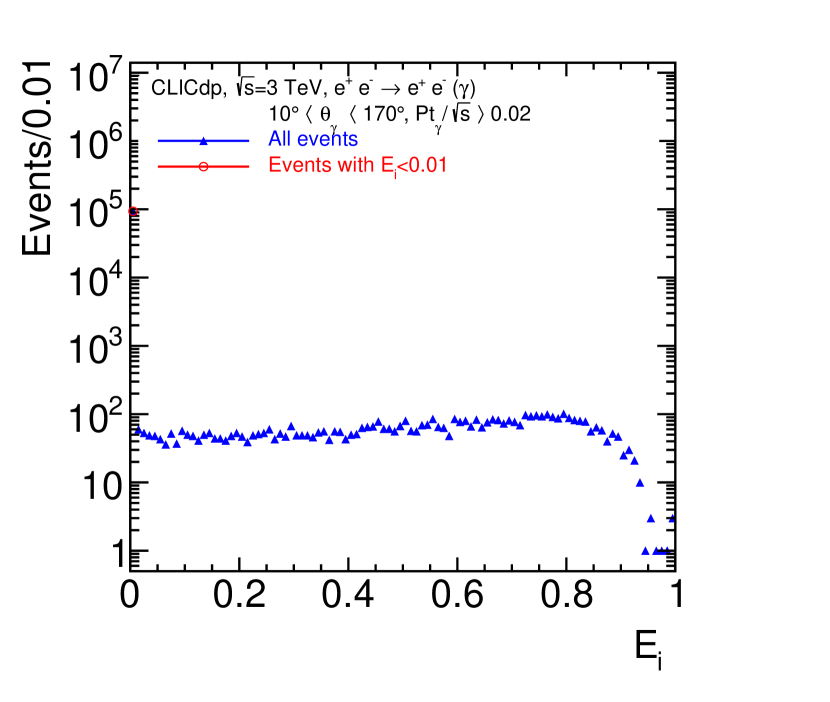
The events with >0.1 are events for which the energy of an additional photon is measured, either in the signal region or outside the signal region. Figure 2(a) and Figure 2(b) show the same distributions and for the process ().
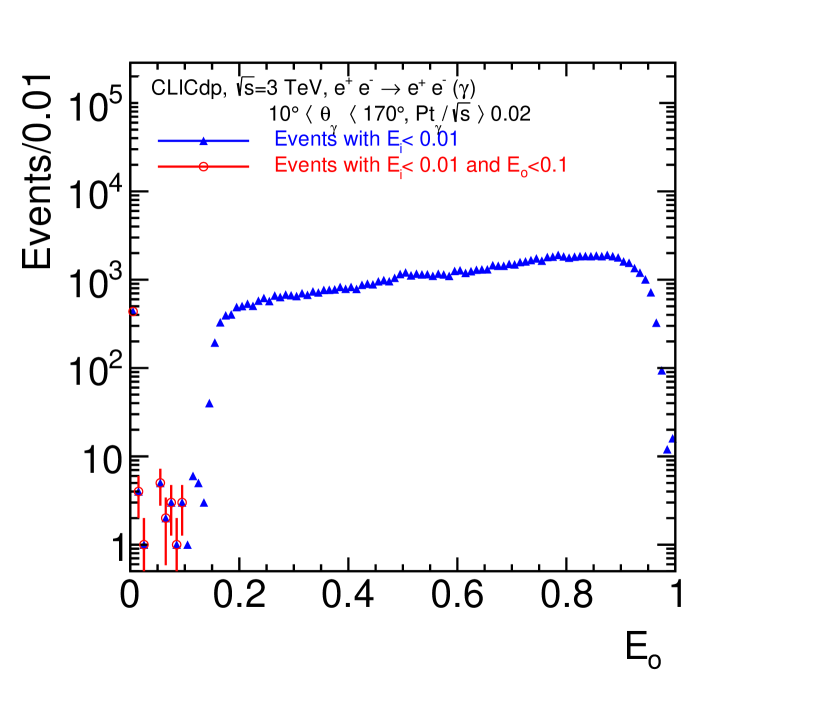
The events with >0.1 are events for which the energy of an additional photon or electron is measured, either in the signal region or outside the signal region. Taking into account the high energy required for the signal photon, 60 GeV and the low beam-induced fake rate in all detection regions, potential energy deposits originating from beam-induced background are neglected when computing the mono-photon selection efficiency. Table 3 shows for the two main SM backgrounds () and (), the selection efficiencies of the photon isolation cut and of the missing energy selection cut . The selection efficiencies for left-handed 80% polarised beam and for right-handed 80% polarised beam are the same.
| Process | Process | ||
|---|---|---|---|
| () | () | ||
| Cut name | Cut value | Selection efficiency | Selection efficiency |
| <0.01 | 0.99 | 0.935 | |
| and | <0.01 and <0.1 | 0.95 | 4.6 |
Figure 3(a) shows for a left-handed 80% polarised beam (PeL), the stacked histogram of the photon energy distribution of () and () events selected using the photon isolation selection . The number of events corresponds to an integrated luminosity of 1 .
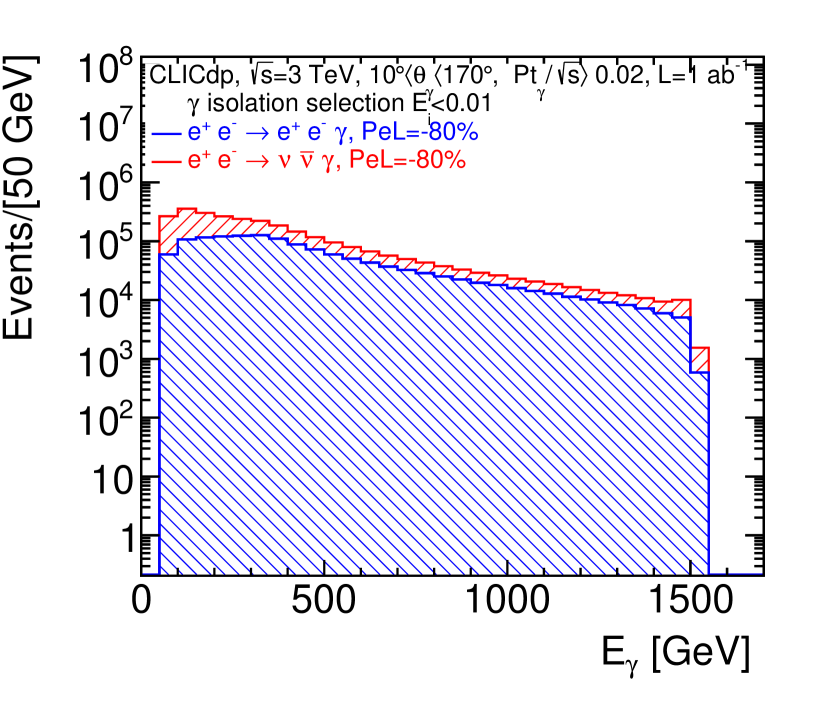
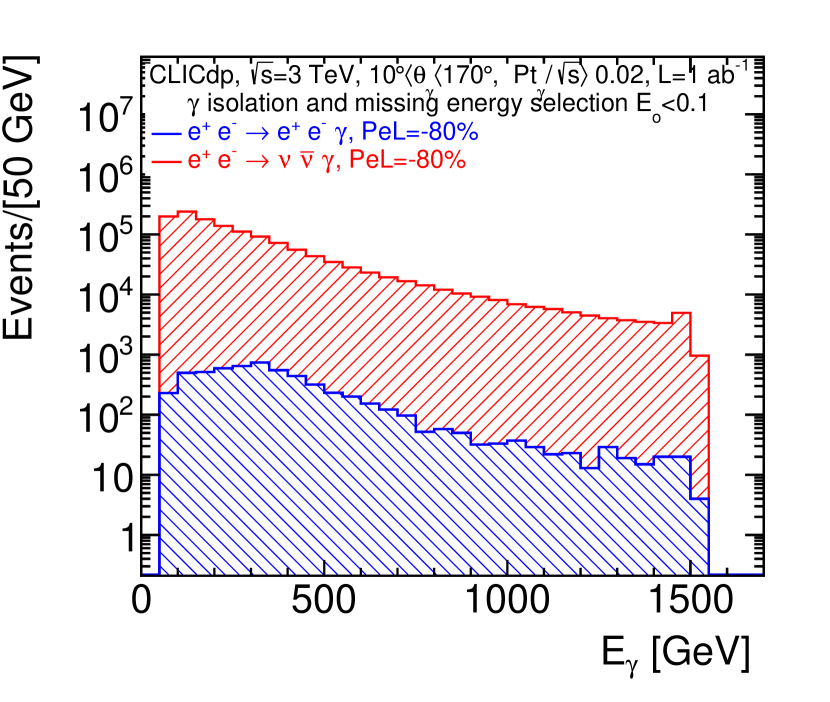
Figure 3(b) shows the photon energy distribution for events selected using the photon isolation selection and the missing energy selection .
Figure 4(a) shows for a right-handed 80% polarised beam (PeR), the stacked histograms of the photon energy distribution of () and () events selected using the photon isolation selection .
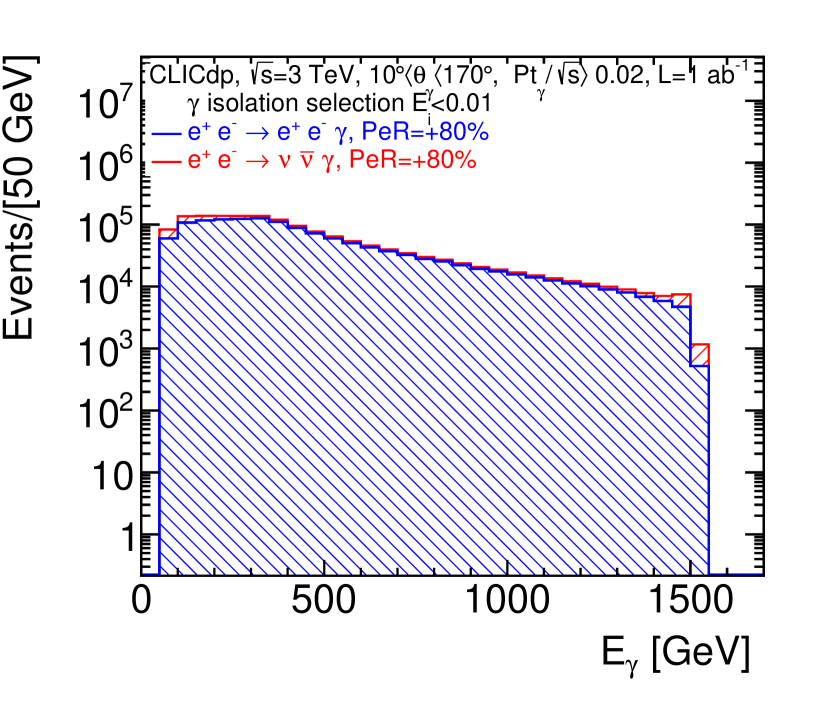
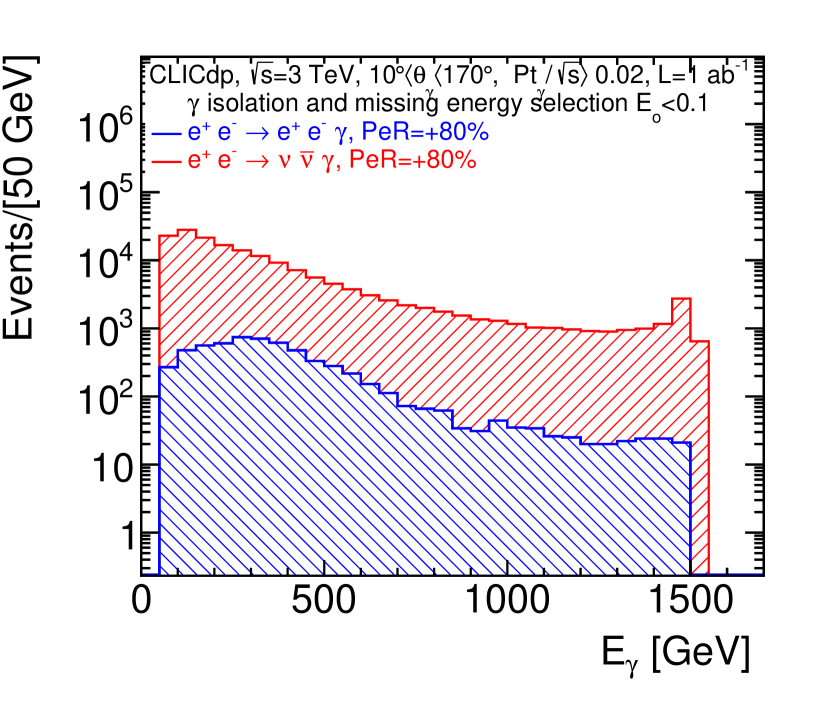
Figure 4(b) shows the photon energy distribution for events selected using the photon isolation selection and the missing energy selection .
2.2 95% confidence level upper limit cross section calculation
The photon energy distributions, with photon isolation and missing energy selection, shown in Figure 3(b) and 4(b), together with the systematic uncertainties listed in Table 4 are input to the 95% confidence level upper limit cross section calculation for the DM signal observation.
| Systematic error source | value |
|---|---|
| event selection | |
| event selection | |
| Luminosity measurement | |
| Polarisation measurement |
The 95% confidence level upper limit cross sections are computed using the ratio of confidences in the signal plus background to background hypothesis, so called “CLS” method [20]. For a counting experiment with a single channel
| (5) |
where is the number of background events and is the number of signal events. For the process X X , the angular distribution of the photon is independent of the process but the photon energy spectrum depends on the dark matter mass. To compute the 95% confidence level upper limit cross section as a function of the dark matter mass , for each value, the number of background events b is computed using
| (6) |
and are computed for right-handed, left-handed 80% polarised beams and without polarisation . The number of signal events excluded at 95% CL, , is obtained for >= 0.05. To derive the limits using the right-handed and left-handed polarised photon energy distributions, for each value, the ratio and the error are computed,
| (7) |
where and are the number of background events for left-handed and right-handed polarised beams, respectively. The ratio is computed using
| (8) |
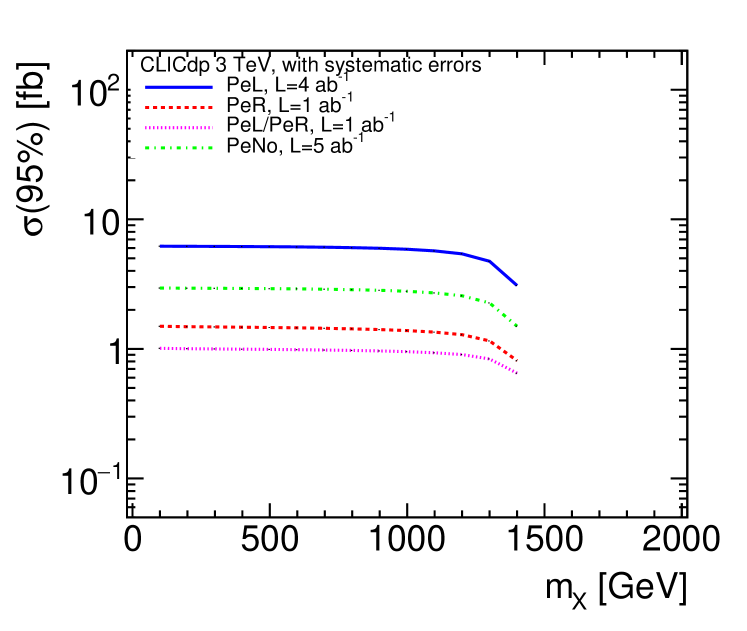
The expressions and are the number of background plus signal events for left-handed and right-handed polarised beams respectively and assuming the polarisation dependance of dark matter Simplified Models. The number of signal events excluded at 95% CL, , is obtained for . The 95% confidence level upper limit cross sections are = , where is the integrated luminosity corresponding to the polarisation condition. Figure 5 shows the 95% confidence level upper limit cross section as a function of the dark matter mass for different polarisation and luminisity conditions, left-handed 80% polarised beam, right-handed 80% polarised beam, using the ratios and for left-handed and right-handed 80% polarised beams and without polarisation. The lowest 95% confidence level upper limit cross section is obtained using the ratios and for left and right-handed polarised beams. The method using the ratios and is model dependant.
2.3 Exclusion limits in simplified dark matter models
In this study CLICdp focused on a subset of simplified dark matter models where the mediator is exchanged in the s-channel. The parameters of these models are the DM mediator Y type, vector (v) or axial-vector(a-v) or scalar(s), the mediator mass , the e-e-mediator vertex coupling , the DM mass , and the mediator-DM-DM vertex coupling . For the cross section calculation the mediator width is fixed to 10 GeV. Limits are derived in the plane using computed with . In the plane , in many points, the expected cross sections are computed. For each mediator mass , the limit in is the point where the cross section . To compute the expected signal cross section, in each mass point, requires generating events and applying the same event selection as for the radiavite neutrino events. This is very time consuming, therefore a simplified method was considered. In the simplified method the signal cross section is calculated using the beam spectrum, the ISR function, one (ME) photon on which the generator cuts are applied, but no ISR merging cut is applied. For the same points the signal cross section is also computed using the same procedure as for the radiative neutrino events. Applying the simplified method leads to cross sections which are are underestimated by 3% to 4% depending on the mass point. This leads to mass limits which are overestimated by 20 to 30 GeV. Figure 6(a) shows, in the mass plane , the exclusion limits computed for vector, axial-vector and scalar mediators with a coupling =1 and using the simplified cross section calculation. For a light WIMP mass the exclusion range extends up to 9 TeV, and WIMP masses close to half the centre-of-mass energy can be measured for a large range of mediator masses.
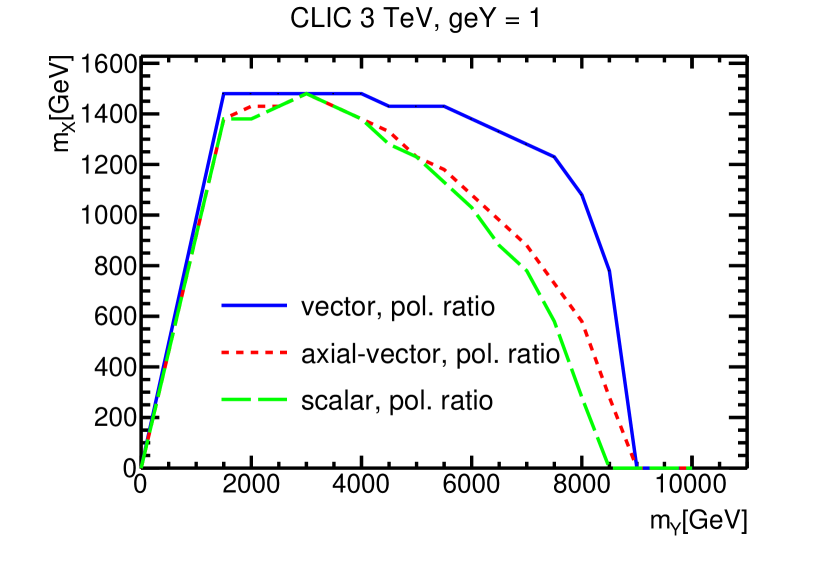
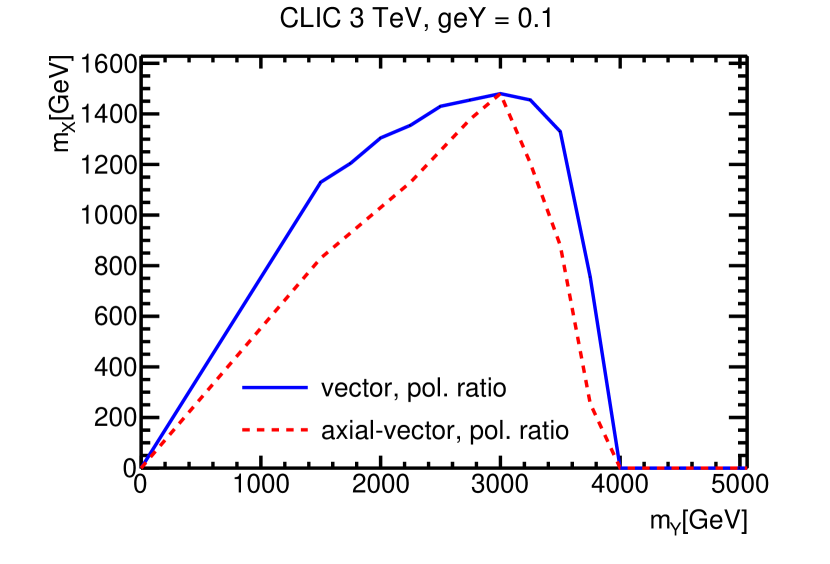
Figure 6(b) shows, in the mass plane , the exclusion limits computed for vector and axial-vector mediators with a coupling =0.1. For a light WIMP mass the exclusion range extends up to 4 TeV, and WIMP masses of 1 TeV can be measured for mediator masses up to 3.5 TeV.
3 Model discrimination and dark matter mass determination
The model discrimination study and dark matter mass determination is done using the simplified dark matter models with the following parameters:
-
•
DM mediator, v or a-v with =3.5 TeV and =10 GeV;
-
•
Coupling =1 or 0.5;
-
•
DM mass in the range between 200 GeV and 1.4 TeV;
-
•
Coupling =1.
As can be seen on Figure 6(b), a mediator mass =3.5 TeV is close to the exclusion limit, it leads to a challenging benchmark point.
3.1 Signal significance calculation
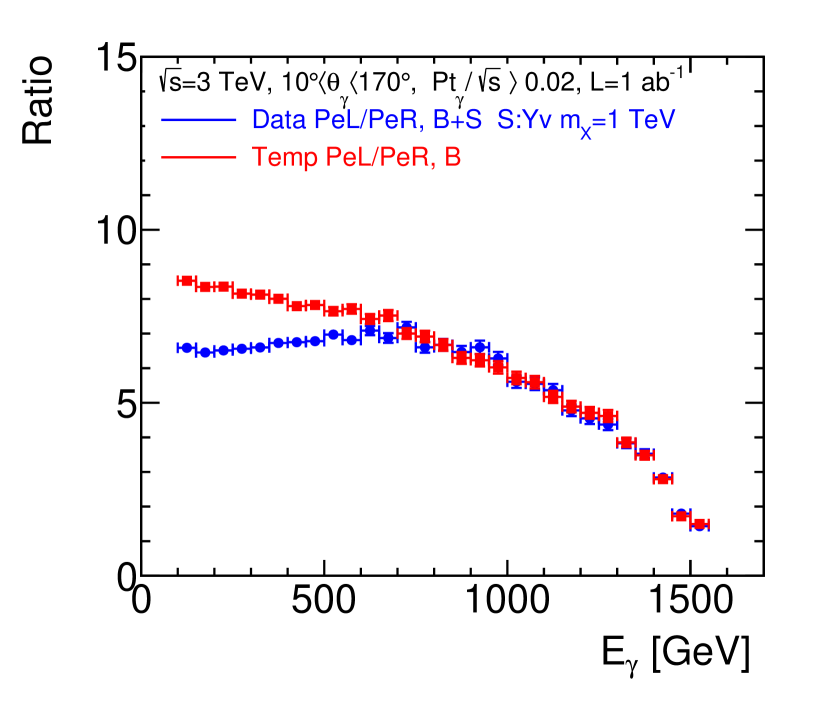
Figure 7(a) shows, for background events, the ratio of the photon energy distributions for left-handed polarised beam over right-handed polarised beam. It shows also, for pseudo data events (background plus signal), the ratio of the photon energy distributions for left-handed polarised beam over right polarised beam. The signal events correspond to a vector mediator of mass =3.5 TeV with a coupling =1 and a dark matter mass of 1 TeV.
| (9) |
where is the photon energy distribution of background events, and is the photon energy distribution of pseudo-data events.
From these two distributions, the energy distribution of the signal events is
| (10) |
For a discovery, the figure of merit is . For a counting experiment with a single channel, is computed in each bin using
| (11) |
where is the number of background events, , and is the number of signal plus background events, . The significance Z is derived
| (12) |
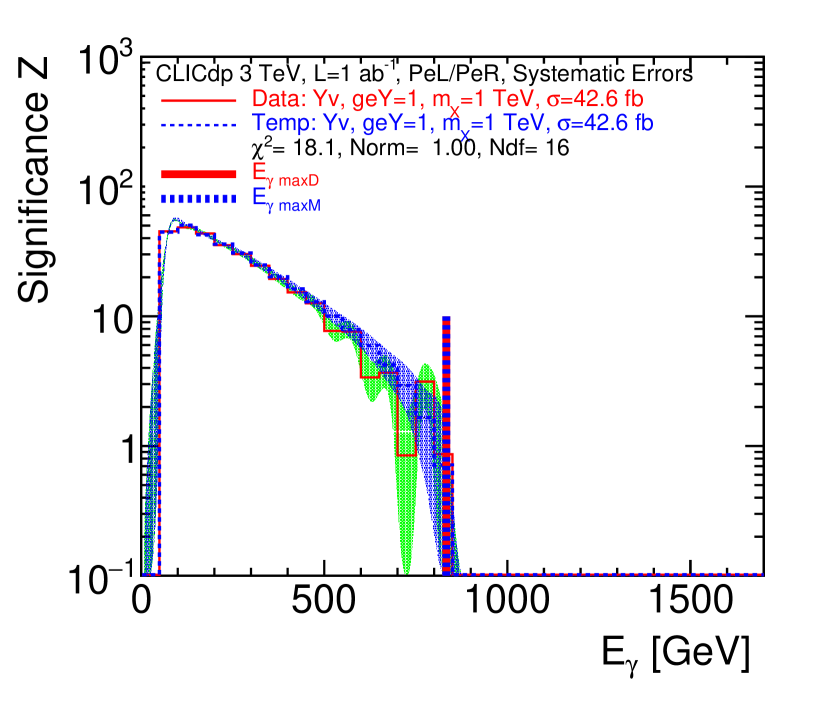
The uncertainty on the significance, , is obtained using Toy Monte Carlo events to generate the distribution ; a fit of is performed to extract . Using the same procedure, is computed for different templates (vector, axial-vector) coupling to DM with different DM masses. Figure 7(b) shows the significance as a function of for a pseudo data sample and a template sample corresponding to a vector mediator of mass =3.5 TeV with a coupling =1 and a dark matter mass of 1 TeV; the green band corresponds to . Figure 7(b) shows also the significance as a function of for a template sample corresponding to a vector mediator of dark matter mass 1 TeV and coupling =1. For the template energy distributions the statistics is larger, to reduce fluctuations. Before computing the significance distribution of the templates, the energy distributions are weighted to the expected luminosity. To compare the significance of the pseuso-data (ZData) and templates (ZTemp), a fit is performed with:
| (13) |
The fit is performed with the normalisation free (shape comparison) or with a normalisation using the pseudo-data and the template cross sections (absolute comparison).

3.2 fit calculation check
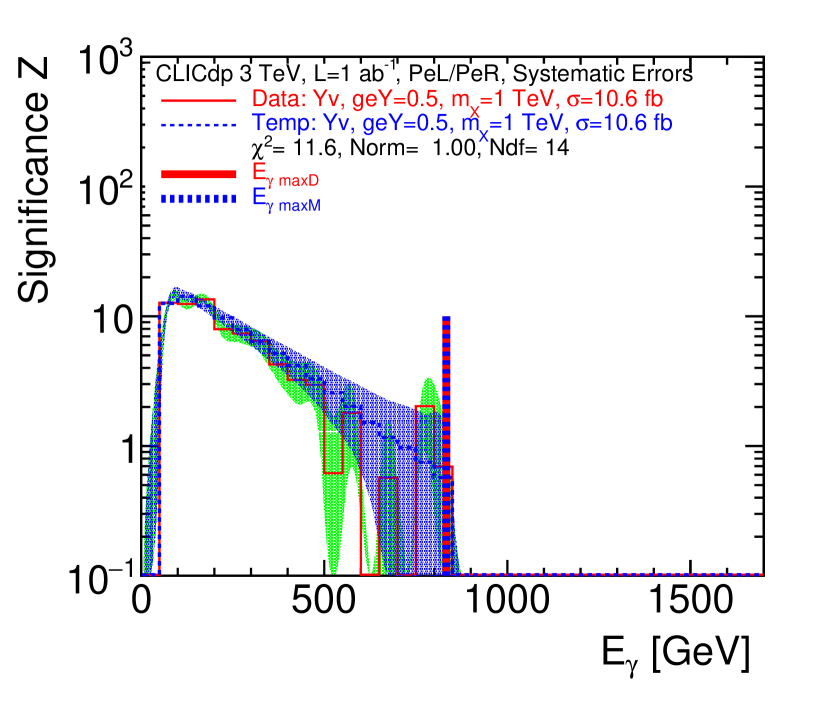
Figure 8(a) shows the significance as a function of for a pseudo-data sample and a template sample corresponding to a vector mediator coupling to a dark matter of mass 1 TeV. For both samples the coupling =1. The =1.13, is the number of degrees of freedom. Figure 8(b) shows the same distributions for pseudo-data and template samples with a coupling =0.5. For a coupling =0.5 the cross sections are 4 times lower, the =0.82. This check shows that the is stable with respect to cross section changes.
3.3 fit and model discrimination
Figure 9(a) shows the fit values as a function of the dark matter mass. The blue dotted lines correspond to values computed for vector mediator pseudo-data samples coupling to a dark matter mass of 1 TeV and vector mediator templates coupling to dark matter masses ranging between 200 GeV and 1.4 TeV. Ten vector mediators pseudo-data samples are generated with the same conditions. The blue full line corresponds to an average of the values of the ten samples. The error bars drawn for these points correspond to .
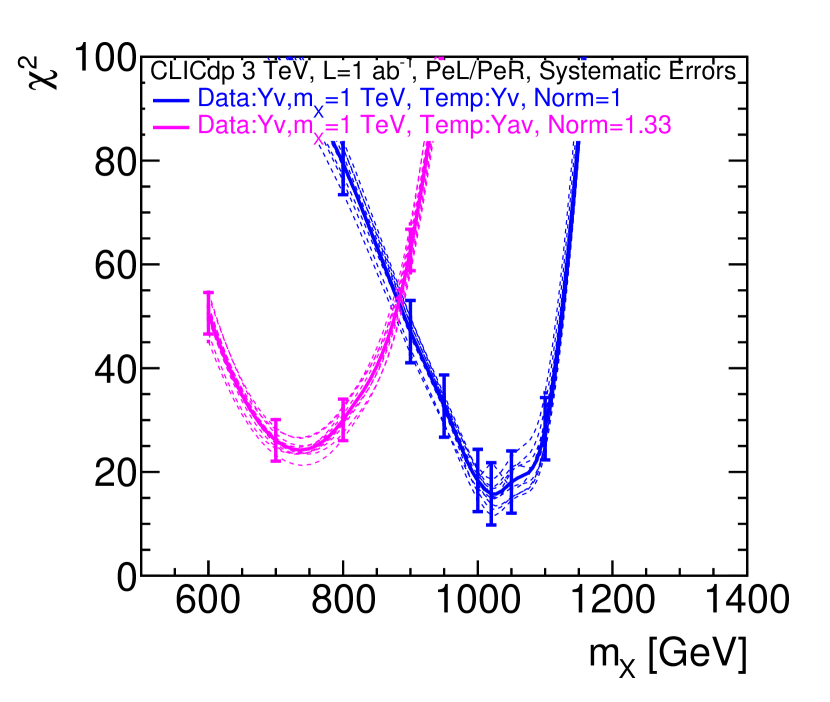
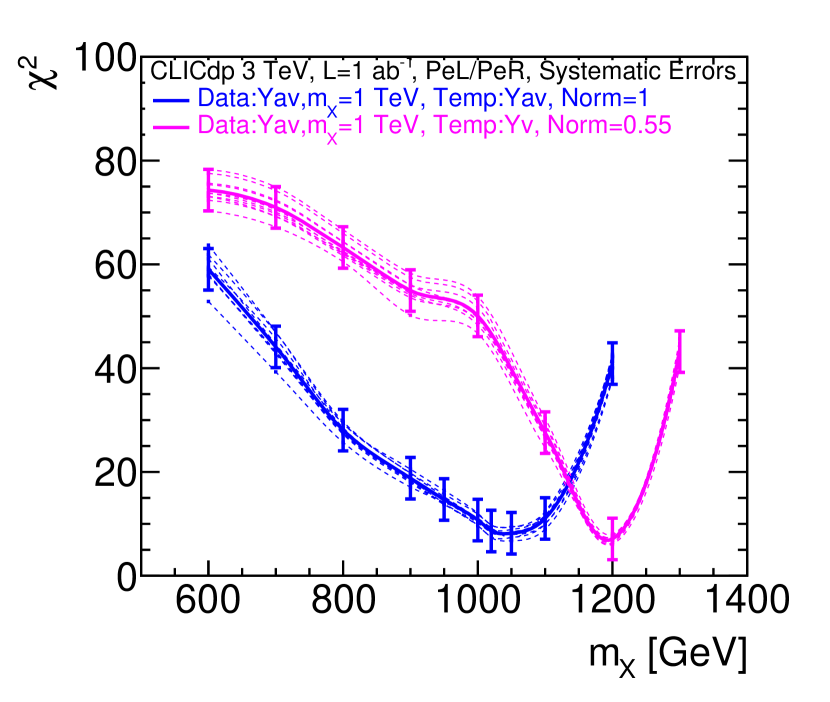
The minimum value is 18 and the normalisation value is 1 for around 1 TeV. The magenta dotted-lines correspond to values computed for vector mediator pseudo-data samples coupling to a dark matter mass of 1 TeV and axial-vector mediator templates coupling to dark matter masses ranging between 200 GeV and 1.4 TeV. Ten axial-vector mediators pseudo-data samples are generated with the same conditions. The magenta full line correspond to an average of the values of the ten samples. The minimum value is 25 and the normalisation value is 1.33 for around 750 GeV. For the pseudo-data sample and the template samples the coupling is =1. The smallest values corresponds to the right mediator type but the separation is too small to discriminate the vector-vector hypothesis from the vector-axial-vector hypothesis. Taking into account the normalisation allows discarding the vector-axial-vector hypothesis. Different statistical tests are available to compare the shape of the two distributions. The Kolmogorov-Smirnov test was also performed on the same distributions, it leads to the same conclusion, the shape comparison does not allow discriminating between different models. Figure 9(b) shows the same distributions. The blue line and dotted lines correspond to values computed for axial-vector mediator pseudo-data and template samples. The minimum value is 8.6 and the normalisation value is 1 for around 1 TeV. The magenta line and dotted-lines corresponds to a computed for an axial-vector mediator pseudo-data sample and vector mediator templates. The minimum value is 7.2 and the normalisation value is 0.55 for around 1.2 TeV. The values are too close to allow the discrimination between the axial-vector-vector hypothesis and the vector-vector hypothesis. Taking into account the normalisation allows discarding the vector-vector hypothesis.
3.4 fit and dark matter mass determination
Figure 10 shows the fit values as a function of the dark matter mass. The blue dotted line corresponds to a computed for vector mediator pseudo-data samples coupling to a dark matter mass of 1 TeV and vector mediator templates coupling to dark matter masses ranging between 200 GeV and 1.4 TeV. The ten vector mediators pseudo-data samples are all generated with the same conditions. The blue full line correspond to an average of the values of the ten samples. The error bars drawn for these points correspond to . The minimum value is 15.6 and the normalisation value is 1 for around 1 TeV.
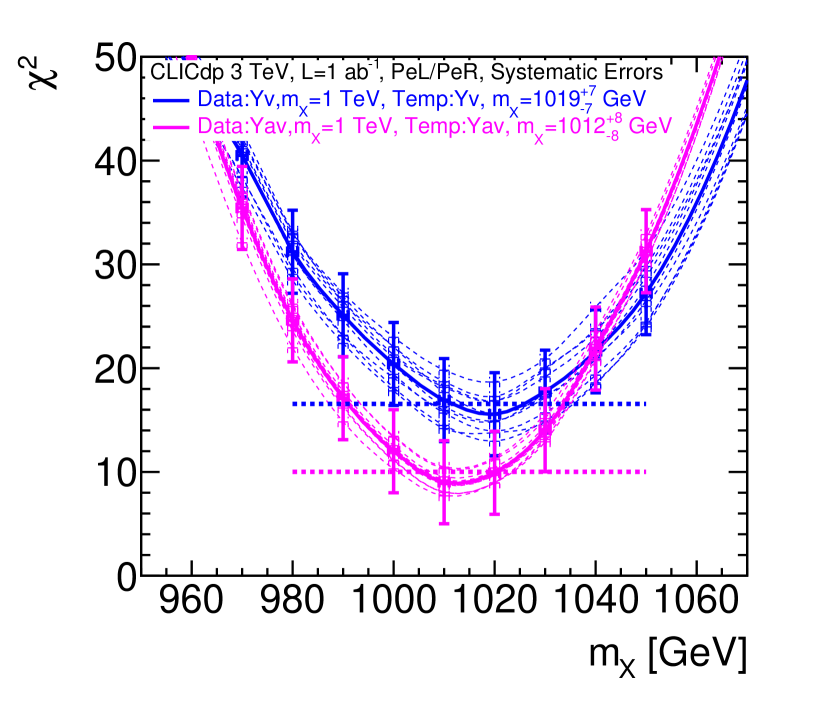
For the pseudo-data samples and the template samples the coupling is =1. The fit takes into account the shape of the distributions and the cross sections. The minimum value of the gives the mass of the dark matter, the uncertainty on the mass, , corresponds to a variation of 1. For the vector-vector hypothesis GeV.
The magenta dotted lines corresponds values computed for a axial-vector mediator pseudo-data samples coupling to a dark matter mass of 1 TeV and axial-vector mediator templates coupling to dark matter masses ranging between 200 GeV and 1.4 TeV. For the pseudo-data sample and the template samples the coupling is =1. Ten axial-vector mediator pseudo-data samples are generated with the same conditions. The magenta full line corresponds to an average of the values of the ten samples. The minimum value is 9.0 and the normalisation value is 1 for around 1 TeV. For the axial-vector-axial-vector hypothesis GeV.
4 Summary
To assess the CLIC physics potential for dark matter searches, the 95% confidence level upper limit on the cross section is computed as a function of the dark matter mass for different polarisation conditions. For simplified dark matter models, the lowest 95% confidence level upper limit cross section is obtained using the ratios and for left-handed and right-handed polarised beams. Using the 95% cross section as a function of the dark matter mass, exclusion limits are derived using dark matter Simplified Models. For a coupling =1 and a light WIMP mass the exclusion range extends up to 9 TeV. WIMP masses close to half the centre-of-mass energy can be measured for a large range of mediator masses. For a coupling =0.1 and a light WIMP mass the exclusion range extends up to 4 TeV, and WIMP masses of 1 TeV can be measured for mediator masses up to 3.5 TeV. To discriminate between different mediator hypotheses coupling to different DM masses, fits of the differential distribution of pseudo-data and templates of different mediators coupling to DM with different DM masses are performed. The fit is using the shape of the differential distribution of the significance and the cross sections. It allows also the determination of the dark matter mass and of the uncertainty on the mass. For a dark matter mass of 1 TeV the accuracy on the mass is 1%, without a statistically significant bias.
5 Acknowledgments
We are grateful to Daniel Schulte and Dominik Arominski for making available the , and e beam spectra at the various energies and to A. Wulzer for having designed and implemented the Simplified dark matter scalar model. This work benefited from services provided by the ILC Virtual Organisation, supported by the national resource providers of the EGI Federation. This research was done using resources provided by the Open Science Grid, which is supported by the National Science Foundation and the U.S. Department of Energy’s Office of Science.
References
- [1] Abramowicz H. et al.(CLICdp Collaboration) “Higgs Physics at the CLIC Electron-Positron Linear Collider” In Eur.Phys.J. C77, 2017, pp. 475 arXiv:1608.07538 [hep-ex]
- [2] Abramowicz H. et al.(CLICdp Collaboration) “Top-Quark Physics at the CLIC Electron-Positron Linear Collider” In JHEP 11, 2019, pp. 003 arXiv:1807.02441 [hep-ex]
- [3] A. Robson and P. Roloff “Updated CLIC luminosity staging baseline and Higgs coupling prospects”, 2018 arXiv:1812.01644 [hep-ex]
- [4] Heister A. et al.(ALEPH Collaboration) “Single photon and multiphoton production in collisions at up to 209 GeV” In Eur.Phys.J. C28, 2003, pp. 1
- [5] Abdallah J. et al.(DELPHI Collaboration) “Photon events with missing energy in collisions at = 130 GeV to 209 GeV” In Eur.Phys.J. C38, 2005, pp. 395
- [6] Achard P. et al.(L3 Collaboration) “Single photon and multiphoton events with missing energy in collisions at LEP” In Phys. Lett. B587, 2004, pp. 16
- [7] Abbiendi G et al.(OPAL Collaboration) “Photonic events with missing energy in collisions at = 189 GeV” In Eur.Phys.J. C18, 2000, pp. 253
- [8] M. Habermehl, M. Berggren and J. List “WIMP Dark Matter at the International Linear Collider” In Phys. Rev. D 101, 2020, pp. 075053
- [9] “Simplified Dark Matter Models” URL: http://feynrules.irmp.ucl.ac.be/wiki/DMsimp
- [10] Abdallah J. et al. “Simplified Models for Dark Matter Searches at the LHC”, 2016 arXiv:1506.03116 [hep-ph]
- [11] A. Wulzer “Private Communication”
- [12] W. Kilian, T. Ohl and J. Reuter “WHIZARD: Simulating Multi-Particle Processes at LHC and ILC” In Eur.Phys.J. C71, 2011, pp. 1742 arXiv:0708.4233 [hep-ph]
- [13] D. Schulte “Beam-beam simulations with GUINEA-PIG”, 1999
- [14] Kalinowski J. et al. “Simulating hard photon production with WHIZARD” In Eur.Phys.J. C80, 2020, pp. 634
- [15] “CLIC Conceptual Design Report: Physics and Detectors at CLIC”, CERN-2012-003, 2012 arXiv:1202.5940 [physics.ins-det]
- [16] Arominski D. et al. “A detector for CLIC: main parameters and performance”, 2018 arXiv:1812.07337 [physics.ins-det]
- [17] A. Sailer “Radiation and Background Levels in a CLIC Detector due to Beam-Beam Effects”
- [18] A. Sailer and A. Sapronov “High Energy Electron Reconstruction in the BeamCal”, 2017 arXiv:1702.06945 [hep-ex]
- [19] “ElectronEfficiency library” URL: https://github.com/FCALSW/ElectronEfficiency
- [20] A L Read “Modified frequentist analysis of search results (the CLS method)” In tech. rep., CERN-2000-005, 2000, pp. 81 URL: http://cds.cern.ch/record/451614/files/p81.pdf