SDD-FIQA: Unsupervised Face Image Quality Assessment with
Similarity Distribution Distance
Abstract
In recent years, Face Image Quality Assessment (FIQA) has become an indispensable part of the face recognition system to guarantee the stability and reliability of recognition performance in an unconstrained scenario. For this purpose, the FIQA method should consider both the intrinsic property and the recognizability of the face image. Most previous works aim to estimate the sample-wise embedding uncertainty or pair-wise similarity as the quality score, which only considers the information from partial intra-class. However, these methods ignore the valuable information from the inter-class, which is for estimating to the recognizability of face image. In this work, we argue that a high-quality face image should be similar to its intra-class samples and dissimilar to its inter-class samples. Thus, we propose a novel unsupervised FIQA method that incorporates Similarity Distribution Distance for Face Image Quality Assessment (SDD-FIQA). Our method generates quality pseudo-labels by calculating the Wasserstein Distance (WD) between the intra-class similarity distributions and inter-class similarity distributions. With these quality pseudo-labels, we are capable of training a regression network for quality prediction. Extensive experiments on benchmark datasets demonstrate that the proposed SDD-FIQA surpasses the state-of-the-arts by an impressive margin. Meanwhile, our method shows good generalization across different recognition systems.
1 Introduction
Face recognition is one of the well-researched areas of biometrics [8, 11, 4]. Under controlled conditions, the recognition system can usually achieve satisfactory performance. However, in some real-world applications, recognition systems need to work under unconstrained environments (e.g. surveillance camera and outdoor scenes), leading to significant degradation of recognition accuracy and unstable recognition performance. Many researchers make progress in improving recognition accuracy under varying conditions [4, 12], but sometimes the performance is still affected by the unpredictable environmental factors including pose, illumination, occlusion, and so on. To keep the performance of face recognition system stable and reliable, Face Image Quality Assessment (FIQA) has been developed to support the recognition system to pick out high-quality images or drop low-quality ones for stable recognition performance. [7, 1].
Existing FIQA methods can be roughly categorized into two types: analytics-based [7, 22, 27] and learning-based [1, 10, 23, 25, 29]. Analytics-based FIQA defines quality metrics by Human Visual System (HVS) and evaluates face image quality with handcrafted features, such as asymmetries of facial area [7], illumination intensity [22], and vertical edge density [27]. However, these approaches have to manually extract features for different quality degradations, and it is unrealistic to annotate all possible degradations manually. Thus, more researchers take effort into the learning-based approach, which aims to generate quality scores directly from the recognition model without human effort. The most critical part of these approaches is to establish the mapping function between image quality and recognition model. Aggarwal et al.[1] proposed a multi-dimensional scaling approach to map space characterization features to genuine quality scores. Hernandez-Ortega et al.[10] calculate the Euclidean distance of intra-class recognition embeddings as the quality score. Shi et al.[23] and Terhorst et al.[25] proposed to predict the variations of recognition embeddings as face image quality. Very recently, Xie et al.[29] proposed PCNet to evaluate face image quality via dynamically mining positive mated-pairs. Despite these learning-based methods make progress in FIQA, the performances are still unsatisfactory. Since they only consider the partial intra-class similarity or feature uncertainty from the recognition model and ignore the important information of inter-class similarity, which is the key factor for the recognizability of face image.
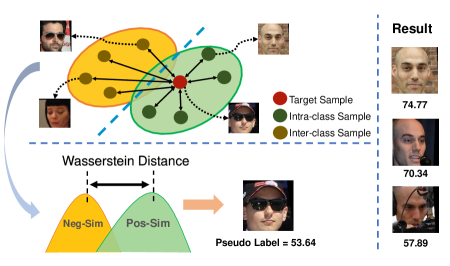
In this paper, we propose a novel learning-based method called SDD-FIQA. Regarding FIQA as a recognizability estimation problem, we first reveal the intrinsic relationship between the recognition performance and face image quality. Specifically, for the target sample, we employ a recognition model to collect its intra-class similarity distributions (Pos-Sim) and inter-class similarity distributions (Neg-Sim). Then the Wasserstein Distance (WD) between these two distributions is calculated as the quality pseudo-label. Finally, a quality regression network is trained under the constraint of Huber loss. Our method can accurately predict the face image quality score in a label-free manner. The main idea of SDD-FIQA is shown in Fig. 1, and the major contributions of this paper are as follows.
-
•
We are the first to consider both the intra-class and inter-class recognition similarity distributions for the FIQA problem.
-
•
We propose a new framework of estimating face image quality, which is label-free and closely linked with the recognition performance.
-
•
We are the first to evaluate the FIQA method by employing different recognition models for generalization evaluation, which is more consistent with the real-world applications.
-
•
The proposed SDD-FIQA outperforms the state-of-the-arts by a large margin in terms of accuracy and generalization on benchmark datasets.
2 Related Work
2.1 Analytics-based FIQA
Analytics-based FIQA approaches focus on analytically evaluating face image characteristics (such as pose, occlusion, and illumination) and define the quality metrics by HVS. For example, Gao et al.[7] proposed a facial symmetry-based method. They measure the facial asymmetries caused by non-frontal lighting and improper facial pose. This method can quantize the impact of pose and illumination while failing to generalize to other quality factors. Sellahewa and Jassim [22] proposed an adaptive approach. They estimate the illumination quality by comparing the pixel-wise similarity between the reference image and the distorted one. However, such a method is sensitive to the background and can only deal with the illumination influence on image quality. Wasnik et al.[27] evaluate the pose variation of face images based on vertical edge density and train a random forest model to predict the quality score. Their method requires a reference image, and the performance is not satisfactory under unconstrained conditions. Best-Rowden and Jain designed two FIQA methods with complete or partial human annotations [2]. However, human quality annotation is too labor-intensive and expensive to be applicable in practice.
2.2 Learning-based FIQA
Learning-based FIQA approaches aim to excavate the relationship between face image quality and recognition performance. Aggarwal et al.[1] were the first to propose the learning-based method. In their method, a space characterization features mapping model is constructed to predict the accuracy of recognition via multi-dimensional scaling. Wong et al.[28] proposed an efficient patch-based method to obtain a similarity probabilistic model for FIQA. Chen et al.[3] introduced a rank learning-based method. They use a ranking loss computed on multiple face images of an identity to train a network. Kim et al.[15] take advantage of two factors, including visual quality and mismatch degree between training and testing images to predict face image quality. However, these methods can only work well with face images under controlled conditions.
With the deep learning population, face representation using Deep Convolution Neural Network (DCNN) embedding has obtained impressive progress [21, 26, 12]. Researchers hope to directly estimate face image quality by DCNN embedding of face recognition. For example, Shi and Jain [23] proposed the Probabilistic Face Embedding (PFE) method. Their method estimates the variance of element-wise embedding features and then applies the variance to FIQA. Hernandez-Ortega et al.[10] designed FaceQnet-V0. It calculates the Euclidean distance between the target face image and the best selection within intra-class as quality annotation. Furthermore, they developed FaceQnet-V1 [9] by adding three available face recognition systems to calculate Euclidean distance for quality annotation. Terhorst et al.[25] proposed an unsupervised estimation of face image quality called SER-FIQ. They compute the mean Euclidean distance of the multiple embedding features from a recognition model with different dropout patterns as the quality score. Xie et al.[29] introduced the Predictive Confidence Network (PCNet). They apply pair-wise regression loss to train a DCNN for FIQA from intra-class similarity. Although these methods improve the versatility of FIQA by estimating the sample-wise uncertainty or computing pair-wise similarity, the relationship between intra-class and inter-class similarity has never been discovered, which is extremely important for the recognizability of face image.
3 The Proposed SDD-FIQA
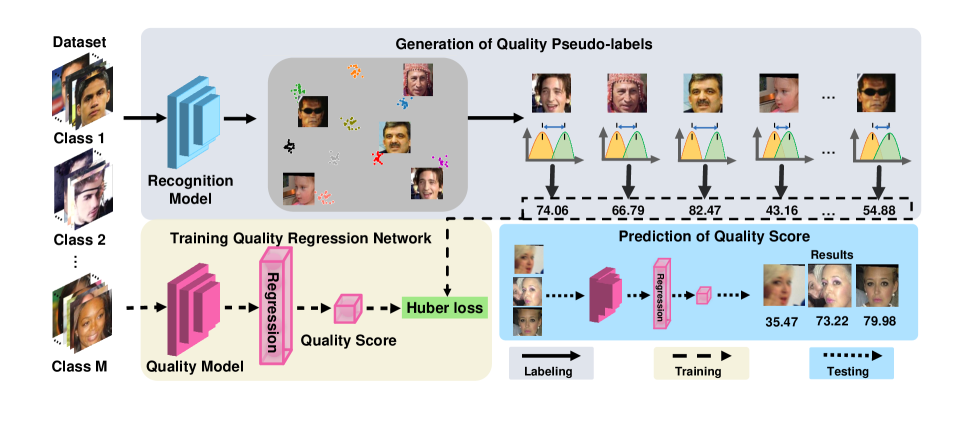
The framework of the proposed SDD-FIQA is shown in Fig. 2. Assume , , and denote the face image set, identity label set, and the recognition embedding set, respectively. We compose a triplet dataset . Let two samples from the same identity form a positive pair, two samples from different identities form a negative pair. For each training sample , we denote and as the similarity set of positive and negative pairs respectively, where denotes the cosine similarity between and .
3.1 Generation of Quality Pseudo-labels
In this section, we describe the relationship between the face image quality and the recognition performance. We prove that such relationship can be deduced from the Error Versus Reject Curve (EVRC), which is a widely used metric in FIQA [2, 9, 25]. Specifically, assume that and are the sets of all Pos-Sims and Neg-Sims, respectively. denotes the subset of with similarity less than a threshold . denotes the subset of with similarity greater than the threshold , where . Then, False Match Rate (FMR) and False No-Match Rate (FNMR) can be respectively defined as
| (1) |
and
| (2) |
where denotes the set cardinality. Assume is the subset of with percentage highest quality face samples. EVRC aims to measure the relationship between and the FNMR of at a fixed FMR. Note that since the FMR is required to be fixed, the threshold has to keep changing with respect to . According to the EVRC metric, we find that the image quality can be described by the gradient of the FNMR decrement. In other words, if a sample is dropped from the face dataset, the more sharply FNMR decreases, the lower quality of has. Inspired by this, we propose to compute the FNMR difference as the quality pseudo-label of (denoted as ) by
| (3) |
where is the subset of excluding , and denote the thresholds for and , respectively. We can see that for the given , is only determined by and the threshold . Since the FMR is fixed, the threshold can be calculated as , where denotes the inverse function of . Objectively speaking, the actual quality of is independent of the FMR. However, by Eq. (3), we can obtain only one empirical quality score under a fixed FMR. From a statistical point of view, we should take the expectation of on the FMR to approach the actual quality score. Meanwhile, we can regard the FMR as a random variable uniformly distributed over [0, 1]. Therefore, can be reformulated as
| (4) | ||||
By substituting Eq. (2) into Eq. (4), we obtain
| (5) | ||||
According to our definition, it holds that and . For a given dataset , both and are independent of the sample . Therefore, the computation of Eq. (5) is uniquely determined by and . Then Eq. (5) can be simplified to
| (6) |
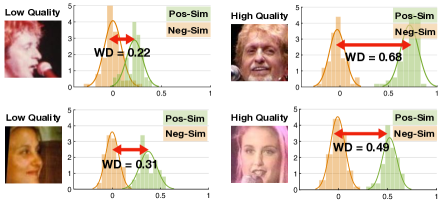
where is the mapping function from and to . In the following, we discover that the FIQ can be well described by SDD. Such discover can also be explained intuitively. For example, a high-quality face image is always easy to be recognized. That means it is close to the intra-class samples and far from inter-class samples. In other words, the distance between the Pos-Sim and the Neg-Sim is large. Inversely, the low-quality face image produces a small SDD, as shown in \figrefMotivation. Based on the above analysis, we propose to take advantage of the Wasserstein metric to measure SDD as , which is expressed by
| (7) | ||||
where denotes Wasserstein distance, denotes the set of all joint distribution whose marginals are respectively and .
According to the international biometric quality standard ISO/IEC 29794-1:2016 [14], the face quality pseudo-label should be regularized in the range [0,100] in which 100 and 0 indicate the highest and lowest quality pseudo-labels, respectively. Hence, the is obtained by
| (8) |
where
| (9) |
where = , and .
3.2 Acceleration of Label Generation
For a face dataset of size , if the pair-wise similarity is taken into consideration overall dataset, the time complexity of is . This is high computation when encountering a large-scale dataset. To reduce the computational complexity, we randomly select positive pairs and negative pairs, where is set to be even and . Then is computed times, and Eq. (8) can be transformed to
| (10) |
where and are the sampled similarities of positive and negative pairs within pairs, respectively. Note that for each sample, since and are set to be constant, the computational complexity of Eq. (10) is , where is at least one order lower than . Therefore, the generation of quality annotation over all dataset achieves time complexity. Suppose that is a noiseless estimation of and a noise variable is induced in each sampling. Then Eq. (10) can be rewritten as
| (11) |
Note that can be regarded as the difference between and . According to the probability theory [18], we have . Hence, Eq. (10) is an unbiased estimation of Eq. (8).
3.3 Quality Regression Network
With our generated quality pseudo-labels, we can train an individual FIQA model, which no longer resorts to the recognition system to output quality score. To match the predictions of the quality regression network with the recognition system, knowledge-transfer is applied during training. Specifically, we first remove the embedding and classification layers from a pre-trained face recognition model. Then we employ a dropout operator with 0.5 probability to avoid overfitting during training, and add a fully connected layer in order to output the quality score for FIQA. Finally, we use the Huber loss function [13] to train the quality regression network, which is given by
| (12) | ||||
where is the location parameter, and denote the network parameters and the regression output, respectively.
Compared with existing FIQA methods, our method considers both Pos-Sim and Neg-Sim overall dataset, which is more amicable to recognition performance. Moreover, our approach is unsupervised without any human annotation.
4 Experiments
4.1 Experimental Setup
Datasets. The refined MS-Celeb-1M (MS1M) [4] is utilized as the training data of the recognition model and quality regression model. Besides, CASIA-WebFace (CASIA) [5] is adopted to train the recognition model for evaluating the generalization of our method. During testing, LFW [11], Adience [6], UTKFace [32], and IJB-C [16] are employed as test datasets. Note that IJB-C is one of the most challenging public benchmarks and contains large variations in pose, expression, illumination, blurriness, and occlusion.
| LFW | FMR= | FMR= | FMR= | Avg | |
| Analytics Based | BRISQUE [17] | 0.0321 | 0.0953 | 0.2579 | 0.1284 |
| BLIINDS-II [19] | 0.1755 | 0.0923 | 0.2270 | 0.1649 | |
| PQR [30] | 0.1921 | 0.2952 | 0.3519 | 0.2797 | |
| Learning Based | FaceQnet-V0 [10] | 0.4535 | 0.4955 | 0.5399 | 0.4963 |
| FaceQnet-V1 [9] | 0.4417 | 0.5471 | 0.6167 | 0.5352 | |
| PFE [23] | 0.4814 | 0.5057 | 0.5895 | 0.5255 | |
| SER-FIQ [25] | 0.5669 | 0.6675 | 0.7469 | 0.6604 | |
| PCNet [29] | 0.6975 | 0.7275 | 0.7197 | 0.7149 | |
| SDD-FIQA (Our) | 0.8284 | 0.7993 | 0.8170 | 0.8149 | |
| Adience | FMR= | FMR= | FMR= | Avg | |
| Analytics Based | BRISQUE [17] | 0.2686 | 0.2056 | 0.2353 | 0.2365 |
| BLIINDS-II [19] | 0.1723 | 0.1634 | 0.1565 | 0.1640 | |
| PQR [30] | 0.2454 | 0.2102 | 0.1962 | 0.2173 | |
| Learning Based | FaceQnet-V0 [10] | 0.4756 | 0.5021 | 0.4735 | 0.4837 |
| FaceQnet-V1 [9] | 0.3809 | 0.4613 | 0.4350 | 0.4257 | |
| PFE [23] | 0.5490 | 0.6046 | 0.5556 | 0.5698 | |
| SER-FIQ [25] | 0.5009 | 0.5539 | 0.4384 | 0.4977 | |
| PCNet [29] | 0.5224 | 0.5597 | 0.5255 | 0.5359 | |
| SDD-FIQA (Our) | 0.5962 | 0.6307 | 0.5719 | 0.5996 | |
| IJB-C | FMR= | FMR= | FMR= | Avg | |
| Analytics Based | BRISQUE [17] | 0.2943 | 0.3292 | 0.4216 | 0.3484 |
| BLIINDS-II [19] | 0.3641 | 0.3656 | 0.3806 | 0.3701 | |
| PQR [30] | 0.4991 | 0.4979 | 0.5230 | 0.5067 | |
| Learning Based | FaceQnet-V0 [10] | 0.6149 | 0.6047 | 0.6330 | 0.6175 |
| FaceQnet-V1 [9] | 0.6343 | 0.6332 | 0.6552 | 0.6409 | |
| PFE [23] | 0.6899 | 0.6964 | 0.7306 | 0.7056 | |
| SER-FIQ [25] | 0.6115 | 0.5976 | 0.6135 | 0.6075 | |
| PCNet [29] | 0.7053 | 0.7055 | 0.7363 | 0.7157 | |
| SDD-FIQA (Our) | 0.7209 | 0.7239 | 0.7539 | 0.7329 | |
Face recognition models. Different face recognition models are employed, containing ResNet50 trained on MS1M (ResNet50-MS1M), ResNet101 trained on MS1M (ResNet101-MS1M), and ResNet101 trained on CASIA (ResNet101-CASIA). All recognition models are learned by ArcFace with 512-dimensional embedding features [4].
Implementation details. Our network is built on the PyTorch framework and on a machine equipped with eight NVIDIA Tesla P40 GPUs. Face images are all aligned, scaled, and cropped to 112 112 pixels by MTCNN [31]. During the training stage, all networks are learned with Adam optimizer with weight decay . The initial learning rate is and drops by a factor of every 5 epochs. We set and in Eq. (10) and the parameter is set to 1 in Eq. (12).
Evaluation protocols. As done in [2, 10, 9, 25, 20], we use EVRC to evaluate the performance of FIQA methods . Moreover, we introduce Area Over Curve (AOC) to quantify the EVRC results, which is defined by
| (13) |
where denotes the FNMR at , is the ratio of unconsidered images, and denote lower and upper bounds and are set to be 0 and 0.95 in our experiments, respectively.
4.2 Results & Analysis
The proposed SDD-FIQA method is compared with eight state-of-the-arts covering analytics-based methods (e.g. BRISQUE [17], BLIINDS-II [19], and PQR [30]) and learning-based FIQA methods (e.g. FaceQnet-V0 [10], FaceQnet-V1 [9]111https://github.com/uam-biometrics/FaceQnet., PFE [23]222https://github.com/seasonSH/Probabilistic-Face-Embeddings., SER-FIQ (same model)333https://github.com/pterhoer/FaceImageQualit., [25], and PCNet [29]). All the compared methods are reproduced following their paper settings or using their released code directly. In the following, we compare the proposed SDD-FIQA with competitors under the same recognition model setting and the cross recognition model setting to verify the FIQA performance and generalization. We carry out comprehensive experiments to justify the superiority of our SDD-FIQA in terms of the quality weighting improvement of set-based face recognition verification [29], unbiasedness of bias factors [24]. Finally, we also implement ablation study to demonstrate the effectiveness of each key components of our method.
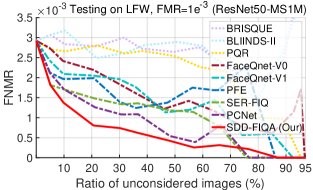
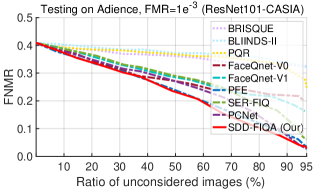
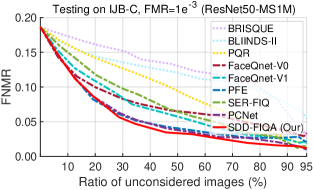
4.2.1 Same Recognition Model Performance
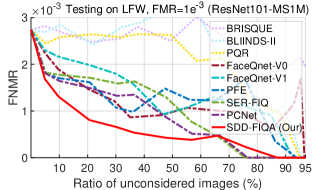
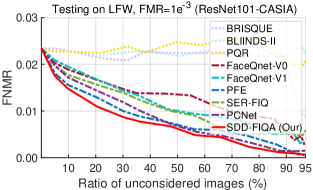
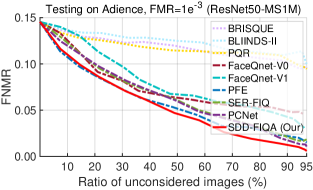
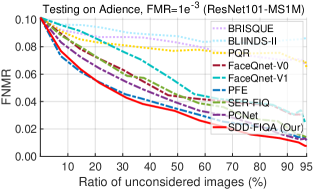
In this part, we follow [25] to evaluate the performance under the same recognition model. ResNet50-MS1M is selected to generate quality pseudo-labels and training quality regression network. As shown in Fig. 4, the FNMR of SDD-FIQA sharply decreases with the increase of the ratio of unconsidered images and outperforms all the compared methods by a large margin. Moreover, we also report the AOC results in Tab. 1. The results show that our SDD-FIQA improves the best competitor by 13.9% for LFW, 5.2% for Adience, and 2.4% for IJB-C in terms of the average (Avg) performance.
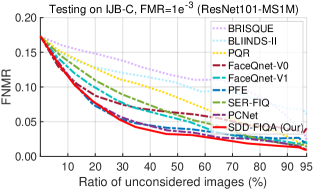
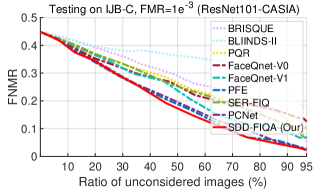
4.2.2 Cross Recognition Model Performance
In real-world applications, the recognition models for training and testing may not be the same. To verify the generalization of the proposed SDD-FIQA, we perform the cross recognition model experiment with two settings: 1) First employ ResNet50-MS1M for generating quality pseudo-labels and training quality regression network, and then adopt ResNet101-MS1M as the deployed recognition model for testing; 2) First employ ResNet50-MS1M for generating quality pseudo-labels and training quality regression network, and then adopt ResNet101-CASIA as the deployed recognition model for testing. To the best of our knowledge, we are the first to evaluate the generalization of FIQA methods.
The EVRC results are shown in Fig. 4 and the AOC results are reported in Tab. 3. Fig. 4 (b), (e) and (h) de- monstrate the results on the first cross model setting and Fig. 4 (c), (f) and (i) show the results on the second cross model setting. We can see that SDD-FIQA performs better than all the compared methods on LFW, Adience, and IJB-C. Moreover, The gap is enlarged with the increase of the ratio of unconsidered images. The results in Tab. 3 also show that SDD-FIQA achieves over 17.5% on LFW, 6.5% on Adience, and 2.7% on IJB-C higher accuracy than the best competitor in terms of the Avg AOC performance. Tab. 4 demonstrates that SDD-FIQA outperforms the best competitor by 8.3% on LFW, 3.7% on Adience, and 1.1% on IJB-C, respectively. The above results demonstrate that the proposed SDD-FIQA has better generalization than counterparts.
4.2.3 Set-based Verification with Quality Weighting
We perform the set-based verification on IJB-C dataset to verify the face quality impact in terms of the recognition performance. Specifically, as described in [29], similarities are collected by set-to-set mapping, in which each set consists of a variable number of images or video frames from different sources. Then the set descriptor is calculated as a weighted average of individual faces by , where denotes the identity corresponding to . We evaluate the True Accept Rate (TAR) scores under different FMR thresholds following [29]. The set-based verification results are reported in Tab. 2. The results show that the quality weight of our method is more beneficial to verification performance.
| LFW | FMR= | FMR= | FMR= | Avg | |
| Analytics Based | BRISQUE [17] | 0.0700 | 0.1200 | 0.1779 | 0.1227 |
| BLIINDS-II [19] | 0.2035 | 0.2004 | 0.2056 | 0.2032 | |
| PQR [30] | 0.3508 | 0.2657 | 0.2995 | 0.3053 | |
| Learning Based | FaceQnet-V0 [10] | 0.5277 | 0.5757 | 0.5707 | 0.5580 |
| FaceQnet-V1 [9] | 0.5002 | 0.5158 | 0.5901 | 0.5354 | |
| PFE [23] | 0.5402 | 0.5587 | 0.5828 | 0.5606 | |
| SER-FIQ [25] | 0.6027 | 0.6401 | 0.7011 | 0.6480 | |
| PCNet [29] | 0.6774 | 0.6915 | 0.6681 | 0.6790 | |
| SDD-FIQA (Our) | 0.8181 | 0.7881 | 0.7874 | 0.7979 | |
| Adience | FMR= | FMR= | FMR= | Avg | |
| Analytics Based | BRISQUE [17] | 0.2773 | 0.2097 | 0.2412 | 0.2428 |
| BLIINDS-II [19] | 0.1425 | 0.1416 | 0.2660 | 0.1834 | |
| PQR [30] | 0.2697 | 0.2322 | 0.2601 | 0.2540 | |
| Learning Based | FaceQnet-V0 [10] | 0.4380 | 0.4874 | 0.4837 | 0.4697 |
| FaceQnet-V1 [9] | 0.3475 | 0.4196 | 0.4721 | 0.4131 | |
| PFE [23] | 0.5130 | 0.6168 | 0.5909 | 0.5736 | |
| SER-FIQ [25] | 0.4763 | 0.5163 | 0.4768 | 0.4898 | |
| PCNet [29] | 0.4959 | 0.5694 | 0.5630 | 0.5428 | |
| SDD-FIQA (Our) | 0.5563 | 0.6415 | 0.6365 | 0.6114 | |
| IJB-C | FMR= | FMR= | FMR= | Avg | |
| Analytics Based | BRISQUE [17] | 0.2745 | 0.3461 | 0.4003 | 0.3403 |
| BLIINDS-II [19] | 0.3819 | 0.3915 | 0.4074 | 0.3936 | |
| PQR [30] | 0.5124 | 0.5110 | 0.5485 | 0.5240 | |
| Learning Based | FaceQnet-V0 [10] | 0.6240 | 0.6022 | 0.6445 | 0.6236 |
| FaceQnet-V1 [9] | 0.6399 | 0.6376 | 0.6455 | 0.6410 | |
| PFE [23] | 0.6790 | 0.6910 | 0.7239 | 0.6980 | |
| SER-FIQ [25] | 0.6134 | 0.6044 | 0.6473 | 0.6217 | |
| PCNet [29] | 0.7016 | 0.7031 | 0.7280 | 0.7109 | |
| SDD-FIQA (Our) | 0.7160 | 0.7243 | 0.7500 | 0.7301 | |
4.2.4 Investigation of Bias Factors
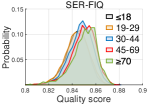
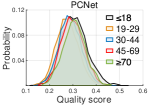
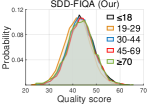
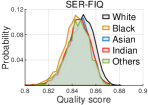
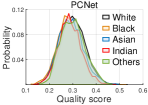
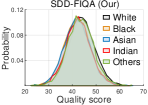
As done in [24], we also implement an experiment to investigate whether there is a significant correlation between the quality score and the bias factors such as age and race. The investigation results on the UTKFace dataset are shown in Fig. 5. It is known that the greater the distance between the different bias factor distributions is, the stronger correlation between the predicted quality scores and the face image bias factors. We can find that the quality scores predicted by our SDD-FIQA have a smaller bias than the SER-FIQ and PCNet methods in terms of the age and race factors. This investigation further proves that our SDD-FIQA is more reliable and robust than the stat-of-the-arts.
4.2.5 Ablation Study
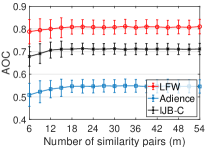
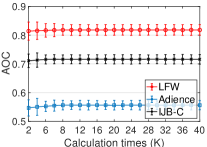
Parametric sensitivity. To confirm the parametric sensitivity of SDD-FIQA, we evaluate the AOC results with different hyper-parameters on the three benchmark datasets, which is shown in Fig. 7. To be specific, we fix and vary from 6 to 54 to select a proper value of in the first experiment. Then we fix and vary from 2 to 40 to determine the suitable value of in the second experiment. All experiments are performed on ResNet101-MSIM as the deployed recognition model under FMR=. We can notice that with the increases of and , the AOC stably increases and converges until 24 for the number of similarity pairs and 12 for calculation times. Thus in our experiments, and are set to 24 and 12, respectively.

Similarity distribution information comparison. To confirm the efficacy of utilizing both positive pairs and negative pairs, we report the EVRC results obtained by three different generation schemes of quality pseudo-labels: 1) only using positive pairs similarity distribution information (Pos-Only) by setting the to 1 in Eq. (8), 2) only using negative pairs similarity distribution information (Neg-Only) by setting the to -1 in Eq. (8), and 3) using the similarity distribution distance between the positive pairs and negative pairs (SDD-FIQA). By observing the curves in Fig. 6, we can see that utilizing both intra-class and inter-class information can achieve the best result, and only using intra-class information achieves a better result than only using inter-class information. It is worth mentioning that Neg-Only can also reduce FNMR, which proves the fact that the inter-class information is also effective to FIQA.
| LFW | FMR= | FMR= | FMR= | Avg | |
| Analytics Based | BRISQUE [17] | 0.0689 | 0.0976 | 0.1870 | 0.1178 |
| BLIINDS-II [19] | -0.0065 | 0.0557 | 0.2277 | 0.0923 | |
| PQR [30] | 0.1771 | 0.0213 | 0.0849 | 0.0944 | |
| Learning Based | FaceQnet-V0 [10] | 0.5454 | 0.4635 | 0.4649 | 0.4913 |
| FaceQnet-V1 [9] | 0.5938 | 0.5174 | 0.4842 | 0.5318 | |
| PFE [23] | 0.6381 | 0.6500 | 0.6090 | 0.6324 | |
| SER-FIQ [25] | 0.6212 | 0.5413 | 0.4962 | 0.5529 | |
| PCNet [29] | 0.6629 | 0.6398 | 0.6079 | 0.6369 | |
| SDD-FIQA (Our) | 0.7395 | 0.7001 | 0.6296 | 0.6898 | |
| Adience | FMR= | FMR= | FMR= | Avg | |
| Analytics Based | BRISQUE [17] | 0.1551 | 0.1398 | 0.1489 | 0.1479 |
| BLIINDS-II [19] | 0.1163 | 0.1037 | 0.1337 | 0.1179 | |
| PQR [30] | 0.1559 | 0.1327 | 0.1140 | 0.1342 | |
| Learning Based | FaceQnet-V0 [10] | 0.4244 | 0.3271 | 0.2840 | 0.3452 |
| FaceQnet-V1 [9] | 0.4283 | 0.3136 | 0.2524 | 0.3314 | |
| PFE [23] | 0.5730 | 0.4392 | 0.3154 | 0.4425 | |
| SER-FIQ [25] | 0.4529 | 0.3327 | 0.2826 | 0.3561 | |
| PCNet [29] | 0.5178 | 0.3935 | 0.2962 | 0.4025 | |
| SDD-FIQA (Our) | 0.5790 | 0.4535 | 0.3443 | 0.4589 | |
| IJB-C | FMR= | FMR= | FMR= | Avg | |
| Analytics Based | BRISQUE [17] | 0.4014 | 0.3680 | 0.3769 | 0.3821 |
| BLIINDS-II [19] | 0.3202 | 0.2276 | 0.2920 | 0.2799 | |
| PQR [30] | 0.4747 | 0.4047 | 0.3304 | 0.4033 | |
| Learning Based | FaceQnet-V0 [10] | 0.5469 | 0.4212 | 0.3803 | 0.4495 |
| FaceQnet-V1 [9] | 0.5411 | 0.4742 | 0.3983 | 0.4712 | |
| PFE [23] | 0.6674 | 0.5512 | 0.4848 | 0.5678 | |
| SER-FIQ [25] | 0.5453 | 0.4276 | 0.4190 | 0.4640 | |
| PCNet [29] | 0.6537 | 0.5379 | 0.4619 | 0.5512 | |
| SDD-FIQA (Our) | 0.6768 | 0.5628 | 0.4832 | 0.5743 | |
5 Conclusion
This paper proposes a novel FIQA approach called SDD-FIQA, which considers recognition Similarity Distribution Distance (SDD) as face image quality annotation. The novelties of our algorithm are three-fold: First, we are the first to consider the FIQA as a recognizability estimation problem. Second, we propose a new framework to map the intra-class and inter-class similarity to quality pseudo-labels via the Wasserstein metric, which is closely related to the recognition performance. Third, an efficient implementation of SDD is developed to speed up the label generation and reduce the time complexity from to . Compared with existing FIQA methods, the proposed SDD-FIQA shows better accuracy and generalization.
References
- [1] G. Aggarwal, S. Biswas, P. J. Flynn, and K. W. Bowyer. Predicting performance of face recognition systems: an image characterization approach. In Proceedings of IEEE Conference on Computer Vision and Pattern Recognition Workshop (CVPRW), pages 52–59, 2011.
- [2] L. Best-Rowden and A. K. Jain. Learning face image quality from human assessments. IEEE Transactions on Information Forensics and Security, 13(12):3064–3077, 2018.
- [3] J. Chen, Y. Deng, G. Bai, and G. Su. Face image quality assessment based on learning to rank. IEEE Signal Processing Letters, 22(1):90–94, 2015.
- [4] J. Deng, J. Guo, N. Xue, and S. Zafeiriou. Arcface: Additive angular margin loss for deep face recognition. In Proceedings of IEEE Conference on Computer Vision and Pattern Recognition (CVPR), pages 4690–4699, 2019.
- [5] Y. Dong, Z. Lei, S. Liao, and S. Z. Stan. Learning face representation from scratch. arXiv preprint arXiv:1411.7923, 2014.
- [6] E. Eidinger, R. Enbar, and T. Hassner. Age and gender estimation of unfiltered faces. IEEE Transactions on Information Forensics and Security, 9(12):2170–2179, 2014.
- [7] X. Gao, S. Z. Li, R. Liu, and P. Zhang. Standardization of face image sample quality. In Proceedings of International Conference on Biometrics (ICB), pages 242–251, 2007.
- [8] X. He, S. Yan, Y. Hu, P. Niyogi, and H.-J. Zhang. Face recognition using laplacianfaces. IEEE Transactions on Pattern Analysis and Machine Intelligence, 27(3):328–340, 2005.
- [9] J. Hernandez-Ortega, J. Galbally, J. Fierrez, and L. Beslay. Biometric quality: review and application to face recognition with faceqnet. arXiv:2006.03298v2, 2020.
- [10] J. Hernandez-Ortega, J. Galbally, J. Fierrez, R. Haraksim, and L. Beslay. Faceqnet: Quality assessment for face recognition based on deep learning. In Proceedings of International Conference on Biometrics (ICB), pages 1–8, 2019.
- [11] G. Huang, M. Mattar, T. Berg, and E. Learned-Miller. Labeled faces in the wild: A database for studying face recognition in unconstrained environments. In Workshop on Faces in ’Real-Life’ Images: Detection, Alignment, and Recognition, 2008.
- [12] Y. Huang, P. Shen, Y. Tai, S. Li, X. Liu, J. Li, F. Huang, and R. Ji. Improving face recognition from hard samples via distribution distillation loss. arXiv preprint arXiv:2002.03662, 2020.
- [13] P. J. Huber. Robust estimation of a location parameter. In Breakthroughs in statistics, pages 492–518. 1992.
- [14] ISO/IEC. Iso/iec 29794-1:2016 information technology biometric sample quality — part 1: Framework. 2016.
- [15] H. Kim, S. H. Lee, and M. R. Yong. Face image assessment learned with objective and relative face image qualities for improved face recognition. In Proceedings of IEEE International Conference on Image Processing (ICIP), pages 4027–4031, 2015.
- [16] B. Maze, J. Adams, J. A. Duncan, N. Kalka, T. Miller, C. Otto, A. K. Jain, W. T. Niggel, J. Anderson, J. Cheney, and P. Grother. Iarpa janus benchmark - c: Face dataset and protocol. In Proceedings of International Conference on Biometrics (ICB), pages 158–165, 2018.
- [17] A. Mittal, A. K. Moorthy, and A. C. Bovik. No-reference image quality assessment in the spatial domain. IEEE Transactions on Image Processing, 21(12):4695–4708, 2012.
- [18] A. Papoulis and S. U. Pillai. Probability, random variables, and stochastic processes. New York, NY, USA: Tata McGraw-Hill Education, 2002.
- [19] M. A. Saad, A. C. Bovik, and C. Charrier. Blind image quality assessment: A natural scene statistics approach in the dct domain. IEEE Transactions on Image Processing, 21(8):3339–3352, 2012.
- [20] T. Schlett, C. Rathgeb, O. Henniger, J. Galbally, J. Fierrez, and C. Busch. Face image quality assessment: A literature survey. arXiv preprint arXiv:2009.01103, 2020.
- [21] F. Schroff, D. Kalenichenko, and J. Philbin. Facenet: A unified embedding for face recognition and clustering. In Proceedings of IEEE Conference on Computer Vision and Pattern Recognition (CVPR), pages 815–823, 2015.
- [22] H. Sellahewa and S. A. Jassim. Image-quality-based adaptive face recognition. IEEE Transactions on Instrumentation and Measurement, 59(4):805–813, 2010.
- [23] Y. Shi and A. K. Jain. Probabilistic face embeddings. In Proceedings of IEEE International Conference on Computer Vision (ICCV), pages 6902–6911, 2019.
- [24] P. Terhörst, J. N. Kolf, N. Damer, F. Kirchbuchner, and A. Kuijper. Face quality estimation and its correlation to demographic and non-demographic bias in face recognition. arXiv preprint arXiv:2004.01019, 2020.
- [25] P. Terhörst, J. N. Kolf, N. Damer, F. Kirchbuchner, and A. Kuijper. Ser-fiq: Unsupervised estimation of face image quality based on stochastic embedding robustness. In Proceedings of IEEE Conference on Computer Vision and Pattern Recognition (CVPR), pages 5651–5660, 2020.
- [26] H. Wang, Y. Wang, Z. Zhou, X. Ji, D. Gong, J. Zhou, Z. Li, and W. Liu. Cosface: Large margin cosine loss for deep face recognition. In Proceedings of IEEE Conference on Computer Vision and Pattern Recognition (ICCV), pages 5265–5274, 2018.
- [27] P. Wasnik, K. B. Raja, R. Ramachandra, and C. Busch. Assessing face image quality for smartphone based face recognition system. In Proceedings of International Workshop on Biometrics and Forensics (IWBF), pages 1–6, 2017.
- [28] Y. Wong, S. Chen, S. Mau, C. Sanderson, and B. C. Lovell. Patch-based probabilistic image quality assessment for face selection and improved video-based face recognition. In Proceedings of IEEE Conference on Computer Vision and Pattern Recognition Workshop (CVPRW), pages 74–81, 2011.
- [29] W. Xie, J. Byrne, and A. Zisserman. Inducing predictive uncertainty estimation for face recognition. arXiv preprint arXiv:2009.00603, 2020.
- [30] H. Zeng, L. Zhang, and A. C. Bovik. Blind image quality assessment with a probabilistic quality representation. In Proceedings of IEEE International Conference on Image Processing (ICIP), pages 609–613, 2018.
- [31] K. Zhang, Z. Zhang, Z. Li, and Y. Qiao. Joint face detection and alignment using multitask cascaded convolutional networks. IEEE Signal Processing Letters, 23(10):1499–1503, 2016.
- [32] Z. Zhang, Y. Song, and H. Qi. Age progression/regression by conditional adversarial autoencoder. In Proceedings of IEEE Conference on Computer Vision and Pattern Recognition (CVPR), pages 5810–5818, 2017.