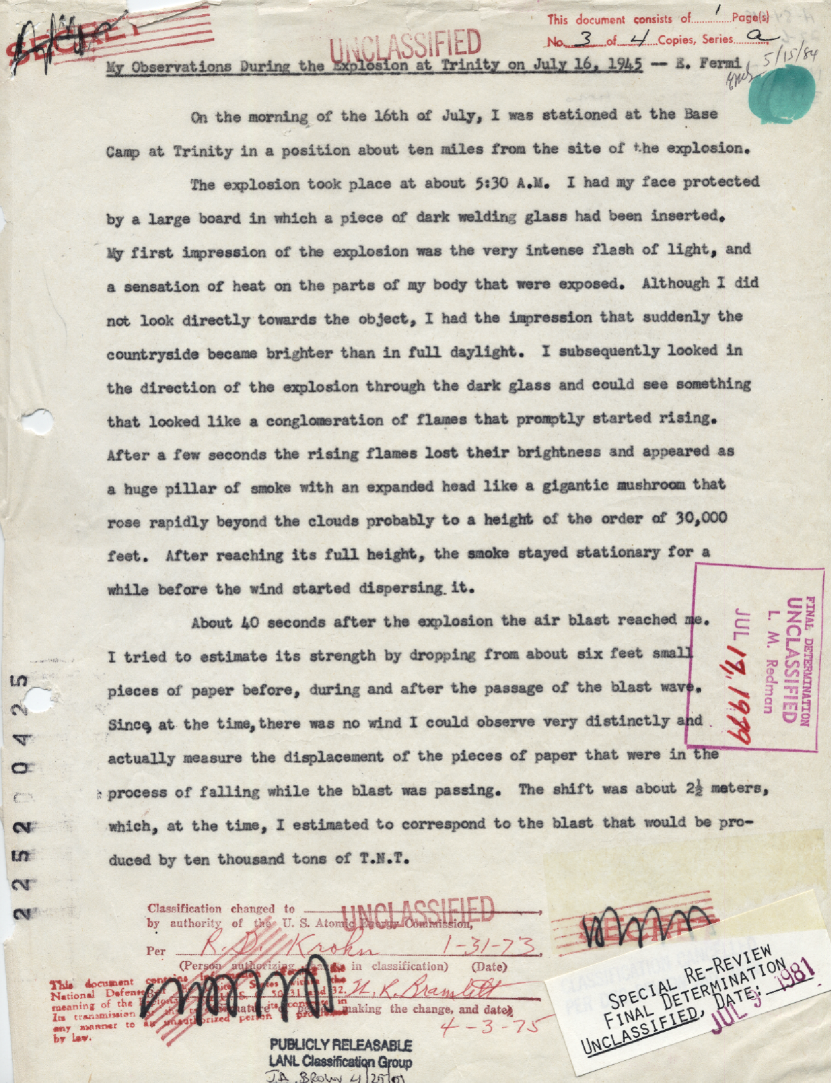
Fermi at Trinity
Abstract
Enrico Fermi estimated the yield of the Trinity test to be about 10 kilotons by dropping small pieces of paper and observing their motion in the blast wave. This is about half the radiochemically derived value of approximately 21 kilotons that necessarily includes thermal and nuclear radiation that do not contribute to the blast. Although this story is classic, there appears to be no account of how he related his observation to the yield. This note attempts to reconstruct how he might have done so.
I Introduction
The official history of Los Alamoshuddeson and many popular accounts describe how Fermi, at Trinity, the first nuclear test, conducted July 16, 1945, estimated its explosive yield with a simple experiment. He dropped some small scraps of paper before the blast wave passed by and observed how far they were displaced. From this, he was able to estimate its explosive yield as 10 kt. This is about 40% of the modern estimate yield , but some portion of that was radiated and did not contribute to the blast wave. Fermi did remarkably well with a very rudimentary experiment, but neither he nor subsequent writers appear to have explained how he inferred the yield.
The light scraps of paper that Fermi dropped moved with the air because of their low ballistic coefficients (the ratio of mass to the product of drag coefficient and area projected perpendicular to the velocity through the fluid); they traced the motion of the air in the blast wave. The text of Fermi’s memorandum may be found on a number of web sites, and it is reproduced in Fig. 1. This note attempts to reconstruct his reasoning.
Fermi measured the positive phase air displacement . In the limit of a weak blast wave, is directly related to the positive phase impulse per unit area , and measuring may be the best way of measuring :
| (1) |
where is the acoustic impedance of the air.
What was the understanding of blast wave physics at the time of Trinity? The theory was developed in some detail in the 1944 Los Alamos document LA-165LA165 , and fitted to empirical data on small (mostly 67 lb) charges in LA-316LA316 (June 25, 1945, three weeks before Trinity). Fermi’s responsibilities as a nuclear physicist and experimentalist were elsewhere, but he was also a leading theorist and likely familiar with these results. However, the results of LA316 do not extend to overpressures below 1 lb/in2, approximately ten times those at Fermi’s observation point, and its results for impulse (directly related to the displacement Fermi measured) for yields tons relevant to Trinity do not extend to ranges km, in contrast to the 16 km range to Fermi’s observation, and its results for low impulses are obtained for low yields but at the unscaled 100 foot height of burst. Scaling from the May 7, 1945 100 ton high explosive calibration and rehearsal shot LA6300 might have been possible, but no quantitative data from it are documented in LA6300 ; its purpose appears to have been to test experimental procedure. In addition, the differing specific energies of nuclear and conventional explosives would have made scaling uncertain.
LA-2000LA2000 , dated August 1947, two years after Trinity, presents a comprehensive review edited, and to a substantial extent written, by Hans Bethe, extending the earlier theory and presents the results of numerical calculations apparently performed between 1944 and 1947. LA2000 contains not only sophisticated analytic theory, as befits its authors, but also in Chap. 6 the results of numerical calculations (“IBM solution, results or run”) carried out on the primitive computing machines of the timeArcher . Some of those results are used here.
Most of the energy of an airburst is divided into three parts: radiation, “wasted” thermal energy in heated air (partly in the initial fireball and partly in air irreversibly heated by the blast wave) and an outgoing blast wave. A small fraction of the energy appears as radioactive decay and neutron capture gamma-rays. The displacement of the air (and pieces of paper that act as Lagrangian tracers of its motion) far from the explosion includes a net outward displacement that accommodates the increased volume of a bubble of hot gas (whose subsequent buoyant rise creates the famous “mushroom cloud”), and the oscillatory motion of the outgoing blast wave.
II The Bubble
After pressure equilibrium is achieved, the injection of an energy into the air increases its volume by
| (2) |
where is the adiabatic exponent of air and its initial pressure. At temperatures of less than a few thousand K the vibrational modes of nitrogen and oxygen molecules are not significantly excited and . At higher temperatures is less; full classical excitation of the vibrational modes reduces it to , and dissociation and endothermic creation of nitric oxide reduce it still further. Most of the volume expansion is attributable to air at lower temperatures, so here we adopt .
For an airburst at the top of a 30 m towerhuddeson and an observer at a distance m, it is possible to approximate the geometry as hemispherical. The effective radius of the hot bubble, defined as the radius of a hemisphere of volume ,
| (3) |
where at the altitude of Trinity of 1.5 km dyne/cm2. An observer at distance would see, after all the dynamic motions have settled down but the hot bubble has not yet begun to rise, an outward displacement
| (4) |
For Fermi’s observation at miles (16 km)
| (5) |
where ergs. For modern estimatesyield that Trinity had a yield of kt this gives 25 cm, which is much smaller than the 2 1/2 meter displacement he observed, even were there no radiation losses. The explanation of Fermi’s observation, and the reconstruction of his argument, must be sought elsewhere.
III The Blast Wave
The sudden creation of a bubble of hot gas produces an outgoing blast wave. This blast wave is initially very strong, with overpressure , where is the ambient pressure and the pressure of the shocked and subsequently rarefied air. In the strong shock and point source limit it is described by an analytic theory developed by von NeumannvN , by G. I. TaylorD and by Sedov, and described in this issue by Baty and RamseyBR . This is not applicable to the weak shock regime in which Fermi made his measurement.
LA-2000LA2000 also calculates weaker blast waves. However, one crucial element, the fraction of the explosive yield that appears in the weak blast wave () at large distances, where Fermi measured it, can only be calculated numerically because it involves the coupling of energy through an intermediate strength regime in which no analytic theory is valid. This calculation is described in Chapter 6 of LA-2000LA2000 , but it is difficult to reconcile the results there (Fig. 6) with Fermi’s measurement and the known yieldyield of Trinity.
Once the blast wave becomes weak, it is, to a good approximation, a sound wave propagating at the sound speed. The over- and under-pressure and the fluid speed decay nearly proportionally to in spherical or hemispherical geometry. The width of the blast wave is nearly constant because the sound speed is nearly its ambient value throughout. Idealized displacement and overpressure profiles are shown in Fig. 2. Unlike the bubble displacement, in the acoustic limit the blast wave displacement returns to zero after the wave passes.
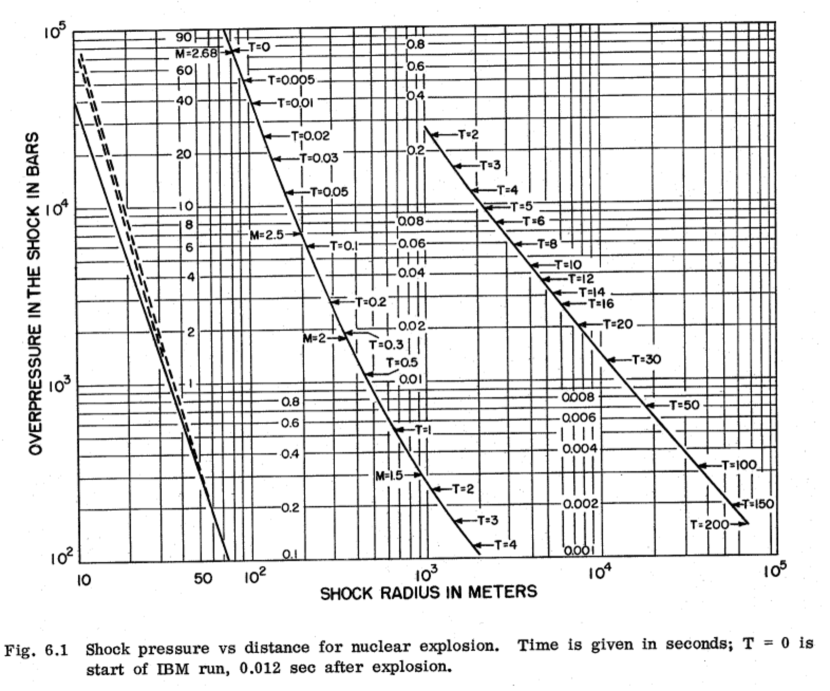
The dependence of shock overpressure on distance from the explosion is shown in Fig. 3 for a spherically symmetric explosion into air at ambient conditions (dyne/cm2 and K). This Figure combines the numerical (“IBM”) results with the “semi-acoustic” and acoustic theory for weak and very weak (acoustic) blast waves. §6.3 of LA-2000 states that the calculation was intended to describe a 10 kt explosion but actually described a 13 kt (not including thermal or nuclear radiation) explosion.
For the leading edge of the blast wave becomes a weak shock () that performs very little irreversible work (). The blast wave propagates at nearly the speed of sound, m/s in air at C, a typical temperature at dawn in July at Trinity (LA-2000 takes m/s, appropriate to air at C). The passage of a weak shock produces a velocity discontinuity
| (6) |
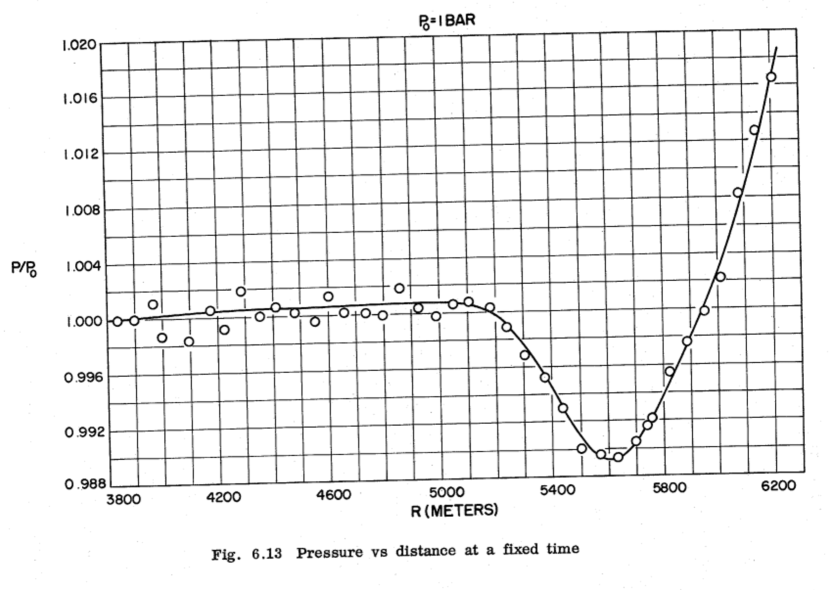
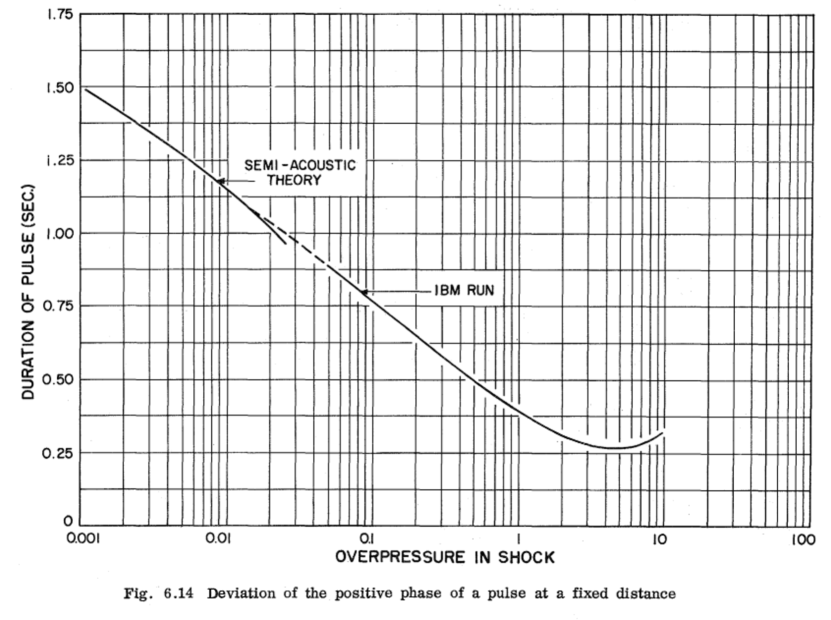
defining the acoustic impedance , where is the ambient density (very close to the shocked density). The pressure profile of the weak blast wave at one radius is shown in Fig. 4, and the duration of the positive phase () is shown in Fig. 5, both for a yield of 13 kt in spherical symmetry.
In this weak blast wave regime the rate of dissipation of blast energy by conversion to thermal “waste energy”, so-called because it does not contribute to the destructive effect of the blast, rapidly decreases with increasing . However, it decreases slowly enough that the energy in the blast wave does not approach a constant asymptote, but rather declines logarithmically with overpressure and distance (Eq. 429 of LA-165LA165 ).
The energy of a weak hemispherical blast wave whose positive phase has thickness
| (7) |
One factor of 2 results from the contribution of the compression energy, equal to the kinetic energy in an acoustic wave, and another factor of 2 from the contribution of the negative phase, nominally equal to that of the positive phase (Fig. 2, although Fig. 4 suggests a factor of 1.5 may be more accurate), and the factor of comes from averaging with varying linearly from to through the blast wave (Fig. 2). The thickness is comparable to the radius where the shock transitions from strong to weak, scaling , but grows logarithmically (LA-165LA165 and Fig. 5) as the weak blast wave propagates.
Fermi had to estimate theoretically because it would not have been easy to measure without photographic or electronic equipment. At (16 km from a 13 kt explosion in spherical geometry; Fig. 3) the duration of the positive phase s for the same explosion (Fig. 5). Scaling to 13 kt in hemispherical geometry while holding constant doubles the effective yield and multiplies and by . Then s and m. This is (probably fortuitously) very close to the m estimated from Eq. 3.
At , as shown in Fig. 4 at 6 km for 13 kt in spherical geometry, Fig. 5 indicates s and m rather than the 320 m indicated by Fig. 4 or the 290 m of §6.4 of LA-2000. This should be taken as a measure of the resolution and precision of the calculations.
From the results reported in LA-2000 (or the more approximate elementary analytic result Eq. 3) Fermi had a good idea of the value of at his observation point for yields in the expected range. Fortunately, and depend only logarithmically on (LA-165LA165 and Fig. 5). In principle, he could have used the computed dependence of on yield to solve interatively for the yield, but this dependence is so weak that such a procedure was unnecessary. Measuring a displacement m provided the peak velocity for the linear pressure and velocity profile of Fig. 2. Then
| (8) |
This is fairly close to the m/s calculated for bar (scaling the results of Fig. 3 to hemispherical geometry by multiplying by ) from Eq. 6, taking kg/m3 at the 1500 m altitude of Trinity and noting that scales , independent of the air density. Substituting and in Eq. 7 yields
| (9) |
In order to relate his observation to the explosive yield Fermi had to know what fraction of the yield appears as blast wave energy at an overpressure of about 0.01 bar. If he had relied on the IBM calculation reported in Chap. 6 of LA-2000, shown in Fig. 6, he would have been seriously misled. A small extrapolation from these results to bar would have led to , implying an impossible kt, far from both Fermi’s estimate and the modern radiochemical value of ktyield for the total yield, that includes thermal and nuclear radiation.
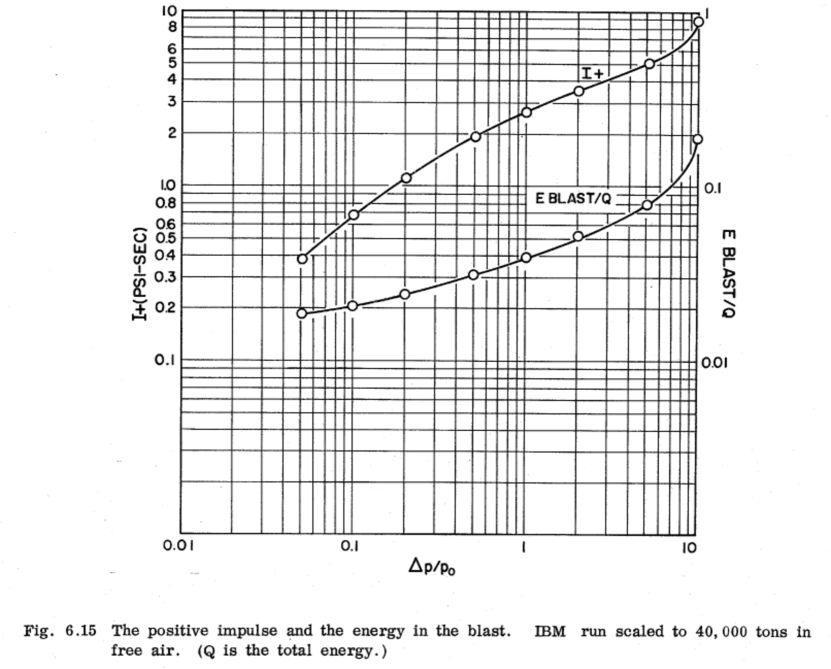
Two factors may contribute to this discrepancy. The effects of numerical viscosity were likely not appreciated when the IBM calculations were done, and the decline of with increasing range in Fig. 6 may be mostly a numerical artefact. In addition, the “wasted” energy contributes to the pressure driving the blast wave, so it is not really wasted. These hypotheses could be readily tested with a modern calculation.
How did Fermi get it right? He could have readily estimated from Eqs. 7 and 8 or equivalent forms. He would have needed a value for , but that could have been taken from the numerical calculations (were they available and known to him in 1945), estimated in advance of Trinity as the shock radius (Eq. 3) where , or inferred at Trinity from eyeball observation of the duration of the positive phase using his paper Lagrangian tracers. He didn’t tell us what he did.
Fermi would also have needed a value for , an essential parameter that the only possibly available numerical calculation got wrong. He was likely familiar with the Bethe-Kirkwood-Penney result (Eq. 429 of LA-165LA165 )
| (10) |
which, combined with his empirical value for (Eq. 9) immediately leads to his yield estimate kt.
If the IBM calculations had been done by the time of Trinity, either Fermi was unaware of them or wisely chose to use the analytic theory rather than those apparently quantitative computational results.
IV Conclusion
At the time Fermi wrote his famous memorandum, the result (Eq. 10) of LA-165LA165 was likely well-known at Los Alamos, so that no explanation was necessary. This theory is no longer common knowledge, even though the original documents are readily available to anyone.
Fermi estimated the yield of Trinity to be 10 kt, about 40% of the modern value, from the motion of Lagrangian tracers, his famous scraps of paper. Significant additional energy was radiated, but how much depends on the physics and chemistry of hot air (in particular, the thermodynamics and opacity of oxides of nitrogen) and requires numerical methods to calculate. Fermi’s result was therefore a lower bound, and was sufficient to declare Trinity a success.
V Acknowledgments
I thank E. Deschamp of the Los Alamos Reports Library for a scan of Fermi’s memorandum (Fig. 1), B. Albright, S. Andrews, M. B. Chadwick and R. L. Garwin for discussions, and an anonymous referee for calling my attention to the pre-Trinity Los Alamos reports.
This work was supported by the US Department of Energy through the Los Alamos National Laboratory. Los Alamos National Laboratory is operated by Triad National Security, LLC, for the National Nuclear Security Administration of the US Department of Energy under Contract No. 89233218CNA000001.
References
- (1) L. Hoddeson, P. W. Henriksen, R. A. Meade, and C. Westfall, Critical Assembly A Technical History of Los Alamos During the Oppenheimer Years 1943–1945 (Cambridge U. Press, 1993) pp. 371–372. This source gives the displacement of the scraps of paper as feet, while Fermi actually reported m; (Fig. 1).
- (2) H. D. Selby et al. “A New Yield Statement for the Trinity Nuclear Test, 75 Years Later” Weapons Review Letters (this issue) (2021) submitted to ANS Nuclear Technology special issue (2021).
- (3) Los Alamos Reports Archive A-83-0002, 6-4 (84-19, Box 16, Folder 5).
- (4) H. A. Bethe et al. ed. J. O. Hirschfelder Shock Hydrodynamics LA-165 (1944) http://lib-www.lanl.gov/cgi-bin/getfile?00349778.pdf.
- (5) J. O. Hirschfelder, D. J. Littler and H. Sheard Estimated Blast Pressures from TNT Charges of 2 to 10,000 Tons LA-316 (June 25, 1945) http://lib-www.lanl.gov/cgi-bin/getfile?00350404.pdf.
- (6) K. T. Bainbridge Trinity LA-6300-H (undated, but written 1945–46 and issued as LA-1012, reissued 1976 as LA-6300-H) http://library.lanl.gov/cgi-bin/getfile?00317133.pdf.
- (7) H. A. Bethe et al. Blast Wave LA-2000 (1947) http://lib-www.lanl.gov/cgi-bin/getfile?00320773.pdf.
- (8) Archer, B. J. “The Los Alamos Computing Facility During the Manhattan Project” LA-UR-21-20164 (ANS/NT this issue 2021).
- (9) J. von Neumann The point source solution in Collected Works V. 6 ed. A. H. Taub 1963 (Pergamon, New York 1963); also Chap. 2 of LA-2000.
- (10) M. A. B. Deakin Int. J. Math. Ed. Sci. Tech. 42, 1069 (2011) https://doi.org/10.1080/0020739X.2011.562324.
- (11) R. S. Baty and S. D. Ramsey “On the Symmetry of Blast Waves”; submitted to ANS Nuclear Technology special issue (2021).
- (12) R. Courant and K. O. Friedrichs Supersonic Flow and Shock Waves (Interscience 1948).