Clumpy Star Formation and AGN Activity in the Dwarf-Dwarf Galaxy Merger Mrk 709
Abstract
Nearby, low-metallicity dwarf starburst galaxies hosting active galactic nuclei (AGNs) offer the best local analogs to study the early evolution of galaxies and their supermassive black holes (BHs). Here we present a detailed multi-wavelength investigation of star formation and BH activity in the low-metallicity dwarf-dwarf galaxy merger Mrk 709. Using Hubble Space Telescope H and continuum imaging combined with Keck spectroscopy, we determine that the two dwarf galaxies are likely in the early stages of a merger (i.e., their first pass) and discover a spectacular kpc-long string of young massive star clusters ( Myr; ) between the galaxies triggered by the interaction. We find that the southern galaxy, Mrk 709 S, is undergoing a clumpy mode of star formation resembling that seen in high-redshift galaxies, with multiple young clusters/clumps having stellar masses between and . Furthermore, we present additional evidence for a low-luminosity AGN in Mrk 709 S (first identified by Reines et al. 2014 using radio and X-ray observations), including the detection of the coronal [Fe X] optical emission line. The work presented here provides a unique glimpse into processes key to hierarchical galaxy formation and BH growth in the early Universe.
1 Introduction
Dwarf galaxies form the largest subset of galaxies in the Universe (e.g., Binggeli et al., 1988), and their mergers play a crucial role in hierarchical galaxy formation (e.g., Stierwalt et al., 2017). Dwarf-dwarf mergers trigger intense star formation, and lead to the formation of blue compact dwarfs (BCDs; Stierwalt et al., 2017; Paudel et al., 2018; Kado-Fong et al., 2020; Zhang et al., 2020) that have strongly starbursting spectra and physical sizes of 1 kpc (Bekki, 2008). These low-mass, low-metallicity BCDs can host super star clusters (SSCs; Johnson et al., 2000; Reines et al., 2008b), which have properties expected of the progenitors of globular clusters (e.g., O’Connell et al., 1994).
At least some dwarf galaxies with stellar masses comparable to the Magellanic Clouds () are also known to host massive black holes (BHs) with (see Reines & Comastri, 2016; Mezcua, 2017; Greene et al., 2020, and references therein). These relatively small BHs place our best observational constraints on the masses of the first BH seeds in the earlier Universe. Star-forming dwarfs hosting massive BHs today are particularly interesting (albeit hard to find) since they are more akin to high-redshift galaxies and may help us understand the interplay between BH and galaxy growth at early times.
Mrk 709 is uniquely suited for studying both heirarchical galaxy formation and the formation and evolution of BHs. Mrk 709 has been classified as a BCD (Gil de Paz et al., 2003) with very low metallicity (12 + log(O/H) = 7.7, or 10% ; Masegosa et al., 1994), and Reines et al. (2014) find that Mrk 709 consists of a pair of compact dwarf galaxies that appear to be interacting with one another. Moreover, Reines et al. (2014) present observational evidence at radio and X-ray wavelengths for an active massive BH in Mrk 709 S, the southern galaxy in the pair. Mrk 709 S has intense, on-going star formation with a star formation rate that is an order of magnitude higher than the Large Magellanic Cloud (and is significantly more luminous than the LMC), yet the two dwarf galaxies have similar stellar masses with (Reines et al., 2014; van der Marel et al., 2002; Whitney et al., 2008).
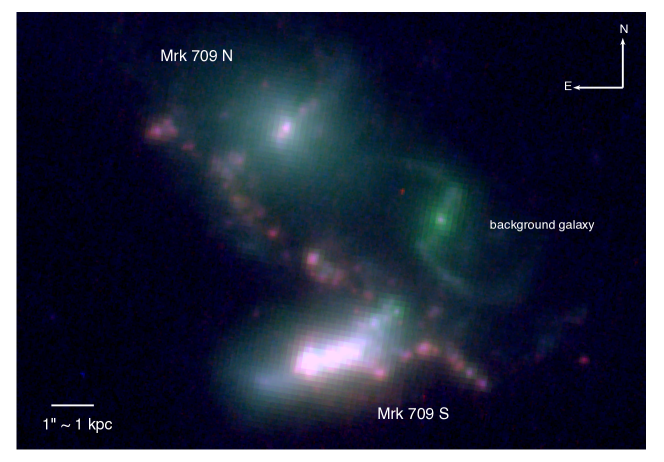
In this work, we use multi-wavelength data to confirm the interaction of Mrk 709 N and Mrk 709 S, study star formation throughout the system, and further investigate the active galactic nucleus (AGN) in Mrk 709 S. We use high-resolution H and continuum imaging from the Hubble Space Telescope (HST), Keck optical spectroscopy, and very long baseline interferometry (VLBI) radio imaging with the National Radio Astronomy Observatory (NRAO) High Sensitivity Array (HSA). We also re-analyze the SDSS DR8 spectra of Mrk 709 S to search for the AGN coronal line [Fe X] 6374, to provide further evidence for BH activity. Figure 1 shows HST imaging of Mrk 709 and Table 1 gives basic properties of the two component galaxies, Mrk 709 S and Mrk 709 N.
We describe the observations in Section 2 and discuss the Mrk 709 system in Section 3. The properties of the star forming regions are presented in Section 4. We present and analyze the evidence for the low-luminosity AGN in Mrk 709 S in Section 5, and summarize our results and conclusions in Section 6. In this paper, we assume km s-1 Mpc-1. Mrk 709 S has a redshift of = 0.052 based on Sloan Digital Sky Survey (SDSS) spectroscopy (Reines et al., 2014), which corresponds to a distance Mpc. At this distance, corresponds to kpc.
| Galaxy | RA | Dec | Redshift | M⋆ | g | r | i |
|---|---|---|---|---|---|---|---|
| (h:m:s) | (deg:m:s) | () | (mag) | (mag) | (mag) | ||
| Mrk 709 S | 9:49:18.02 | +16:52:44.2 | 0.052 | ||||
| Mrk 709 N | 9:49:18.10 | +16:52:49.5 | 0.052 |
Note. — The reported right ascension, declination, and , and photometric values are from the 16th Data Release (DR16) of the Sloan Digital Sky Survey (SDSS-IV; Blanton et al., 2017; Ahumada et al., 2020). The redshift of Mrk 709 N is measured in this work using Keck spectroscopy. The redshift of Mrk 709 S and the stellar masses are from Reines et al. (2014).
2 Observations
We obtained multi-wavelength imaging of Mrk 709 with the Wide Field Camera 3 (WFC3) aboard HST. The images were taken over 2 orbits on 2015 November 18-19 (Proposal ID 14047; PI Reines). The galaxy was observed in three filters: a broad-band near-IR filter (IR/F110W), a medium-band optical filter (UVIS/F621M), and a narrow-band H filter (UVIS/F680N). For each filter, we obtained four dithered exposures to facilitate cosmic-ray rejection, avoid bad pixels, and improve the PSF sampling. We obtained the calibrated and drizzled images produced by the STScI data reduction pipeline. The near-IR image has a plate scale of 013/pixel and the optical/H images have plate scales of 004/pixel. Our observations are summarized in Table 1.
2.1 Hubble Space Telescope Imaging
| Filter | Instrument | Description | Exp. Time |
|---|---|---|---|
| F110W | WFC3/IR | Near IR; 1.15 m | 400s |
| F621M | WFC3/UVIS | Optical; 0.62 m | 1600s |
| F680N | WFC3/UVIS | redshifted H | 2300s |
The final three galaxy images were slightly misaligned because the Fine Guidance Sensors on HST could only acquire a single guide star during the observations, which allows a slow drift of the target on the detector. Using the F621M image as the reference, we shifted the F110W image 0.60 pixels west and 0.36 pixels north, and the F680N image 0.84 pixels west and 0.19 pixels north. We also corrected the absolute astrometry by comparing the adjusted HST images to SDSS images of Mrk 709 and updating the WCS. All three images were moved 029 south and 048 east to match the SDSS astrometry. We estimate the uncertainty in the astrometry of the HST images relative to the SDSS to be 005. Figure 1 shows a 3-color HST image of Mrk 709.
2.2 Keck Spectroscopy
We observed Mrk 709 for 600s with the dual-beam Low Resolution Imaging Spectrometer (LRIS; Oke et al., 1995) on the Keck I 10-meter telescope on UT 2018 March 18. Our instrument setup consisted of the 1″ width slit, the 5600 Å dichroic, the 600 mm-1 blue grism with Å, and the 400 mm-1 red grating with Å. This configuration covers the full optical window at a resolving power of . We used standard data reduction techniques in IRAF and for flux calibration we used observations obtained on the same night with the same instrument configuration of the standard stars Hiltner 600 and Wolf 1346 from Massey & Gronwall (1990; ApJ, 358, 344). The spatial resolution is 12, due to the seeing on the night of the observation.
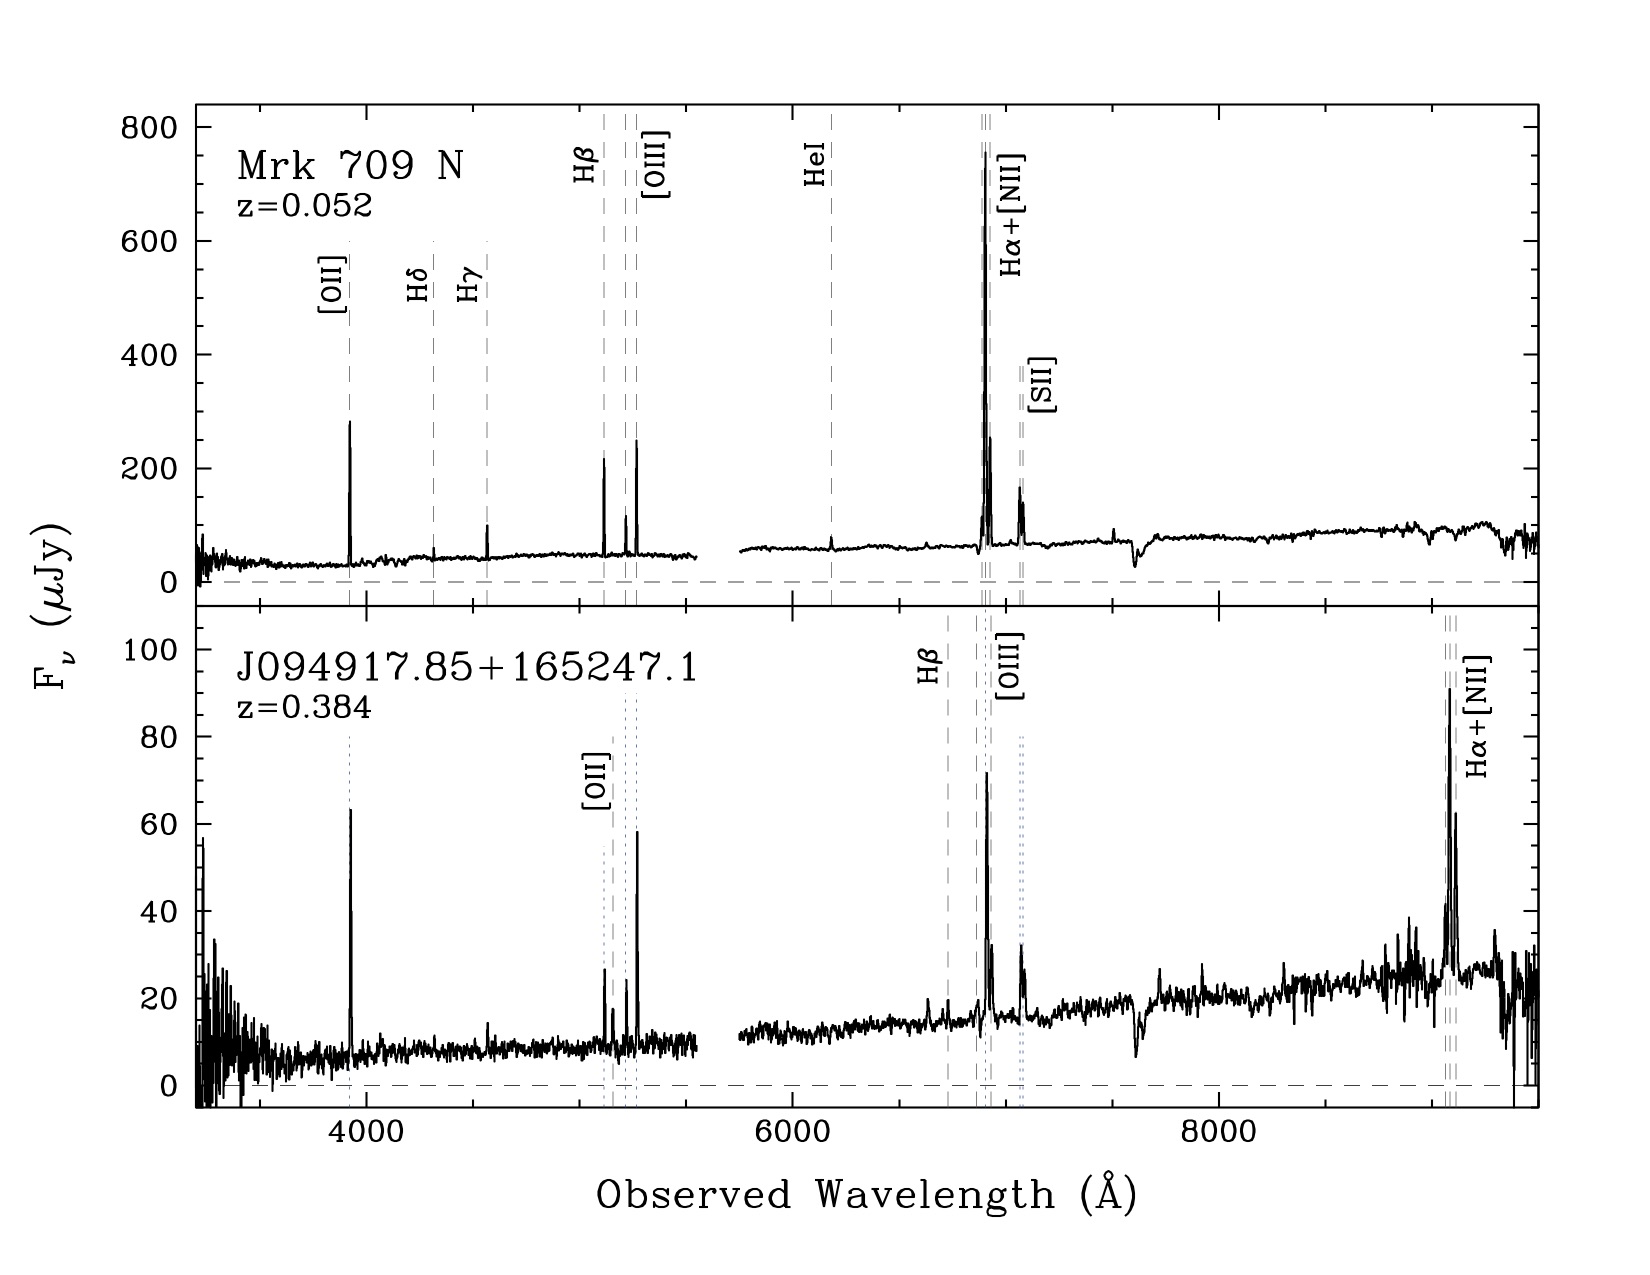
We positioned the slit at a position angle of PA = 56.5° to cover both the northern and western galaxies, to measure their redshifts, and determine if they are part of the same system as Mrk 709 S. The redshift of the southern galaxy, Mrk 709 S, is known to be from SDSS spectroscopy (Reines et al., 2014). Figure 2 shows the reduced Keck/LRIS spectra using a 1″ extraction width. The spectra indicate that Mrk 709 N is at the same redshift as Mrk 709 S (), but the western galaxy is at a higher redshift () and therefore not part of the Mrk 709 system.
2.3 Very Long Baseline Interferometry
We obtained VLBI observations of Mrk 709 S on February 14, 2015. We used the HSA, comprising of the Very Long Baseline Array (VLBA) antennas along with the Green Bank Telescope (GBT) and the phased Very Large Array (VLA). The project code is BR204. All VLBA antennas observed with the exception of Mauna Kea (MK) and St Croix (SC); Pie Town (PT) and Hancock (HN) were unavailable for a portion of the observation. 2 128 MHz subbands, centered at 1440 MHz and 1696 MHz, were sampled in dual polarisation. The bright source 4C39.25 was observed twice to calibrate the instrumental bandpass, while JVAS J0949+1752 was observed every 5 minutes as a phase reference. The total observation duration was 5 hours.
We made use of a pipeline implemented using the ParselTongue (Kettenis et al., 2006) python interface to AIPS (Greisen, 2003), optimised for 1.5 GHz VLBI observations. This pipeline has previously been used for numerous VLBA astrometric observations of radio pulsars, and a detailed description is available in Deller et al. (2019). Briefly, it applies a priori amplitude calibration, followed by bandpass correction derived from 4C39.25, and then fringe-fitting and amplitude self-calibration using JVAS J0949+1752.
After calibration, the data were imaged using difmap (Shepherd, 1997). Natural weighting was used, resulting in a synthesised beam size of mas. We produced a image covering the entire region of Mrk 709 S, with an image rms () of 4 Jy. No source was visible in the dirty image with a peak brightness above 4.5, and we set a 5 upper limit to the peak brightness of any 1.5 GHz radio emission to be Jy/beam.
| Component | RA | Dec | Aperture Size | PA | H Flux | SFR |
|---|---|---|---|---|---|---|
| (arcsec arcsec) | (deg) | ( erg s-1 cm-2) | ( yr-1) | |||
| Mrk 709 S | 9:49:18.03 | +16:52:44.2 | 110 | 1.0 | ||
| Mrk 709 N | 9:49:18.11 | +16:52:49.5 | 0 | 0.2 | ||
| Bridge | 9:49:18.06 | +16:52:46.7 | 52 | 0.5 |
Note. — Star formation rates of the different components of the Mrk 709 system are derived from our HST imaging. We use elliptical apertures with the given semi-major and semi-minor axes, and position angles (PA). These SFRs should be considered lower limits (see Section 3).
3 The Mrk 709 System
Figure 1 shows the HST images of Mrk 709. Three galaxies are apparent in the field of view. The northern and southern galaxies, Mrk 709 N and Mrk 709 S, were identified by Reines et al. (2014) using SDSS imaging, however only Mrk 709 S had an SDSS spectrum, which indicated a redshift of ( Mpc). Our new long-slit Keck spectroscopy covers the northern and western galaxies and indicates redshifts of and , respectively. Therefore, while Mrk 709 N and Mrk 709 S are part of the same system, the western component is a background galaxy (J094917.85+165247.1) and not part of the Mrk 709 system. We present some of the basic galaxy properties for both Mrk 709 N and Mrk 709 S in Table 1.
There is a striking bridge of star clusters between Mrk 709 N and Mrk 709 S, strongly emitting in H. The bridge is a characteristic tidal feature indicating that the two dwarf galaxies are undergoing a merger/interaction. The bridge is ″ long. At the distance of Mrk 709, this corresponds to a projected physical length of kpc.
We estimate the star formation rates (SFRs) of Mrk 709 S, Mrk 709 N and the bridge using H fluxes determined from our HST images and the following relation from Kennicutt & Evans (2012):
| (1) |
where is the luminosity of H in units of erg s-1. The H flux is given by:
| (2) |
where is the flux density in the F680N image, is the continuum flux density at the wavelength of redshifted H, and is the width of the F680N filter. The continuum is found by interpolating between the F621M and F110W flux densities in log vs. log space since a power law is a good approximation of a stellar population spectrum redward of Å (Leitherer et al., 1999). Table 3 presents the measurements and aperture definitions.
We find SFRs of approximately 1, 0.2, and 0.5 yr-1 for Mrk 709 S, Mrk 709 N, and the bridge, respectively. These values should be taken as lower limits since the measured H fluxes cannot be corrected for extinction with the data in hand. It is also possible that our continuum estimates are artificially high due to nebular emission contaminating the broadband filters (Reines et al., 2010). While the redshifted [NII] lines fall in the F680N filter along with H, the contribution to the total flux and SFR is expected to be minor ( based on the SDSS spectrum of Mrk 709 S). We do not apply a correction to the measured SFRs as we do not know the contamination from the [NII] lines for every galaxy component.
Our SFR for Mrk 709 S is somewhat less than the value of 3.9 yr-1 found by Reines et al. (2014) using the SDSS spectrum, which was taken in a 3″ aperture centered on Mrk 709 S and corrected for extinction using the Balmer decrement (H/H=3.47; Reines et al. 2014). The value derived here is likely lower due to the combination of a smaller aperture, no extinction correction, and uncertainty in the underlying stellar continuum using photometric measurements. We also note that both Reines et al. (2014) and this work assume that the AGN in Mrk 709 S does not contribute significantly to the observed H emission since the line ratios suggest that star formation dominates. The derived SFRs are very high given the low stellar masses of only and for Mrk 709 S and Mrk 709 N, respectively (Reines et al., 2014). Mrk 709 S has an SFR at least as large as the Milky Way.
4 Star Forming Regions
With the dramatically improved spatial resolution afforded by HST (e.g., compared to the SDSS images presented in Reines et al. 2014), we are now in a position to investigate individual star forming regions and young star clusters within the Mrk 709 system. The H and continuum images, along with population synthesis models, enable us to estimate the ages, ionizing luminosities, and stellar masses for each star forming region/cluster.
4.1 Photometry of Star Clusters
| Source | RA | Dec | F680N | F621M | F110W |
|---|---|---|---|---|---|
| Mrk 709 S | |||||
| 1s | 9:49:17.94 | +16:52:43.8 | 21.41(0.16) | 21.50(0.17) | 22.34(0.31) |
| 2s | 9:49:18.00 | +16:52:44.3 | 19.61(0.12) | 19.63(0.06) | 20.67(0.13) |
| 3s | 9:49:18.01 | +16:52:44.1 | 19.63(0.18) | 19.78(0.14) | 20.71(0.19) |
| 4s | 9:49:18.03 | +16:52:44.1 | 19.54(0.13) | 19.70(0.10) | 20.51(0.23) |
| 5s | 9:49:18.06 | +16:52:44.1 | 19.07(0.09) | 19.19(0.04) | 20.13(0.06) |
| 6s | 9:49:18.06 | +16:52:43.8 | 19.60(0.08) | 20.32(0.07) | 21.08(0.12) |
| Mrk 709 N | |||||
| 1n | 9:49:18.05 | +16:52:50.1 | 23.11(0.29) | 23.69(0.50) | 24.39(0.92) |
| 2n | 9:49:18.07 | +16:52:50.0 | 22.63(0.55) | 23.13(0.59) | 23.84(0.76) |
| 3n | 9:49:18.10 | +16:52:49.5 | 20.71(0.17) | 21.36(0.20) | 22.14(0.36) |
| 4n | 9:49:18.11 | +16:52:49.4 | 20.96(0.17) | 21.69(0.23) | 22.38(0.42) |
| 5n | 9:49:18.13 | +16:52:50.6 | 23.83(0.10) | 24.56(0.23) | 26.26(3.62) |
| Bridge | |||||
| 1b | 9:49:17.78 | +16:52:43.5 | 22.86(0.03) | 23.81(0.05) | 25.24(0.04) |
| 2b | 9:49:17.80 | +16:52:43.8 | 22.77(0.07) | 23.83(0.04) | 24.55(0.02) |
| 3b | 9:49:17.81 | +16:52:44.0 | 22.41(0.07) | 24.35(0.19) | 24.79(0.03) |
| 4b | 9:49:17.83 | +16:52:44.1 | 22.49(0.08) | 23.99(0.04) | 24.95(0.24) |
| 5b | 9:49:17.86 | +16:52:45.2 | 23.52(0.05) | 24.70(0.07) | 25.83(0.64) |
| 6b | 9:49:17.87 | +16:52:44.4 | 21.52(0.06) | 23.09(0.04) | 24.24(0.14) |
| 7b | 9:49:17.90 | +16:52:44.2 | 22.26(0.06) | 23.28(0.11) | 26.30(2.43) |
| 8b | 9:49:17.94 | +16:52:43.8 | 21.00(0.01) | 22.28(0.04) | 23.41(0.36) |
| 9b | 9:49:17.96 | +16:52:45.6 | 23.25(0.07) | 24.70(0.05) | 25.28(0.23) |
| 10b | 9:49:18.01 | +16:52:46.1 | 22.77(0.03) | 24.58(0.06) | 25.40(0.32) |
| 11b | 9:49:18.05 | +16:52:46.5 | 21.60(0.02) | 22.95(0.03) | 24.03(0.04) |
| 12b | 9:49:18.12 | +16:52:47.1 | 23.01(0.03) | 25.72(0.38) | 26.62(0.18) |
| 13b | 9:49:18.17 | +16:52:48.8 | 22.72(0.12) | 23.55(0.22) | 24.47(0.60) |
| 14b | 9:49:18.18 | +16:52:47.9 | 23.33(0.45) | 25.43(0.77) | 25.40(0.43) |
| 15b | 9:49:18.31 | +16:52:49.5 | 22.07(0.02) | 23.46(0.04) | 24.73(0.03) |
Note. — Magnitudes are given in the STMAG photometric system.
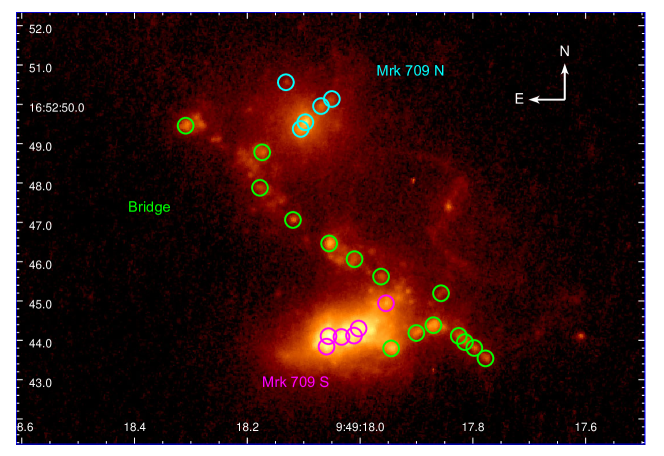
We identify young star clusters in the narrowband H (F680N) image. The regions are shown in Figure 3 and their coordinates are listed in Table 4. Using the astropy and photutils packages in Python, we perform aperture photometry on a total of 26 clusters; six in Mrk 709 S, five in Mrk 709 N, and 15 in the bridge between the two dwarf galaxies. We used circular apertures of radius 02. The background was estimated within an annulus of inner radius 045 and outer radius 065 centered on each cluster. However, we made multiple measurements varying the background since this is the dominant source of uncertainty in our photometry. Aperture corrections were applied to our final background-subtracted flux densities using the encircled energy fractions for a 02 aperture: 0.839, 0.847, and 0.712 for the F680N, F621M, and F110W images respectively. The final magnitudes are listed in Table 4 and given in the STMAG photometric system111https://hst-docs.stsci.edu/wfc3dhb/chapter-9-wfc3-data-analysis/9-1-wfc3-data-analysis.
4.2 Physical Properties of the Clusters
Estimates of the physical properties of the star clusters come from comparing our measurements to Starburst99 (v5.1) population synthesis models (Leitherer et al., 1999). We use a simulation of an instantaneous burst of with a Kroupa initial mass function. We adopt the Geneva evolutionary tracks with high mass loss, a metallicity of and the Pauldrach/Hillier atmospheres. The model metallicity is similar to that of Mrk 709 (% solar; Masegosa et al., 1994).
4.2.1 Ages
We estimate the ages of star clusters by comparing the equivalent width of H emission to the model predictions as a function of age. The equivalent width of H is given by the ratio of the flux of the H emission line (which is proportional to the ionizing flux from short-lived massive stars) to the continuum flux density at the same wavelength:
| (3) |
This ratio is strongly dependent on age for stellar clusters between 3 and 20 Myr old. The insensitivity before 3 Myr occurs because the most massive stars have not yet died, thereby reducing the ionizing flux, and the insensitivity after Myr occurs because clusters older than this are not strong H emitters. The H flux is given by Equation 2 and determined for individual clusters using the same procedure as described in Section 3.
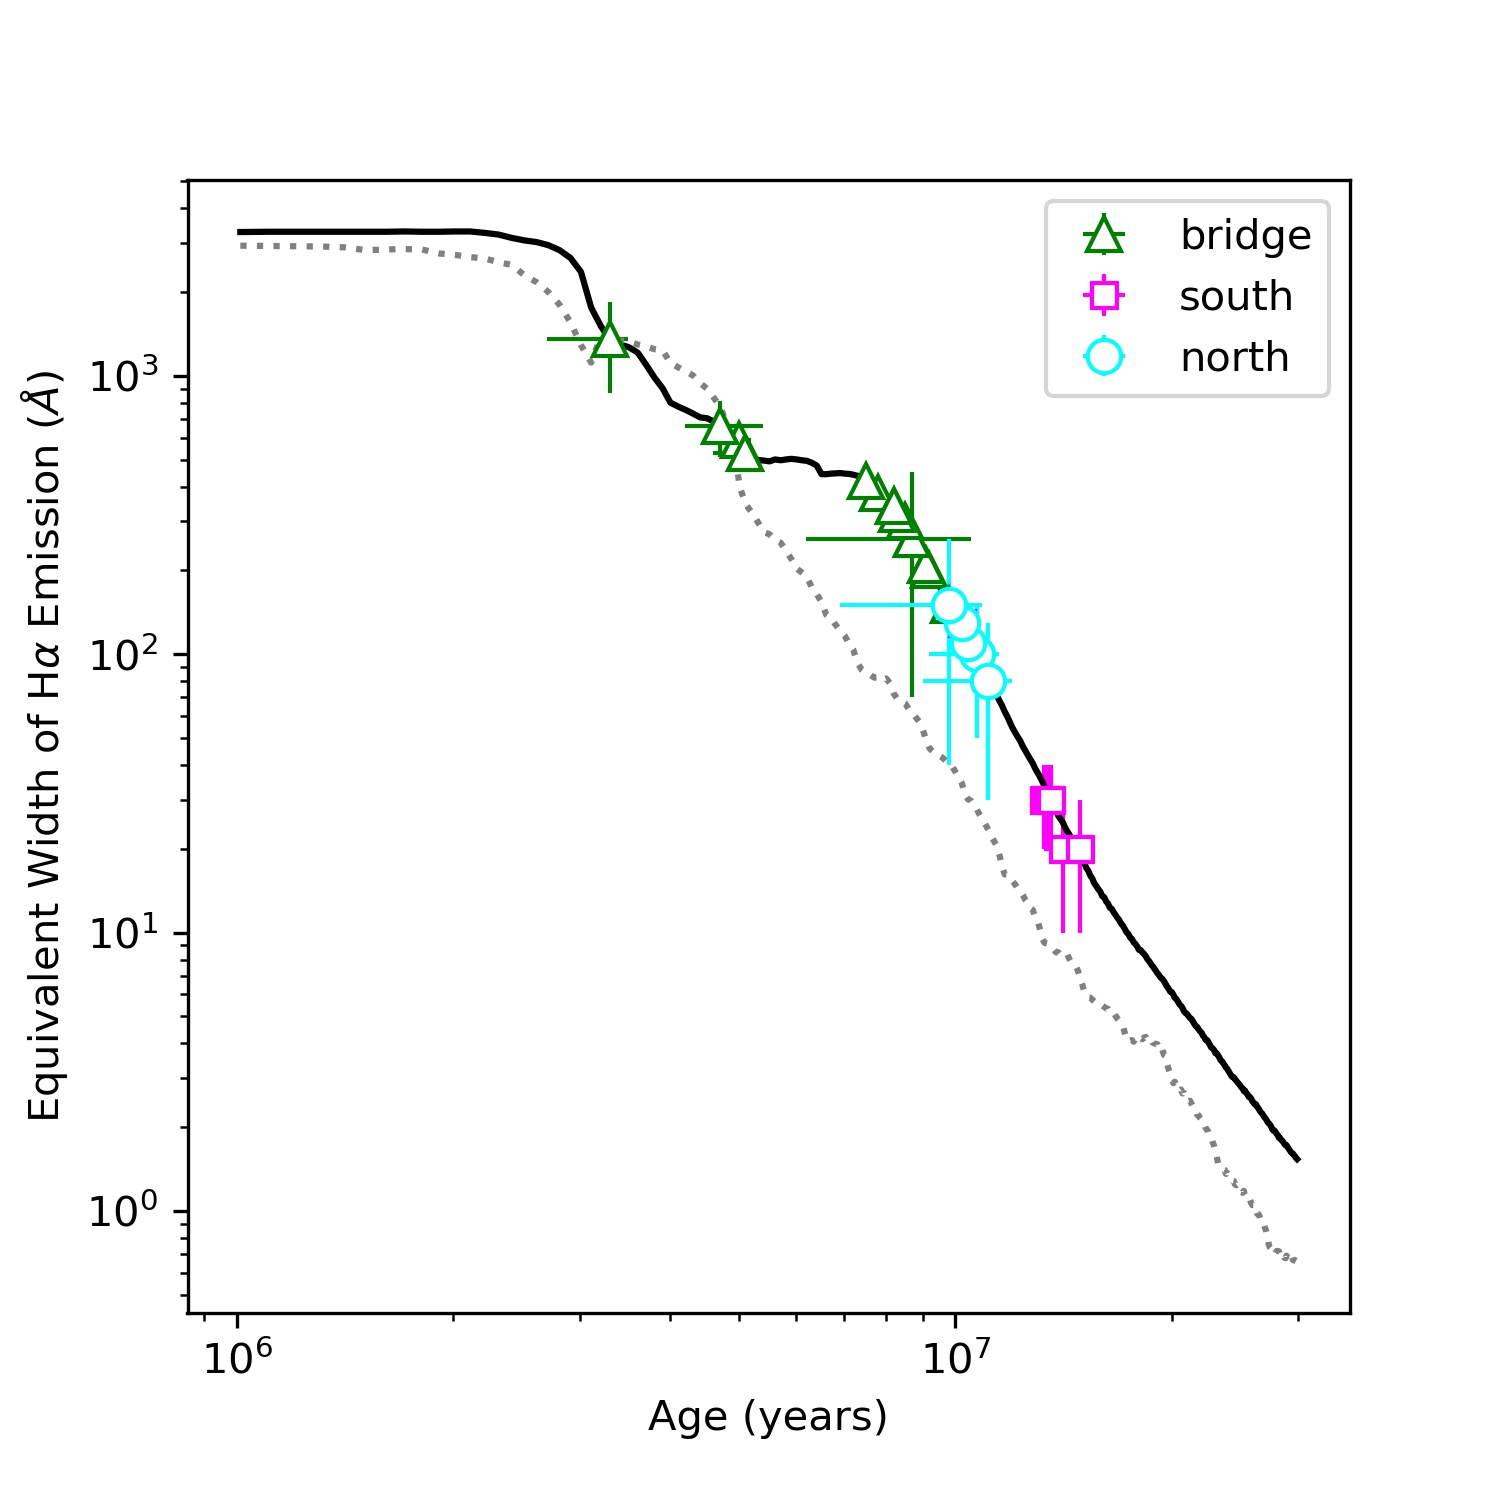
In Figure 4 we show the measured H equivalent width of star clusters in the Mrk 709 system as well as the model predictions as a function of age. The southern galaxy has the oldest star clusters, with an average age of 13.3 Myr. Star clusters in the northern galaxy have an average age of 10.4 Myr, and the star clusters in the bridge have an average age of 7.5 Myr. The star clusters in the bridge have the largest equivalent widths and are the youngest in the system.
We consider the derived ages to be upper limits for a couple of reasons. First, as described in Section 3, the continuum may be overestimated causing the H equivalent width to be underestimated. Second, the model metallicity is a factor of two lower than the measured value for Mrk 709. Given the known age-metallicity degeneracy, this may lead to an overestimate of the ages of the star clusters. To illustrate this, we show an additional model with in Figure 4.
| Source | H flux | H EW | Age | log | QLyc |
|---|---|---|---|---|---|
| (10-16 erg s-1 cm-2) | (Å) | (Myr) | () | (1049 s-1) | |
| Mrk 709 S | |||||
| 1s | 2.1(0.3) | 20(10) | (0.5)14.1(0.8) | 6.9(0.3) | 90(10) |
| 2s | 9.0(1.2) | 20(10) | (0.5)14.9(0.5) | 7.7(0.2) | 390(50) |
| 3s | 13.9(1.8) | 30(10) | (0.5)13.3(0.5) | 7.6(0.3) | 600(80) |
| 4s | 14.3(1.4) | 30(10) | (0.3)13.4(0.4) | 7.6(0.2) | 620(60) |
| 5s | 21.1(1.4) | 30(10) | (0.2)13.6(0.2) | 7.9(0.1) | 910(60) |
| 6s | 31.9(0.8) | 130(10) | (0.1)10.2(0.1) | 7.3(0.1) | 1380(40) |
| Mrk 709 N | |||||
| 1n | 1.1(0.1) | 100(50) | (0.8)10.7(1.5) | 6.0(0.6) | 50(10) |
| 2n | 1.5(0.3) | 80(50) | (0.9)11.1(2.1) | 6.2(0.7) | 70(10) |
| 3n | 10.9(0.6) | 110(20) | (0.3)10.4(0.4) | 6.9(0.2) | 470(30) |
| 4n | 9.1(0.5) | 130(20) | (0.4)10.2(0.4) | 6.8(0.2) | 390(20) |
| 5n | 0.7(0.1) | 150(110) | (1.1)9.8(2.9) | 5.6(0.9) | 30(10) |
| Bridge | |||||
| 1b | 1.9(0.1) | 200(20) | (0.1)9.2(0.2) | 5.8(0.1) | 80(10) |
| 2b | 2.1(0.1) | 210(10) | (0.0)9.1(0.1) | 5.8(0.1) | 90(10) |
| 3b | 3.7(0.1) | 590(50) | (0.2)5.0(0.1) | 5.1(0.2) | 160(10) |
| 4b | 3.2(0.1) | 380(20) | (0.1)7.8(0.2) | 5.7(0.1) | 140(10) |
| 5b | 1.1(0.1) | 260(20) | (0.1)8.7(0.2) | 5.5(0.1) | 50(10) |
| 6b | 8.0(0.1) | 420(20) | (0.2)7.5(0.2) | 6.0(0.1) | 350(10) |
| 7b | 3.8(0.1) | 270(130) | (1.0)8.6(1.3) | 6.0(1.3) | 160(10) |
| 8b | 12.0(0.1) | 300(10) | (0.1)8.5(0.1) | 6.4(0.1) | 520(10) |
| 9b | 1.5(0.1) | 340(10) | (0.1)8.2(0.1) | 5.5(0.1) | 70(10) |
| 10b | 2.6(0.1) | 530(30) | (0.0)5.1(0.5) | 5.0(0.1) | 110(10) |
| 11b | 7.1(0.1) | 320(10) | (0.1)8.3(0.1) | 6.1(0.1) | 310(10) |
| 12b | 2.4(0.1) | 1360(490) | (0.2)3.3(0.6) | 4.5(0.3) | 100(10) |
| 13b | 2.0(0.1) | 150(40) | (0.5)9.8(0.5) | 6.0(0.3) | 80(10) |
| 14b | 1.6(0.1) | 660(150) | (0.7)4.7(0.5) | 4.6(0.5) | 70(10) |
| 15b | 4.7(0.1) | 340(20) | (0.3)8.2(0.1) | 6.9(0.1) | 200(10) |
Note. — All uncertainties in this table are shown in parentheses. The H fluxes and EWs are measured from the HST imaging and are not corrected for extinction. The errors on the stellar masses do not include a systematic uncertainty of dex due to uncertainties in stellar evolution (Conroy et al., 2009).
4.2.2 Ionizing Luminosities
We estimate the production rate of ionizing photons QLyc from the star-forming regions using the following equation derived from Condon (1992) for a K gas:
| (4) |
This only provides a lower limit on the ionizing luminosity since some photons may be absorbed by dust or escape the region before ionizing hydrogen atoms.
Adopting a distance of 214 Mpc, we find that the ionizing luminosities are in the range of to . Assuming a “typical” O-type star (type O7.5 V) produces s-1 (Vacca et al., 1996), 30 to 1400 equivalent O stars are necessary to power the ionizing luminosities of the star clusters in Mrk 709, which is comparable to young massive star clusters in other dwarf starburst galaxies (e.g., Reines et al., 2008a, b).
4.2.3 Stellar Masses
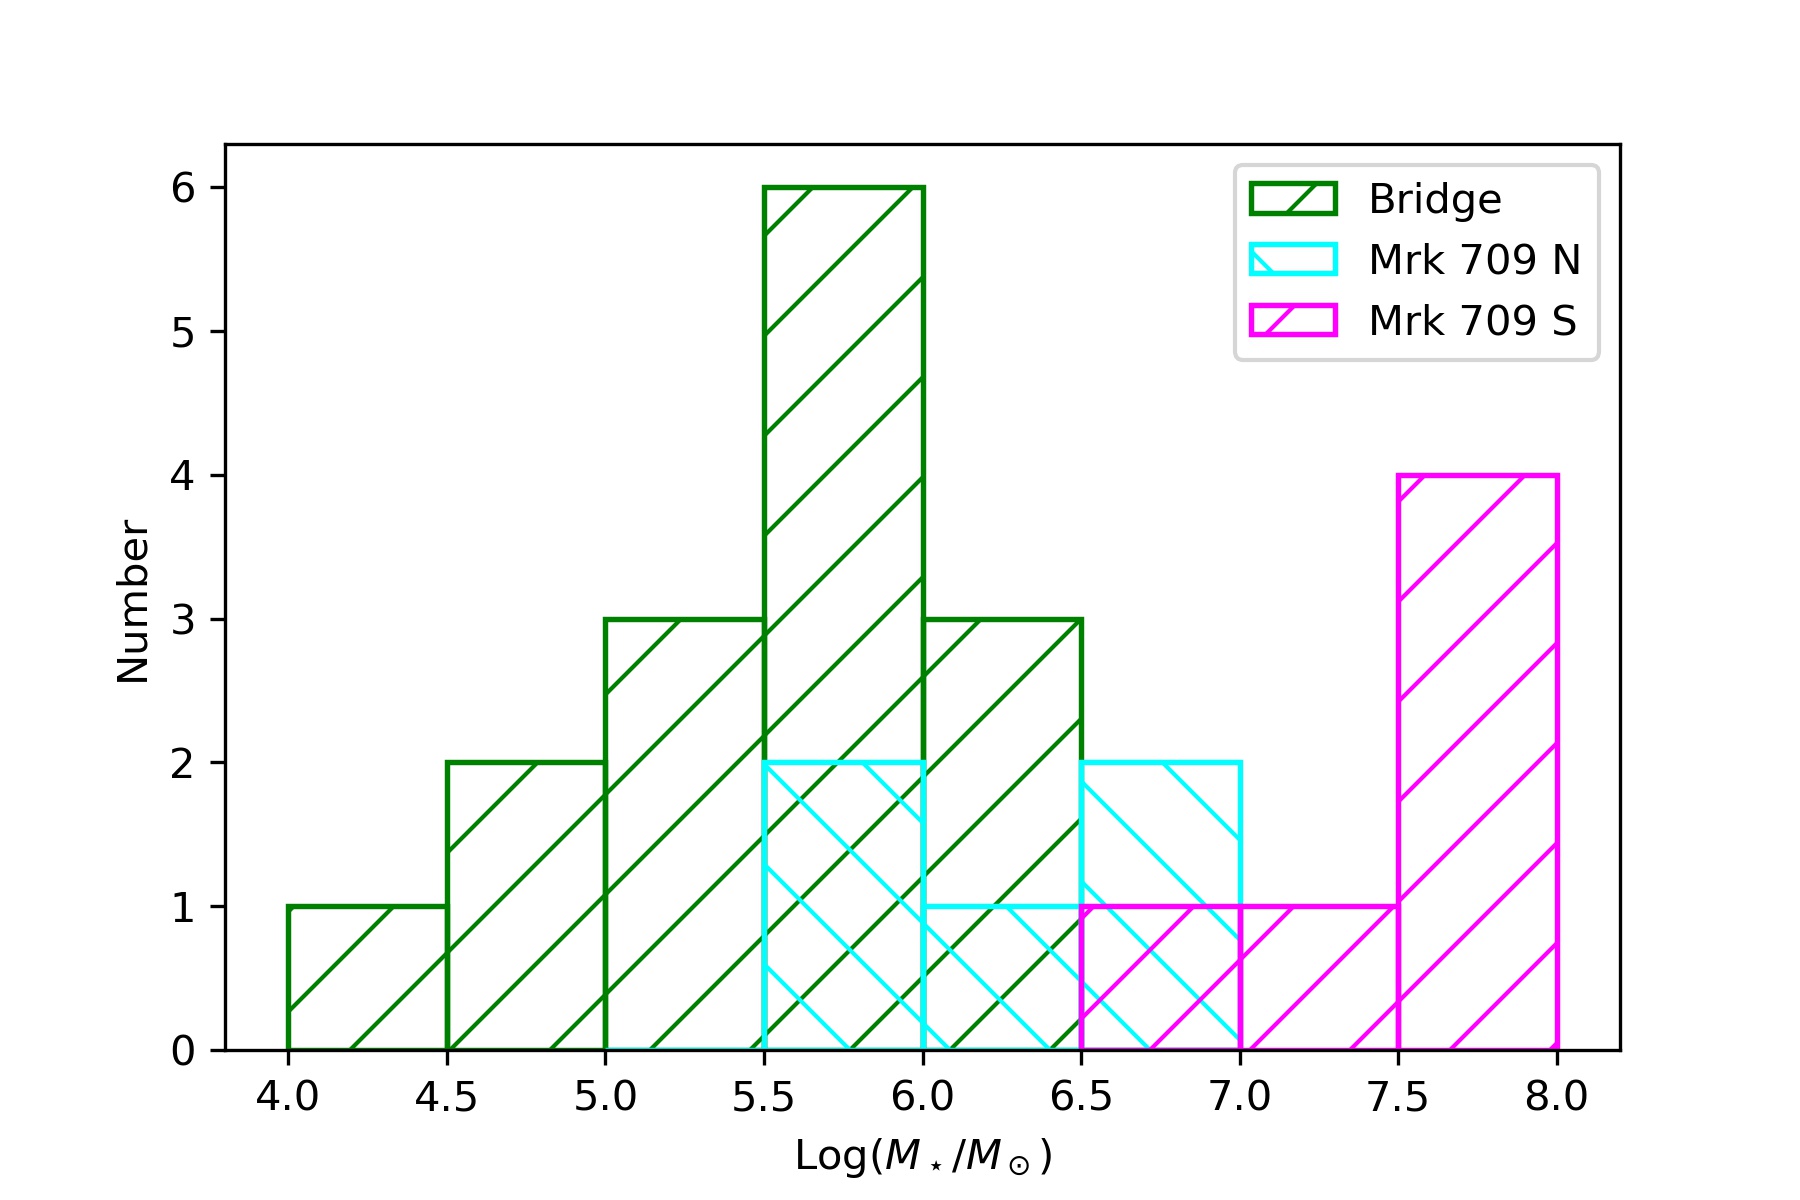
We estimate the stellar masses of young star clusters using the ionizing luminosities and ages derived above. The models predict the number of Lyman continuum photons as a function of age given an input total stellar mass ( in the model used here). Assuming stellar mass scales linearly with the Lyman continuum photon production, we use the model prediction of at the age of a cluster and multiply the input model mass by the ratio of the observed to the model ionizing luminosity. The stellar masses estimated using this method are in the range of (see Table 5).
The star clusters in Mrk 709 S are extremely massive with an average mass of . This is significantly larger than young massive star clusters in the local Universe (typically ; Whitmore et al. 2010, Reines et al. 2008b) and the star formation in Mrk 709 S is more akin to that seen in higher redshift irregular galaxies (i.e., clump cluster and chain galaxies, Elmegreen et al. 2009). Both the clusters in Mrk 709 S and the clumps in these higher redshift galaxies have typical masses of and each contain an average of their galaxy mass. The total mass in clumps relative to total galaxy mass is also similar at . The size scales are slightly different, however, with star forming regions in clump clusters and chain galaxies having typical sizes of kpc (Elmegreen & Elmegreen, 2005). This is comparable to the size of brightest central region in Mrk 709 S containing massive clusters.
The star clusters in Mrk 709 N and the bridge are also massive, but not as extreme as in Mrk 709 S. The average masses are and , for Mrk 709 N and the bridge respectively, which are comparable to massive globular clusters. The total cluster mass in Mrk 709 N is , roughly 2% of the total galaxy mass (; Reines et al. 2014).
5 The Massive Black Hole in Mrk 709 S
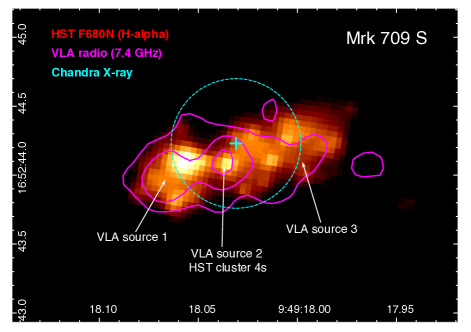
Reines et al. (2014) identified a candidate massive BH in Mrk 709 S based on high-resolution radio and X-ray observations from the VLA and Chandra, respectively. They find a compact () radio source with a 5 GHz luminosity of erg s-1 that is consistent with the position of a hard X-ray point source with erg s-1. The offset between the radio and X-ray sources is , which is within the astrometric uncertainties. Assuming the radio and X-ray emission are indeed coming from the same source, Reines et al. (2014) argue for a BH origin and estimate a mass in the range of using the fundamental plane of BH activity (e.g., Merloni et al., 2003; Falcke et al., 2004; Plotkin et al., 2012; Gültekin et al., 2019). A stellar-mass X-ray binary is firmly ruled out by the high radio luminosity.
5.1 A Radio-Detected Low-Luminosity AGN
Given that we cannot definitively say whether or not the radio and X-ray emission are indeed coming from the same physical source, we also consider separate origins for the radio and X-ray sources guided by our new HST imaging. Figure 6 shows that the X-ray source has a position consistent with multiple star clusters in Mrk 709 S, and could be possibly be an exceptionally luminous high-mass X-ray binary (Lehmer et al., 2019) provided the radio emission is not associated with the X-ray source. From Figure 6, we also see that radio source 2 is spatially coincident with star cluster 4s (see Tables 4 and 5). We therefore investigate whether the radio emission could plausibly come from a thermal HII region or have a supernova (SNe) origin following Reines et al. (2020).
Under the assumption that radio source 2 is an HII region associated with star cluster 4s, we can calculate the expected H flux and compare this value to the measured value of erg s-1 cm-2 (Table 5). Taking the 7.4 GHz flux density of 40 Jy given by Reines et al. (2014) and using Equations 3 and 4a in Condon (1992) with an electron temperature of K, we expect an H flux of erg s-1 cm-2 (modulo extinction) if the radio emission is thermal. This is a factor of higher than the measured H flux, which is exceptionally large even accounting for extinction due to dust. Reines et al. (2008a) and Reines et al. (2008b) find that this factor is in their studies of thermal radio emission associated with young, optically-visible star clusters in dwarf starburst galaxies. We therefore conclude that radio source 2 is dominated by non-thermal emission. This is consistent with the radio spectrum of source 2 (Reines et al., 2014), which shows flux density decreasing with frequency.
Next we show that the non-thermal radio emission from source 2 is unlikely to come from supernova remnants (SNRs) or younger SNe. Using the relation given by Chomiuk & Wilcots (2009) between the luminosity density of the brightest SNR/SNe in a galaxy and the SFR of the galaxy (and adopting the larger SFR of yr-1 from Reines et al. 2014), we expect the most luminous SNR/SNe in Mrk 709 S to have W Hz-1. The spectral luminosity at 1.4 GHz of radio source 2 is estimated by Reines et al. (2014) to be W Hz-1 assuming a spectral index of ().222While the spectral index is not well constrained and could be in the range of steep to flat, it is not inverted (Reines et al., 2014). Given that this value is approximately higher than the expected luminosity of the brightest SNR/SNe, it is highly unlikely that even multiple SNRs/SNe in cluster 4s could account for the radio emission. We therefore conclude that the most plausible explanation for the origin of radio source 2 is a massive BH.
This interpretation would have been further supported by the discovery of milliarcsecond-scale radio emission from source 2, which would have provided direct evidence of high brightness-temperature emission. However, the non-detection in our VLBI HSA observations (see §2.3) is still compatible with a massive BH. The angular resolution of the HSA observations is almost two orders of magnitude finer than that of the VLA observations, but the sensitivities are only comparable (4 Jy/beam vs. 5.2 Jy/beam). If source 2 is partially resolved into a core-jet object on milliarcsecond scales (which, given the VLA radio morphology, appears likely) the peak brightness could fall well below our HSA point source detection limit of Jy () at 1.4 GHz. The partial resolution of AGN emission in this way is commonplace: Deller & Middelberg (2014) performed a VLBI survey of 25,000 mJy radio sources (which should be dominated by radio AGN) detected in the VLA FIRST survey (Becker et al., 1995) and found that only 30–40% exhibited a milliarcsecond-scale core with a peak brightness % of the arcsecond-scale flux density.
Figure 6 shows that VLA radio source 2 is surrounded by additional radio emission in Mrk 709 S. The radio morphology is suggestive of lobes/outflow from the central AGN and the radio luminosity supports this scenario. We find that the measured radio luminosity is more than an order of magnitude larger than that expected from the combination of both thermal emission from HII regions and a population of SNRs/SNe in Mrk 709 S. Based on the H flux ( erg s-1 cm-2) of Mrk 709 S measured in the same elliptical aperture (15 10, PA = 110) as the radio emission, we expect the contribution from thermal radio emission to be W Hz-1 (Condon, 1992). Following Reines et al. (2020) and using the results of Chomiuk & Wilcots (2009), we expect a population of SNRs/SNe to contribute a cumulative spectral luminosity of W Hz-1. The sum of these values ( W Hz-1) is only 8% of the measured radio luminosity ( W Hz-1), strongly suggesting the radio emission is dominated by something other than HII regions and a population of SNRs/SNe. We therefore favor an AGN origin for the radio emission in Mrk 709 S.
If the X-ray source detected by Reines et al. (2014) is indeed associated with the massive BH (i.e., radio source 2), the X-ray luminosity would suggest the BH is radiating significantly below its Eddington luminosity. For a BH mass of 10 and an X-ray to bolometric correction of (Vasudevan & Fabian, 2009), the Eddington ratio would be (and even less for a more massive BH). A sub-Eddington BH such as this is expected to have a radiatively inefficient accretion flow (RIAF) and to be jet-dominated (e.g., Falcke et al., 2004), which is consistent with the observed radio emission. The optical line emission from such a weakly accreting BH could also easily be swamped by star formation and account for the HII-region-like line ratios measured in the SDSS spectrum obtained in a 3″ aperture (Reines et al., 2014).
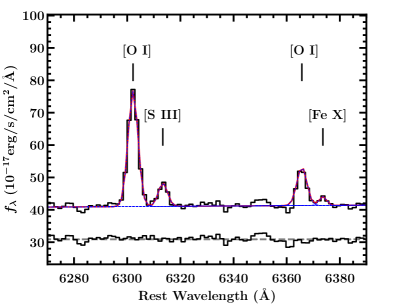
5.2 Optical Evidence for an AGN - [Fe X] 6374
In addition to radio and X-ray evidence for an AGN, we also detect [Fe X] 6374 in the SDSS spectrum of Mrk 709 S. [Fe X] is a known AGN coronal line (Penston et al., 1984; Netzer, 2013), and has a high-ionization potential of 262.1 eV (Oetken, 1977). This coronal line can be photoionized by the hard AGN continuum (e.g., Nussbaumer & Osterbrock, 1970; Korista & Ferland, 1989; Oliva et al., 1994; Pier & Voit, 1995), or more likely in Mrk 709 S, mechanically excited by out-flowing winds caused by radio jets (Wilson & Raymond, 1999).
The fit to the [Fe X] emission line in the SDSS DR16 spectrum is shown in Figure 7. The line has a flux of erg s-1 cm-2, and a signal-to-noise ratio . The peak of the [Fe X] line is above the surrounding continuum. While this is not a 3- flux detection, the line is detected at the correct wavelength and could be diluted from host-galaxy light in the 3″ SDSS aperture (Moran et al., 2002).
Despite the presence of [Fe X], all three standard narrow-line diagnostic diagrams (Kewley et al., 2006) indicate Mrk 709 S is powered by star formation. The lack of AGN-like line ratios can be explained by a combination of contamination from star formation in the host galaxy and a BH powered by a RIAF. For RIAFs with Eddington ratios of and lower, the broad lines, and potentially narrow lines, can disappear from the observed spectrum (Trump et al., 2011). Additionally, the relatively stronger radio emission in RIAFs (Meléndez et al., 2008) can drive relatively stronger radiative shock waves within the galaxy, which is likely causing the observed [Fe X] emission. Therefore, the X-ray, radio and optical emission are all best explained by a RIAF-driven active BH.
6 Summary and Discussion
We have presented a study of the low-metallicity dwarf-dwarf galaxy merger Mrk 709 with the goal of investigating star formation and AGN activity. Our new observations include HST H and continuum imaging, Keck spectroscopy, and VLBI with the High Sensitivity Array. Our main results are summarized below.
-
1.
Our spectroscopy confirms that Mrk 709 S and Mrk 709 N are part of the same system and our HST imaging reveals a striking bridge of young massive star clusters between the two galaxies, indicating an interaction/merger.
-
2.
We estimate ages, ionizing luminosities and stellar masses for 26 H-selected (i.e., young) star clusters in the Mrk 709 system. The youngest star clusters are in the bridge between the two dwarf galaxies, with ages Myr. The clusters in the galaxies have ages of Myr. Nearly all of the clusters we detect have stellar masses greater than , which is the typical mass of a globular cluster.
- 3.
-
4.
We present evidence confirming the presence of a massive BH in Mrk 709 S that was first identified by Reines et al. (2014) using VLA and Chandra observations. In particular, we demonstrate that the radio luminosity is much too high to be produced by thermal HII regions and/or SNe/SNRs but can easily be explained by an AGN. The radio morphology at VLA resolution is suggestive of a core-jet object, which is consistent with our HSA non-detection.
-
5.
We also detect the AGN coronal [Fe X] 6374 emission line in the SDSS spectrum of Mrk 709 S, likely caused by shocks from the radio jets of the active BH. This result, in combination with the detected radio lobes, is consistent with a RIAF-powered low-luminosity AGN.
We have presented definitive evidence that Mrk 709 N and S are in the midst of an interaction, resulting in a spectacular bridge of young massive star clusters between the two dwarf galaxies that resembles the “beads on a string” mode of star formation (e.g., Elmegreen & Elmegreen, 1983; Mullan et al., 2011; Tremblay et al., 2014). These clusters have high equivalent widths implying that they are extremely young ( 10 Myr) and therefore must have formed in the bridge. Their birth can be attributed to the tidal forces from the interaction. Tidal features such as tails and bridges can result in a “pile-up” of material that leads to dense cloud regions where it is possible for massive star clusters to form (Bournaud, 2010). There is also recent star formation in Mrk 709 N and S, likely due to an influx of new gas as the two components approach each other. Starbursts in merging galaxies most often occur at two points in the process of a merger: 1) when the galaxies make their first pass, and 2) at their final coalescence (Bournaud, 2010). The existence of two distinct galaxies, as well as the tidal bridge, indicates that Mrk 709 is in the early stages of a dwarf-dwarf merger.
There is also compelling evidence for an accreting massive BH in Mrk 709 S. Moreover, the BH has a position consistent with a compact clump of star formation with a derived age of Myr. While the spatial overlap could be a projection effect, this is in stark contrast to the massive BH in the dwarf starburst galaxy Henize 2-10 (Reines et al., 2011; Reines & Deller, 2012; Reines et al., 2016), which has no visible counterpart in optical or near-IR HST imaging. However, there are several young massive star clusters in the vicinity of the BH in that galaxy with dynamical friction timescales Myr, suggesting Henize 2-10 may represent a rare snapshot of nuclear star cluster formation around a preexisting massive BH (Nguyen et al., 2014). It is interesting to consider these different cases given that theories for the formation of BH seeds include collision in compact star clusters (Loeb & Rasio, 1994; Begelman et al., 2006; Lodato & Natarajan, 2006; Choi et al., 2015) as well as direct collapse scenarios (Portegies Zwart et al., 2004; Devecchi & Volonteri, 2009; Davies et al., 2011; Lupi et al., 2014; Stone et al., 2017).
Our findings demonstrate that Mrk 709, with a metallicity of only , may well be our best local analogue of high-redshift galaxies during the early stages of BH growth and globular cluster formation. Detailed multi-wavelength studies of additional BH-hosting star-forming dwarf galaxies are necessary to gain a more complete picture of the early stages of galaxy and BH evolution.
References
- Ahumada et al. (2020) Ahumada, R., Prieto, C. A., Almeida, A., et al. 2020, ApJS, 249, 3
- Astropy Collaboration et al. (2013) Astropy Collaboration, Robitaille, T. P., Tollerud, E. J., et al. 2013, A&A, 558, A33
- Astropy Collaboration et al. (2018) Astropy Collaboration, Price-Whelan, A. M., Sipőcz, B. M., et al. 2018, AJ, 156, 123
- Becker et al. (1995) Becker, R. H., White, R. L., & Helfand, D. J. 1995, ApJ, 450, 559
- Begelman et al. (2006) Begelman, M. C., Volonteri, M., & Rees, M. J. 2006, MNRAS, 370, 289
- Bekki (2008) Bekki, K. 2008, MNRAS, 388, L10
- Binggeli et al. (1988) Binggeli, B., Sandage, A., & Tammann, G. A. 1988, ARA&A, 26, 509
- Blanton et al. (2017) Blanton, M. R., Bershady, M. A., Abolfathi, B., et al. 2017, AJ, 154, 28
- Bournaud (2010) Bournaud, F. 2010, in Astronomical Society of the Pacific Conference Series, Vol. 423, Galaxy Wars: Stellar Populations and Star Formation in Interacting Galaxies, ed. B. Smith, J. Higdon, S. Higdon, & N. Bastian, 177
- Bradley et al. (2020) Bradley, L., Sipőcz, B., Robitaille, T., et al. 2020, astropy/photutils: 1.0.0, doi:10.5281/zenodo.4044744
- Choi et al. (2015) Choi, J.-H., Shlosman, I., & Begelman, M. C. 2015, MNRAS, 450, 4411
- Chomiuk & Wilcots (2009) Chomiuk, L., & Wilcots, E. M. 2009, ApJ, 703, 370
- Condon (1992) Condon, J. J. 1992, ARA&A, 30, 575
- Conroy et al. (2009) Conroy, C., Gunn, J. E., & White, M. 2009, ApJ, 699, 486
- Davies et al. (2011) Davies, M. B., Miller, M. C., & Bellovary, J. M. 2011, ApJ, 740, L42
- Deller & Middelberg (2014) Deller, A. T., & Middelberg, E. 2014, AJ, 147, 14
- Deller et al. (2019) Deller, A. T., Goss, W. M., Brisken, W. F., et al. 2019, ApJ, 875, 100
- Devecchi & Volonteri (2009) Devecchi, B., & Volonteri, M. 2009, ApJ, 694, 302
- Elmegreen & Elmegreen (1983) Elmegreen, B. G., & Elmegreen, D. M. 1983, MNRAS, 203, 31
- Elmegreen & Elmegreen (2005) —. 2005, ApJ, 627, 632
- Elmegreen et al. (2009) Elmegreen, B. G., Elmegreen, D. M., Fernandez, M. X., & Lemonias, J. J. 2009, ApJ, 692, 12
- Falcke et al. (2004) Falcke, H., Körding, E., & Markoff, S. 2004, A&A, 414, 895
- Gil de Paz et al. (2003) Gil de Paz, A., Madore, B. F., & Pevunova, O. 2003, ApJS, 147, 29
- Ginsburg & Mirocha (2011) Ginsburg, A., & Mirocha, J. 2011, PySpecKit: Python Spectroscopic Toolkit, ascl:1109.001
- Greene et al. (2020) Greene, J. E., Strader, J., & Ho, L. C. 2020, ARA&A, 58, 257
- Greisen (2003) Greisen, E. W. 2003, Information Handling in Astronomy - Historical Vistas, 285, 109
- Gültekin et al. (2019) Gültekin, K., King, A. L., Cackett, E. M., et al. 2019, ApJ, 871, 80
- Hunter (2007) Hunter, J. D. 2007, Computing in Science Engineering, 9, 90
- Johnson et al. (2000) Johnson, K. E., Leitherer, C., Vacca, W. D., & Conti, P. S. 2000, AJ, 120, 1273
- Kado-Fong et al. (2020) Kado-Fong, E., Greene, J. E., Greco, J. P., et al. 2020, AJ, 159, 103
- Kennicutt & Evans (2012) Kennicutt, R. C., & Evans, N. J. 2012, ARA&A, 50, 531
- Kettenis et al. (2006) Kettenis, M., van Langevelde, H. J., Reynolds, C., & Cotton, B. 2006, in Astronomical Society of the Pacific Conference Series, Vol. 351, Astronomical Data Analysis Software and Systems XV, ed. C. Gabriel, C. Arviset, D. Ponz, & S. Enrique, 497
- Kewley et al. (2006) Kewley, L. J., Groves, B., Kauffmann, G., & Heckman, T. 2006, MNRAS, 372, 961
- Korista & Ferland (1989) Korista, K. T., & Ferland, G. J. 1989, ApJ, 343, 678
- Lehmer et al. (2019) Lehmer, B. D., Eufrasio, R. T., Tzanavaris, P., et al. 2019, ApJS, 243, 3
- Leitherer et al. (1999) Leitherer, C., Schaerer, D., Goldader, J. D., et al. 1999, ApJS, 123, 3
- Lodato & Natarajan (2006) Lodato, G., & Natarajan, P. 2006, MNRAS, 371, 1813
- Loeb & Rasio (1994) Loeb, A., & Rasio, F. A. 1994, ApJ, 432, 52
- Lupi et al. (2014) Lupi, A., Colpi, M., Devecchi, B., Galanti, G., & Volonteri, M. 2014, MNRAS, 442, 3616
- Masegosa et al. (1994) Masegosa, J., Moles, M., & Campos-Aguilar, A. 1994, ApJ, 420, 576
- Meléndez et al. (2008) Meléndez, M., Kraemer, S. B., Armentrout, B. K., et al. 2008, ApJ, 682, 94
- Merloni et al. (2003) Merloni, A., Heinz, S., & di Matteo, T. 2003, MNRAS, 345, 1057
- Mezcua (2017) Mezcua, M. 2017, International Journal of Modern Physics D, 26, 1730021
- Moran et al. (2002) Moran, E. C., Filippenko, A. V., & Chornock, R. 2002, ApJ, 579, L71
- Mullan et al. (2011) Mullan, B., Konstantopoulos, I. S., Kepley, A. A., et al. 2011, ApJ, 731, 93
- Netzer (2013) Netzer, H. 2013, The Physics and Evolution of Active Galactic Nuclei
- Nguyen et al. (2014) Nguyen, D. D., Seth, A. C., Reines, A. E., et al. 2014, ApJ, 794, 34
- Nussbaumer & Osterbrock (1970) Nussbaumer, H., & Osterbrock, D. E. 1970, ApJ, 161, 811
- O’Connell et al. (1994) O’Connell, R. W., Gallagher, John S., I., & Hunter, D. A. 1994, ApJ, 433, 65
- Oetken (1977) Oetken, L. 1977, Astronomische Nachrichten, 298, 187
- Oke et al. (1995) Oke, J. B., Cohen, J. G., Carr, M., et al. 1995, PASP, 107, 375
- Oliva et al. (1994) Oliva, E., Salvati, M., Moorwood, A. F. M., & Marconi, A. 1994, A&A, 288, 457
- Paudel et al. (2018) Paudel, S., Smith, R., Yoon, S. J., Calderón-Castillo, P., & Duc, P.-A. 2018, ApJS, 237, 36
- Penston et al. (1984) Penston, M. V., Fosbury, R. A. E., Boksenberg, A., Ward, M. J., & Wilson, A. S. 1984, MNRAS, 208, 347
- Pier & Voit (1995) Pier, E. A., & Voit, G. M. 1995, ApJ, 450, 628
- Plotkin et al. (2012) Plotkin, R. M., Markoff, S., Kelly, B. C., Körding, E., & Anderson, S. F. 2012, MNRAS, 419, 267
- Portegies Zwart et al. (2004) Portegies Zwart, S. F., Baumgardt, H., Hut, P., Makino, J., & McMillan, S. L. W. 2004, Nature, 428, 724
- Reines & Comastri (2016) Reines, A. E., & Comastri, A. 2016, PASA, 33, e054
- Reines et al. (2020) Reines, A. E., Condon, J. J., Darling, J., & Greene, J. E. 2020, ApJ, 888, 36
- Reines & Deller (2012) Reines, A. E., & Deller, A. T. 2012, ApJ, 750, L24
- Reines et al. (2008a) Reines, A. E., Johnson, K. E., & Goss, W. M. 2008a, AJ, 135, 2222
- Reines et al. (2008b) Reines, A. E., Johnson, K. E., & Hunt, L. K. 2008b, AJ, 136, 1415
- Reines et al. (2010) Reines, A. E., Nidever, D. L., Whelan, D. G., & Johnson, K. E. 2010, ApJ, 708, 26
- Reines et al. (2014) Reines, A. E., Plotkin, R. M., Russell, T. D., et al. 2014, ApJ, 787, L30
- Reines et al. (2016) Reines, A. E., Reynolds, M. T., Miller, J. M., et al. 2016, ApJ, 830, L35
- Reines et al. (2011) Reines, A. E., Sivakoff, G. R., Johnson, K. E., & Brogan, C. L. 2011, Nature, 470, 66
- Shepherd (1997) Shepherd, M. C. 1997, in Astronomical Society of the Pacific Conference Series, Vol. 125, Astronomical Data Analysis Software and Systems VI, ed. G. Hunt & H. Payne, 77
- Stierwalt et al. (2017) Stierwalt, S., Liss, S. E., Johnson, K. E., et al. 2017, Nature Astronomy, 1, 0025
- Stone et al. (2017) Stone, N. C., Küpper, A. H. W., & Ostriker, J. P. 2017, MNRAS, 467, 4180
- Tremblay et al. (2014) Tremblay, G. R., Gladders, M. D., Baum, S. A., et al. 2014, ApJ, 790, L26
- Trump et al. (2011) Trump, J. R., Impey, C. D., Kelly, B. o. C., et al. 2011, ApJ, 733, 60
- Vacca et al. (1996) Vacca, W. D., Garmany, C. D., & Shull, J. M. 1996, ApJ, 460, 914
- van der Marel et al. (2002) van der Marel, R. P., Alves, D. R., Hardy, E., & Suntzeff, N. B. 2002, AJ, 124, 2639
- Vasudevan & Fabian (2009) Vasudevan, R. V., & Fabian, A. C. 2009, MNRAS, 392, 1124
- Whitmore et al. (2010) Whitmore, B. C., Chandar, R., Schweizer, F., et al. 2010, AJ, 140, 75
- Whitney et al. (2008) Whitney, B. A., Sewilo, M., Indebetouw, R., et al. 2008, AJ, 136, 18
- Wilson & Raymond (1999) Wilson, A. S., & Raymond, J. C. 1999, ApJ, 513, L115
- Zhang et al. (2020) Zhang, H.-X., Paudel, S., Smith, R., et al. 2020, ApJ, 891, L23