Revisiting FUSE O VI Emission in Galaxy Halos
Abstract
A significant fraction of baryons in galaxies are in the form of diffuse gas of the circumgalactic medium (CGM). One critical component of the multi-phases of CGM, the so-called ”coronal” warm-hot phase gas ( K) traced by O VI 1031.93, 1037.62 Å resonance lines, has rarely been detected in emission from galaxy halos other than Milky Way. Here we report four additional detections of O VI emission gas in the halos of nearby edge-on galaxies, NGC 4631 and NGC 891, using archival Far Ultraviolet Spectroscopic Explorer data and an updated data pipeline. We find the most intense O VI emission to be from fields forming a vertical line near the center of NGC 4631, despite the close proximity to the disk of two other fields. the existence of filamentary structures of more intense O VI emission superimposed within a diffuse and faint O VI halo in star-forming galaxies. Volume-filled O VI emission mapping is greatly needed to determine the structure and prevalence of warm-hot gas and the role it plays in the cycling of gas between the galaxy disk and the halo. Finally, we present the sensitivity of future funded and proposed UV missions (LUVOIR-A, LUVOIR-B, CETUS, and Aspera) to the detection of diffuse and faint O VI emission in nearby galaxy halos.
1 Introduction
In the Lambda Cold Dark Matter (CDM) paradigm, galaxies form at the centers of dark matter halos out of cooling and condensed gas into a central star-forming disk. While observations of the galaxies at the center of these halos have been conducted for over 100 years, we are only now able to understand the full picture of how gas outside of the central disk plays a key role in the evolution and star formation rate of the galaxy. This full picture of gas is important because a majority (%) of the gas in most galaxies will never end up in stars (Zaritsky & Courtois, 2017; Tumlinson et al., 2017; Behroozi et al., 2019). In these halos, the warm-hot ( K) phase of the CGM accounts for more mass than the stars within the parent galaxy. This phase is best traced by the O VI doublet, occurring at Å rest frame. This transition is extremely temperature sensitive, and is the strongest line transition that traces warm-hot phase gas. Emission from even this brightest transition occurs at low surface brightness which has challenged observers.
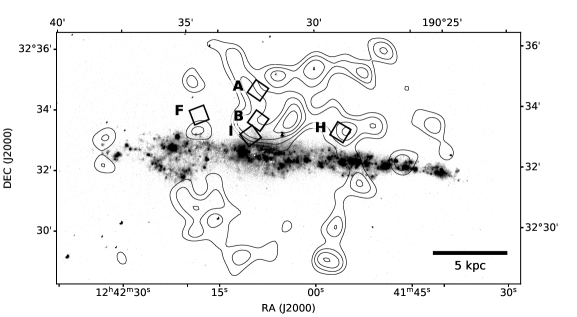
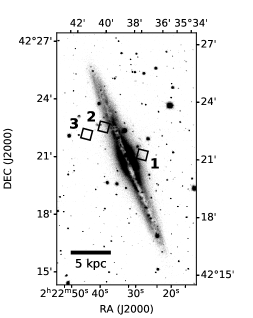
Due to the historical difficulty of measuring O VI emission, only three studies have presented detections of coronal O VI emission lines outside of the Milky Way: two in galaxy disks and one in the CGM (Otte et al., 2003; Grimes et al., 2007; Hayes et al., 2016). Otte et al. (2003)(hereafter O03) provides the most directly relevant results to this work. They searched for O VI emission beyond the disks of two nearby edge-on galaxies—NGC 4631 and NGC 891—using Far Ultraviolet Spectroscopic Explorer (FUSE, Moos et al. 2000) spectra. They detected coronal gas in two fields (30″ 30″ Field-of-view) of NGC 4631 and provided upper limits for NGC 891 (See Figure 1).
| Field | Program ID |
|
|
|
|
|
||||||||||
|---|---|---|---|---|---|---|---|---|---|---|---|---|---|---|---|---|
| NGC4631-A | p1340101 | 12h42m08.8s | +32d34m36.0s | 21536 | 12737 | 26.9 | ||||||||||
| NGC4631-B | p1340201 | 12h42m08.8s | +32d33m36.0s | 16218 | 11528 | 26.9 | ||||||||||
| NGC4631-A | c0570101 | 12h42m08.8s | +32d34m36.0s | 7153 | 6332 | 24.6 | ||||||||||
| NGC4631-F | c0570201 | 12h42m18.0s | +32d33m48.0s | 16339 | 13573 | 23.2 | ||||||||||
| NGC4631-F | c0570202 | 12h42m18.0s | +32d33m48.0s | 30228 | 18134 | 23.3 | ||||||||||
| NGC4631-H | c0570301 | 12h41m56.0s | +32d33m12.0s | 22866 | 15856 | 23.4 | ||||||||||
| NGC4631-I | c0570401 | 12h42m10.0s | +32d33m06.0s | 9392 | 8447 | 24.3 | ||||||||||
| NGC891-1 | b1140101 | 2h22m29.0s | +42d21m12.0s | 31594 | 27174 | 26.2 | ||||||||||
| NGC891-2 | b1140201 | 2h22m40.0s | +42d22m36.0s | 31440 | 27203 | 26.3 | ||||||||||
| NGC891-3 | b1140301 | 2h22m44.8s | +42d22m12.0s | 18485 | 15666 | 26.2 |
NGC 4631, also known as the Whale Galaxy, is a nearby edge-on barred spiral galaxy with companions NGC 4627 and NGC 4656 (Richter et al., 2018). NGC 4631 has a distance of 7.4 0.2 Mpc, and, based on H I data, is interacting with several nearby systems (Radburn-Smith et al., 2011). NGC 4631 was originally observed with FUSE because ROSAT observations indicated a concentration of soft X-ray emission above the plane of the galaxy but correlated with star formation activity in the plane (Murphy, 2002). Additional observations of NGC 891 were conducted later, in part because of similar soft X-ray emission detected by ROSAT. NGC 891 is a nearby, edge-on unbarred spiral galaxy at a distance of 9.1 0.4 Mpc (Radburn-Smith et al., 2011), but unlike NGC 4631, does not have any large companions. NGC 891 is usually compared to our own Milky Way galaxy, in both size and luminosity. There have been numerous studies of the halo of NGC 891 (Temple et al., 2005; Hodges-Kluck et al., 2018; Qu et al., 2019; Das et al., 2020), which indicate the presence of both neutral hydrogen, a hot halo, and warm ionized gas of less than solar metallicity. Observations by FUSE of NGC 4631 and NGC 891 were conducted between 2000 and 2004.
Here, we present an updated analysis of the FUSE data presented in O03, including several fields which were not included in their original published study. We detect coronal gas via O VI in several sightlines, three of which are aligned in a possible filamentary structure. In Section 2, we describe the FUSE data and our updated analysis. In Section 3, we describe our detections and limits for NGC 4631 and NGC 891. Finally, we discuss the implications of this new analysis in Section 4, including the impact on future EUV mission concepts.
2 Data and Analysis
Our analysis uses existing archival data from the FUSE telescope (Moos et al., 2000), which was launched in 1999 and operated for 8 years. The data used in this analysis is listed in Table 1.
2.1 The FUSE Telescope
FUSE was designed to observe in the extreme FUV (905-1187 Å), and was originally designed to follow up the Copernicus mission (Rogerson et al., 1973) with higher sensitivity and spectral resolution to capitalize on the rich variety of astrophysically important lines in the EUV. FUSE consists of four co-aligned off-axis parabola telescopes (each 352 387 mm), which each feed light to four Rowland circle type spectrographs. All four channels observe the same field of view, but two channels are optimized for 905-1105 Å while the remaining two are optimized for 1000-1187 Å. The FUSE focal plane consisted of two microchannel plate (MCP) detectors (Siegmund et al., 1997).
2.2 New unpublished data
The data presented here consists of 10 FUSE low-resolution aperture (LWRS) pointings, which include two galaxies (NGC 4631 and NGC 891) and is a mixture of previously published and unpublished data. The data presented here is publicly accessible.
2.3 Updated analysis of previously published data
2.3.1 FUSE data
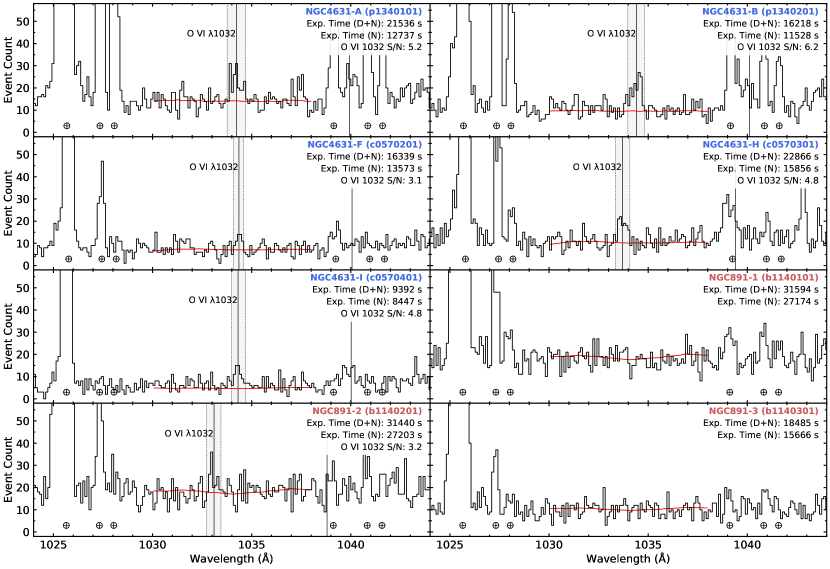
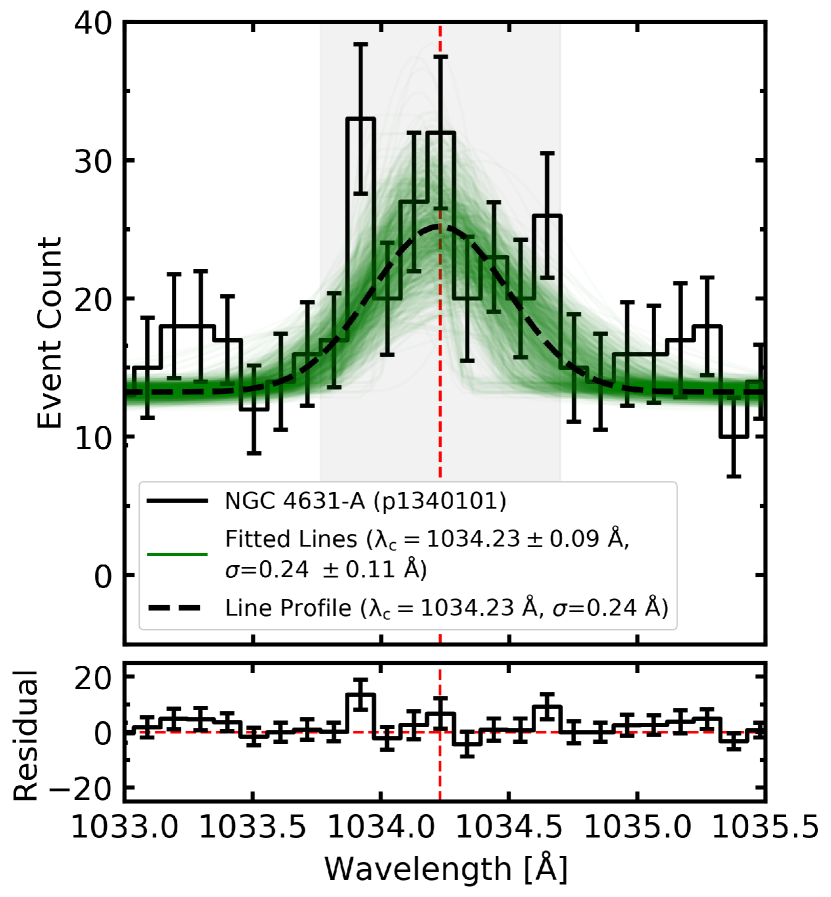
The FUSE raw data is downloaded from the Canadian Astronomy Data Centre. The data is further processed by the latest release of CalFUSE (v3.2.3, Dixon et al. 2007). We use the default pulse height range (between 2 and 25) of CalFUSE v3.2.3, which is wider than the range used by O03 (between 4 and 15). The extracted spectrum from exposures of each observing program ID are combined using FUSE Tools in C111https://archive.stsci.edu/fuse/analysis/toolbox.html (idf_combine, cf_bad_pixels, bpm_combine, and cf_extract_spectra), following the recommendation from the web instruction. This is to best estimate the background level when the targets are faint. Among the output of the pipeline, we use wavelength (WAVE) and the dead-time corrected counts values (WEIGHTS) as a spectrum (Figure 2). The background count spectrum (BKGD) is used to calculate the signal (Signal = WEIGHTS - BKGD). The raw counts spectrum (COUNTS) is also used for generating Poisson random noise added spectrum which is described in the following paragraph.
Before measuring the SNR of the O VI 1032 Å emission, we fitted the O VI 1032 Å line emission by a convolution of three functions 1) a Gaussian function as a O VI emission line model, 2) a function representing the FUSE point-spread-function (PSF), assumed to be Gaussian with a Full-Width Half-Maximum (FWHM)=0.021 Å (corresponds to the spectral resolution at the central wavelength of LiF1-A channel (1034.7 Å, R21000)), and 3) a top-hat function corresponding to the width of the LWRS slit (30″). Four parameters (Amplitude and the FWHM of the O VI emission model, a center of the convolved function, and a constant) are set as free parameters. For each spectrum, we have generated 1000 Poisson random-noise added spectra (according to the SNR at each spectrum bin). The convolved function is fitted to each noise added spectrum using a non-linear least square fitting method (scipy.optimize.curve_fit). An average and standard deviation of the fitted parameters (line center and FWHM) from 1000 fittings are determined as the parameter value and error. The fitting was not attempted for the spectra with no visible O VI 1032 Å emission line (NGC 891-1 and 3).
After the fitting, we measured SNR of the O VI 1032 Å emission line. The size of the extraction window (in the wavelength dimension) is determined as the width corresponding to 95% of the area of the final convolved function. The final convolved function is the convolution of the three functions (two Gaussians and one top-hat), adopting the O VI emission FWHM value from the fitting result. The width of the extraction windows are shown in the grey shaded region in Figure 2. The O VI signal count is calculated by the difference between the total event counts and the total background counts within the extraction window. The O VI signal count is converted to flux per unit angular area in both counts s-1 cm-2 sr-1 (Line Unit, LU) and ergs s-1 cm-2 arcsec-2. The FUSE effective area at the time of observation is estimated by the interpolation between the two closest FUSE effective area data to the epoch time of each observation. The time-dependent spectral effective area curves are available from the CalFUSE calibration files. The mean effective area values at 1035 Å are presented at Table 1.
2.3.2 ROSAT data
We re-analyzed the X-ray observation made by the ROSAT Position Sensitive Proportional Counter (PSPC, Truemper (1982)) on NGC 4631. The result was previously published by Wang et al. (1995).
Here we reproduce that result and show the soft X-ray band contour in Figure 1. The ROSAT data of NGC 4631 (sequence id: rp600129a00, rp600129a01) is downloaded from the ROSAT Data Archive at Goddard Space Flight Center. First, we examined the event rate extension (EVRATE) from the ancillary file (*_anc.fits) to manually define the good time intervals. This step is necessary to exclude bad time intervals contaminated by scattered solar X-rays. The remaining good time intervals are 14.2 ks from rp600129a00 and 3.5 ks from rp00129a01. With the remaining data (total 17.8 ks), we construct a 3D X-Ray data cube (X, Y, and pulse height) using the events list (STDEVT) from the basic file (*_bas.fits). The final soft-band X-ray image is made from the pulse height-invariant channels interval between 20 to 41, as described in Wang et al. (1995). This interval corresponds to the energy range 0.15-0.3 keV. The contour in Figure 1 is constructed with a pixel size of 5″ and smoothed by a FWHM=40″ Gaussian.
| Field | Program ID |
|
|
|
|
|
|
||||||||||||
|---|---|---|---|---|---|---|---|---|---|---|---|---|---|---|---|---|---|---|---|
| NGC4631-A | p1340101 | 4.9 | 6000 1200 | 2.7 0.5 | 73, 127 | 1034.23 0.09 | 0.56 0.25 | ||||||||||||
| NGC4631-B | p1340201 | 2.7 | 8300 1300 | 3.7 0.6 | 76, 76 | 1034.41 0.07 | 0.41 0.19 | ||||||||||||
| NGC4631-F | c0570201 | 2.8 | 2900 1000 | 1.3 0.4 | 23, 35 | 1034.36 0.08 | 0.15 0.15 | ||||||||||||
| NGC4631-H | c0570301 | 2.4 | 4700 1000 | 2.1 0.5 | 53, 71 | 1033.69 0.06 | 0.34 0.12 | ||||||||||||
| NGC4631-I | c0570401 | 1.6 | 8600 1800 | 3.9 0.8 | 41, 32 | 1034.32 0.07 | 0.39 0.29 | ||||||||||||
| NGC891-1 | b1140101 | 2.0 | 2200aaThese values are 3 upper limit from 1 Å-wide extraction window at around 1033.3 Å. | 1.0aaThese values are 3 upper limit from 1 Å-wide extraction window at around 1033.3 Å. | |||||||||||||||
| NGC891-2 | b1140201 | 1.5 | 2300 700 | 1.1 0.3 | 40, 124 | 1033.11 0.17 | 0.36 0.49 | ||||||||||||
| NGC891-3 | b1140301 | 4.1 | 2700aaThese values are 3 upper limit from 1 Å-wide extraction window at around 1033.3 Å. | 1.2aaThese values are 3 upper limit from 1 Å-wide extraction window at around 1033.3 Å. |
3 Result
3.1 NGC 4631
Figure 2 shows the resulting spectra (Day+Night) at the wavelength around O VI emission lines. The known airglow lines are visible in most of the spectra (H I 1025.7, OI 1025.8, 1027.4, 1028.2, 1039.2, 1040.9, 1041.7 Å; Earth symbols in Figure 2). The O VI 1038 Å line is not identifiable in most cases because it is blended with the airglow lines. However, the O VI 1032 Å line is visible at the airglow-free window between 1030 to 1038 Å. Among the FUSE observations in Table 1, NGC 4631-A (Program ID: c0570101) is not presented because of the short exposure time, although the data shows an O VI 1032 Å emission signal with SNR=2.7. Another observation, NGC 4631-F (Program ID: c0570202) is highly contaminated by unknown scattered light so the data is discarded from further analysis.
From the spectra, we derived O VI 1032 Å intensity, signal counts, background counts, line center and line FWHM values. Those values are presented in Table 2. In this work, O VI 1032 Å emission signal is detected from all five NGC 4631 fields, two (A, B) with SNR greater than 5, two (H, I) with SNR = 4.8, and the other (F) with SNR = 3.1. The derived O VI 1032 Å intensity value at field A (6000 1200 counts s-1 cm-2 sr-1) and field B (8300 1300 counts s-1 cm-2 sr-1) are higher than the ones reported by O03 (4600 1000 counts s-1 cm-2 sr-1 for field A and 8000 1000 counts s-1 cm-2 sr-1 for field B).
In particular, the signal from field A is estimated to be 30 % higher than the result from O03. This is because of the differences between the data reduction pipeline used in this work (CalFUSE v3.2.3) and O03 (CalFUSE v2.0.5), such as pulse height range, extraction window height, good time interval definition, wavelength calibration, etc. Among those differences, the difference in the pulse height range is the main cause of the difference in O VI intensity. O03 used a narrow pulse height range to reduce the background noise level. However, years later, it was reported that the use of a narrow pulse height range could result in flux losses (Dixon et al., 2007).
The line center and line FWHM values of field A and field B agree with the result of O03. Note that the derived FWHM value assumed a fully illuminated LWRS (30″ 30″). Therefore the derived FWHM values can be considered as a lower limit.
3.2 NGC 891
Figure 2 shows the Day+Night spectra of three NGC 891 fields (1,2,3) observed by FUSE LWRS. Previously all three fields were considered O VI 1032 Å non-detections. In this re-visit of the FUSE spectra, we find a 3.2 signal of O VI 1032 Å line emission at field 2, Field 1 and 3 still show non-detections but the lowest 3 upper limit ( 2200 counts s-1 cm-2 sr-1, field 1) is slightly increased compared to O03 ( 2000 counts s-1 cm-2 sr-1, the same field 1).
The derived O VI 1032 Å emission intensity, signal counts, background counts, line center and line FWHM values at field 2 are reported in Table 2, along with the 3 upper limit intensity at field 1 and 3. The line of sight velocity and line FWHM at field 2 are 342 51 km/s and 106 142 km/s, respectively.
4 Discussion and Conclusions
Here we discuss the potential implications of these O VI detections on our understanding of the distribution and kinematics of warm-hot coronal gas. We also discuss how this crucial component of galaxy halos can be best observed with future funded or proposed mission concepts.
4.1 Implications for O VI distribution
The expected morphological distribution of O VI emitting warm-hot gas is debated. Simulations from Corlies & Schiminovich (2016) show a filamentary and clumpy structure in the simulated O VI distribution that largely persists from to (e.g., Figure 6, therein). The empirical work done by the COS-Halos survey in absorption line systems shows large covering fractions for O VI absorption within kpc of star-forming galaxies (Werk et al., 2013). This implies a more uniformly diffuse O VI morphology in actively star-forming galaxies, .
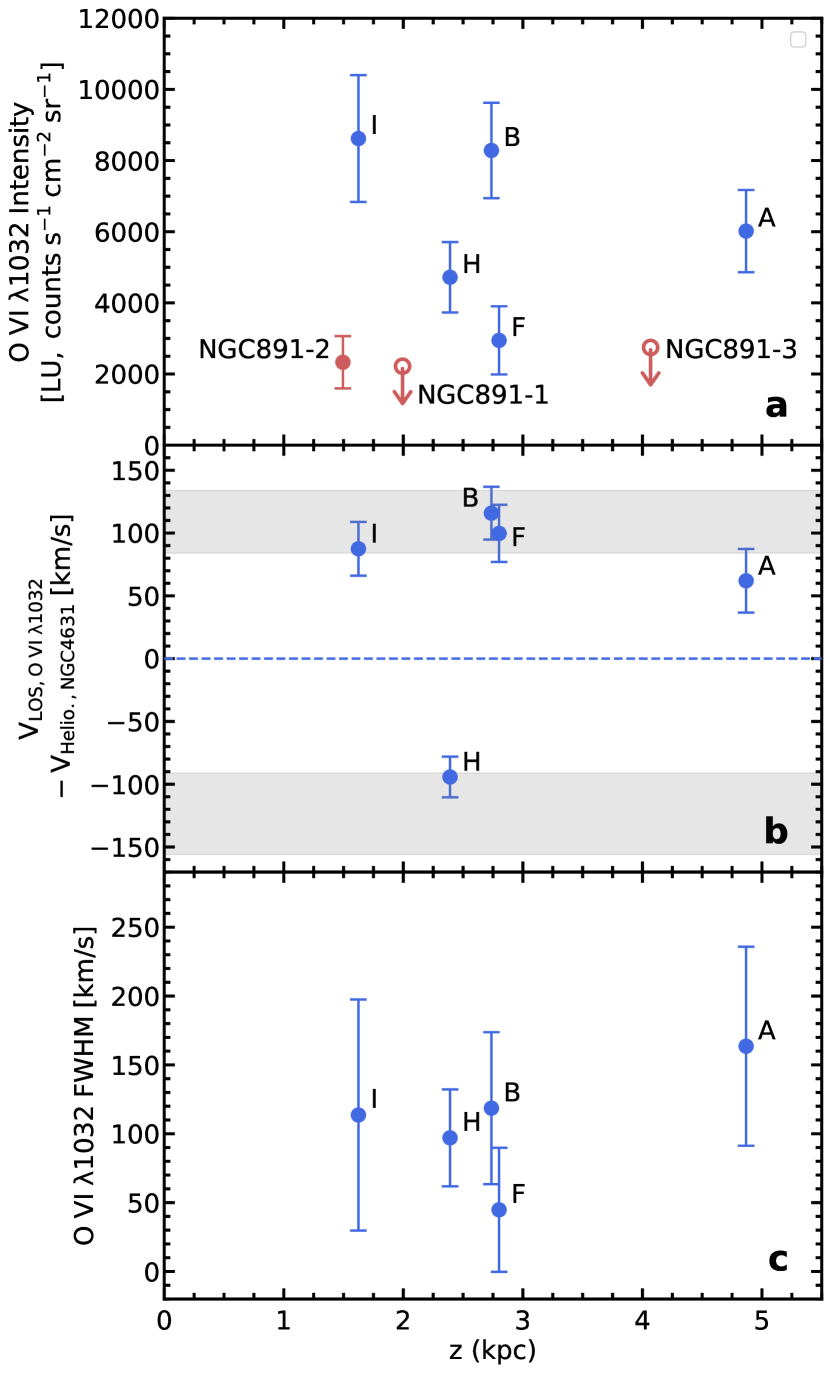
The vertical variation of intensity, velocity, and O VI FWHM for our sample fields are shown in Figure 3. The results of this study provide preliminary evidence for a filamentary or clumpy O VI morphological distribution in the inner CGM. NGC 4631 field F show the weakest O VI emission, despite their proximity to the disk and an H I supershell (Rand & van der Hulst, 1993). This stands in contrast to the stronger detections along a nearly vertical line connecting NGC 4631 fields A, B, and I, evidence for a O VI-emitting filament.
within a diffuse O VI halo that is less-intensely emitting, and below the detection threshold for many of the fields presented in this study. Filaments would then be the interface of infalling flows with a diffuse halo of fountain gas primarily originating from the disk. This interpretation brings the results from this study, Corlies & Schiminovich (2016), and Werk et al. (2013) into agreement. The simulated O VI halo in Figure 6 from Corlies & Schiminovich (2016) would suggest this is the most likely scenario. Volume-filled mapping observations of O VI in emission are needed for a more definitive view on the morphology of warm-hot halos in nearby galaxies.
The filament structure along fields A, B, and I lies above a well-documented molecular gas outflow near the disk (Irwin et al., 2011; Rand, 2000). The strength of the O VI detections are stronger along the central filament than near the periphery of the disk. This is potentially due to the outflowing gas near the central molecular outflow interacting with infalling material within the filament, heating the gas, and enhancing O VI emission. Alternatively, the giant magnetic rope features discovered in Mora-Partiarroyo et al. (2019) may be altering the distribution of, or otherwise interacting with, the ionized O VI-emitting gas.
4.2 Implications for O VI kinematics
Panel (b) of Figure 3 shows the vertical kinematic distribution of O VI emitting gas in each of the observed fields in NGC 4631, relative to the galaxy’s systemic velocity. NGC 4631 field H is the only field on the rotationally approaching side of the galaxy, while the other fields are all on the receding side.
Though there are only five fields included, the vertical O VI kinematics can be compared to other inner-halo phase kinematics. Gas kinematics above spiral galaxy disks are expected to kinematically ‘lag’ the underlying disk rotation due to angular momentum conservation of ejected disk matter (Bregman, 1980). Wu (2014) obtained vertical slit spectroscopy using the Apache Point Observatory (APO) 3.5-m Telescope to study the vertical kinematics of H emission in NGC 4631. The O VI filament along fields A, B, and I most closely correspond to slit 2 in the central field from Wu (2014). The H kinematics along that slit show roughly the same velocity magnitude as we find along fields A, B, and I (within uncertainties). However, for recently outflowing gas, one would expect the largest rotational velocity to be in the field closest to the disk – it will lag the disk rotation more intensely the further out it travels. It is not clear that that behavior is found along fields A, B, and I.
Fields F and H, which lay further from the galaxy’s center radially, both show velocities very close to the rotation curve at their radial distance, as inferred by an H I position-velocity diagram along the major axis (data from Heald et al. 2011; presented in Wu 2014). This regular rotation further supports the hypothesis that the O VI emitting gas from fields F and H represent originally shock-heated ejected matter that is cooling and falling down back onto the galaxy’s disk. We note that these inferences are made using a small number of available data points, and that a spectroscopic, volume-filled O VI emission mapping campaign is needed for more robust conclusions.
Panel (c) of Figure 3 includes the measured O VI FWHM values as a function of vertical distance. The FWHM values are relatively uniform and show no clear trend or behavior.
4.3 Implications for O VI emission detection/mapping with future missions
Studies of galaxy halos using HST-COS have yielded a significant amount of information and insight into the composition of various CGM components (Werk et al., 2013), including the seemingly large covering fraction of O VI. But the limitations of relying on infrequent background QSOs to probe foreground galaxy halos is clear with this work. The limited spatial coverage by FUSE of NGC 4631 and NGC 891 demonstrate that full coverage of a galaxy halo is needed to definitively conclude if there is a uniform or filamentary distribution of O VI gas. Here we briefly discuss the possibilities of doing wide-field, imaging spectroscopy over a full galaxy halo, comparing several proposed and funded mission concepts.
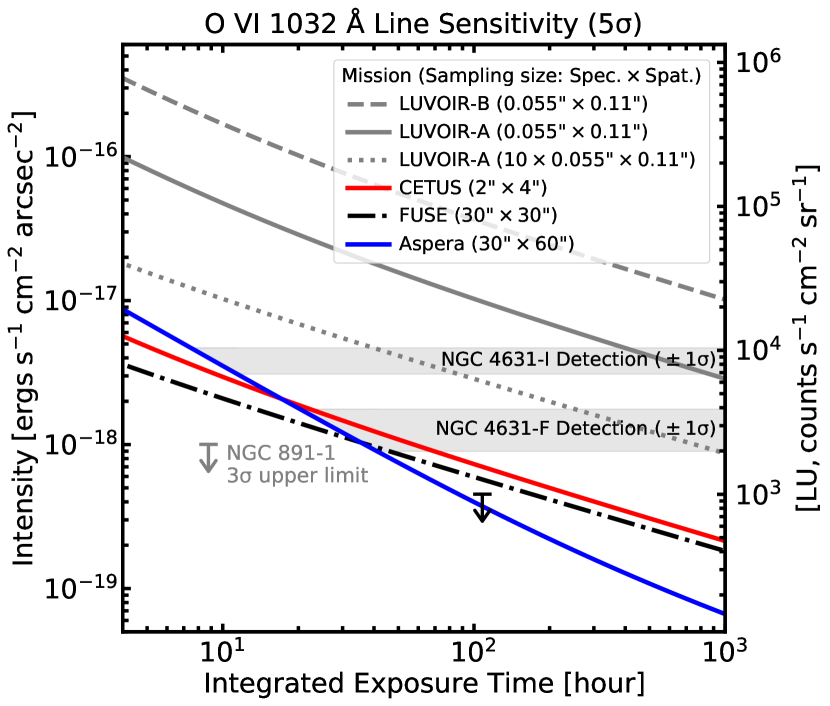
The signature of O VI is extremely faint and spread out over a large angular area for nearby galaxies (10s of arcmin), which motivates a wide field but high throughput telescope with moderate spectral resolution. Moderate spectral resolution will allow us to distinguish between nearby geocoronal lines and identify the velocity shift of the O VI line. The FUSE telescope had relatively low throughput (2% end-to-end throughput), but a high enough effective area (27 cm2) to be sensitive to the detections described in this paper. For the detections described here, the dominant noise source was the FUSE detector background. The sensitivity of FUSE to the O VI line is shown in Figure 4, the black dash-dotted line, with the detection limits from NGC 4631 and NGC 891 shown.
We compare this performance with the performance of three proposed UV missions: LUVOIR-A, LUVOIR-B (The LUVOIR Team, 2019), and CETUS (Heap et al., 2019). LUVOIR (grey lines), despite its large aperture, has extremely small resolution elements from the micro-shutter array (0.054″ 0.108″; spectral spatial). This limits the ultimate amount of light collected in any one resolution element, which is challenging for very nearby targets and yields low sensitivity, even for very large apertures. Co-adding many micro-shutter elements together provides better sensitivity (dotted grey line shows 10 resolution elements binned together). CETUS (red line) performs very similarly to FUSE, per a 2″ 4″ (spectral spatial) area on the slit. We put details of the sensitivity calculation in Appendix A.
We contrast these mission concepts with Aspera, a recently funded NASA Pioneer’s SmallSat (PI: Dr. Carlos Vargas). Aspera was explicitly designed to observe O VI from nearby edge-on galaxies, and is able to reach a higher sensitivity than FUSE, LUVOIR, or CETUS per resolution element for exposures greater than 30 hours, despite its small size and low cost. Aspera’s design is directly inspired by FUSE and uses four off-axis parabola primary mirrors and Rowland circle spectrographs to achieve high throughput and moderate resolution while covering a large spatial area. Aspera is designed with a resolution element of 30″ 60″ (spectral spatial) area on the slit. Aspera can simultaneously observe a total area of 2′ 45′ region, split into four 30″ 45′ size slits. Aspera’s spectral resolution is 2000 at 1035 Å.
4.4 Conclusions
In this paper, we analyze the archival FUSE spectra from the halo of two nearby star-forming, gas-rich, edge-on galaxies, NGC 4631 and NGC 891. We re-processed the raw FUSE data using the latest version of the FUSE data reduction pipeline. Among the five FUSE pointings on NGC 4631, we have found three new O VI emission detections and confirmed the two previously known detections. Among the three FUSE pointings on NGC 891, we have found one O VI emission detection, contrary to the previously reported non-detections on all three pointings. The intensity and spatial distribution of the NGC 4631 O VI detections cannot be explained with a simple diffuse halo model surrounding the galaxy. Our results imply that a discrete filamentary structure exists in the warm-hot phase above the central disk of NGC 4631, within a lower intensity uniformly diffuse, regularly rotating halo. The warm-hot gas detections closest to the disk’s periphery of NGC 4631 most likely represent a diffuse component that originates from the disk. A weak O VI detection is also observed from one field in NGC 891.
Observations of O VI provide a window into an important CGM phase for galaxies. A well designed small telescope can provide better sensitivity in a shorter time than a very large telescope which is not optimized around this type of wide field, diffuse signal. In these cases, a specifically designed mission such as Aspera, funded via the NASA Pioneers Program, can answer extremely important science questions at a fraction of the cost of a Flagship mission.
Acknowledgement
We thank the anonymous reviewer for their comments on this work.
References
- Behroozi et al. (2019) Behroozi, P., Wechsler, R. H., Hearin, A. P., & Conroy, C. 2019, MNRAS, 488, 3143, doi: 10.1093/mnras/stz1182
- Bregman (1980) Bregman, J. N. 1980, ApJ, 236, 577, doi: 10.1086/157776
- Cheng et al. (1997) Cheng, K. P., Collins, N., Angione, R., et al. 1997, UITVi; Vol. U
- Corlies & Schiminovich (2016) Corlies, L., & Schiminovich, D. 2016, ApJ, 827, 148, doi: 10.3847/0004-637X/827/2/148
- Das et al. (2020) Das, S., Sardone, A., Leroy, A. K., et al. 2020, ApJ, 898, 15, doi: 10.3847/1538-4357/ab97b9
- de Vaucouleurs et al. (1991) de Vaucouleurs, G., de Vaucouleurs, A., Corwin, Herold G., J., et al. 1991, Third Reference Catalogue of Bright Galaxies
- Dixon et al. (2007) Dixon, W. V., Sahnow, D. J., Barrett, P. E., et al. 2007, PASP, 119, 527, doi: 10.1086/518617
- France et al. (2017) France, K., Fleming, B., West, G., et al. 2017, in Society of Photo-Optical Instrumentation Engineers (SPIE) Conference Series, Vol. 10397, Society of Photo-Optical Instrumentation Engineers (SPIE) Conference Series, 1039713, doi: 10.1117/12.2272025
- Grimes et al. (2007) Grimes, J. P., Heckman, T., Strickland, D., et al. 2007, ApJ, 668, 891, doi: 10.1086/521353
- Hayes et al. (2016) Hayes, M., Melinder, J., Östlin, G., et al. 2016, ApJ, 828, 49, doi: 10.3847/0004-637X/828/1/49
- Heald et al. (2011) Heald, G., Józsa, G., Serra, P., et al. 2011, A&A, 526, A118, doi: 10.1051/0004-6361/201015938
- Heap et al. (2019) Heap, S., Arenberg, J., Hull, T., Kendrick, S., & Woodruff, R. 2019, arXiv e-prints, arXiv:1909.10437. https://arxiv.org/abs/1909.10437
- Hodges-Kluck et al. (2018) Hodges-Kluck, E. J., Bregman, J. N., & Li, J.-t. 2018, ApJ, 866, 126, doi: 10.3847/1538-4357/aae38a
- Irwin et al. (2011) Irwin, J. A., Wilson, C. D., Wiegert, T., et al. 2011, MNRAS, 410, 1423, doi: 10.1111/j.1365-2966.2010.17510.x
- Kennicutt et al. (2003) Kennicutt, Robert C., J., Armus, L., Bendo, G., et al. 2003, PASP, 115, 928, doi: 10.1086/376941
- Moos et al. (2000) Moos, H. W., Cash, W. C., Cowie, L. L., et al. 2000, ApJ, 538, L1, doi: 10.1086/312795
- Mora-Partiarroyo et al. (2019) Mora-Partiarroyo, S. C., Krause, M., Basu, A., et al. 2019, A&A, 632, A11, doi: 10.1051/0004-6361/201935961
- Murphy (2002) Murphy, E. M. 2002, Observations of O VI Emission in the Halo of NGC 4631, FUSE Proposal
- Otte et al. (2003) Otte, B., Murphy, E. M., Howk, J. C., et al. 2003, ApJ, 591, 821, doi: 10.1086/375535
- Pfeffermann et al. (1987) Pfeffermann, E., Briel, U. G., Hippmann, H., et al. 1987, in Society of Photo-Optical Instrumentation Engineers (SPIE) Conference Series, Vol. 733, Soft X-ray optics and technology, 519
- Qu et al. (2019) Qu, Z., Bregman, J. N., & Hodges-Kluck, E. J. 2019, ApJ, 876, 101, doi: 10.3847/1538-4357/ab17df
- Radburn-Smith et al. (2011) Radburn-Smith, D. J., de Jong, R. S., Seth, A. C., et al. 2011, ApJS, 195, 18, doi: 10.1088/0067-0049/195/2/18
- Rand (2000) Rand, R. J. 2000, ApJ, 535, 663, doi: 10.1086/308869
- Rand & van der Hulst (1993) Rand, R. J., & van der Hulst, J. M. 1993, AJ, 105, 2098, doi: 10.1086/116587
- Richter et al. (2018) Richter, P., Winkel, B., Wakker, B. P., et al. 2018, ApJ, 868, 112, doi: 10.3847/1538-4357/aae838
- Rogerson et al. (1973) Rogerson, J. B., Spitzer, L., Drake, J. F., et al. 1973, ApJ, 181, L97, doi: 10.1086/181194
- Siegmund et al. (1997) Siegmund, O. H., Gummin, M. A., Stock, J. M., et al. 1997, in Society of Photo-Optical Instrumentation Engineers (SPIE) Conference Series, Vol. 3114, EUV, X-Ray, and Gamma-Ray Instrumentation for Astronomy VIII, ed. O. H. Siegmund & M. A. Gummin, 283–294, doi: 10.1117/12.283775
- Siegmund et al. (2020) Siegmund, O. H. W., McPhate, J. B., Curtis, T., et al. 2020, in Society of Photo-Optical Instrumentation Engineers (SPIE) Conference Series, Vol. 11454, Society of Photo-Optical Instrumentation Engineers (SPIE) Conference Series, 114541H, doi: 10.1117/12.2561753
- Temple et al. (2005) Temple, R. F., Raychaudhury, S., & Stevens, I. R. 2005, MNRAS, 362, 581, doi: 10.1111/j.1365-2966.2005.09336.x
- The LUVOIR Team (2019) The LUVOIR Team. 2019, arXiv e-prints, arXiv:1912.06219. https://arxiv.org/abs/1912.06219
- Truemper (1982) Truemper, J. 1982, Advances in Space Research, 2, 241, doi: 10.1016/0273-1177(82)90070-9
- Tumlinson et al. (2017) Tumlinson, J., Peeples, M. S., & Werk, J. K. 2017, ARA&A, 55, 389, doi: 10.1146/annurev-astro-091916-055240
- Wang et al. (1995) Wang, Q. D., Walterbos, R. A. M., Steakley, M. F., Norman, C. A., & Braun, R. 1995, ApJ, 439, 176, doi: 10.1086/175162
- Werk et al. (2013) Werk, J. K., Prochaska, J. X., Thom, C., et al. 2013, ApJS, 204, 17, doi: 10.1088/0067-0049/204/2/17
- Wu (2014) Wu, C. 2014, Doctoral Dissertation, New Mexico State University
- Zaritsky & Courtois (2017) Zaritsky, D., & Courtois, H. 2017, MNRAS, 465, 3724, doi: 10.1093/mnras/stw2922
Appendix A Sensitivity Calculation
| Parameters |
|
|
|
Aspera | Unit | ||||||
|---|---|---|---|---|---|---|---|---|---|---|---|
| O VI 1032 line intensity | 21800 | 1550 | 1270 | 827 | counts s-1 cm-2 sr-1 | ||||||
| 9.83E-18 | 7.01E-19 | 5.72E-19 | 3.73E-19 | erg s-1 cm-2 arcsec-2 | |||||||
| Effective area | 7.1E+04 | 1.1E+03 | 27 | 2.1 | cm2 | ||||||
| Full slit length | 91 | 120 | 30 | 2700 4bbFour 45′ 30″ slits | arcsec | ||||||
| Spatial sampling | 0.110 | 4 | 30 | 60 | arcsec | ||||||
| Slit width | 0.055 | 2 | 30 | 30 | arcsec | ||||||
| Total background rate at MCP | 1.05 | 0.30 | 0.96 | 0.30 | counts s-1 cm-2 | ||||||
| Extraction aperture size (Spatial) | 0.0159 | 0.0508 | 0.0800 | 0.0047 | cm | ||||||
| Extraction aperture size (Spectral) | 0.0292 | 0.0844 | 0.0960 | 0.0087 | cm | ||||||
| Total signal count | 82 | 125 | 281 | 29 | counts | ||||||
| Noise (MCP Background) | 14 | 22 | 54 | 2 | counts | ||||||
| Noise (Total RSS) | 16 | 25 | 56 | 6 | counts | ||||||
| Total Signal to Noise Ratio | 5.0 | 5.0 | 5.0 | 5.0 | |||||||
| GraspccEffective area full slit length slit width | 98.4 | 73.3 | 6.7 | 192.6 | cm2 arcmin2 | ||||||
We calculate diffuse O VI 1032 Å emission line sensitivity of the past (FUSE) and future (LUVOIR-A, LUVOIR-B, CETUS, and Aspera) UV missions. The detector of all four missions is micro-channel plate (MCP). The lines are assumed to be slightly redshifted to 1035 Å. We have considered only two sources of noise for the calculation: target shot-noise and intrinsic MCP background noise, because those two are the dominant sources of noise at the wavelength around 1030 Å. Other sources of noise could be earthshine (not applicable for LUVOIR or CETUS), Zodiacal light, or instrument-specific scattered/stray light, but their contribution to the noise would be negligible at this wavelength range. Earthshine (assuming the Earth limb angle 15∘) and Zodiacal light are considerably dimmer than 10-21 ergs s-1 cm-2 arcsec-2 (COS Instrument Handbook222https://hst-docs.stsci.edu/cosihb). Scattered/stray light is assumed to be well-managed with quality optics, proper opto-mechanical arrangements and baffling. With the two kinds of noise sources, the sensitivity is calculated as a function of exposure time. The result is presented in Figure 4. Representative SNR breakdown is shown in Table A.1 for the case of LUVOIR-A, CETUS, FUSE, and Aspera at 1035 Å with the exposure time of 388,000 sec (4.5 days, the nominal total exposure time per exposure of Aspera mission). The grasp (effective area field-of-view) of the four missions are also shown in Table A.1.
Below we describe the justification of adopted parameters. The resulting sensitivity curves are the best estimates based on the available information and will be different if there are changes to the parameter values. As guidance for the impact of changes to the sensitivity, we have checked the sensitivity curve of the missions with two additional cases, (1) 20% larger effective area with 20% smaller background noise and (2) 20% smaller effective area with 20% larger background noise with respect to the baseline values. The sensitivity will be increased by 0.09-0.13 dex for case (1), and decreased by 0.11-0.13 dex for case (2).
A.1 LUVOIR
The instrument parameters of LUVOIR-A and B are estimated from the LUVOIR mission concept study final report (The LUVOIR Team, 2019). LUMOS-G155L grating is chosen because the grating is expected to have the highest sensitivity to the O VI emission while provide a reasonable diffuse-source spectral resolution (R2500), assuming a fully-illuminated micro shutter (0.110″0.055″). LUMOS can open 840 micro shutters simultaneously within the 2 2 micro shutter array field of view. The effective area of G155L grating at 1035 Å is estimated by assuming the spectral shape of the effective area curve from Figure 8 of France et al. (2017), scaled by the peak effective area value of G155L grating from Table 8-9 of the LUVOIR final report (The LUVOIR Team, 2019) for both LUVOIR-A and LUVOIR-B concepts. MCP background rate of 1.05 counts s-1 cm-2 is taken from France et al. (2017). The extraction aperture size (293 m 159 m) corresponds to the size of fully-illuminated un-vignetted open area of a single microlens shutter size (corresponds to 0.054 0.108 are on sky, physically 79 m 159 m) with 1 Å width on the detector. This assumes unit magnification of LUMOS FUV G155L optics.
A.2 CETUS
CETUS instrument parameter values are adopted from CETUS final report (Heap et al., 2019). Point/Slit spectrograph (PSS) with LUV G117 grating mode is chosen because this is the only available CETUS configuration to observe local O VI 1032 Å emission line. The effective area of CETUS G117 configuration at 1035 Å is estimated from Figure 1-3 of Heap et al. (2019). MCP background rate is assumed as 0.3 counts s-1 cm-2. The MCP background rate is estimated by the summation of the atomic layer deposited (ALD) MCP background rate measured at the ground (0.05 counts s-1 cm-2) and the expected difference between the flight and ground background rate with ALD MCP with satellite mass of 2.6 metric ton (0.25 counts s-1 cm-2, Siegmund et al. (2020)). The extraction aperture size on the detector (844 m 508 m) corresponds to the size of O VI emission with 1 Å width, fully-illuminated 2″ 4″ (spectral spatial) area on the slit. 1:2 ratio of the sampling element size is chosen arbitrarily to be aligned with the sampling shape of LUVOIR micro shutter. The length of CETUS PSS LUV slit is 2′, so 30 such sampling elements can be observed simultaneously.
A.3 FUSE
Although FUSE is already retired, an estimation with FUSE is also shown as a reference. Here we took the instrument parameters as per the NGC 4631-A observation (Effective area=26.9 cm2, Total background rate=0.96 counts s-1 cm-2) and the FUSE instrument handbook333https://archive.stsci.edu/fuse/ih.html. The field of view of LWRS is 30″ 30″. The extraction aperture size corresponds to the footprint of fully illuminated LWRS on the detector at around 1035 Å (Height: 800 m; identified from detector image, width: 960 m; corresponds to 1.08 Å).
A.4 Aspera
Aspera instrument parameters are adopted from Aspera proposal that was submitted to 2020 NASA Pioneers Announcement of Opportunity (Vargas et al. Private Comm.). Effective area of 2.1 cm2 at 1035 Å and total background rate of 0.3 counts s-1 cm-2 are used for the sensitivity calculation. The extraction aperture size (47 m 87 m) on the detector corresponds to the size of 1 Å width O VI emission with fully-illuminated 30″ 60″ (spectral spatial) area on the slit. By employing the step-and-stare concept observation, Aspera can effectively map the spatial distribution of O VI emission in galaxy halos.