A multi-agent reinforcement learning model of reputation and cooperation in human groups
Collective action demands that individuals efficiently coordinate how much, where, and when to cooperate. Laboratory experiments have extensively explored the first part of this process, demonstrating that a variety of social-cognitive mechanisms influence how much individuals choose to invest in group efforts. However, experimental research has been unable to shed light on how social cognitive mechanisms contribute to the where and when of collective action. We build and test a computational model of human behavior in Clean Up, a social dilemma task popular in multi-agent reinforcement learning research. We show that human groups effectively cooperate in Clean Up when they can identify group members and track reputations over time, but fail to organize under conditions of anonymity. A multi-agent reinforcement learning model of reputation demonstrates the same difference in cooperation under conditions of identifiability and anonymity. In addition, the model accurately predicts spatial and temporal patterns of group behavior: in this public goods dilemma, the intrinsic motivation for reputation catalyzes the development of a non-territorial, turn-taking strategy to coordinate collective action.
1 Introduction
Efficient group coordination is a crucial underpinning of collective action. Communities that successfully undertake collective action rely on rules and conventions delineating not just how much individuals should contribute to group efforts, but crucially where and when individuals should contribute [1]. Human communities often rely on spatial coordination strategies, such as territoriality and privatization, to maintain irrigation and fishery systems [2, 3] and to provide community services [4]. In other such social-ecological systems, temporal coordination strategies such as turn-taking and rotation schemes are central to the sustainable harvesting of natural resources [5, 6, 7]. Spatial and temporal strategies similarly appear to coordinate group behavior in animal collectives [8, 9, 10, 11]. How such coordination strategies emerge is a major unanswered question for cooperation research [6, 12].
Laboratory research has identified a range of social cognitive mechanisms that guide individuals to act prosocially [13, 14, 15, 16]. However, these studies have not mapped the effects of such mechanisms (i.e., how much for individuals to cooperate) onto the emergence of group coordination strategies (i.e., where and when for individuals to cooperate). The laboratory has primarily focused on abstract economic games where the main task for participants is to choose how much to cooperate [17, 18, 19, 20, 21, 22]. Tasks with rich spatial and temporal dynamics have been used in a small percentage of prior experimental studies (e.g., [23, 24]). Unfortunately, such tasks are not amenable to analysis with traditional modeling tools, impeding progress on the question of how various individual-level factors contribute to the emergence of group strategies.
Multi-agent deep reinforcement learning provides a natural approach for addressing problems with rich spatial and temporal dynamics, including strategy games like Go [25], Capture the Flag [26], and StarCraft [27]. Classical multi-agent reinforcement learning algorithms perform well in these competitive contexts but—due to their selfish maximization of reward—fail to resolve collective action problems [28, 29]. Intrinsic motivation [30] offers a method to augment these algorithms with social preferences, echoing the social cognitive processes observed in humans (e.g., [31, 32, 33]). Algorithms with such intrinsic motivation can succeed at achieving cooperation, overcoming the difficulties posed by incentive conflict and spatiotemporal complexity [34, 35, 36, 37, 38, 39].
In contrast with extensive application of reinforcement learning algorithms to model individual human decision making [40, 41], multi-agent reinforcement learning has not found widespread use in scientific models of processes within human groups. The present work applies multi-agent deep reinforcement learning to construct a computational model of the temporal and spatial dynamics of human cooperation. In particular, we explore how an intrinsic motivation for reputation (i.e., a social cognitive mechanism) affects the emergence of cooperation and coordination strategies within groups.
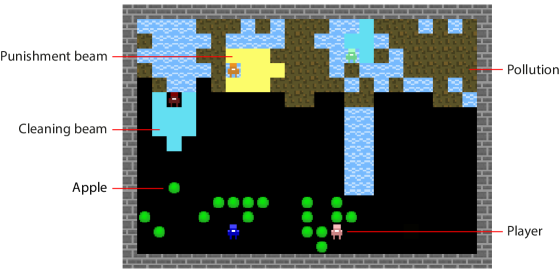
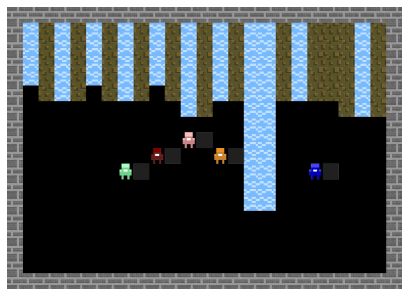
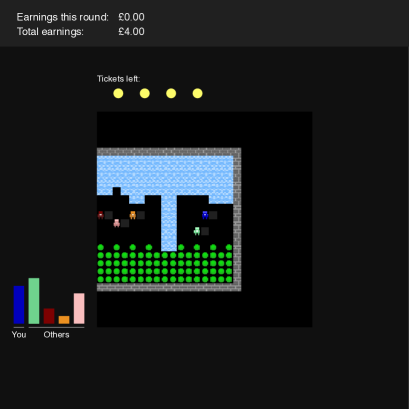
A large number of multi-agent studies have simulated group cooperation in Clean Up, a public goods task in a 2-dimensional, video game-like environment (Figure 1a; [34, 36, 37, 38, 42, 43, 44, 45, 46]). Clean Up draws inspiration from social dilemmas in the real world [7, 47, 48, 49], incorporating greater spatial and temporal complexity than the abstracted public goods games typically studied in behavioral economics [1, 50]. In Clean Up, group members—referred to as “agents” in reinforcement learning research—are all embodied in a virtual world. They do not face a binary cooperate-defect choice, and are not tasked with selecting a single scalar number of how much to contribute. Instead, they choose motor actions (e.g., move forward, move left, pause) based on their observation of their environment. Depending on the context, such actions may “add up” to sequences that correspond with cooperation, defection, and other higher-level strategies. Each episode of Clean Up places a small group () into a two-dimensional environment, measuring spaces and consisting of an orchard and a river. The aim of each individual group member is to collect apples from the orchard. Each group member receives one reward for every apple they collect. Apples can regrow after they are harvested. Apple growth is driven by the cleanliness of the geographically separate river. The river fills up with pollution with a constant probability over time. As the proportion of the river filled with pollution increases, the growth rate of apples monotonically decreases. If they physically leave the orchard and move to the river, group members can clear away bits of the pollution, thus contributing to a public good of cleanliness. Group members are also able to punish their peers. Unlike prior tasks, group members must put active effort into collecting the benefits of the public good by harvesting apples from the orchard. Individuals must balance the costs and benefits of time spent harvesting apples and contributing to the public good (Figure 1b). Critically, preliminary computational studies have indicated that a diverse range of coordination strategies suffice to resolve the collective action problem in Clean Up, drawing to varying degrees on spatial [34, 36] and temporal solutions [38]. Clean Up thus provides an ideal setting to explore whether social cognitive mechanisms can steer groups toward greater cooperation and particular coordination strategies.
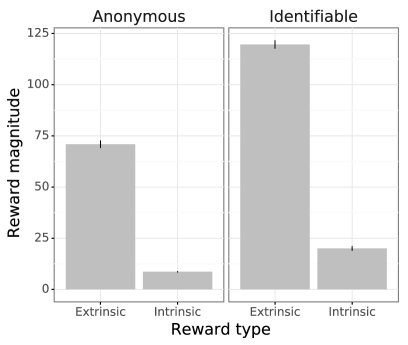
We constructed a computational model of group behavior in public goods dilemmas with advantage actor-critic [51, 52], a commonly used deep reinforcement learning algorithm (see Materials and Methods). Like other reinforcement learning agents, the advantage actor-critic algorithm places a strong emphasis on the importance of reward for guiding behavior and decision-making—echoing the importance placed upon reward in behavioral economics [53]. The algorithm’s behavior is influenced by both extrinsic reward (externally determined incentives; e.g., the payoff dictated by the rules of a game or task) and intrinsic reward (internally generated incentives [30]; cf., satisfaction generated by social cognitive mechanisms in the brain). In this experiment, we investigated the intrinsic motivation for reputation [54, 55] and its influence on group coordination strategies. The core of our computational model is the overall reward signal , comprising the extrinsic reward and the intrinsic reward :
| (1) | |||
| (2) |
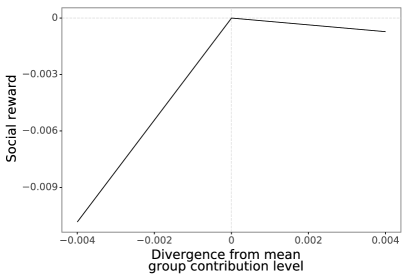
Here is one’s own contribution level (i.e., the amount of pollution cleaned from the river), is an estimated or observed average of the group’s contribution levels, and and are scalar parameters. The and parameters control how much is affected by one’s score falling behind and rising above the group average score, respectively. This function echoes the utility functions used in prior analytic [33], agent-based [56], and reinforcement learning [36] models comparing individual behavior to group norms. For the experiments here, we parameterize the model with and . The intrinsic motivation for reputation reflects primarily an aversion to having a lower reputation than one’s peers, which potentially decreases one’s desirability as a partner or associate [18, 57]. Secondarily, the intrinsic motivation reflects an aversion to peers taking advantage of one’s efforts, since exploitability diminishes one’s fitness relative to others [58].
2 Results
We simulated rounds of Clean Up with our computational model and compared its behavior against the behavior of groups of human participants in Clean Up. In both the model and the behavioral experiment with humans, we test the effects of the motivation for reputation by comparing two conditions: (1) an identifiable condition, in which group members are individually distinguishable and thus contribution behavior is common knowledge,111See a human group playing an identifiable round here: https://youtu.be/ohQrN46n9sQ. and (2) an anonymous condition, in which group members are largely indistinguishable and cannot perfectly monitor contribution behavior222See a human group playing an anonymous round here: https://youtu.be/AqCKDibiE9Q.. Identifiability allows the intrinsic motivation for reputation to act, whereas anonymity mitigates its influence on decision making.
After training artificial agents with multi-agent reinforcement learning for our model, we simulated rounds of Clean Up and compared the agents’ behavior against the behavior of groups of human participants () in Clean Up. For further details on the correspondence between the computational model and behavioral experiment design, see Materials and Methods.
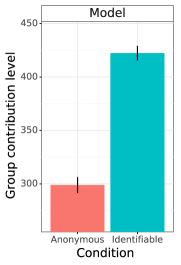
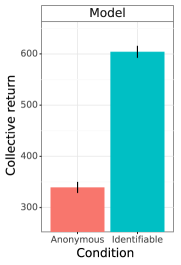
We begin by validating the effects of the intrinsic motivation for reputation on group outcomes in our computational model. As expected, identifiability produced a significant increase in group contribution levels, (repeated-measures ANOVA, Figure 2a). This increase in contribution levels led to significantly higher collective returns, (repeated-measures ANOVA, Figure 2a). When motivated to cultivate a good reputation, group members in the model increase their cooperativeness, resulting in higher payoffs for the entire group.
Having confirmed that our computational model successfully captures the effect of reputation on how much to cooperate, we next leverage the model to make novel predictions about the emergent spatial and temporal dynamics of group behavior. We focus on two behavioral questions informed by research on social-ecological systems. Specifically, we ask whether groups of humans sustain cooperation by allocating responsibility for public goods maintenance through spatial territories (“territoriality”; [59]) or through temporal rotation schemes (“turn taking”; [60]). Because prior reputation studies have focused on abstract economic games, they offer no predictions for these questions.
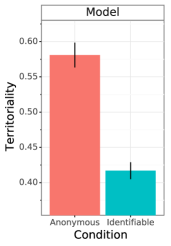
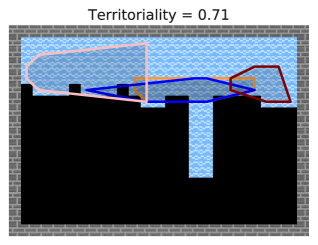
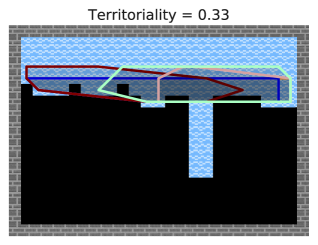
In the model, the intrinsic motivation for reputation appears not to catalyze a territorial approach to maintaining the public good. We observe significantly more spatial overlap between group member territories in the identifiable condition than in the anonymous condition, (repeated-measures ANOVA, Figure 2b). Example patterns of high and low territoriality from the computational model are presented in 2b.
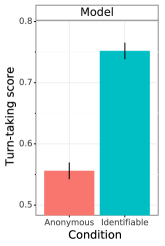
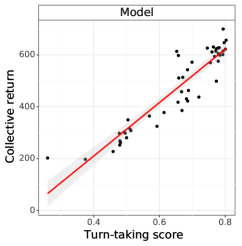
Instead, groups in the model appear to coordinate their efforts with a temporal rotation scheme. After measuring the extent to which group members’ take “turns” entering and cleaning the river, we observe significantly greater turn taking under identifiable conditions—when the intrinsic motivation for reputation influences behavior—than under anonymous conditions, (repeated-measures ANOVA, Figure 2c). Example patterns of low and high turn taking from the computational model are presented in Figure 2c. Further, results from the model confirm that this turn-taking strategy is associated with higher group performance. Across episodes, the more a group relied on a turn-taking rotation scheme, the higher the collective return it received, (linear regression, Figure 2c).
Our computational model suggests that the intrinsic motivation for reputation should not only increase a group’s average contribution level in Clean Up, but also generate a turn-taking, non-territorial strategy for coordinating group efforts. We next evaluate the effectiveness of the model by exploring data collected from a behavioral experiment with human participants.
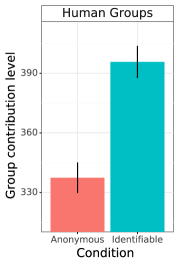
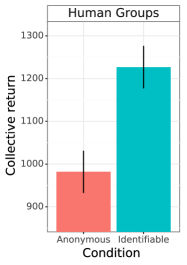
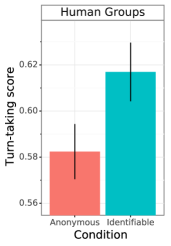
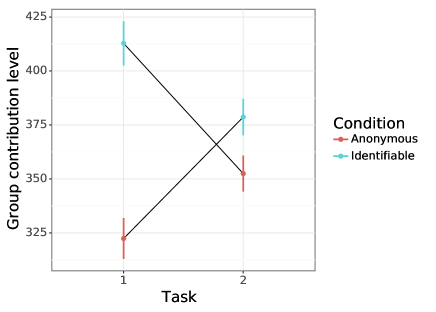
As expected, conditions of identifiability lead human groups to substantially increase their contribution levels. Group contribution level is significantly higher in the identifiable condition than in the anonymous condition, (repeated-measures ANOVA, Figure 3a). Similarly echoing findings from prior experiments, collective return for human groups increased significantly in the identifiable condition, (repeated-measures ANOVA, Figure 3a).
The crucial test for the model is whether it predicts the presence of spatial or temporal strategies for human groups—the where and when of cooperation. Consequently, we next analyze spatial and temporal patterns of group behavior in our human data.
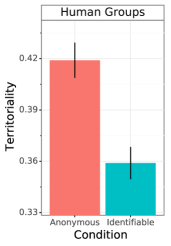
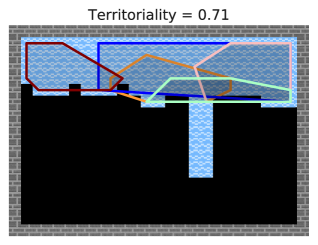
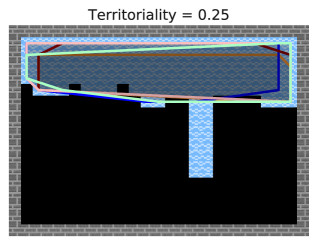
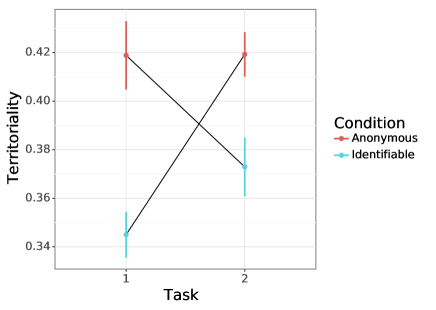
As in the model, reputational motivation does not lead human groups to rely on spatial coordination in Clean Up. Human groups exhibited significantly less territoriality in the identifiable condition than in the anonymous condition, (repeated-measures ANOVA, Figure 3b). Example patterns of low and high territoriality from the human groups are provided in Figure 3b.
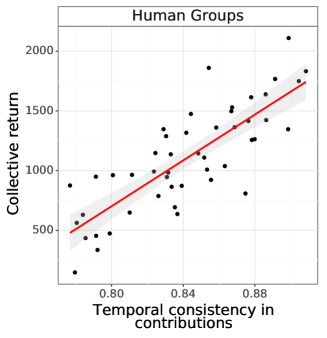
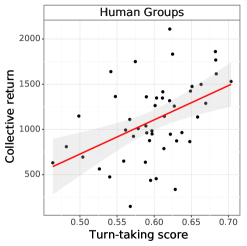
In contrast, participants were substantially more reliant on rotation schemes to organize collective action. There was significantly greater turn taking in the identifiable condition than in the anonymous condition of the human behavioral experiment, (repeated-measures ANOVA, Figure 3c). Example patterns of low and high turn taking from the human groups are provided in Figure 3c. As in the model, rotating responsibility for contributions was associated with improved group performance. The more a group relied on a turn-taking strategy, the higher the collective return it tended to achieve, (linear regression, Figure 3c).
3 Discussion
The ability to resolve collective action problems is a hallmark of human sociality. Humans do not encounter these dilemmas in a vacuum: group approaches to cooperation and defection must be coordinated over space and time. Through our evolutionary history, we have developed powerful psychological mechanisms to navigate this complex socio-physical landscape [61, 62, 63].
In this work, we bring together behavioral research and multi-agent reinforcement learning to model the emergence of coordination strategies in public goods dilemmas. The model we propose springs from two broad lines of influence: first, behavioral research demonstrating the effects of social cognition on individual prosociality [18, 33, 50], and second, studies showing the capabilities of multi-agent deep reinforcement learning algorithms [26, 27, 64]. Rather than analyzing decisions in abstracted economic games, our research explores behavior in a temporally and spatially extended task. Here, cooperation is a composite strategy aggregating decisions about where and when to act, rather than a simple choice of how much to contribute. We endow the reinforcement learning agents in our model with an intrinsic motivation [30] for reputation [19, 20, 65, 66]. We use this computational model to make detailed predictions about how this intrinsic motivation influences the coordination of group behavior.
Notably, previous multi-agent studies have observed the emergence of diverse temporal and spatial strategies in Clean Up, depending on the intrinsic motivation incorporated into each group member [34, 37, 38]. Our results suggest that the performance of multi-agent deep reinforcement learning agents can be fruitfully compared with behavior recorded from human groups on the same task.
Our model captures the substantial improvements in outcomes produced when individuals can track reputations, in accord with previous studies. Individuals increase their contributions when motivated to achieve a good reputation, resulting in significant increases in group return. The model further generates new insight into how social cognitive processes shape group strategies for cooperation. Reputation tracking catalyzes a non-territorial turn taking-like strategy, resulting in consistent maintenance of the public good.
The new approach introduced here has implications beyond the study of reputation. This framework draws our understanding of multi-agent reinforcement learning closer to our understanding of human cognition and behavior. It expands the toolkit available to investigate and examine mechanisms of group cooperation [67]. How does the temporal and spatial structure of human interaction affect our ability to solve collective action problems [68]? What intrinsic motivations can support the formation and maintenance of institutions [69]? Answers to these questions can help us scaffold collective action and strengthen cooperation in communities of humans and artificially intelligent agents.
4 Materials and Methods
In addition to this overview, precise details of the computational model and human behavioral experiment are provided in the supplementary information.
Clean Up is a public goods task in a two-dimensional, video game-like environment, measuring 23 by 16 spaces (Figure 1a; see [36]). In the Clean Up task, the aim is to collect apples from an orchard. Each group member gains one point for every apple he or she collects. Apples can regrow after they are harvested; apple regrowth is driven by the cleanliness of a geographically separate river. The river fills up with pollution with a constant probability over time. As the proportion of the river filled with pollution increases, the regrowth rate of apples monotonically decreases. For sufficiently high pollution levels, no apples will regrow.
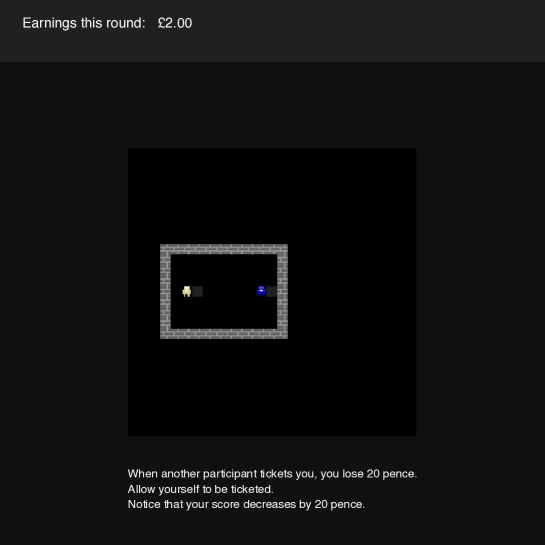
Group members have a water beam tool which allows them to clean pollution from the river. The public good in Clean Up is the regrowth rate of the orchard. Group members contribute to the public good by cleaning the river. Group members also possess a “ticketing” tool, providing a mechanism for costly punishment [70, 71]. The ticketing tool allows them to lower the scores of other group members. It costs four points to ticket another group member; the group member receiving the ticket loses 40 points.
We train the agents in the model using independent multi-agent reinforcement learning based on policy gradients. Concretely, each agent individually comprises a deep neural network, with no parameter sharing between different agents. The inputs to the neural network are the pixels representing the agent’s local view of the environment and temporally smoothed data on its own contributions and the contributions of its peers. The outputs from the network are a policy (a probability distribution over the next action to take in the environment) and a value function (an estimate of the agent’s discounted future return under the policy). The network architecture consists of a convolutional neural network with kernel, stride and output channels, a two-layer multi-layer perceptron with hidden units in each layer, a long short-term memory (LSTM) [72] of hidden size , and linear layers for the policy logits and value function.
In independent multi-agent reinforcement learning, each agent learns a policy intended to maximize its value from some initial state under the joint policy of all agents. The value for agent is defined to be , where is a discount factor and is a random variable representing the reward at time given the actions sampled from the stochastic policies and the stochastic transition function of the environment. We use for our experiments. Each policy is parameterized by , the weights of the neural network described previously.
Policy gradient methods perform gradient ascent on the parameters of the neural network to maximize the value. The policy gradient theorem [73, 74] provides a method for updating the policy parameters based on a sample trajectory, a set of tuples obtained by the agents interacting with the environment. The parameters are updated by , where is the realized return from time on the given trajectory and is a learning rate. To reduce variance, we use the learned value function as a baseline, replacing by in the previous equation. This algorithm is known as advantage actor-critic. We use the RMSProp optimizer [75] to compute the gradient, using learning rate , epsilon , momentum , and decay . To encourage exploration, we use an entropy regularizer (as in [51]) with entropy cost .
In the training stage of the reinforcement learning experiment, we used a distributed framework [76, 77] to train a population of reinforcement learning agents for each condition. The parameters of the agents were stored on learner processes, each responsible for carrying out the policy gradient update for one agent. To generate experience for the agents, parallel arenas were created. For each episode in each arena, agents were randomly sampled from the population and their parameters synchronized from their respective learners. At the end of each episode, trajectories for agents were forwarded to the respective learners. Each learner aggregated trajectories in batches of and processed these to update the parameters for the associated agent, unrolling the LSTM for steps to train the recurrent network. We augmented the advantage actor-critic algorithm with VTrace [76] to correct for off-policy trajectories. Each agent was trained using 100 million tuples.
In the evaluation stage of the reinforcement learning experiment, we partitioned each population into groups of five agents at random. We assessed the performance and behavior of each group in seven episodes of Clean Up. Groups were assigned to the identifiable or anonymous condition based on the condition they experienced during training.
We recruited 120 participants for the behavioral experiment. Participants were first individually instructed on the action controls and the environmental dynamics in Clean Up through a series of tutorial levels (for exact details, see supplementary information). Subsequently, participants were sorted into groups of and progressed through 14 episodes of Clean Up: seven episodes in each condition. We used a counterbalanced, within-participant design, with half of the groups completing the identifiable task first and the anonymous task second, and the other half completing the anonymous task first and the identifiable task second. Like the agents in the computational model, participants observe and act based on a local view of the Clean Up environment. After finishing both conditions, participants completed post-task questionnaires. At the end of the experiment, participants were paid according to their performance in the task. Each point accrued was worth pence. A detailed description of the experimental protocol (including instructions and comprehension checks) can be found in supplementary information.
More information on the Clean Up environment, including exact parameters and additional analyses verifying its social dilemma structure, can be found in supplementary information. Details of the analyses presented in the main text can similarly be found in supplementary information.
4.1 Code availability
The Clean Up task is available for research use through the DeepMind Lab2D platform [78].
5 Acknowledgements
We thank Lucy Campbell-Gillingham, Dorothy Chou, Julia Cohen, Tom Eccles, Richard Everett, Stephen Gaffney, Ian Gemp, Demis Hassabis, Koray Kavukcuoglu, Zeb Kurth-Nelson, Vicky Langston, Brian McWilliams, Matthew Phillips, Oliver Smith, Tayfun Terzi, Gregory Thornton, and Sasha Vezhnevets for feedback and support.
5.1 Author contributions
J.Z.L. conceived of the overall research direction; K.R.M. managed the project; A.G.C. and C.B. designed and coded the Clean Up task; K.R.M., E.H., T.O.Z., M.J.C., R.K., and J.Z.L. designed the human behavioral experiment; K.R.M., E.H., and T.O.Z. implemented the human behavioral research protocol; K.R.M. and T.O.Z. collected data for the human behavioral experiment; K.R.M., E.H., and J.Z.L. designed and coded the reinforcement learning agents and ran the reinforcement learning experiments; K.R.M., E.H., and T.O.Z. analyzed the data, with M.J.C., R.K., T.G., and M.B. providing substantial assistance; K.R.M., E.H., and J.Z.L. wrote the manuscript, with substantial assistance from T.O.Z., M.J.C., R.K., T.G., and M.B.
5.2 Funding
This research was funded by DeepMind.
5.3 Competing interests
The authors report no competing interests.
5.4 Correspondence and materials
Correspondence should be addressed to J.Z.L.
References
- [1] Marco A. Janssen “Introducing ecological dynamics into common-pool resource experiments” In Ecology and Society 15.2 JSTOR, 2010 DOI: 10.5751/ES-03296-150207
- [2] James M. Acheson “Anthropology of fishing” In Annual Review of Anthropology 10.1 Annual Reviews, 1981, pp. 275–316 DOI: 10.1146/annurev.an.10.100181.001423
- [3] James A. Wilson, James M. Acheson, Mark Metcalfe and Peter Kleban “Chaos, complexity and community management of fisheries” In Marine Policy 18.4 Elsevier, 1994, pp. 291–305 DOI: 10.1016/0308-597X(94)90044-2
- [4] Timothy Besley and Stephen Coate “Centralized versus decentralized provision of local public goods: A political economy approach” In Journal of Public Economics 87.12 Elsevier, 2003, pp. 2611–2637 DOI: 10.1016/S0047-2727(02)00141-X
- [5] Fikret Berkes “Local-level management and the commons problem: A comparative study of Turkish coastal fisheries” In Marine Policy 10.3 Elsevier, 1986, pp. 215–229 DOI: 10.1016/0308-597X(86)90054-0
- [6] Elinor Ostrom “Governing the Commons: The Evolution of Institutions for Collective Action”, Canto Classics Cambridge University Press, 1990
- [7] Paul B. Trawick “Successfully governing the commons: Principles of social organization in an Andean irrigation system” In Human Ecology 29.1 Springer, 2001, pp. 1–25 DOI: 10.1023/A:1007199304395
- [8] Robert Heinsohn and Craig Packer “Complex cooperative strategies in group-territorial African lions” In Science 269.5228 American Association for the Advancement of Science, 1995, pp. 1260–1262 DOI: 10.1126/science.7652573
- [9] Hans Kruuk “Scent marking by otters (Lutra lutra): Signaling the use of resources” In Behavioral Ecology 3.2 Oxford University Press, 1992, pp. 133–140 DOI: 10.1093/beheco/3.2.133
- [10] Kevin J. McGowan and Glen E. Woolfenden “A sentinel system in the Florida scrub jay” In Animal Behaviour 37 Elsevier, 1989, pp. 1000–1006 DOI: 10.1016/0003-3472(89)90144-9
- [11] O. Rasa “Coordinated vigilance in dwarf mongoose family groups: The “Watchman’s song” hypothesis and the costs of guarding” In Ethology Blackwell Publishing, 1986 DOI: 10.1111/j.1439-0310.1986.tb00598.x
- [12] Elinor Ostrom “Understanding Institutional Diversity” Princeton University Press, 2005
- [13] Gary Charness and Matthew Rabin “Understanding social preferences with simple tests” In The Quarterly Journal of Economics 117.3 Oxford University Press, 2002, pp. 817–869 DOI: 10.1162/003355302760193904
- [14] James K. Rilling and Alan G. Sanfey “The neuroscience of social decision-making” In Annual Review of Psychology 62 Annual Reviews, 2011, pp. 23–48 DOI: 10.1146/annurev.psych.121208.131647
- [15] Alan G. Sanfey “Social decision-making: Insights from game theory and neuroscience” In Science 318.5850 American Association for the Advancement of Science, 2007, pp. 598–602 DOI: 10.1126/science.1142996
- [16] Paul A.. Lange, Jeff Joireman, Craig D. Parks and Eric Van Dijk “The psychology of social dilemmas: A review” In Organizational Behavior and Human Decision Processes 120.2 Elsevier, 2013, pp. 125–141 DOI: 10.1016/j.obhdp.2012.11.003
- [17] Dan Ariely, Anat Bracha and Stephan Meier “Doing good or doing well? Image motivation and monetary incentives in behaving prosocially” In American Economic Review 99.1, 2009, pp. 544–55 DOI: 10.1257/aer.99.1.1
- [18] Charlie L. Hardy and Mark Vugt “Nice guys finish first: The competitive altruism hypothesis” In Personality and Social Psychology Bulletin 32.10 SAGE, 2006, pp. 1402–1413 DOI: 10.1177/0146167206291006
- [19] Mark Vugt and Charlotte L. Hardy “Cooperation for reputation: Wasteful contributions as costly signals in public goods” In Group Processes & Intergroup Relations 13.1 SAGE, 2010, pp. 101–111 DOI: 10.1177/1368430209342258
- [20] Claus Wedekind and Manfred Milinski “Cooperation through image scoring in humans” In Science 288.5467 American Association for the Advancement of Science, 2000, pp. 850–852 DOI: 10.1126/science.288.5467.850
- [21] Junhui Wu, Daniel Balliet and Paul A.. Lange “Reputation, gossip, and human cooperation” In Social and Personality Psychology Compass 10.6 Wiley Online Library, 2016, pp. 350–364 DOI: 10.1111/spc3.12255
- [22] Erez Yoeli, Moshe Hoffman, David G. Rand and Martin A. Nowak “Powering up with indirect reciprocity in a large-scale field experiment” In Proceedings of the National Academy of Sciences 110.Supplement 2 National Academy of Sciences, 2013, pp. 10424–10429 DOI: 10.1073/pnas.1301210110
- [23] Marco A. Janssen, Robert Holahan, Allen Lee and Elinor Ostrom “Lab experiments for the study of social-ecological systems” In Science 328.5978 American Association for the Advancement of Science, 2010, pp. 613–617 DOI: 10.1126/science.1183532
- [24] Marco A. Janssen, Allen Lee and Timothy M. Waring “Experimental platforms for behavioral experiments on social-ecological systems” In Ecology and Society 19.4 JSTOR, 2014 DOI: 10.5751/ES-06895-190420
- [25] David Silver et al. “Mastering the game of Go without human knowledge” In Nature 550.7676, 2017, pp. 354–359 DOI: 10.1038/nature24270
- [26] Max Jaderberg et al. “Human-level performance in 3D multiplayer games with population-based reinforcement learning” In Science 364.6443 American Association for the Advancement of Science, 2019, pp. 859–865 DOI: 10.1126/science.aau6249
- [27] Oriol Vinyals et al. “Grandmaster level in StarCraft II using multi-agent reinforcement learning” In Nature Nature Publishing Group, 2019, pp. 1–5 DOI: 10.1038/s41586-019-1724-z
- [28] Joel Z. Leibo et al. “Multi-agent reinforcement learning in sequential social dilemmas” In Proceedings of the 16th Conference on Autonomous Agents and Multiagent Systems, 2017, pp. 464–473 International Foundation for Autonomous AgentsMultiagent Systems
- [29] Julien Perolat et al. “A multi-agent reinforcement learning model of common-pool resource appropriation” In Advances in Neural Information Processing Systems, 2017, pp. 3643–3652
- [30] Satinder P. Singh, Andrew G. Barto and Nuttapong Chentanez “Intrinsically motivated reinforcement learning” In Advances in Neural Information Processing Systems, 2005
- [31] Daniel Balliet, Craig Parks and Jeff Joireman “Social Value Orientation and cooperation in social dilemmas: A meta-analysis” In Group Processes & Intergroup Relations 12.4 SAGE, 2009, pp. 533–547 DOI: 10.1177/1368430209105040
- [32] Robert B. Cialdini and Noah J. Goldstein “Social influence: Compliance and conformity” In Annual Review of Psychology 55 Annual Reviews, 2004, pp. 591–621 DOI: 10.1146/annurev.psych.55.090902.142015
- [33] Ernst Fehr and Klaus M. Schmidt “A theory of fairness, competition, and cooperation” In The Quarterly Journal of Economics 114.3 MIT Press, 1999, pp. 817–868 DOI: 10.1162/003355399556151
- [34] Tom Eccles et al. “Learning reciprocity in complex sequential social dilemmas” In arXiv preprint arXiv:1903.08082, 2019
- [35] Jakob Foerster et al. “Learning with opponent-learning awareness” In Proceedings of the 17th International Conference on Autonomous Agents and Multiagent Systems, 2018, pp. 122–130 International Foundation for Autonomous AgentsMultiagent Systems
- [36] Edward Hughes et al. “Inequity aversion improves cooperation in intertemporal social dilemmas” In Advances in Neural Information Processing Systems, 2018, pp. 3330–3340
- [37] Natasha Jaques et al. “Social influence as intrinsic motivation for multi-agent deep reinforcement learning” In International Conference on Machine Learning, 2019, pp. 3040–3049
- [38] Kevin R. McKee et al. “Social diversity and social preferences in mixed-motive reinforcement learning” In Proceedings of the 19th International Conference on Autonomous Agents and Multiagent Systems, 2020 International Foundation for Autonomous AgentsMultiagent Systems
- [39] Alexander Peysakhovich and Adam Lerer “Prosocial learning agents solve generalized stag hunts better than selfish ones” In Proceedings of the 17th International Conference on Autonomous Agents and Multiagent Systems, 2018, pp. 2043–2044 International Foundation for Autonomous AgentsMultiagent Systems
- [40] Matthew Botvinick et al. “Deep reinforcement learning and its neuroscientific implications” In Neuron Elsevier, 2020 DOI: 10.1016/j.neuron.2020.06.014
- [41] Paul W. Glimcher and Ernst Fehr “Neuroeconomics: Decision Making and the Brain” Academic Press, 2013
- [42] Bowen Baker “Emergent reciprocity and team formation from randomized uncertain social preferences” In Advances in Neural Information Processing Systems 33, 2020, pp. 15786–15799
- [43] David Radke, Kate Larson and Tim Brecht “The importance of credo in multiagent learning” In arXiv preprint arXiv:2204.07471, 2022
- [44] Joel Z. Leibo et al. “Scalable evaluation of multi-agent reinforcement learning with Melting Pot” In International Conference on Machine Learning, 2021, pp. 6187–6199 PMLR
- [45] Phillip J.. Christofferson, Andreas A. Haupt and Dylan Hadfield-Menell “Get it in writing: Formal contracts mitigate social dilemmas in multi-agent RL” In arXiv preprint arXiv:2208.10469, 2022
- [46] Kyle Tilbury and Jesse Hoey “Identity and dynamic teams in social dilemmas” In arXiv preprint arXiv:2208.03293, 2022
- [47] Elinor Ostrom and Roy Gardner “Coping with asymmetries in the commons: Self-governing irrigation systems can work” In Journal of Economic Perspectives 7.4, 1993, pp. 93–112 DOI: 10.1257/jep.7.4.93
- [48] Peter P. Mollinga “On the Waterfront: Water Distribution, Technology and Agrarian Change in a South Indian Canal Irrigation System” Orient Blackswan, 2003
- [49] Marco A. Janssen, John M. Anderies and Elinor Ostrom “Robustness of social-ecological systems to spatial and temporal variability” In Society and Natural Resources 20.4 Taylor & Francis, 2007, pp. 307–322 DOI: 10.1080/08941920601161320
- [50] Colin F. Camerer “Behavioral Game Theory: Experiments in Strategic Interaction” Princeton University Press, 2003
- [51] Volodymyr Mnih et al. “Asynchronous methods for deep reinforcement learning” In International Conference on Machine Learning, 2016, pp. 1928–1937
- [52] Richard S. Sutton and Andrew G. Barto “Reinforcement Learning: An Introduction” MIT Press, 1998
- [53] David C. Parkes and Michael P. Wellman “Economic reasoning and artificial intelligence” In Science 349.6245 American Association for the Advancement of Science, 2015, pp. 267–272 DOI: 10.1126/science.aaa8403
- [54] Kent C. Berridge, Terry E. Robinson and J. Aldridge “Dissecting components of reward: ‘Liking’, ‘wanting’, and learning” In Current Opinion in Pharmacology 9.1 Elsevier, 2009, pp. 65–73 DOI: 10.1016/j.coph.2008.12.014
- [55] Keise Izuma, Daisuke N. Saito and Norihiro Sadato “Processing of social and monetary rewards in the human striatum” In Neuron 58.2 Elsevier, 2008, pp. 284–294 DOI: 10.1016/j.neuron.2008.03.020
- [56] Marco A. Janssen and Nathan D. Rollins “Evolution of cooperation in asymmetric commons dilemmas” In Journal of Economic Behavior & Organization 81.1 Elsevier, 2012, pp. 220–229 DOI: 10.1016/j.jebo.2011.10.010
- [57] Pat Barclay and Robb Willer “Partner choice creates competitive altruism in humans” In Proceedings of the Royal Society B: Biological Sciences 274.1610 The Royal Society London, 2006, pp. 749–753 DOI: 10.1098/rspb.2006.0209
- [58] Bettina Rockenbach and Manfred Milinski “The efficient interaction of indirect reciprocity and costly punishment” In Nature 444.7120 Nature Publishing Group, 2006, pp. 718 DOI: 10.1038/nature05229
- [59] Marco A. Janssen and Elinor Ostrom “TURFS in the lab: Institutional innovation in real-time dynamic spatial commons” In Rationality and Society 20.4 SAGE, 2008, pp. 371–397 DOI: 10.1177/1043463108096786
- [60] Elinor Ostrom et al. “Rules, Games, and Common-Pool Resources” University of Michigan Press, 1994
- [61] Joseph Henrich “The Secret of Our Success: How Culture is Driving Human Evolution, Domesticating Our Species, and Making Us Smarter” Princeton University Press, 2017
- [62] Natalie Henrich and Joseph P. Henrich “Why Humans Cooperate: A Cultural and Evolutionary Explanation” Oxford University Press, 2007
- [63] Esther Herrmann et al. “Humans have evolved specialized skills of social cognition: The cultural intelligence hypothesis” In Science 317.5843 American Association for the Advancement of Science, 2007, pp. 1360–1366 DOI: 10.1126/science.1146282
- [64] Bowen Baker et al. “Emergent tool use from multi-agent autocurricula” In arXiv preprint arXiv:1909.07528, 2019
- [65] Martin A. Nowak and Karl Sigmund “Evolution of indirect reciprocity by image scoring” In Nature 393.6685 Nature Publishing Group, 1998, pp. 573–577 DOI: 10.1038/31225
- [66] Manfred Milinski, Dirk Semmann and Hans-Jürgen Krambeck “Reputation helps solve the ‘tragedy of the commons”’ In Nature 415.6870 Nature Publishing Group, 2002, pp. 424 DOI: 10.1038/415424a
- [67] Allan Dafoe et al. “Open problems in Cooperative AI” In arXiv preprint arXiv:2012.08630, 2020
- [68] Byron Miller “Collective action and rational choice: Place, community, and the limits to individual self-interest” In Economic Geography 68.1 Taylor & Francis, 1992, pp. 22–42 DOI: 10.2307/144039
- [69] Douglass C. North “Institutions” In Journal of Economic Perspectives 5.1, 1991, pp. 97–112 DOI: 10.1257/jep.5.1.97
- [70] Ernst Fehr and Simon Gächter “Altruistic punishment in humans” In Nature 415.6868 Nature Publishing Group, 2002, pp. 137–140 DOI: 10.1038/415137a
- [71] Joseph P. Henrich et al. “Costly punishment across human societies” In Science 312.5781 American Association for the Advancement of Science, 2006, pp. 1767–1770 DOI: 10.1126/science.1127333
- [72] Sepp Hochreiter and Jürgen Schmidhuber “Long short-term memory” In Neural Computation 9.8 MIT Press, 1997, pp. 1735–1780 DOI: 10.1162/neco.1997.9.8.1735
- [73] Richard S. Sutton, David A. McAllester, Satinder P. Singh and Yishay Mansour “Policy gradient methods for reinforcement learning with function approximation” In Advances in Neural Information Processing Systems, 2000, pp. 1057–1063
- [74] Ronald J. Williams “Simple statistical gradient-following algorithms for connectionist reinforcement learning” In Machine Learning 8.3-4 Springer, 1992, pp. 229–256 DOI: 10.1007/BF00992696
- [75] Tijmen Tieleman and Geoffrey Hinton “Lecture 6.5-RMSProp: Divide the gradient by a running average of its recent magnitude” In Coursera: Neural networks for machine learning 4.2, 2012, pp. 26–31
- [76] Lasse Espeholt et al. “IMPALA: Scalable distributed deep-RL with importance weighted actor-learner architectures” In International Conference on Machine Learning, 2018, pp. 1407–1416
- [77] Kevin R. McKee, Joel Z. Leibo, Charlie Beattie and Richard Everett “Quantifying environment and population diversity in multi-agent reinforcement learning” In arXiv preprint arXiv:2102.08370, 2021
- [78] Charles Beattie, Thomas Köppe, Edgar A Duéñez-Guzmán and Joel Z Leibo “DeepMind Lab2D” In arXiv preprint arXiv:2011.07027, 2020
- [79] Lee J. Cronbach “The two disciplines of scientific psychology” In American Psychologist 12.11 American Psychological Association, 1957, pp. 671 DOI: 10.1037/h0043943
- [80] Michael A. Cohen, Daniel C. Dennett and Nancy Kanwisher “What is the bandwidth of perceptual experience?” In Trends in Cognitive Sciences 20.5 Elsevier, 2016, pp. 324–335 DOI: 10.1016/j.tics.2016.03.006
- [81] K. Phan, Chandra Sekhar Sripada, Mike Angstadt and Kevin McCabe “Reputation for reciprocity engages the brain reward center” In Proceedings of the National Academy of Sciences 107.29 National Academy of Sciences, 2010, pp. 13099–13104 DOI: 10.1073/pnas.1008137107
- [82] Muzafer Sherif “The Psychology of Social Norms” Harper, 1936
- [83] Rebecca Saxe and Johannes Haushofer “For love or money: A common neural currency for social and monetary reward” In Neuron 58.2 Elsevier, 2008, pp. 164–165 DOI: 10.1016/j.neuron.2008.04.005
- [84] Michael L. Littman “Markov games as a framework for multi-agent reinforcement learning” In Machine Learning Proceedings 1994 Elsevier, 1994, pp. 157–163 DOI: 10.1016/B978-1-55860-335-6.50027-1
- [85] Peter Kollock “Social dilemmas: The anatomy of cooperation” In Annual Review of Sociology 24.1 Annual Reviews, 1998, pp. 183–214 DOI: 10.1146/annurev.soc.24.1.183
- [86] Anatol Rapoport “Prisoner’s Dilemma—Recollections and observations” In Game Theory as a Theory of a Conflict Resolution Springer, 1974, pp. 17–34
- [87] Ernst Fehr and Simon Gächter “Cooperation and punishment in public goods experiments” In American Economic Review 90.4, 2000, pp. 980–994 DOI: 10.1257/aer.90.4.980
- [88] Edward H. Simpson “The interpretation of interaction in contingency tables” In Journal of the Royal Statistical Society: Series B (Methodological) 13.2 Wiley Online Library, 1951, pp. 238–241 DOI: 10.1111/j.2517-6161.1951.tb00088.x
- [89] Rogier Kievit, Willem Eduard Frankenhuis, Lourens Waldorp and Denny Borsboom “Simpson’s paradox in psychological science: A practical guide” In Frontiers in Psychology 4 Frontiers, 2013, pp. 513 DOI: 10.3389/fpsyg.2013.00513
- [90] Karl Pearson, Alice Lee and Leslie Bramley-Moore “VI. Mathematical contributions to the theory of evolution.—VI. Genetic (reproductive) selection: Inheritance of fertility in man, and of fecundity in thoroughbred racehorses” In Philosophical Transactions of the Royal Society of London. Series A, Containing Papers of a Mathematical or Physical Character The Royal Society London, 1899, pp. 257–330 DOI: 10.1098/rsta.1899.0006
- [91] Urs Fischbacher, Simon Gächter and Ernst Fehr “Are people conditionally cooperative? Evidence from a public goods experiment” In Economics Letters 71.3 Elsevier, 2001, pp. 397–404 DOI: 10.1016/S0165-1765(01)00394-9
- [92] Jennifer Zelmer “Linear public goods experiments: A meta-analysis” In Experimental Economics 6.3 Springer, 2003, pp. 299–310 DOI: 10.1023/A:1026277420119
- [93] Thomas C. Schelling “Hockey helmets, concealed weapons, and daylight saving: A study of binary choices with externalities” In Journal of Conflict Resolution 17.3 SAGE, 1973, pp. 381–428 DOI: 10.1177/002200277301700302
- [94] Simon Gächter, Elke Renner and Martin Sefton “The long-run benefits of punishment” In Science 322.5907 American Association for the Advancement of Science, 2008, pp. 1510–1510 DOI: 10.1126/science.1164744
- [95] George F. Jenks “The data model concept in statistical mapping” In International Yearbook of Cartography 7, 1967, pp. 186–190
- [96] Ronald Aylmer Fisher “Statistical Methods for Research Workers” OliverBoyd, 1925
- [97] Patricia Koleff, Kevin J. Gaston and Jack J. Lennon “Measuring beta diversity for presence–absence data” In Journal of Animal Ecology 72.3 Wiley Online Library, 2003, pp. 367–382 DOI: 10.1046/j.1365-2656.2003.00710.x
- [98] Robert Harding Whittaker “Vegetation of the Siskiyou mountains, Oregon and California” In Ecological Monographs 30.3 Wiley Online Library, 1960, pp. 279–338 DOI: 10.2307/1943563
- [99] Derek D. Rucker, Kristopher J. Preacher, Zakary L. Tormala and Richard E. Petty “Mediation analysis in social psychology: Current practices and new recommendations” In Social and Personality Psychology Compass 5.6 Wiley Online Library, 2011, pp. 359–371 DOI: 10.1111/j.1751-9004.2011.00355.x
Supplementary Info
1 Design of Computational Model
We built our computational model using advantage actor-critic [51], a deep reinforcement learning algorithm. Within the algorithm, we formalize the overall reward signal as a combination of the intrinsic, social reward and extrinsic, environmental reward :
| (S1) | |||
| (S2) |
where is one’s own contribution level (i.e., the amount of pollution cleaned from the river), is an estimated or observed average of the group’s contribution levels, and and are scalar parameters.
The intrinsic motivation function for the reputation agent was parameterized with and (see Figure S1). It therefore primarily represents an aversion to falling behind the group mean [18], as well as secondarily reflecting an aversion to being cheated by others [58].
A paired t-test indicates that agents received significantly less intrinsic reward than extrinsic reward across all episodes of the anonymous condition, , and all episodes of the identifiable condition, , (Figure S2).
We vary the intrinsic motivation parameters to better capture individual variability (cf., individual differences research; [79]) and because population heterogeneity has important effects in multi-agent reinforcement learning [38, 77].
Let be the instantaneous index of agent contribution:
| (S3) |
and let be the number of timesteps in an episode ( for the reinforcement learning experiment). For agents , and the sequence of instantaneous agent contributions , we update the temporally smoothed inputs ( and ) in Equation S2 as follows:
| (S4) |
where we choose smoothing factor and set .
To simulate the identifiable condition for the reinforcement learning agents, the environment provides contribution information for each group member as an input to the agent. To simulate the anonymous condition, the environment provides contribution information with a reduced visibility range. Contribution information about other agents is circumscribed by a visibility range , calculated using the norm. Behavior of agents falling outside of this range is not included in updates. This follows the limited visual attention that participants marshal to track behavior in the anonymous condition (see also [80]). The provision of this altered contribution information reflects the ability of humans to imperfectly track behavior of individual group members on short timescales, even in the anonymous condition.
Overall, our computational model incorporates five assumptions:
- 1.
-
2.
Reputation is encoded as an intrinsic reward [81].
- 3.
- 4.
- 5.
2 Experimental Design
Clean Up is a partially observable Markov game [84]. A small set of parameters control the Clean Up environment. Environmental dynamics are defined by two functions:
| (S5) |
| (S6) |
Equations S5 and S6 describe the probabilistic production functions for apple regrowth and pollution accumulation, respectively. In Equation S5, represents the probability of apple regrowth at time , reflects the underlying probability of apple regrowth when the river is sufficiently clean, and represents the fraction of the river that is filled with pollution at time . reflects the proportion of the river filled with pollution above which apples can no longer regrow, and reflects the proportion of the river filled with pollution below which apples regrow with maximum probability. Equation S6 describes the Bernoulli process that generates additional pollution in the river. reflects the probability that a new unit of pollution accrues in the river at time , while represents the underlying probability that pollution accumulates if the river is not saturated with pollution.
We ran Clean Up with the parameter values listed in Sections 2.1 and 2.2. For the reinforcement learning experiment, we drew from canonical research using this task [36, 38] and largely carried over the established parameters. Because of general differences between human and agent reaction times (cf. [27]), this approach had to be adapted to develop a human behavioral research protocol instantiating a parallel social dilemma (see Section 3: Social Dilemma Analysis).
2.1 Computational Model
See [36, 38] for exact setup. The experiment was parameterized with episode length steps, cost of giving a ticket and penalty for receiving a ticket , and the following environmental parameters:
-
•
.
-
•
.
-
•
.
-
•
.
Following previous studies [36, 38], each episode of reinforcement learning agent training began with river pollution at saturation and an empty orchard (Figure S3). During agent evaluation, each episode began with zero river pollution and a full orchard, matching the task conditions as experienced by human participants.
2.2 Human Behavioral Experiment
Consistent with the design of video games with similar step rates, we implemented an input buffer to accept actions at most once every 100 ms. In order to instantiate an analogous social dilemma for participants, we selected the following set of environmental parameters for the human behavioral experiment:
-
•
.
-
•
.
-
•
.
-
•
.

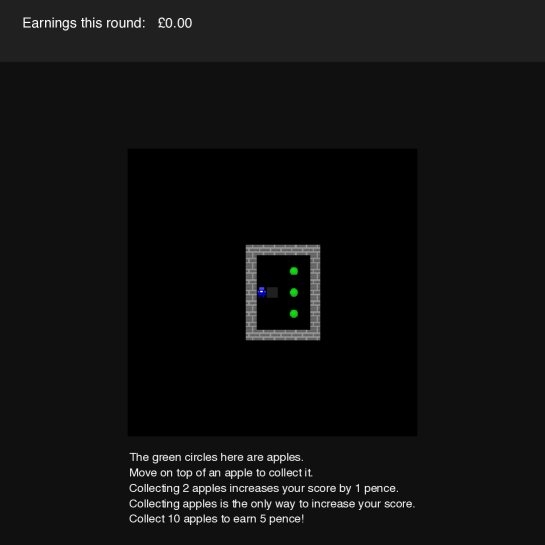


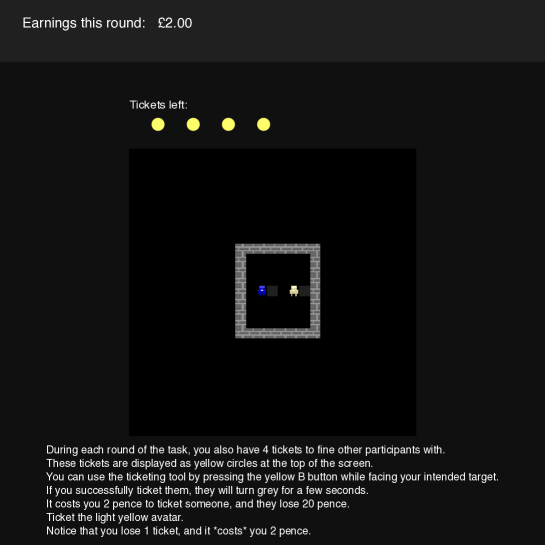
During the first stage of the experiment, participants receive a series of six tutorials on the action controls and the environmental dynamics for the Clean Up task (Figures S4-S6). The tutorials aimed to familiarize participants with (1) avatar movement, (2) apple collection, (3) pollution accumulation and the cleaning tool, (4) the effects of pollution on apple growth, (5) the ticketing tool and the cost of giving a ticket, and (6) the cost of receiving a ticket. Participants were subsequently instructed on the group nature of the task, including an explanation of the symmetry of information available about their own behavior to themselves and to their peers. Participants were also informed of the performance incentivization (i.e., the rules for receiving a bonus) at this stage. The tutorials described the river pollution as “dirt” to avoid explicitly priming participants with environmental concerns or pro-sustainability motives.
During episodes, participants observed the environment through a 27 by 27 window, centered around their avatar (Figure S7). The size of this observation window allows for a participant to view the entire map by standing in the middle of the map. However, practically speaking, participants spent the majority of the time playing with imperfect observability. In 94.3% of steps, participants were positioned such that part of the map was obscured from their observation.

Episodes ran for steps (approximately 2 minutes). Participants were not told the exact length of the episodes. At the end of every episode, each participant’s score for that episode was added to his or her cumulative score for the entire experiment. After the experiment, participants were paid a base payment of £15 and a bonus for their cumulative score at the rate of 0.5 pence per point, up to a maximum bonus of £30.
The University College London Research Ethics Committee conducted ethical review for the project and approved the study protocol (CPB/2013/015). All participants provided informed consent for the study.
The experiment was completed by 120 participants (age: mean , standard deviation ; gender: 50 male, 70 female), drawn from the University College London psychology department participant pool.333During one experimental session (i.e., ten participants in the lab for the experiment), one participant’s computer malfunctioned for several episodes. Participants in the dropped session were paid and debriefed as normal. To maintain a balanced design, the entire session was dropped from data analysis and an additional session was scheduled to fulfill the original design. Counting this dropped session, 130 participants were recruited across 13 sessions. Participants earned an average of £30.85 ( £6.44) during the experiment.
3 Social Dilemma Analysis
Social dilemmas are situations in which there is a tradeoff between short-term individual incentives and long-term collective interest [36, 85, 86]. In this paper, we study public goods dilemmas, a particular subset of social dilemmas.
In the canonical public goods task [87], participants receive an initial endowment of tokens and choose a contribution level . Subsequently, contributions are pooled and increased by multiplication factor , forming the public good, :
| (S7) |
The public good is then distributed evenly across all participants. The collective group payoff (i.e., environmental reward) is consequently described by:
| (S8) |
where the payoff to participant is described by:
| (S9) |
In the canonical setting, there is a deterministic relationship between the group’s contributions, the size of the public good, and the group payoff. Similarly, the equal distribution of the public good deterministically defines the payoffs for individual participants. As a result, in the traditional public goods task, we can purposefully instantiate a social dilemma—a situation in which there is a tradeoff between individual incentives and the collective interest—by requiring .
In the traditional parameterization of the public goods task, , , and [87]. With these parameters, the payoff functions S8 and S9 respectively reflect a negative relationship between own contributions and own payoff, ceteris paribus, and a positive relationship between group contributions and group payoff (Figure S8). This sign reversal is the defining characteristic of individual- and group-level incentive structures for social dilemmas.444The sign reversal between the individual and group level is conceptually related to Simpson’s paradox, a well-studied statistical phenomenon whereby the direction of an association at the population-level reverses within the subgroups comprising that population (as described in [88]; see also [89, 90]).
In stochastic, temporally and spatially extended tasks (cf., [84]), it is not straightforward to instantiate social-dilemma incentive structures with environmental rules [28]. In our work, given the variation in environmental parameters between the human behavioral experiment and the model, it was especially important to confirm that both environment versions constituted a social dilemma.
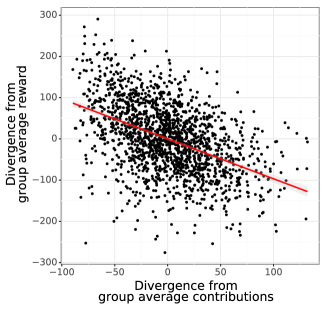
Using linear regression, we characterize the extent to which empirical data match the sign-reversal pattern observed in the canonical case—what we might call a linear social dilemma structure (cf., [92]). We conduct this analysis with two separate regressions. The first examines the individual-level incentive structure experienced by group members. The second examines the effects of collective behavior on group welfare. To match a linear social dilemma structure, we expect to see a negative relationship between cooperation and payoff at the individual level, but a positive relationship between cooperation and welfare at the group level.
| (S10) | |||
| (S11) |
In addition to this linear-dilemma analysis, we follow recent explorations in the multi-agent field by producing Schelling diagrams [29, 36]. Schelling diagrams are an empirical approach to Markov games which characterize payoffs based on group policy composition. Visualizing payoff structures in this way has various benefits, including the opportunity to inspect whether the task reflects a social dilemma and the ability to identify game-theoretic concepts such as Nash equilibria and Pareto-optimal outcomes [93]. Schelling diagrams rely upon the ability to dichotomize the policy space (e.g., into cooperation and defection policies), as well as the ability to categorize individuals based on their observed behavioral trajectories.
Given the well-established use of punishment to decrease the payoffs of free riders [71, 94], for these analyses we use apple consumption to model payoff and welfare.
3.1 Human Behavioral Experiment
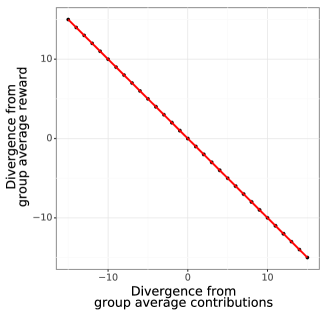
At the individual level, the amount that a participant’s contributions exceeded or fell below their group’s average contribution level had a significant negative relationship with the amount their payoff exceeded or fell below the group average payoff, , 95% CI , (Figure S9a). Participants who contributed more relative to their peers collected fewer apples than their peers.
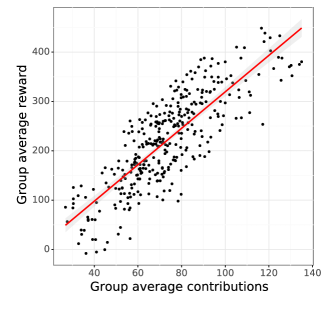
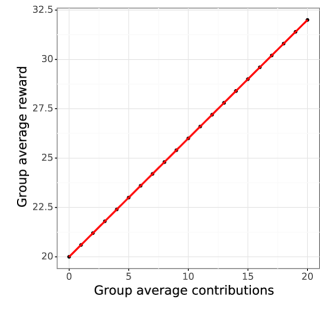
At the group level, average contribution level was significantly and positively associated with average apple consumption, , 95% CI , (Figure S9b). In contrast with the negative individual-level association, groups that collectively contribute more also collectively consume more apples.
Taken together, these two effects support the existence of a linear social dilemma incentive structure within Clean Up.
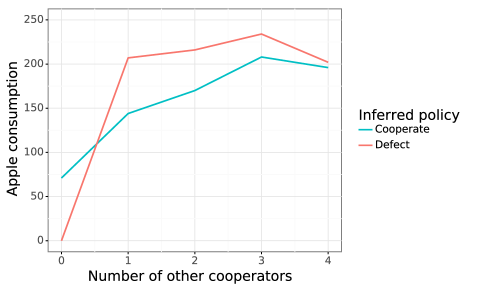
We sought to verify this finding by generating an empirical Schelling diagram for the human behavioral experiment. In effect, we map empirical data onto a policy space by categorizing observed behavioral trajectories into “cooperate” trajectories and “defect” trajectories. We chose to dichotomize participant contribution levels using the Jenks optimization method. This method identifies cutoff points which minimize within-category variance and maximize between-category variance, given a number of categories to establish [95]. The Jenks method identifies 76 contribution steps as the natural breakpoint dichotomizing the distribution of participant contribution levels (Figure S10).
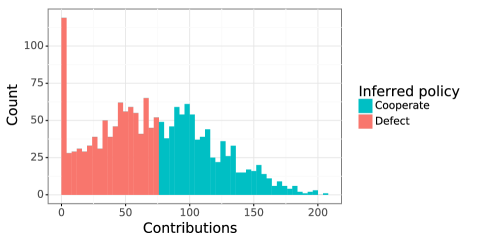
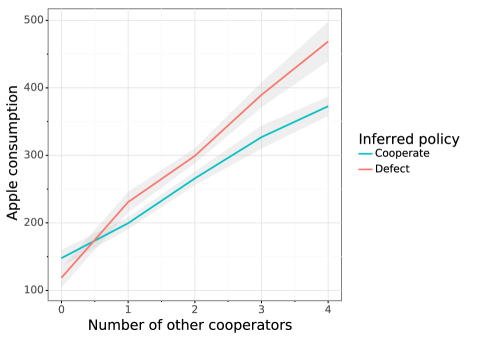
We classified participants as cooperating in a given episode if they contributed more than this threshold and as defecting if they contributed less. Subsequently, we tabulated the number of cooperators and defectors in each episode for every group. As before, we examine apple consumption as the relevant payoff for participants. Average apple consumption is calculated separately among cooperators and defectors for each episode. To construct the Schelling diagram, average apple consumption for cooperators and defectors is plotted against the count of cooperators in each episode (Figure S11).
Hughes and colleagues [36] delineate the following conditions to define a binary-choice social dilemma:
-
1.
Mutual cooperation is preferred over mutual defection: .
-
2.
Mutual cooperation is preferred to being exploited by defectors: .
-
3.
Either…
-
(a)
Mutual defection is preferred to being exploited (fear): for sufficiently small ,
-
(b)
Or exploiting a cooperator is preferred to mutual cooperation (greed). for sufficiently large .
-
(a)
This definition can be translated to a frequentist framework by instantiating each of these conditions with a one-sided independent t-test. These t-tests produce the following results with the experimental Clean Up data:
-
•
Condition 1 is met. The payoff to cooperators under mutual cooperation (, ) is significantly higher than the payoff to defectors under mutual defection (, ), , .
-
•
Condition 2 is met. The payoff to cooperators under mutual cooperation (, ) is significantly higher than the payoff to cooperators when all other group members defect (, ), , .
-
•
Condition 3a is not met. The payoff to defectors under mutual defection (, ) is not significantly higher than the payoff to cooperators when all other group members defect (, ), , .
-
•
Condition 3b is met. The payoff to defectors when all other group members cooperate (, ) is higher than the payoff to cooperators under mutual cooperation (, ), , .
We synthesize the results of these t-tests (, , , , respectively) into a single statistical test through two steps. First, we use Fisher’s method [96] to consolidate and while controlling for multiple comparisons. This results in the joint p-value . Second, we use a maximum -value approach to combine , , and : .
In the first step, Fisher’s method indicates a significant overall result for condition 3, , . In the second step, combining conditions 1, 2, and 3 results in . According to this combined significance test, the Clean Up task meets Hughes and colleagues’ definition of a social dilemma [36].
3.2 Computational Model
Previous work by Hughes and colleagues [36] verified that the incentive structure of Clean Up produces social dilemma pressures for reinforcement learning agents (Figure S12). In that work, agents were trained with a specialized protocol. During training, the ability to contribute to the public good was withheld from some agents; a small group reward signal was added to the remaining agents. The former and latter types of agent were classified as defectors and cooperators, respectively. As a result, groups varied in their composition of cooperating and defecting policies. Echoing our findings with the human behavioral analysis, Hughes and colleagues found that the resulting empirical Schelling diagram matched condition 1 (), condition 2 () and condition 3b ().
Presaging our findings for the human participants, Hughes and colleagues concluded from this pattern that the Clean Up task instantiates a social dilemma for reinforcement learning agents.
4 Comprehension Check
4.1 Human Behavioral Experiment
Two open-ended questions at the end of the post-experiment questionnaire asked participants whether they attended to the bar display during the episodes when there was one bar and during the episodes when there were five bars. Responses were coded dichotomously as no, did not attend or yes, attended (Table S1).
| Attended to the | |||
| 1-bar display? | |||
| Yes | No | ||
| Attended to the | Yes | 39 | 74 |
| 5-bar display? | No | 0 | 7 |
An exact McNemar’s test indicates a statistically significant difference in the proportion of participants who reported attending to the 1-bar display and the proportion who reported attending to the 5-bar display, , . A significantly greater proportion of participants reported attending to the 5-bar display (94.2%) than reported attending to the 1-bar display (32.5%).
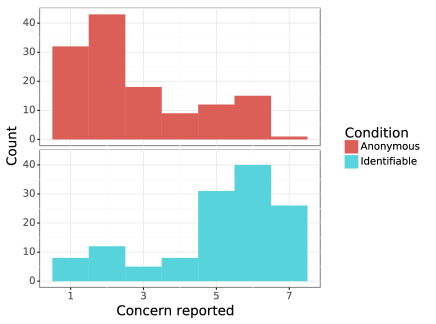
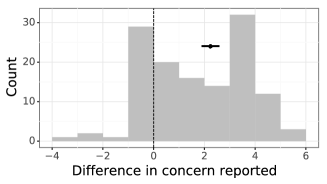
Using two 7-point scales, the questionnaire additionally assessed the degree to which participants were concerned about others tracking their behavior during each condition. Participant concern scores were centered on () in the identifiable condition and on () in the anonymous condition (Figure S13). Participants reported being significantly more concerned about others tracking their contribution behavior in the identifiable condition than in the anonymous condition, ( CI ), , (Figure S13).
5 Main Group Effects
5.1 Computational Model
The reinforcement learning agents in the computational model did not update their policy during the evaluation stage of the experiment. As a result, the order in which groups experienced the conditions did not influence their behavior. We consequently evaluate the effect of condition on each social outcome metric with a one-way, repeated-measure analysis of variance (ANOVA):
| (S12) |
We first conduct a one-way ANOVA for collective return. There was a significant effect of condition on collective return, , . In the model, groups earned significantly more in the identifiable condition (604 points on average) than in the anonymous condition (339 points on average).
We next conduct a one-way ANOVA for group contribution level. There was a significant effect of condition on group contribution level, , . In the model, groups cleaned significantly more in the identifiable condition (for 422 steps on average) in the identifiable condition than in the anonymous condition (299 steps on average).
5.2 Human Behavioral Experiment
The human behavioral experiment took a counterbalanced, within-participant design: each participant was exposed to all experimental conditions, and the ordering of conditions was balanced across participants. Half of the participant groups completed the identifiable condition first and the anonymous condition second, and the other half completed the anonymous condition first and the identifiable condition second.
We would like to evaluate the effect of condition (identifiability versus anonymity) on several outcome metrics. In the human behavioral experiment, the counterbalanced design indicates the use of two-way ANOVA. To facilitate comparison with the model results, in the main text we report the main effects from the two-way ANOVA. Here we present the full models, including the main effect of task and the interaction effect. For this experiment, a two-way, repeated-measures ANOVA was used to assess the effect of task condition (identifiability or anonymity) and task number (first task or second task) on each social outcome metric :
| (S13) |
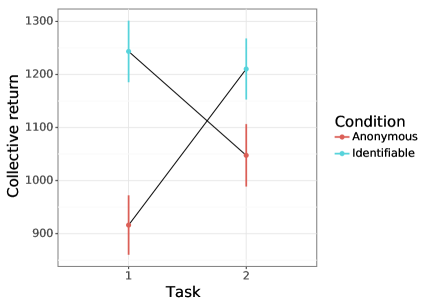
We first conduct a two-way ANOVA for collective return (Figure S14). There was a significant main effect of condition on collective return, , . The main effect of task number was non-significant, , . The interaction effect was also non-significant, . Groups earned significantly more in the identifiable condition (1227 points on average) than in the anonymous condition (982 points on average).
We next conduct a two-way ANOVA for total contribution level (Figure S15). There was a significant main effect of condition on total contribution level, , . The main effect of task number was non-significant, , . The interaction effect was also non-significant, , . Groups cleaned significantly more in the identifiable condition (for 396 steps on average) in the identifiable condition than in the anonymous condition (337 steps on average).
6 Spatial Coordination Analysis
To explore the use of spatial coordination strategies in Clean Up, we estimate the extent of territoriality groups used to coordinate their investments in the public good. Our measure of territoriality relies on beta diversity, a measure of compositional heterogeneity across locations originally developed by ecologists [97, 98]. Conceptually, we calculate a metric that communicates the degree to which group members’ “territories” overlapped with each other. We start by converting group member trajectories to presence-absence data for each location in the map. Each location that is visited at least once is recorded in a vector , of length , where denotes the number of distinct locations that were visited. Each group member that visits location is also recorded, resulting in a corresponding vector of length , where denotes the number of distinct group members who visited location . We use the presence-absence data for group members’ movements within the river region to calculate alpha, gamma, and beta diversities. Alpha diversity is defined as the number of group members who were present at the average location:
| (S14) |
Gamma diversity is defined as the number of unique group members who were present over all locations:
| (S15) |
Beta diversity, the effective number of different group compositions, is defined as the ratio of gamma to alpha diversity:
| (S16) |
Beta diversity is lower bounded by (representing a single group composition for all visited locations) and upper bounded by whichever of and is lower (representing completely non-overlapping locations visited by group members or completely different compositions per location, respectively). To account for the variability of the upper bound across episodes, we calculate a normalized beta diversity:
| (S17) |
We use the normalized beta diversity as a measure of territoriality. A territoriality of 0 indicates that group members’ territories were identical. A territoriality of 1, in contrast, indicates that group members’ territories were entirely disjoint.
6.1 Computational Model
We conduct a one-way ANOVA to assess the effect of the intrinsic motivation for reputation on group territoriality. There was a significant effect of condition on territoriality, , . In the model, groups exhibited significantly less territoriality in the identifiable condition (with an average territoriality score of 0.42) than in the anonymous condition (with an average score of 0.58).
6.2 Human Behavioral Experiment
We conduct a two-way ANOVA to assess the effect of the intrinsic motivation for reputation on group territoriality (Figure S16). As before, we highlight the main effect of condition in the main text to facilitate comparison with the model results, and here expand on the other terms of the two-way ANOVA. There was a significant main effect of condition on territoriality, , . The main effect of task number was also significant, , . The interaction effect was non-significant, , . Groups were significantly less territorial in the identifiable condition (with an average territoriality score of 0.36) than in the anonymous condition (with an average score of 0.42).
7 Temporal Coordination Analysis
For this analysis, our aim is to understand whether groups organized their behavior using temporal coordination strategies. Toward this end, we develop two measures of temporal coordination: a measure of group turn taking and a measure of temporal consistency for group contributions.
| Turns since group | Recency value |
|---|---|
| member ’s last turn | for this turn |
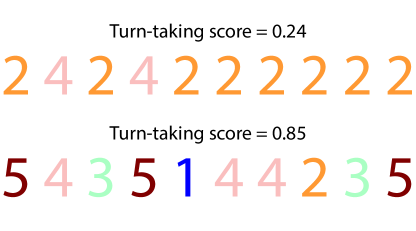
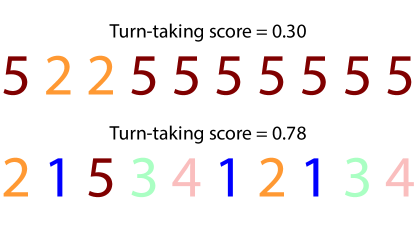
Turn taking is calculated based on the ordering of group member “turns” entering the river to clean pollution. For each episode, we record the sequence of group members entering the river. For each of the identities in this sequence of turns, we calculated a recency value reflecting the number of turns that had occurred since the group member’s last turn in the river (Table S2). Turn-taking scores are generated by averaging the recency values for each turn in , taking the additive inverse of the average, and then adding a constant of 1 to the subsequent metric. A turn-taking score of 0 represents an episode where a single group member took all turns in the river. A turn-taking score of 1 reflects an episode where all group members rotated into the river, such that four turns pass between each of group member ’s turns in the river.
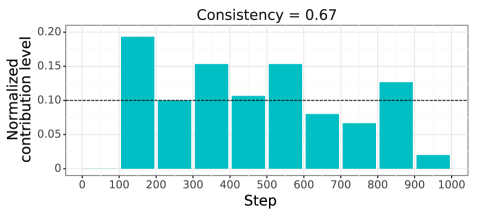
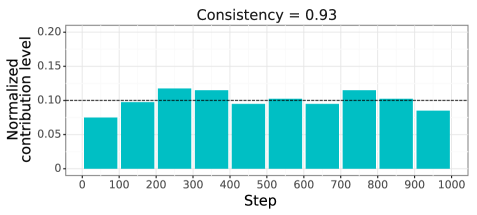
Consistency is calculated by binning the full sequence of contributions from an episode into a number of granular periods. Here we estimate consistency using periods for each episode (see Figure S17).
Contributions within these periods are summed, forming a vector of binned contributions. A consistency score is then calculated for this binned contribution vector, measuring equality over the temporal dimension:
| (S18) |
| (S19) |
Groups that concentrate all of their contribution efforts in a short span of time exhibit low temporal consistency, whereas groups that evenly apportion their contribution efforts over time manifest high temporal consistency (Figure S17). Maintaining a high level of contribution consistency requires a group to coordinate which members will clean the river at any given time.
7.1 Computational Model
We conduct a one-way ANOVA to assess the effect of the intrinsic motivation for reputation on group turn taking. There was a significant effect of condition on turn taking, , . In the model, groups exhibited significantly more turn taking in the identifiable condition (with an average turn-taking score of 0.75) than in the anonymous condition (with an average score of 0.56).
In the main text, we evaluate the relationship between turn taking and group performance with a linear regression, averaging observations by group:
| (S20) |
With this regression, the model predicted a significant relationship between turn taking and collective return, , 95% CI , . Turn taking was positively associated with collective return, such that groups that relied more heavily on a rotation scheme tended to achieve higher scores.
We conduct a mediation analysis [99] to estimate the indirect effect of identifiability on collective return through group turn-taking (Figure S18). The analysis reveals a significant and positive indirect effect of identifiability on collective return through group turn-taking, , 95% CI , . Furthermore, the positive association between identifiability and collective return (, 95% CI , ) is reduced after accounting for turn taking (, 95% CI , ).

To further test our findings, we replicate these analyses with the temporal consistency measure. We conduct a repeated-measures ANOVA to assess the effect of the intrinsic motivation for reputation on group contribution consistency over time. Condition exerted a significant effect on temporal consistency, , (Figure S19). In the model, groups acted with greater consistency in the identifiable condition (with an average consistency score of 0.87) than in the anonymous condition (with an average score of 0.84).
We next evaluate the relationship between temporal consistency and group performance with a linear regression, averaging observations by group:
| (S21) |
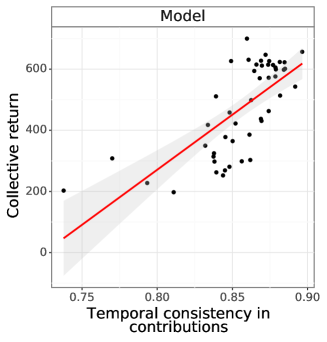
With this regression, the model predicted a significant relationship between contribution consistency and collective return, , 95% CI , (Figure S20). Contribution consistency positively related to collective return, such that groups that provided the public good with greater consistency over time tended to achieve higher scores.
7.2 Human Behavioral Experiment
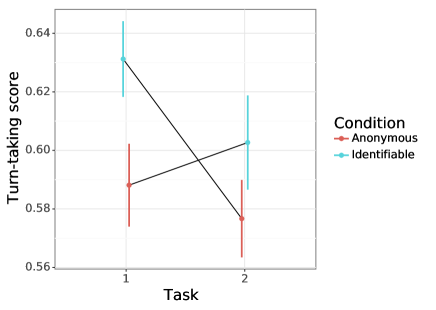
We conduct a two-way ANOVA to assess the effect of the intrinsic motivation for reputation on group turn taking (Figure S21). As before, we highlight the main effect of condition in the main text to facilitate comparison with the model results, and here expand on the other terms of the two-way ANOVA. There was a significant main effect of condition on turn taking, , . The main effect of task number was also significant, , . The interaction effect was non-significant, , . Groups were significantly more reliant on a turn-taking rotation scheme in the identifiable condition (with an average turn-taking score of 0.62) than in the anonymous condition (with an average score of 0.58).
In the main text, we analyze the association between turn taking and collective return with a linear regression, averaging observations by group:
| (S22) |
Among the human groups, there was a positive relationship between turn taking and collective return, , 95% CI , . The use of a turn-taking rotation scheme was positively associated with group performance.

We conduct a mediation analysis to estimate the indirect effect of identifiability on collective return through group turn-taking (Figure S22). The analysis indicates a significant and positive indirect effect of identifiability on collective return through group turn-taking, , 95% CI , . In addition, the positive association between identifiability and collective return (, 95% CI , ) is reduced after accounting for turn taking (, 95% CI , ).
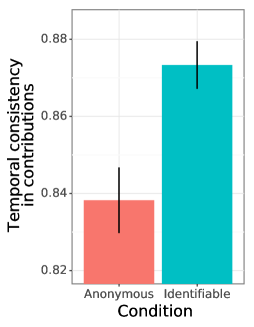
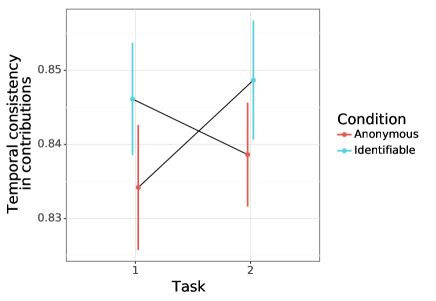
To further test our findings, we replicate these analyses with the temporal consistency measure. We conduct a two-way, repeated-measures ANOVA to assess the effect of the intrinsic motivation for reputation on group contribution consistency over time (Figure S23). There was a significant main effect of condition on temporal consistency, , . The main effect of task number was not significant, , . The interaction effect was non-significant, , . Groups acted with greater consistency in the identifiable condition (with an average consistency score of 0.85) than in the anonymous condition (with an average score of 0.84).
We next evaluate the relationship between temporal consistency and group performance with a linear regression, averaging observations by group:
| (S23) |
Contribution consistency was significantly and positively related to collective return, , 95% CI , (Figure S24). Contribution consistency positively correlated with group performance, such that groups that provided the public good with greater consistency over time tended to achieve higher scores.