Strong Reduction of Quasiparticle Fluctuations in a Superconductor due to Decoupling of the Quasiparticle Number and Lifetime
Abstract
We measure temperature dependent quasiparticle fluctuations in a small Al volume, embedded in a NbTiN superconducting microwave resonator. The resonator design allows for read-out close to equilibrium. By placing the Al film on a membrane, we enhance the fluctuation level and separate quasiparticle from phonon effects. When lowering the temperature, the recombination time saturates and the fluctuation level reduces a factor 100. From this we deduce that the number of free quasiparticles is still thermal. Therefore, the theoretical, inverse relation between quasiparticle number and recombination time is invalid in this experiment. This is consistent with quasiparticle trapping, where on-trap recombination limits the observed quasiparticle lifetime.
In a superconductor well below its critical temperature, most electrons are bound together in Cooper pairs, while the number of unpaired electrons, quasiparticles, exponentially decreases with decreasing temperature. The recombination time of quasiparticles is inversely proportional to the quasiparticle number and therefore increases exponentially towards lower temperature. At a constant, finite temperature, the quasiparticle number fluctuates around its average value due to random generation and recombination events [1]. In Ref. [2], a measurement of these fluctuations showed that the quasiparticle number and recombination time are indeed inversely proportional, and as a consequence the quasiparticle fluctuation level is constant as a function of temperature. Both observations are consistent with direct recombination of free quasiparticles with emission of a phonon [3], see Fig. 1(a). Also in the presence of excess quasiparticles at low temperature, which often occur in superconducting devices in varying conditions [4, 5, 6, 7, 8, 9], the relation between the number of quasiparticles and their recombination time is maintained [2].
In this Letter we show experimentally that the intimate relation between the free quasiparticle number and recombination time is broken when quasiparticles are first trapped and then recombine as depicted in Fig. 1(b).
Impurities and disorder in superconductors are known to reduce the recombination time at low temperatures [10, 11] and can fundamentally change the relation between quasiparticle number and recombination time. The low-temperature recombination time is typically limited to tens of microseconds [11, 12] to milliseconds [2, 13], depending on the material. However, these experiments only measure the recombination time from a non-equilibrium pulse decay, or suffer from excess quasiparticles. Moreover, in tunnel junction devices, including qubits, only non-equilibrium, local quasiparticle properties can be measured directly. Understanding the reduced recombination time at low temperatures and close to thermal equilibrium, and in particular its relation to the quasiparticle density, has been hindered by the lack of a sensitive probe of quasiparticle dynamics.

Here, we measure quasiparticle fluctuations in a small Al volume (), embedded in a NbTiN superconducting resonator. This design allows for read-out at low microwave powers, minimizing the creation of excess quasiparticles [14]. By placing the Al volume on a membrane, we enhance the fluctuation level and separate quasiparticle from phonon effects.
We observe a strong reduction in the quasiparticle fluctuation level by a factor 100 when lowering the bath temperature from , together with a saturation of the recombination time. Hence, the inverse proportionality between quasiparticle number and recombination time must be broken and the recombination time is not limited by excess quasiparticles as we observed before [14, 2]. Together, our observations are in qualitative agreement with quasiparticle trapping and subsequent on-trap recombination.
Our methodology is well suited to better understand the quasiparticle dynamics in devices where quasiparticle trap structures [15, 16] and vortices [17] are introduced deliberately, to reduce the excess quasiparticle density in critical regions of a device.
In thermal equilibrium and at low temperatures (), the number of quasiparticles in a superconducting volume , is given by [18],
| (1) |
where is the single spin density of states at the Fermi-level (we use , for Al), is the Boltzmann constant and is the superconducting gap energy, with the critical temperature. The intrinsic quasiparticle lifetime with respect to recombination (hereafter called ’the quasiparticle lifetime’) is given by [3],
| (2) |
where is a material dependent characteristic time for the electron-phonon coupling. For Al, we take [3]. In the last equality, all the material dependent parameters are combined into the recombination constant, .
In experiments, the relaxation of an ensemble of quasiparticles is typically probed. As the recombination of two quasiparticles into a Cooper-pair is a pair-wise process and the emitted phonon can subsequently break a Cooper-pair [19], the apparent quasiparticle lifetime is given by,
| (3) |
Here, is the phonon escape time, is the phonon pair-breaking time and the factor in parentheses is called the phonon trapping factor. Equation 3 is valid when, , which is typically the case [20]. We take for Al [3]. can experimentally be tuned [21, 22], for instance with the use of a membrane, which we use here to distinguish phonon effects from intrinsic quasiparticle processes.
Fluctuations in the quasiparticle number occur randomly. Starting from a master equation approach [1], the Power Spectral Density (PSD) of these fluctuations can be calculated to be,
| (4) |
This is a Lorentzian spectrum, with a constant level with temperature (since ) and a roll-off frequency of .
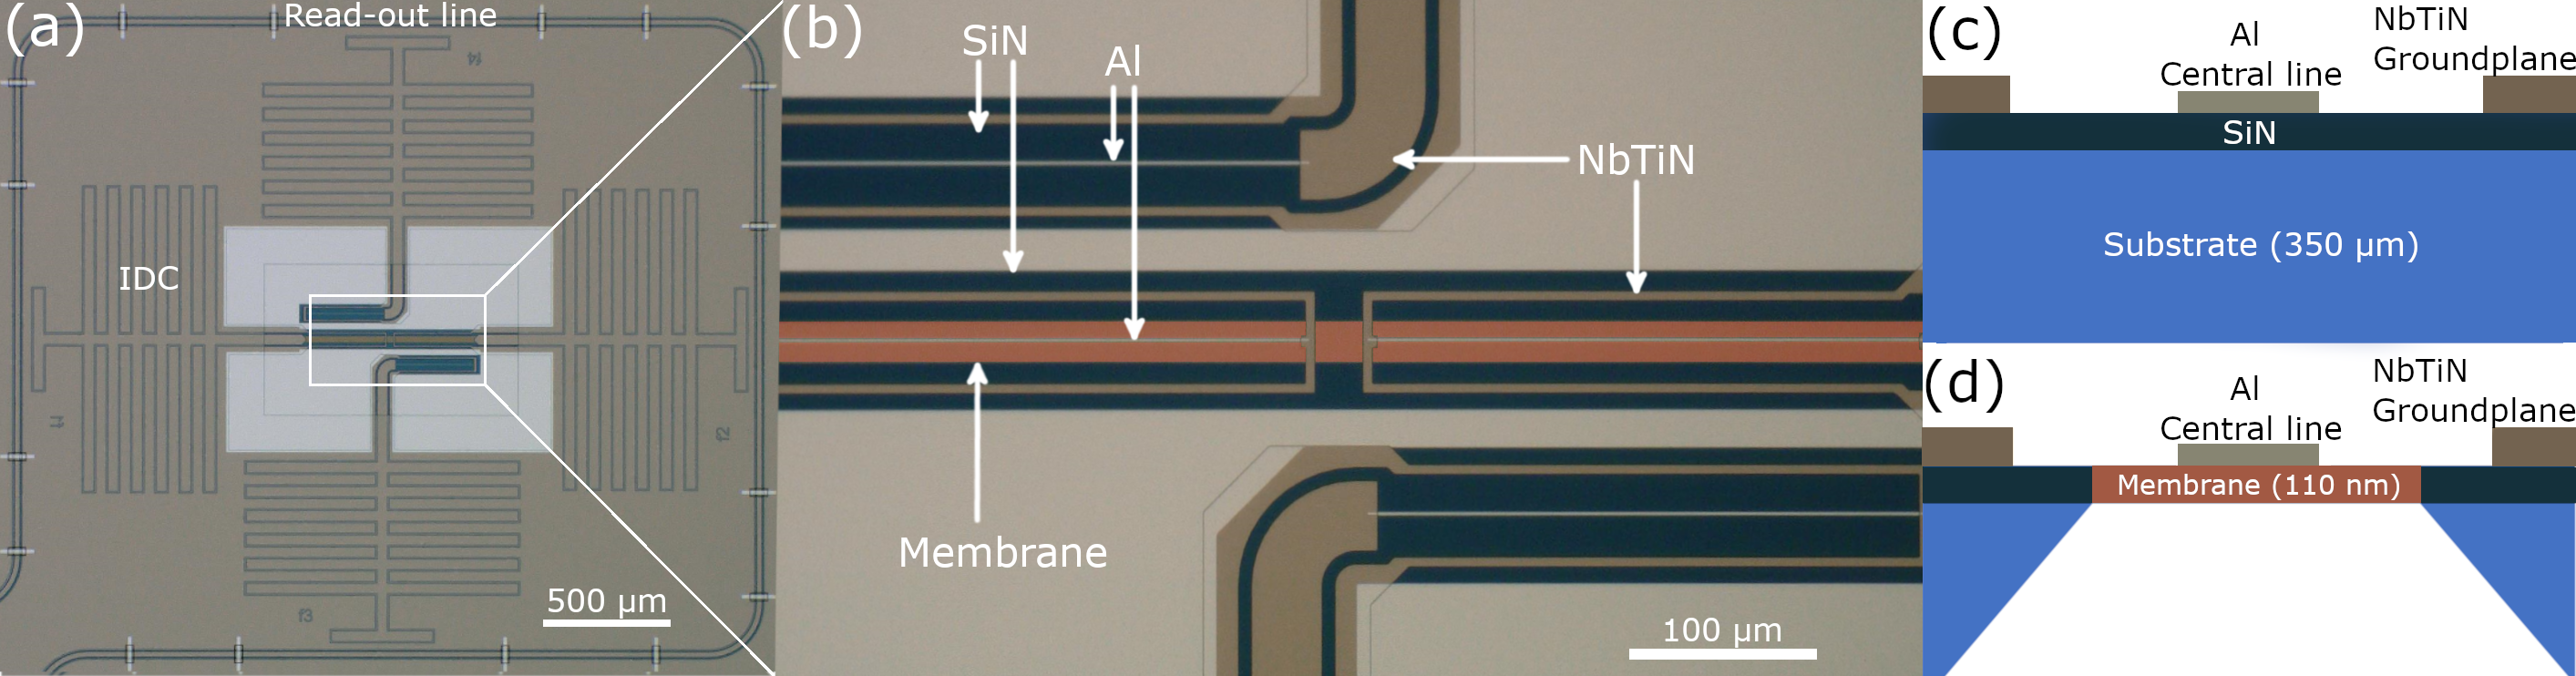
The device under study is shown in Fig. 2. Four NbTiN-Al hybrid [23] resonators are capacitively coupled to a read-out line patterned around them. The capacitive part is a NbTiN double sided interdigitated capacitor (IDC) 222J. J .A. Baselmans et al., in preparation.[25] and the inductive part is a NbTiN co-planar waveguide with an Al central line. For details see the Supplemental Material 11footnotemark: 1.
The resonator response is only sensitive to quasiparticle - Cooper-pair fluctuations within the Al ( and ), as we measure at and the current density is much higher in the Al section due to the IDC design. Furthermore, as , quasiparticles are confined to the Al volume.
The resonators are mounted in a pulse tube pre-cooled adiabatic demagnetization refrigerator, surrounded by a cryophy and a superconducting magnetic shield, and isolated from stray light by a ’box-in-a-box’ configuration [27]. The forward microwave transmission, , is recorded at an on-chip read power, . In the following, we present the results for two resonators, of which one has its sensitive volume on a membrane and one on the substrate, see Fig. 2(c,d).
We translate the complex to an amplitude () and phase () to distinguish changes in dissipation () and kinetic inductance (). These variables are defined relative to the resonance circle, which is measured for each temperature before the fluctuation measurement. The responsivity is given by , where is either or and is the fraction of kinetic inductance over the total inductance. describes the change in complex conductivity with respect to a change in quasiparticle density, which is only weakly dependent on temperature [28]. is the loaded quality factor and measured to be and at , for the membrane and substrate resonator, respectively. The resonators are designed to have the same volume and kinetic inductance fraction.
We measure time streams at of and , at temperatures ranging from . We filter pulses caused by cosmic rays [7] or other external sources 111See Supplemental Material for all power spectral densities, device fabrication details, pulse rejection, responsivity calculations and influence of Al geometry and read power. and calculate the cross-PSD, . By using the cross-PSD, we extract the dissipation - kinetic inductance (i.e., quasiparticle - Cooper-pair) fluctuations and suppress uncorrelated noise sources such as amplifier and TLS noise [14]. We determine the spectrum of the quasiparticle fluctuations via,
| (5) |
where is the resonator ring time ( is the resonance frequency), typically a few . This implies for frequencies below and we therefore neglect this factor. The last factor in Eq. 5 is the multiplication of the amplitude and phase responsivities, which we determine from a measurement of , for 11footnotemark: 1.
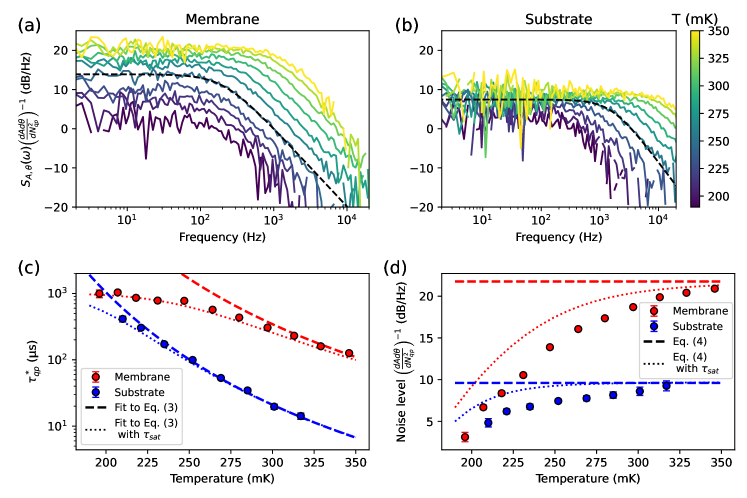
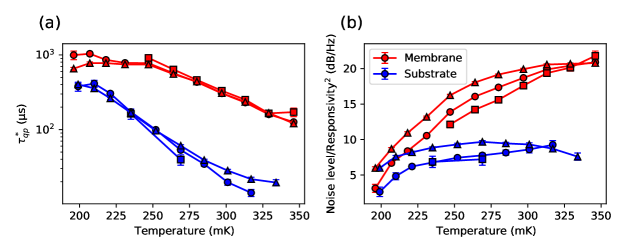
The central result of this paper is presented in Fig. 3. Figures 3(a,b) show the measured cross-PSDs and Figures 3(c,d) show the extracted apparent quasiparticle lifetime and fluctuation level from Lorentzians fits to these spectra (Eq. 4). For high temperatures (), we observe a higher level and for the membrane resonator compared to the substrate resonator. This is expected from Eqs. 3 and 4, as the membrane effectively increases . The dashed lines in Fig. 3(c,d) are fits to Eqs. 2 and 3 for temperatures , with as only free parameter, resulting in and for the membrane and substrate resonator respectively. These intervals only indicate uncertainties from the fitting procedure. Equivalently, the phonon trapping factors (Eq. 3) are 21 and 1.3 from which we would expect a higher fluctuation level for the membrane resonator. This is indeed observed in Fig. 3(d). The dashed lines give the expected level from Eq. 4, where the fitted is used. A detailed analysis of the effects of the membrane on phonon statistics and energy resolution will be published elsewhere [29].
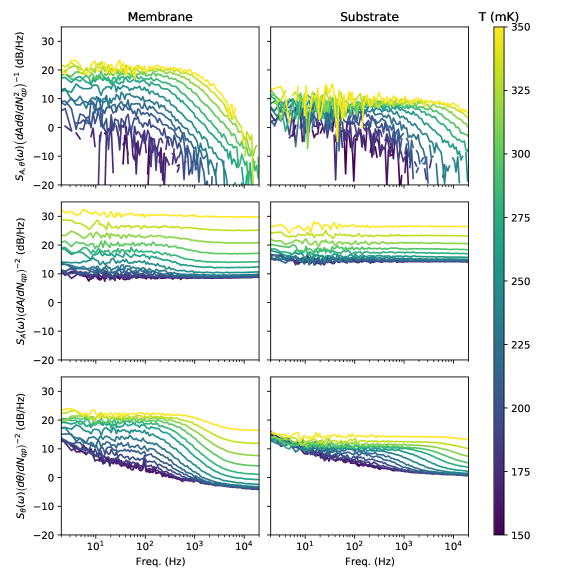
The fluctuation levels expected from Eq. 4 (dashed lines in Fig. 3(d)) are constant with changing temperature. In sharp contrast, we here observe a strongly decreasing level when lowering the temperature. At temperatures , no Lorentzian spectrum (Eq. 4) can be identified. The individual amplitude and phase PSDs show this behavior as well 11footnotemark: 1. As the responsivity factor in Eq. 5 is constant in this temperature range 11footnotemark: 1, this result should be interpreted as a strong reduction of .
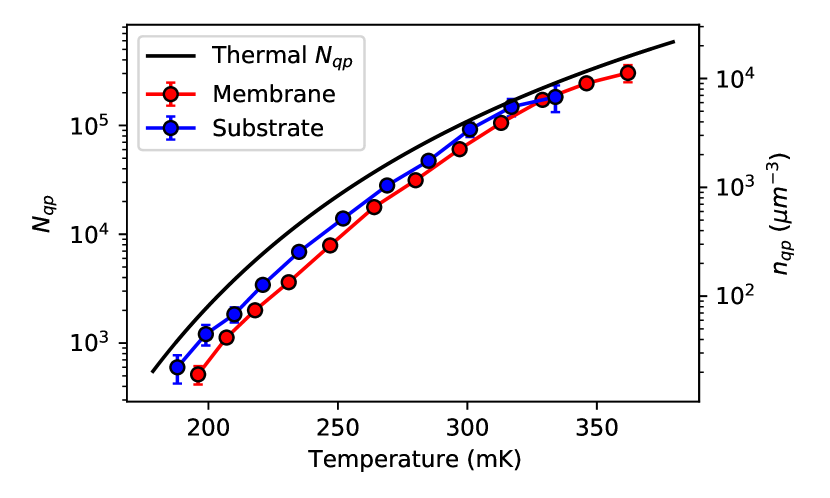
We calculate from by dividing the level by , which is shown in Fig. 4. The number of quasiparticles follows a thermal dependence for both the substrate and membrane resonator. Therefore, we conclude that the lifetime saturation is not caused by excess quasiparticles, in contrast to the observations in Ref. [2]. On top of that, the lifetimes observed for membrane and substrate resonators, saturate at a similar level despite the 16 times stronger phonon trapping in the membrane. Therefore the lifetime saturation must originate from an effect that directly interacts with the quasiparticle system.
The design of the NbTiN-Al hybrid resonators enables read-out low microwave powers (), which minimizes the creation of excess quasiparticles. When we increase , we eventually observe excess quasiparticles without a level reduction, equivalent to a higher, -induced, effective temperature. The results of Refs. [2, 14] are thus recovered in the high -regime. See the Supplemental Material for more details 11footnotemark: 1.
To verify that the lifetime saturation without creation of excess quasiparticles results in a level reduction, we calculated the lifetimes and fluctuation levels with Eq. 4, but with an alteration to Eq. 3:
| (6) |
with the saturation lifetime. For both membrane and substrate, is set to , based on from the membrane resonator. The results are plotted in Fig. 3(c,d) as the dotted lines, which follow the measured very well and shows a decrease in fluctuation level, for both resonators. The deviations of level in Fig. 3(d), are likely caused by the responsivity measurement method 11footnotemark: 1.
A possible cause of a lifetime saturation without excess quasiparticles is quasiparticle trapping. From theory, it is known that magnetic [30, *Abrikosov1959a, 32, 33, *Shiba1968, *Rusinov1969, 36] and non-magnetic [37, 38, 39] impurities can cause subgap electronic states [40] and disorder, which can result in local variations of [41, 42]. Also thickness variations [43] and unpaired surface spins [44] due to native oxide [45] may induce -variations. Quasiparticles can be trapped at these suppressed -regions [46, 47] by inelastic scattering, resulting in a background number of trapped quasiparticles, . At low temperatures, (Eq. 1) inevitably becomes comparable to , leading to dominating quasiparticle trapping behavior even for low impurity concentrations, weak disorder or other effects that lead to small variations in [46, 48, 49].
At that point, the quasiparticle lifetime is no longer limited by free quasiparticle recombination, but by on-trap recombination events, where a free quasiparticle recombines with a trapped one. Trapping itself does not change the number of Cooper-pairs and therefore is not observable in our experiments. This is in contrast to experiments where the free quasiparticle density near a junction is measured, in which case trapping dominates the low temperature behavior [50, 51]. The trapping states we conjecture are dissipative, as the amplitude and phase PSDs show the same temperature behavior 11footnotemark: 1, in contrast to what is observed for disordered TiN [11, 52].
Analogous to Eqs. 3 and 2, the saturation lifetime due to on-trap recombination can be written, , with the on-trap recombination constant [48]. The phonon that is emitted during an on-trap recombination event has an energy and is therefore unable to break a Cooper-pair into two free quasiparticles. On-trap pair-breaking (a subgap phonon breaking a Cooper-pair into a trapped and free quasiparticle) is far less likely because the density of trapping states is assumed to be small [48]. Therefore, is independent of phonon trapping, which is consistent with the observation that the substrate and membrane resonator show the same .
To investigate where quasiparticle traps could be located in our system, we conducted the same experiment with different geometries of the Al strip. Width () and length () variations did not affect the saturation lifetime, which implies the traps are not located at the NbTiN-Al interface or the sides of the Al central line. increases from with increasing the film thickness from , respectively, and the reduction in fluctuation level is not observed for the thickest film. The experimental data of these geometry variations is presented in the Supplemental Material 11footnotemark: 1. This suggests that the trap density () decreases for thicker films and the location of the traps is either at the Al-substrate interface or the top surface. The top surface might contain unpaired surface spins from native Al oxide [45, 10]. Further progress in understanding the trapping mechanism will require identification of the microscopic origin of the traps.
We here analysed the lifetime saturation phenomenologically using Eq. 6. A more detailed model of the fluctuations comprises multivariable rate equations for quasiparticles and phonons, including quasiparticle trapping and on-trap recombination terms [48, 1]. Only non-equilibrium experiments [51, 53, 17] were conducted previously (), which allows to neglect the generation terms and feedback from the phonon system, in contrast to our near-equilibrium () experiment. We have studied several such models [54], but without satisfactory results due to the number of (unknown) input parameters. However, we can constrain such a model to follow our experimental data.
Quasiparticle trapping could decrease the low-temperature responsivity of superconducting tunnel junction detectors [50], cause long-lived excitations in granular Al resonators [53] and lead to anomalous electrodynamic response of disordered TiN resonators [11, 52]. However, for single-photon detection using MKIDs[55, 56] , the quasiparticle trapping effects can be beneficial. The fluctuation level reduction results in a higher signal-to-noise ratio when generation-recombination noise is the dominant noise source and the responsivity stays the same, as we observe 11footnotemark: 1[29]. This means, somewhat counter-intuitively, that single-photon detector performance can be improved at low temperatures, by introducing quasiparticle traps, compared to a quasiparticle number saturation [14].
In conclusion, at high temperatures (), quasiparticle lifetimes in Al superconducting resonators are well described by simple recombination in thermal equilibrium [3]. At low temperatures, the lifetime is limited to , independent of phonon trapping, while the quasiparticle number exponentially decreases with temperature. This results in a strong reduction of quasiparticle fluctuations. Quasiparticle trapping with subsequent on-trap recombination is consistent with our observations. Variations in the Al strip geometry (width, length and thickness) showed that the traps are likely located at top or bottom surfaces.
All presented data and used analysis scripts are available at: https://doi.org/10.5281/zenodo.4580356 .
Acknowledgements.
We acknowledge useful discussions with Yaroslav Blanter and Karwan Rostem and experimental assistance from Juan Bueno and Sven Visser. P.J. de V. was supported by the Netherlands Organisation for Scientific Research NWO (Veni Grant No. 639.041.750 and Projectruimte 680-91-127). J.J.A.B. was supported by the European Research Council ERC (Consolidator Grant No. 648135 MOSAIC).References
- Wilson and Prober [2004] C. M. Wilson and D. E. Prober, Quasiparticle number fluctuations in superconductors, Phys. Rev. B 69, 094524 (2004).
- de Visser et al. [2011] P. J. de Visser, J. J. A. Baselmans, P. Diener, S. J. C. Yates, A. Endo, and T. M. Klapwijk, Number Fluctuations of Sparse Quasiparticles in a Superconductor, Phys. Rev. Lett. 106, 167004 (2011).
- Kaplan et al. [1976] S. B. Kaplan, C. C. Chi, D. N. Langenberg, J. J. Chang, S. Jafarey, and D. J. Scalapino, Quasiparticle and phonon lifetimes in superconductors, Phys. Rev. B 14, 4854 (1976).
- Martinis et al. [2009] J. M. Martinis, M. Ansmann, and J. Aumentado, Energy Decay in Superconducting Josephson-Junction Qubits from Nonequilibrium Quasiparticle Excitations, Phys. Rev. Lett. 103, 097002 (2009).
- Rainis and Loss [2012] D. Rainis and D. Loss, Majorana qubit decoherence by quasiparticle poisoning, Phys. Rev. B 85, 174533 (2012).
- Barends et al. [2011] R. Barends, J. Wenner, M. Lenander, Y. Chen, R. C. Bialczak, J. Kelly, E. Lucero, P. O’Malley, M. Mariantoni, D. Sank, H. Wang, T. C. White, Y. Yin, J. Zhao, A. N. Cleland, J. M. Martinis, and J. J. A. Baselmans, Minimizing quasiparticle generation from stray infrared light in superconducting quantum circuits, Appl. Phys. Lett. 99, 113507 (2011).
- Karatsu et al. [2019] K. Karatsu, A. Endo, J. Bueno, P. J. de Visser, R. Barends, D. J. Thoen, V. Murugesan, N. Tomita, and J. J. A. Baselmans, Mitigation of cosmic ray effect on microwave kinetic inductance detector arrays, Appl. Phys. Lett. 114, 032601 (2019).
- Cardani et al. [2021] L. Cardani, F. Valenti, N. Casali, G. Catelani, T. Charpentier, M. Clemenza, I. Colantoni, A. Cruciani, G. D’Imperio, L. Gironi, L. Grünhaupt, D. Gusenkova, F. Henriques, M. Lagoin, M. Martinez, G. Pettinari, C. Rusconi, O. Sander, C. Tomei, A. V. Ustinov, M. Weber, W. Wernsdorfer, M. Vignati, S. Pirro, and I. M. Pop, Reducing the impact of radioactivity on quantum circuits in a deep-underground facility, Nature Communications 12, 2733 (2021).
- de Visser et al. [2014a] P. J. de Visser, D. J. Goldie, P. Diener, S. Withington, J. J. A. Baselmans, and T. M. Klapwijk, Evidence of a Nonequilibrium Distribution of Quasiparticles in the Microwave Response of a Superconducting Aluminum Resonator, Phys. Rev. Lett. 112, 047004 (2014a).
- Barends et al. [2009] R. Barends, S. van Vliet, J. J. A. Baselmans, S. J. C. Yates, J. R. Gao, and T. M. Klapwijk, Enhancement of quasiparticle recombination in Ta and Al superconductors by implantation of magnetic and nonmagnetic atoms, Phys. Rev. B 79, 020509(R) (2009).
- Gao et al. [2012] J. Gao, M. R. Vissers, M. O. Sandberg, F. C. S. da Silva, S. W. Nam, D. P. Pappas, D. S. Wisbey, E. C. Langman, S. R. Meeker, B. A. Mazin, H. G. Leduc, J. Zmuidzinas, and K. D. Irwin, A titanium-nitride near-infrared kinetic inductance photon-counting detector and its anomalous electrodynamics, Appl. Phys. Lett. 101, 142602 (2012).
- Barends et al. [2008] R. Barends, J. J. A. Baselmans, S. J. C. Yates, J. R. Gao, J. N. Hovenier, and T. M. Klapwijk, Quasiparticle Relaxation in Optically Excited High-Q Superconducting Resonators, Phys. Rev. Lett. 100, 257002 (2008).
- Fyhrie et al. [2020] A. Fyhrie, P. Day, J. Glenn, H. Leduc, C. McKenney, J. Perido, and J. Zmuidzinas, Decay Times of Optical Pulses for Aluminum CPW KIDs, J Low Temp Phys 199, 688 (2020).
- de Visser et al. [2012] P. J. de Visser, J. J. A. Baselmans, S. J. C. Yates, P. Diener, A. Endo, and T. M. Klapwijk, Microwave-induced excess quasiparticles in superconducting resonators measured through correlated conductivity fluctuations, Appl. Phys. Lett. 100, 162601 (2012).
- Riwar et al. [2016] R.-P. Riwar, A. Hosseinkhani, L. D. Burkhart, Y. Y. Gao, R. J. Schoelkopf, L. I. Glazman, and G. Catelani, Normal-metal quasiparticle traps for superconducting qubits, Phys. Rev. B 94, 104516 (2016).
- Court et al. [2008] N. A. Court, A. J. Ferguson, R. Lutchyn, and R. G. Clark, Quantitative study of quasiparticle traps using the single-Cooper-pair transistor, Phys. Rev. B 77, 100501(R) (2008).
- Wang et al. [2014] C. Wang, Y. Y. Gao, I. M. Pop, U. Vool, C. Axline, T. Brecht, R. W. Heeres, L. Frunzio, M. H. Devoret, G. Catelani, L. I. Glazman, and R. J. Schoelkopf, Measurement and control of quasiparticle dynamics in a superconducting qubit, Nat Commun 5, 5836 (2014).
- Tinkham [2004] M. Tinkham, Introduction to Superconductivity (Dover Publications, 2004).
- Rothwarf and Taylor [1967] A. Rothwarf and B. N. Taylor, Measurement of Recombination Lifetimes in Superconductors, Phys. Rev. Lett. 19, 27 (1967).
- Kaplan [1979] S. B. Kaplan, Acoustic matching of superconducting films to substrates, J Low Temp Phys 37, 343 (1979).
- Rostem et al. [2018] K. Rostem, P. J. de Visser, and E. J. Wollack, Enhanced quasiparticle lifetime in a superconductor by selective blocking of recombination phonons with a phononic crystal, Phys. Rev. B 98, 014522 (2018).
- Puurtinen et al. [2020] T. A. Puurtinen, K. Rostem, P. J. de Visser, and I. J. Maasilta, A Composite Phononic Crystal Design for Quasiparticle Lifetime Enhancement in Kinetic Inductance Detectors, J Low Temp Phys 199, 577 (2020).
- Yates et al. [2011] S. J. C. Yates, J. J. A. Baselmans, A. Endo, R. M. J. Janssen, L. Ferrari, P. Diener, and A. M. Baryshev, Photon noise limited radiation detection with lens-antenna coupled microwave kinetic inductance detectors, Appl. Phys. Lett. 99, 073505 (2011).
- Note [2] J. J .A. Baselmans et al., in preparation.
- Noroozian et al. [2009] O. Noroozian, J. Gao, J. Zmuidzinas, H. G. LeDuc, and B. A. Mazin, Two-level system noise reduction for Microwave Kinetic Inductance Detectors, AIP Conference Proceedings 1185, 148 (2009).
- Note [1] See Supplemental Material for all power spectral densities, device fabrication details, pulse rejection, responsivity calculations and influence of Al geometry and read power.
- Baselmans et al. [2012] J. Baselmans, S. Yates, P. Diener, and P. de Visser, Ultra Low Background Cryogenic Test Facility for Far-Infrared Radiation Detectors, J Low Temp Phys 167, 360 (2012).
- Gao et al. [2008a] J. Gao, J. Zmuidzinas, A. Vayonakis, P. Day, B. Mazin, and H. Leduc, Equivalence of the Effects on the Complex Conductivity of Superconductor due to Temperature Change and External Pair Breaking, J Low Temp Phys 151, 557 (2008a).
- de Visser et al. [2021] P. J. de Visser, S. A. de Rooij, V. Murugesan, D. J. Thoen, and J. J. Baselmans, Phonon-Trapping-Enhanced Energy Resolution in Superconducting Single-Photon Detectors, Phys. Rev. Applied 16, 034051 (2021), arXiv:2103.06723 .
- Abrikosov and Gor’kov [1959a] A. A. Abrikosov and L. P. Gor’kov, Superconducting alloys at finite temperatures, Sov. Phys. - JETP (Engl. Transl.); (United States) 9, 220 (1959a).
- Abrikosov and Gor’kov [1959b] A. A. Abrikosov and L. P. Gor’kov, Theory of superconducting alloys. I. The electrodynamics of alloys at absolute zero, Sov. Phys. - JETP (Engl. Transl.); (United States) 8, 1090 (1959b).
- Müller-Hartmann and Zittartz [1971] E. Müller-Hartmann and J. Zittartz, Kondo Effect in Superconductors, Phys. Rev. Lett. 26, 428 (1971).
- Yu [1965] L. Yu, Bound State in Superconductors with Paramagnetic Impurities, Chin. J. Phys. (Peking) (Engl. Transl.) 21, 75 (1965).
- Shiba [1968] H. Shiba, Classical Spins in Superconductors, Prog Theor Phys 40, 435 (1968).
- Rusinov [1969] A. I. Rusinov, On the Theory of Gapless Superconductivity in Alloys Containing Paramagnetic Impurities, Soviet Journal of Experimental and Theoretical Physics 29, 1101 (1969).
- Fominov et al. [2011] Y. V. Fominov, M. Houzet, and L. I. Glazman, Surface impedance of superconductors with weak magnetic impurities, Phys. Rev. B 84, 224517 (2011).
- Kaiser [1970] A. B. Kaiser, Effect of non-magnetic localized states in superconducting alloys, J. Phys. C: Solid State Phys. 3, 410 (1970).
- Ghosal et al. [2001] A. Ghosal, M. Randeria, and N. Trivedi, Inhomogeneous pairing in highly disordered s-wave superconductors, Phys. Rev. B 65, 014501 (2001).
- Bespalov et al. [2016a] A. Bespalov, M. Houzet, J. S. Meyer, and Y. V. Nazarov, Density of states in gapped superconductors with pairing-potential impurities, Phys. Rev. B 93, 104521 (2016a).
- Bespalov [2019] A. A. Bespalov, Impurity-induced subgap states in superconductors with inhomogeneous pairing, Phys. Rev. B 100, 094507 (2019).
- Larkin and Ovchinnikov [1972] A. I. Larkin and Y. N. Ovchinnikov, Density of States in Inhomogeneous Superconductors, Soviet Journal of Experimental and Theoretical Physics 34, 1144 (1972).
- Feigel’man and Skvortsov [2012] M. V. Feigel’man and M. A. Skvortsov, Universal Broadening of the Bardeen-Cooper-Schrieffer Coherence Peak of Disordered Superconducting Films, Phys. Rev. Lett. 109, 147002 (2012).
- Chubov et al. [1969] P. Chubov, V. Eremenko, and Y. A. Pilipenko, Dependence of the critical temperature and energy gap on the thickness of superconducting aluminum films, SOV PHYS JETP 28, 389 (1969).
- Faoro and Ioffe [2008] L. Faoro and L. B. Ioffe, Microscopic Origin of Low-Frequency Flux Noise in Josephson Circuits, Phys. Rev. Lett. 100, 227005 (2008).
- Kumar et al. [2016] P. Kumar, S. Sendelbach, M. A. Beck, J. W. Freeland, Z. Wang, H. Wang, C. C. Yu, R. Q. Wu, D. P. Pappas, and R. McDermott, Origin and Reduction of 1/f Magnetic Flux Noise in Superconducting Devices, Phys. Rev. Applied 6, 041001(R) (2016).
- Bespalov et al. [2016b] A. Bespalov, M. Houzet, J. S. Meyer, and Y. V. Nazarov, Theoretical Model to Explain Excess of Quasiparticles in Superconductors, Phys. Rev. Lett. 117, 117002 (2016b).
- Meyer et al. [2020] J. S. Meyer, M. Houzet, and Y. V. Nazarov, Dynamical Spin Polarization of Excess Quasiparticles in Superconductors, Phys. Rev. Lett. 125, 097006 (2020).
- Kozorezov et al. [2008a] A. G. Kozorezov, A. A. Golubov, J. K. Wigmore, D. Martin, P. Verhoeve, R. A. Hijmering, and I. Jerjen, Inelastic scattering of quasiparticles in a superconductor with magnetic impurities, Phys. Rev. B 78, 174501 (2008a).
- Kozorezov et al. [2009] A. G. Kozorezov, A. A. Golubov, J. K. Wigmore, D. Martin, P. Verhoeve, R. A. Hijmering, and I. Jerjen, The Effect of Magnetic Impurities on the Response of Superconducting Photon Detectors, IEEE Transactions on Applied Superconductivity 19, 440 (2009).
- Kozorezov et al. [2001] A. G. Kozorezov, J. K. Wigmore, A. Peacock, A. Poelaert, P. Verhoeve, R. den Hartog, and G. Brammertz, Local trap spectroscopy in superconducting tunnel junctions, Appl. Phys. Lett. 78, 3654 (2001).
- Kozorezov et al. [2008b] A. G. Kozorezov, R. A. Hijmering, G. Brammertz, J. K. Wigmore, A. Peacock, D. Martin, P. Verhoeve, A. A. Golubov, and H. Rogalla, Dynamics of nonequilibrium quasiparticles in narrow-gap superconducting tunnel junctions, Phys. Rev. B 77, 014501 (2008b).
- Bueno et al. [2014] J. Bueno, P. C. J. J. Coumou, G. Zheng, P. J. de Visser, T. M. Klapwijk, E. F. C. Driessen, S. Doyle, and J. J. A. Baselmans, Anomalous response of superconducting titanium nitride resonators to terahertz radiation, Appl. Phys. Lett. 105, 192601 (2014).
- Grünhaupt et al. [2018] L. Grünhaupt, N. Maleeva, S. T. Skacel, M. Calvo, F. Levy-Bertrand, A. V. Ustinov, H. Rotzinger, A. Monfardini, G. Catelani, and I. M. Pop, Loss Mechanisms and Quasiparticle Dynamics in Superconducting Microwave Resonators Made of Thin-Film Granular Aluminum, Phys. Rev. Lett. 121, 117001 (2018).
- de Rooij [2020] S. A. H. de Rooij, Quasiparticle Dynamics in Optical MKIDs: Single Photon Response and Temperture Dependent Generation-Recombination Noise, Master’s thesis, Delft University of Technology, Delft (2020).
- Day et al. [2003] P. K. Day, H. G. LeDuc, B. A. Mazin, A. Vayonakis, and J. Zmuidzinas, A broadband superconducting detector suitable for use in large arrays, Nature 425, 817 (2003).
- Zmuidzinas [2012] J. Zmuidzinas, Superconducting Microresonators: Physics and Applications, Annu. Rev. Condens. Matter Phys. 3, 169 (2012).
- Thoen et al. [2017] D. J. Thoen, B. G. C. Bos, E. A. F. Haalebos, T. M. Klapwijk, J. J. A. Baselmans, and A. Endo, Superconducting NbTin Thin Films With Highly Uniform Properties Over a 100 mm Wafer, IEEE Transactions on Applied Superconductivity 27, 1 (2017).
- Gao et al. [2008b] J. Gao, M. Daal, A. Vayonakis, S. Kumar, J. Zmuidzinas, B. Sadoulet, B. A. Mazin, P. K. Day, and H. G. Leduc, Experimental evidence for a surface distribution of two-level systems in superconducting lithographed microwave resonators, Appl. Phys. Lett. 92, 152505 (2008b).
- de Visser et al. [2014b] P. J. de Visser, J. J. A. Baselmans, J. Bueno, N. Llombart, and T. M. Klapwijk, Fluctuations in the electron system of a superconductor exposed to a photon flux, Nature Communications 5, 3130 (2014b).
- Swenson et al. [2013] L. J. Swenson, P. K. Day, B. H. Eom, H. G. Leduc, N. Llombart, C. M. McKenney, O. Noroozian, and J. Zmuidzinas, Operation of a titanium nitride superconducting microresonator detector in the nonlinear regime, Journal of Applied Physics 113, 104501 (2013).
- Valenti et al. [2019] F. Valenti, F. Henriques, G. Catelani, N. Maleeva, L. Grünhaupt, U. von Lüpke, S. T. Skacel, P. Winkel, A. Bilmes, A. V. Ustinov, J. Goupy, M. Calvo, A. Benoît, F. Levy-Bertrand, A. Monfardini, and I. M. Pop, Interplay Between Kinetic Inductance, Nonlinearity, and Quasiparticle Dynamics in Granular Aluminum Microwave Kinetic Inductance Detectors, Phys. Rev. Applied 11, 054087 (2019).
- Thomas et al. [2020] C. N. Thomas, S. Withington, Z. Sun, T. Skyrme, and D. J. Goldie, Nonlinear effects in superconducting thin film microwave resonators, New J. Phys. 22, 073028 (2020), arXiv:2001.02540 .
- de Visser [2014] P. J. de Visser, Quasiparticle Dynamics in Aluminium Superconducting Microwave Resonators, Ph.D. thesis, Delft University of Technology, Delft (2014).
- Guruswamy et al. [2014] T. Guruswamy, D. J. Goldie, and S. Withington, Quasiparticle generation efficiency in superconducting thin films, Supercond. Sci. Technol. 27, 055012 (2014).
Appendix A SUPPLEMENTAL MATERIAL
Appendix B Device Design and Fabrication
The capacitive part is a (8-40-8)- co-planar waveguide (CPW) with interdigitated capacitors (IDC) on both sides [25] 22footnotemark: 2, patterned in a thick NbTiN film [57] (normal state resistivity, , , residual resistance ratio, ). The large width of the IDC suppresses TLS noise, as the electric field is distributed over a larger area [58]. The capacitive fingers increase the device capacitance, allowing a resonator with a much lower total inductance for the same resonant frequency ().
The sensitive part is a (23-1.73-23)- CPW, with an Al (, , ) central line, which is long, thick and shorted to the NbTiN ground plane to make a quarter-wave resonator.
The NbTiN and Al films are sputtered on a thick Si wafer with a SiN film on top, deposited with low pressure chemical vapour deposition. A backside KOH etch is used to release the SiN membrane, which supports two of the four Al sections as seen in Fig. 2 of the main text. The final membrane thickness is due to over-etching. The SiN beneath the capacitive part is etched away to suppress two level system (TLS) noise.
B.0.1 Quality Factors
| Membrane | Substrate | |
|---|---|---|
Appendix C Amplitude, Phase and Cross-Power Spectral Densities
Appendix D Pulse Rejection
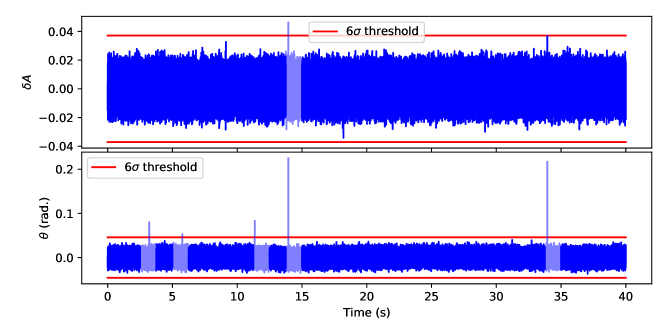
The time traces typically contain pulses, caused by external energy sources, such as cosmic rays [7]. As the amplitude of such pulses is large compared to the noise, they have a dominating effect on the noise measurement and thus contaminate the Power Spectral Densities (PSDs). We filter the pulses in the following way.
First, the time trace is corrected for an offset by fitting a quadratic polynomial and subtracting it from the data. This is to correct for small temperature drifts during the measurement. Then, the time stream is cut into 32 equal segments. A segment is rejected if it contains a point outside a threshold. This threshold is set to , where is the minimal standard deviation of all the segments. This threshold ensures we filter pulses of and excess quasiparticles, for phase and amplitude, respectively. For the cross-PSD, the segment is rejected if the amplitude or the phase segment is rejected. An example of this procedure is shown in Fig. S3.
For each non-rejected segment, the PSD is estimated via a periodogram with a Hamming window, after which they are averaged. Finally, the spectrum is down-sampled to 30 points per decade for visibility.
Appendix E Al Geometry Variations
In the following sections, measurements of different devices will be discussed, which have not been presented in the main text. The measurement procedure and data analysis is the same. Table SII shows an overview of the different parameters of the devices.
| Device | Capacitor | Substrate | Al thickness (nm) | Al width (µm) | Al length (mm) | (K) | () | RRR |
|---|---|---|---|---|---|---|---|---|
| A1 | IDC | SiN membrane | 50 | 1.73 | 0.31 | 1.26 | 1.6 | 4.0 |
| A2 | IDC | SiN/Si substrate | 50 | 1.73 | 0.31 | 1.26 | 1.6 | 4.0 |
| A3 | IDC | SiN membrane | 25 | 1.73 | 0.31 | 1.35 | 2.4 | 2.7 |
| B1 | IDC | c-Sapphire | 40 | 0.6 | 0.12 - 1.4 | 1.2* | 0.7* | 5.2* |
| B2 | IDC | c-Sapphire | 40 | 1.5 | 0.12 - 1.4 | 1.2* | 0.7* | 5.2* |
| C | CPW | c-Sapphire | 150 | 0.92 | 0.53 | 1.12 | 0.4 | 9.3 |
E.0.1 Al Length
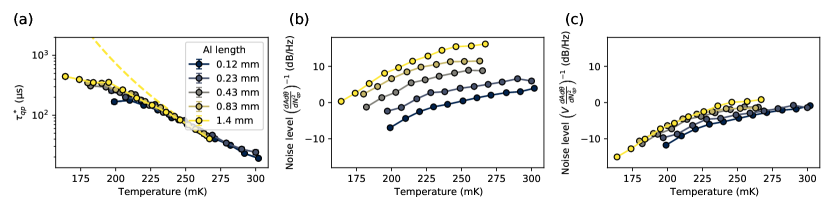
We measured the quasiparticle fluctuation in device B1, which Al strip length variations from . Figure S4 shows the result of the same procedure explained in the main text.
We do not see a clear dependence of the saturation lifetime on Al length. The increase in noise level with longer strip length, can partly be explained by noting that . Figure S4(c) shows the noise levels when divided by Al volume.
E.0.2 Al Width
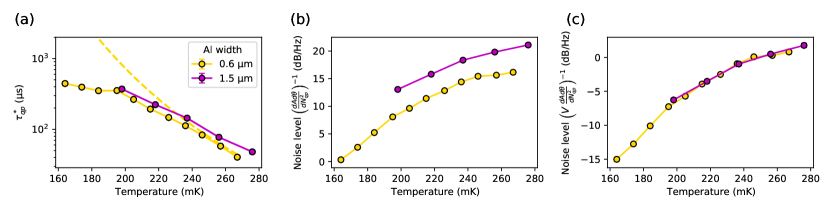
In Fig. S5, we show a comparison in lifetime and noise levels, when the Al width is varied. Although the lifetimes for the strip are a bit higher (possibly due to a higher phonon escape time), no difference in saturation lifetime can be observed. The offset in noise levels can be explained by the larger Al volume, as Fig. S5(c) shows.
E.0.3 Al Thickness
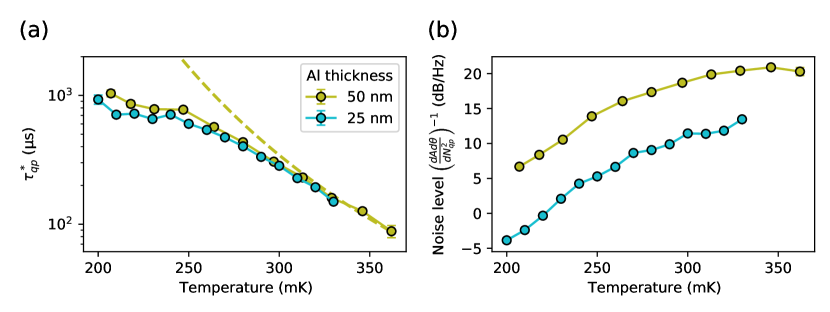
The same device as discussed in the main text is also fabricated with an Al thickness of (device A3). A comparison of lifetime and noise level for the membrane resonators is given in Fig. S6(a,b). Only a slight difference in saturation lifetime can be observed. We would expect shorter lifetimes for device A3 than for A1, as the phonon escape time should be shorter. However, the film has a higher (as theoretically predicted in Ref. [43]), which also increases the lifetime (Eq. 2). This diminishes the difference in lifetime we would expect from phonon trapping. To be precise, the phonon trapping factor is calculated to be 21 and 11 and the is measured to be and for the and resonators, respectively.
The difference in noise level can only partly be explained by the larger Al volume (). Differences in critical temperature (c.f. and ) and resistivity (c.f.
and , for the and , respectively) influences [3], while is taken constant here. This could be the cause for the large difference in noise level.
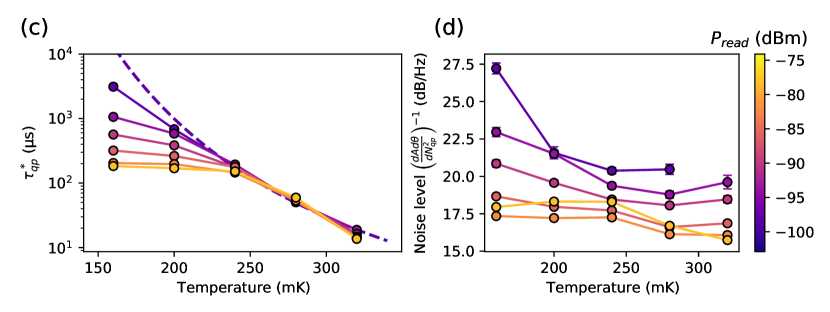
We also include the lifetimes and noise levels from a different resonator, which has a Al thicknesses of . In Fig. S6(c,d), we observe a high saturation lifetime for the lowest read power () and, interestingly, the reduction of noise level is not observed in this thicker resonator. This suggests that the cause of the noise level reduction is located either on the Al-substrate interface or the top surface, for example, by unpaired surface spins from native Al oxide, which is supported by the results of Ref. [10]. In contrast, the results of Ref. [13] show higher for decreasing Al thickness.
The lifetime saturation that is still present, is most likely due to read power induced creation of excess quasiparticles as observed in Refs. [2, 14], and supported by the fact that decreases with increasing read power. Note that here, the read power is increased with respect to the other data presented up to this point.
Appendix F Microwave Readout Power Dependence
In the measurements discussed in the main text, we selected low read powers to limit read-out power effects, such as creation of excess quasiparticles [14, 59], redistribution of quasiparticles [9] and non-linear kinetic inductance [60, 61], which was recently reviewed in Ref. [62]. Here, we analyse the effect of increasing the read-out power.
F.0.1 Peak in Lifetime
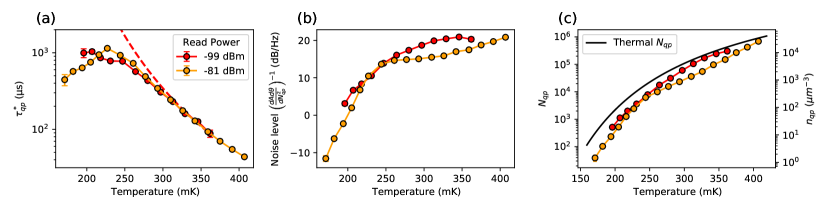
Figure S7 shows how the results change when the read power is increased. In Fig. S7(a,b) we observe a peak in lifetime around appearing at higher read power. This is also observed in Ref. [10], where also trapping states are deemed to be the cause. We notice that is now temperature dependent, implying that increases with decreasing temperature. From Fig. S7(c), we see that this increase in read power does not result in excess (free) quasiparticles.
F.0.2 Creation of Excess Quasiparticles
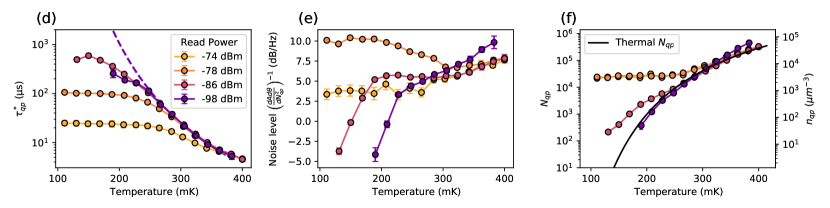
Figure S7(d-f) shows the noise behaviour at even larger read powers, measured in device B2. Upon increasing read power, the onset of the noise level reduction occurs to lower temperatures, after which it disappears. The saturation lifetime still decreases as read power increases, consistent with the creation of excess quasiparticles [14, 59], also observed in Fig. S7(f). Indeed, we see that more excess quasiparticles are created when increasing the readout power from . Interestingly, we see that increasing the read power from , does not increase the amount of non-equilibrium quasiparticles, but does lower the saturation lifetime and noise level. This may be caused by a microwave redistribution effect on the responsivity [9], which we do not account for.
We conclude from these observations that a lifetime saturation can be caused by two phenomena. At high readout powers, excess quasiparticles are created, which saturates the free quasiparticle number ( in Eq. 1 of the main text), and therefore also (Eq. 2 of the main text). The quasiparticle lifetime is then limited by recombination events. This is consistent with Refs. [14, 2]. At low readout powers, the creation of excess quasiparticles is suppressed and the trapped quasiparticle number () becomes significant compared to . This limits the quasiparticle lifetime to on-trap recombination events, while the free quasiparticle number () stays thermal. These two phenomena can be distinguished by calculating from the noise levels, as done in Fig. S7(c,f) and Fig. 4 from the main text.
Appendix G Responsivity Measurement
We determine the amplitude and phase responsivities in a separate measurement of as a function of temperature. We fit Lorentzian curves to the dips to determine the resonance frequency () and the internal and coupling quality factor for each temperature and read power. We then linearly fit and to at high temperatures (), where quasiparticle loss dominates. Here, , where is the resonance frequency at and is calculated from Eq. 1 from the main text. The amplitude and phase responsivities are calculated as and , respectively [63]. This method does not take read power effects into account, but it is executed at the same read power as the noise measurement.
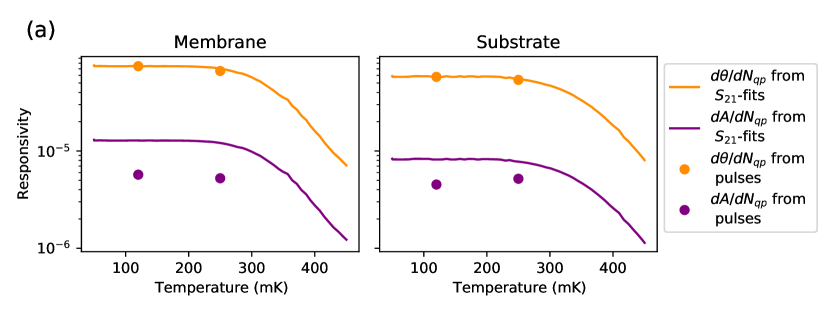
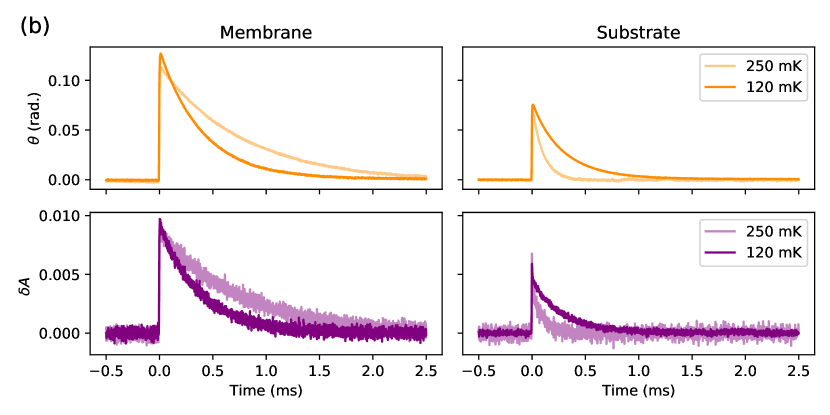
Figure S8(a) shows the calculated responsivities along with a different method to calculate the responsivity. This second method is based on the single photon response of the resonator, which is used as an MKID [55]. When a photon is absorbed in the Al, it will break thousands of Cooper-pairs, resulting in an excess quasiparticle number, , and therefore a measurable signal in and . The responsivity is calculated as,
where is either or and is the maximum measured value. is the pair-breaking efficiency, which we here set to and for the membrane and substrate resonator respectively [29]. These values are chosen such that the two calculation methods coincide for the phase variable at and should be compared to the theoretical maximum value of [64]. is the -photon energy, i.e. . For , we use the BSC-relation .
Experimentally, a light source illuminates the middle part of the chip. The laser is attenuated to the point where single photon absorptions can be detected, without much overlap. A time stream of is measured at , with a read frequency equal to the resonance frequency of the resonator and power and for on and off membrane, respectively. The and signals from the -mixer are translated to and with the use of the resonance circle, which is measured earlier.
The average of multiple (typically a thousand) single photon pulses is presented in Fig. S8(b). A detailed description of the experiment and results of phonon trapping effects to the pulse amplitudes will be published separately [29].
In Fig. S8(a) both methods show that the responsivity does not decrease over the temperature range where the noise level reduction is observed (c.f. Fig. 3(c,d)). We conclude that the noise level reduction is caused by quasiparticle dynamics, and not by a reduction in responsivity (i.e. by and not by the last factor in Eq. 5 of the main text).