A Complete 16 µm-Selected Galaxy Sample at : Mid-infrared Spectral Energy Distributions
Abstract
We describe a complete, flux-density-limited sample of galaxies at redshift selected at 16 µm. At the selection wavelength near 8 µm rest, the observed emission comes both from dust heated by intense star formation and from active galactic nuclei (AGNs). Fitting the spectral energy distributions (SEDs) of the sample galaxies to local-galaxy templates reveals that more than half the galaxies have SEDs dominated by star formation. About one sixth of the galaxy SEDs are dominated by an AGN, and nearly all the rest of the SEDs are composite. Comparison with X-ray and far-infrared observations shows that combinations of luminosities at rest-frame 4.5 and 8 µm give good measures of both AGN luminosity and star-formation rate. The sample galaxies mostly follow the established star-forming main sequence for galaxies, but of the galaxies more than 0.5 dex above that main sequence, more than half have AGN-type SEDs. Similarly, the most luminous AGNs tend to have higher star-formation rates than the main sequence value. Galaxies with stellar masses 1011 M☉ are unlikely to host an AGN. About 1% of the sample galaxies show an SED with dust emission typical of neither star formation nor an AGN.
1 INTRODUCTION
Star formation rate (SFR), stellar mass, and the growth of central supermassive black holes (SMBHs) are critical factors regulating mass assembly in galaxies. Star formation occurring in galaxies can be classified in three phases (e.g., Daddi et al., 2010; Elbaz et al., 2011): a main sequence in which SFR and stellar mass for most galaxies have a redshift-dependent correlation with roughly a factor of three (but varying with stellar mass) dispersion (Davies et al., 2019); a starburst phase in which galaxies have SFR more than a factor of three above the main-sequence relation (Elbaz et al., 2018); and a quiescent phase with SFR more than a factor of three below the main-sequence relation.
Rapid cessation of star formation (“quenching”) is required for massive galaxies to limit their numbers to those observed in the local Universe (Faber et al., 2007; Huang et al., 2003, 2013). Several proposed mechanisms to quench star formation involve galaxies’ central SMBHs. SMBH masses are linearly proportional to masses of their hosting bulge (Kormendy & Richstone, 1995; Magorrian et al., 1998), and therefore every galaxy bulge is presumed to contain an SMBH. The SMBH must grow along with its host bulge to maintain the observed linearity (Rigopoulou et al., 2009; Netzer, 2009; Rosario et al., 2013; Lapi et al., 2014; Lanzuisi et al., 2017). Indeed many observations have found a correlation between AGN accretion luminosity and host galaxy SFR (Hao et al., 2005a, 2008; Silverman et al., 2008; Madau & Dickinson, 2014; Dai et al., 2018).
A galaxy’s spectral energy distribution (SED) in the rest-frame near- and mid-infrared (NIR and MIR: 1–30 µm) contains rich information about stellar mass, star formation, and AGN activity. To estimate galaxy stellar masses, photometry at rest wavelength nm can be used, but NIR is better (Bell, McIntosh, Katz, & Weinberg, 2003; Huang et al., 2013; McGaugh & Schombert, 2014). Much shorter wavelengths than 600 nm are not good because they are emitted only by hotter stars that make up only a small fraction of the mass. Because stellar emission from galaxies at is shifted to observed NIR for rest-frame 600 nm and to MIR for rest-frame NIR, estimating stellar mass with only observed visible photometry becomes impossible. After the Spitzer Space Telescope was launched in 2003, IRAC 3.6–8 µm photometry became the benchmark for measuring stellar mass for high-redshift galaxies (Rigopoulou et al., 2009; Magdis et al., 2010; Huang et al., 2013).
Despite the complexity of galaxy SEDs, photometry at rest-frame MIR SEDs wavelengths is often used to estimate SFRs. Based on a local star-forming galaxy sample, Calzetti et al. (2007) argued that rest-frame 24 µm emission arises from hot dust heated directly by OB stars in star-formation regions, and therefore 24 µm luminosities in these galaxies are linearly correlated with SFR. Chary & Elbaz (2001); Alonso-Herrero et al. (2006); Calzetti et al. (2007); Rieke et al. (2009) used local star-forming galaxy samples to establish such a linear conversion and proposed that it can apply to galaxies at high redshift with a correct set of templates. However, estimating SFR for galaxies at high redshift using their observed 24 µm flux densities requires an accurate K-correction. At , the MIPS 24 µm band samples rest-frame µm, where there are strong spectral features such as the PAH emission features at 6.2, 7.7, and 8.6 µm and the silicate absorption at 10 µm. Some dusty galaxies at have such a deep silicate absorption that they have no 24 µm detection even in the deepest MIPS image but are clearly detected at longer wavelengths (Magdis et al., 2011). Therefore the MIPS 24 µm K-correction for galaxies in this redshift range can vary substantially and is very sensitive to both redshift and the SED. A 24 µm-selected sample may therefore yield a diverse galaxy population.
The rest-frame 8 µm luminosity is also considered a tracer of SFR (e.g., Wu et al., 2005; Mahajan et al., 2019). Broadband photometry at this (rest) wavelength measures mainly PAH emission features at 7.7 and 8.6 µm perhaps with some contribution from the 6.2 µm feature (Pahre, Ashby, Fazio, & Willner, 2004). More recently, Cortzen et al. (2019) found that the PAH emission correlates with cold molecular gas in star-forming galaxies, but that should not be a problem because molecular gas will be correlated with SFR in most galaxies. Even so, PAH emission may not trace star formation: (1) in H II regions, where PAH molecules can be destroyed by the strong UV radiation field (Helou et al., 2001; Houck et al., 2004; Pety et al., 2005); (2) where sources unrelated to star formation, such as evolved stars and diffuse light, excite PAH (Li & Draine, 2002; Boselli, Lequeux, & Gavazzi, 2004; Peeters et al., 2004); (3) in galaxies with low metallicity (Engelbracht et al., 2005; Hogg et al., 2005; Galliano et al., 2005; Rosenberg et al., 2006; Shao et al., 2020). Shao et al. (2020) found the ratio of 8 µm luminosity to SFR remains constant for galaxies with M☉ but decreases rapidly with metallicity for galaxies with M☉. Despite the potential complications, Elbaz et al. (2011) found that rest-frame 8 µm luminosity has a good linear correlation with with for galaxies at , and Mahajan et al. (2019) found to be a good SFR measure for most local star-forming galaxies. Because is such a good star-formation tracer, many studies have used MIPS 24 µm surveys to select star-forming galaxies at (Huang et al., 2007; Farrah et al., 2008; Desai et al., 2009; Huang et al., 2009; Fang et al., 2014).
AGN emission is another uncertain factor adding to already-complicated galaxy MIR SEDs. A bare AGN typically shows a SED in the MIR (Ward et al., 1987), much redder than starlight. Some PG quasars even display a silicate emission feature from the inner side of their dusty torus (Hao et al., 2005b). Any AGN emission shows up in the IRAC bands (Lacy et al., 2004; Stern et al., 2005; Alonso-Herrero et al., 2006) and is often the dominant MIR component. When the AGN component is dominant, it is proportional to X-ray luminosity (Carleton et al., 1987; Lutz et al., 2004; Lanzuisi et al., 2009; Stern, 2015). If an AGN component is neglected, the SFR derived from rest-frame 8 µm luminosity or observed 24 µm flux density will be overestimated. For galaxies with overwhelming AGN emission, MIR photometry does not measure SFR at all.
This paper presents an SED study of a complete 16 µm-selected galaxy sample at . It is part of series studying rest-frame 8 µm-selected galaxies at , 1, and 1.9 via the observed bands of IRAC 8 µm, IRS peakup/Akari 16 µm, and MIPS 24 µm (Huang et al., 2007, 2009; Fang et al., 2014; Shao et al., 2020). At , the PAH emission features at 6.2, 7.7, and 8.6 µm are shifted into the observed 16 µm band. The sample will therefore contain many star-forming galaxies but also strong AGNs. Fitting the galaxy SEDs with a set of local templates reveals the demography of this sample and identifies the AGNs. A well determined SED also permits accurate measurement of monochromatic luminosities and , thus giving an estimate of AGN luminosity and SFR. The 16 µm sample is from the well-studied extragalactic fields Extended Groth Strip (EGS), GOODS-South (GOODS-S), and GOODS-North (GOODS-N), providing a high rate of spectroscopic redshifts. When spectroscopic redshifts are not available, we use photometric redshifts, which are reliable in these fields (Dahlen et al., 2013; Huang et al., 2013). In the GOODS fields, our galaxy sample is complete to L☉ at corresponding to M☉ yr-1.
The structure of this paper is: §2 describes the sample. §3 presents MIR SEDs of star forming galaxies and AGNs in the sample. §4 gives SFR estimates and establishes the SFR–stellar-mass and SFR–AGN luminosity relations for the sample. §5 is a brief summary. Throughout the paper, we adopt the Chabrier (2003) initial mass function (IMF). Source distances are based on a standard flat CDM cosmology with km s-1 Mpc-1 and .
2 The 16 µm-Selected Sample
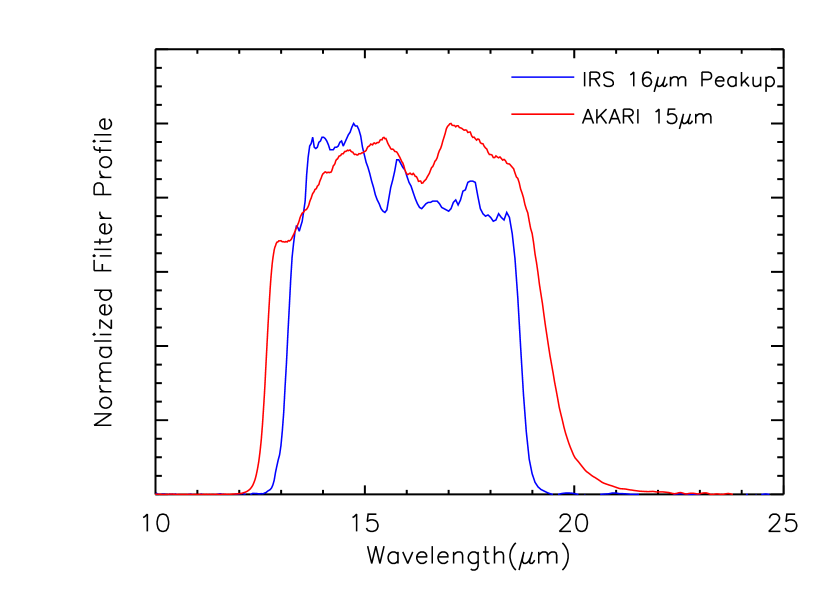
We chose a 16 µm-selected sample for galaxies at to include the strong PAH emission features. The earliest surveys were by the Infrared Space Observatory (Elbaz et al., 1999; Gruppioni et al., 2002; Rodighiero et al., 2004) at 15 µm. Larger and deeper surveys came from Akari/IRC at 15 µm and the Spitzer/IRS peakup imager at 16 µm (Wada et al., 2007; Burgarella et al., 2009; Pearson et al., 2010; Teplitz et al., 2011). The present study uses photometric catalogs from the latter two surveys. Figure 1 shows that the Spitzer/IRS and Akari/IRC bandpasses have similar profiles. Teplitz et al. (2011) compared the flux densities for GOODS-S objects detected by both instruments and found an average 1.3 times higher flux density measured by Spitzer/IRS at 16 µm than by Akari/IRC at 15 µm. We have scaled the Akari photometry accordingly to its IRS 16 µm equivalent.
Our 16 µm sample222Hereafter a 16 µm-selected sample refers to the galaxy sample selected from either Akari 15 µm or Spitzer/IRS-Peakup 16 µm photometric catalogs. has flux density limits Jy in GOODS-N/S and Jy (corresponding to Jy) in the EGS, the respective detection limits. All three fields have extensive redshift surveys, and all 16 µm sources above our selection limits have redshifts available, either spectroscopic or photometric. Our final sample comprises sources with . This includes 556 objects based on spectroscopic redshifts and 149 objects based on photometric redshifts. Table LABEL:tab:sample summarizes the sample characteristics.
Accurate redshifts are crucial for understanding the properties of sample galaxies. MIR galaxy spectra can include strong PAH emission and silicate absorption features. Redshift uncertainties will therefore cause substantial uncertainties in the K-correction to convert observed 16 µm flux densities () to rest-frame 8 µm luminositie for galaxies at . As noted above, 79% of the sample galaxies have spectroscopic redshifts. The extensive multi-band photometry in our survey fields also gives excellent photometric redshift measurements with (Dahlen et al., 2013; Huang et al., 2013). This gives K-corrections adequate to within several percent, depending on the exact redshift and SED of individual sources.
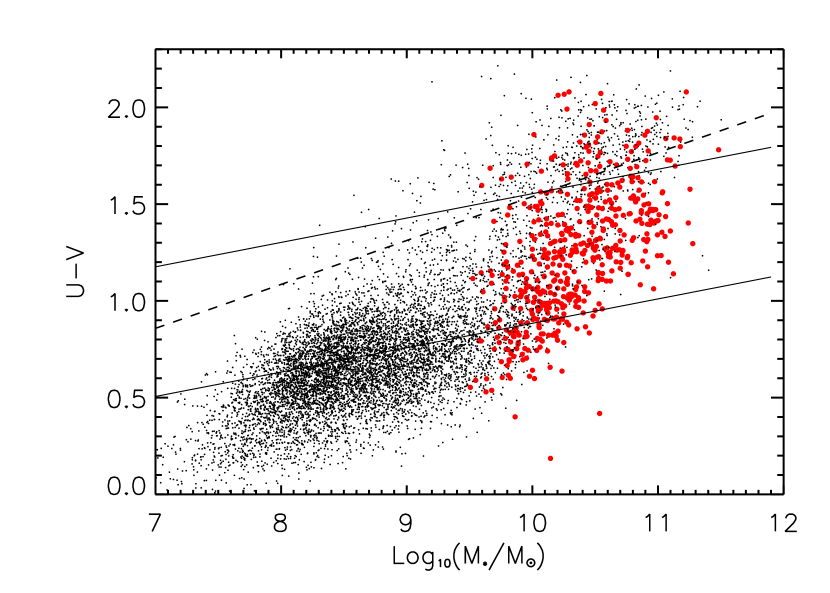
Multi-wavelength photometry is required for this project. We need photometry in all four IRAC bands as well as MIPS 24 µm for the SED fitting and classification. The three fields have deep Spitzer/IRAC and MIPS coverage, and every 16 µm object was detected in all four IRAC bands and in the MIPS 24 µm band. There are also rich HST and ground-based visible/NIR data available in these fields (Huang et al., 2013; Fang et al., 2018). We utilized the derived stellar mass and SFR from CANDELS (Fang et al., 2018) when available. For EGS galaxies outside the CANDELS area, and SFR came from Huang et al. (2013). (See §4.3 for more on the mass determination.) Figure 2 shows that most galaxies in this sample have rest colors bluer than the red sequence but at or near the red edge of the blue cloud, i.e., they are in the “green valley.” The stellar masses for this sample are in the range of with a mean of .
All three fields have deep MIPS 70 µm333The FIDEL legacy survey is described at https://irsa.ipac.caltech.edu/data/SPITZER/FIDEL/. and Herschel/PACS and SPIRE data. The GOODS fields have limiting flux densities of 2.5 mJy at 70 µm, 1–3 mJy in the PACS bands, and 10 mJy in the SPIRE bands. Those sufficed to detect 70–80% of the sample in at least one Herschel band (Elbaz et al., 2011). The EGS field has limiting flux densities of 2.5 mJy at 70 µm, 10 mJy in the PACS bands, and 14–16 mJy in the SPIRE bands. With this shallower Herschel coverage, only 40% of the sample was detected (Lutz et al., 2011; Oliver et al., 2012). We calculated 444In this paper, means luminosity integrated between 8 and 1000 µm. for the sample with two methods (Elbaz et al., 2011): (A) convert 24 µm flux densities based on the best-fit template from Chary & Elbaz (2001) to give , and (B) integrate the SED given by Herschel and MIPS 70 µm flux densities to give . Because every object in the sample was 24 µm-detected, we were able to estimate for all objects in the sample, but only objects with FIR photometry in at least 2 bands permit estimates of . For our sample, are generally consistent with with scatter 0.18 dex.
The different sample-selection depths in EGS and GOODS yield slightly different demographics in luminosity classes. In the two GOODS fields, 72% of objects are LIRGs, and only 2% are ULIRGs. In the shallower EGS, 85% are LIRGs, and 6% are ULIRGs. Altogether our sample is more than 70% LIRGs, a dominant population for the star formation rate density (SFRD) at (Le Floc’h et al., 2005).
AGN emission can make a significant contribution to galaxy SEDs in the MIR, and therefore it is important to measure the AGN contribution. In principle, almost all massive galaxies harbor an AGN of different stages. X-ray data can identify at least some AGNs, and deep X-ray surveys from Chandra already exist in our three fields. Depths are 800 ks in the EGS (Nandra et al., 2015), 2 Ms in GOODS-N (Xue et al., 2016), and 7 Ms in GOODS-S (Luo et al., 2017). These depths detected 24 Chandra X-ray sources in the EGS, 59 in GOODS-N, and 46 in GOODS-S. Only 10 sources in the EGS and GOODS-N are identified as quasars with erg s-1. Because of the deep Chandra exposure in GOODS-S, most X-ray sources in this field have erg s-1. Only three have erg s-1, and none has erg s-1. These are consistent with expectations from the other fields, given the small area of GOODS-S (Table LABEL:tab:sample). Hickox et al. (2011) found that obscured AGNs selected from IRAC colors (Lacy et al., 2004; Stern et al., 2005) were equal in number to X-ray-selected AGNs. Regardless of selection method, all their AGNs had a clear visible–MIR color segregation from non-AGN galaxies.
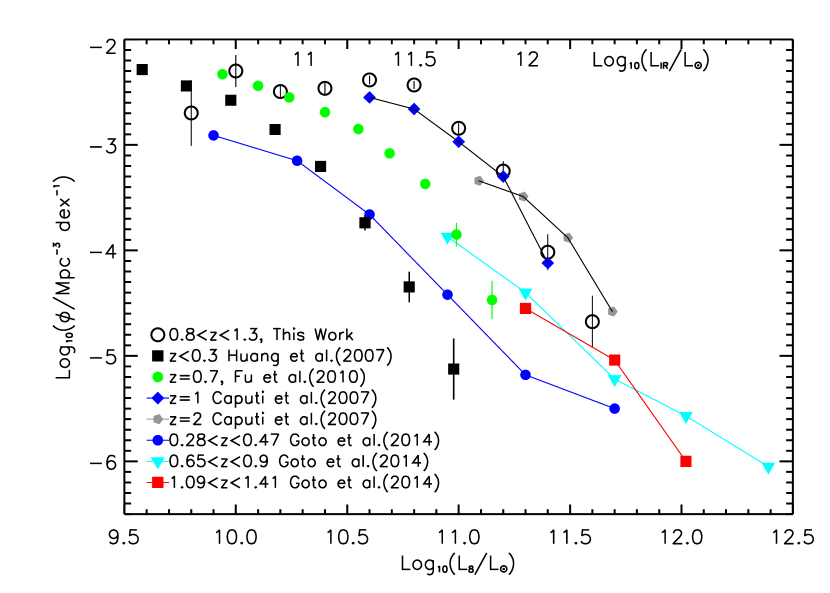
Figure 3 shows the rest-frame 8 µm luminosity functions for galaxies in our sample. The K-correction for was derived using the best-fit SED template for each galaxy as described in Section 3.1. We derived the luminosity function in the range using the method. There are a few existing 8 µm luminosity functions at various redshifts derived using the MIR photometry from either Akari or Spitzer surveys (Caputi et al., 2007; Huang et al., 2007; Fu et al., 2010; Goto et al., 2015). We expect a strong evolution of the 8 µm luminosity function from to because of the cosmic SFRD evolution (e.g., Madau & Dickinson, 2014) and the number evolution of LIRGs (e.g., Le Floc’h et al., 2005; Goto et al., 2015). Compared to the local 8 µm luminosity function, the luminosity function at is either 10 times brighter or 10 times higher in number density or a mix of both. This is consistent with the cosmic SFRD decrease since .
Our sample’s total area coverage is only 694 arcmin2, and most galaxies in the sample have (Figure 2). This combination means the derived luminosity function will be subject to cosmic variance. This is especially the case for the GOODS-S field, which is roughly the size of the Ultra-Deep Field (UDF). According to Moster et al. (2011), cosmic variances are 34%, 25%, and 17% for galaxies in this mass range in UDF, GOODS-N, and EGS respectively. The ICRAR cosmology calculator,555https://cosmocalc.icrar.org/ based on the work of Driver & Robotham (2010) for local galaxies, gives 25%, 23%, and 18% variance in areas equal to those of GOODS-S, GOODS-N, and EGS, respectively. In the three fields combined, the cosmic variance for this sample should be 20%.
3 MIR SEDs of Star-Forming Galaxies and AGNs
3.1 Classifying the MIR template set
Most galaxy MIR spectroscopic studies have been for local galaxies. MIR spectral features from bright galaxies were first observed using ground-based telescopes. (Moorwood 1986 and Roche et al. 1991 gave useful summaries of early work.) Spectra of star-forming galaxies show strong PAH emission features at 3.3, 6.2, 7.7, 8.6, and 11.3 µm. In contrast, AGNs show strong continuum emission in this wavelength range and often show broad silicate absorption from 8 to 13 µm. With its launch in 1995, the Infrared Space Observatory (ISO) made MIR spectroscopy possible for samples of IR-luminous galaxies (Genzel et al., 1998; Rigopoulou et al., 1999). Starting in 2003, Spitzer/IRS spectroscopy provided even better sensitivity than ISO, allowing spectroscopic observations of extragalactic sources with luminosities ranging from local dwarf galaxies to ULIRGs/HyperLIRGs (ultra- and hyper-luminous infrared galaxies) at (Brandl et al., 2006; Spoon et al., 2007). Even now, though, spectra of distant galaxies are limited in number.
There are a few sets of broadband galaxy SED template sets with wavelength coverage extending from the ultraviolet (UV) to 30 µm (e.g., Polletta et al., 2007; Assef et al., 2008, 2010; Brown et al., 2014). We chose the set from Brown et al. (2014), consisting of an atlas of 129 local-galaxy SED templates based on spectral and photometric data observed with grand-based telescopes, Spitzer/IRS, and Akari/IRC. Templates include a wide range of SED and morphological types representative of the local population, and they have based on IRAS and Herschel FIR photometry (Dale et al., 2012, 2017).
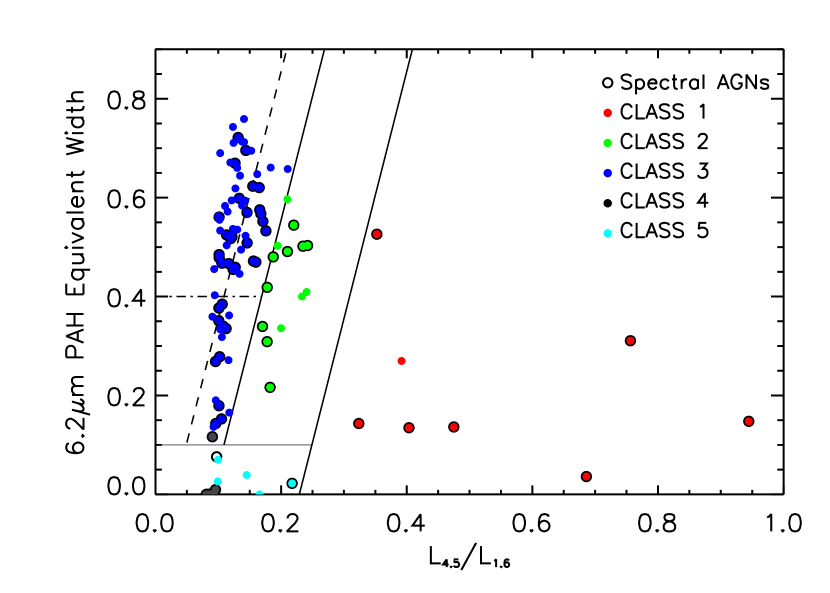
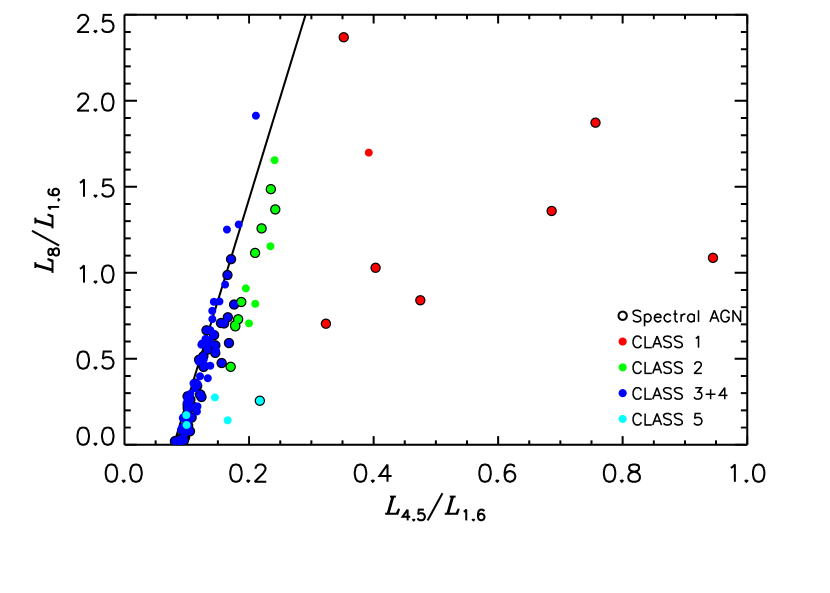
For this work, we divided the Brown et al. (2014) templates into five distinct Classes666We use “Class” instead of “Type” to avoid confusion with the well defined Type 1 and 2 AGNs. characterized by their predominant energy sources: star formation, starlight, and AGNs. In order to avoid effects of dust obscuration, Classes were based only on rest-frame µm. In this wavelength range, PAH emission bands are the predominant spectral features. The 6.2 µm PAH equivalent width (EW) is a good indicator of AGN strength (Alonso-Herrero et al., 2012) with mean 6.2 µm for strong AGN, for composite galaxies, and for galaxies with H II spectral types. An additional classification parameter is needed because the Brown et al. template set contains galaxies with a much wider luminosity range and more diverse spectral types than does the Alonso-Herrero et al. (2012) LIRG sample. We used the color, as shown in Figure 4, to characterize the SED shapes. A galaxy’s 4.5 µm emission may come from three components: stellar photospheres, star formation regions, and AGN. Huang et al. (2007) found that when star formation activity contributes to the MIR continuum, it is correlated with PAH emission. Figure 4 shows typical elliptical galaxies have . Galaxies with 6.2 µm PAH tend to have higher as star formation begins to contribute. Galaxies with high and low 6.2 µm PAH EW harbor AGNs. A linear relation (fit with iterative -clipping to points above ) gives
| (1) |
Figure 4 shows how the template Classes are defined. Star-forming galaxy templates have µm and within 3 of the corresponding value from Equation 1. AGN templates have more than 10 greater than the Equation 1 value. Templates with offsets between 3 and 10 and are defined as composite. About one-third of all templates are from spectroscopically identified AGN hosts, but some of these show almost no MIR spectral signature of an AGN. This happens when the AGN luminosity is relatively small compared to the star-formation luminosity. Templates with no PAH emission features come from galaxies visually classified as either elliptical or blue compact or Wolf-Rayet type. Table LABEL:tab:criteria specifies the color–EW boundaries of our five Classes.
The templates in each Class resemble each other and differ from templates in other Classes as shown in Figures 5–9. Class 1 templates represent AGNs and Class 2 templates represent composite galaxies. Star-forming templates (Class 3) have strong PAH emission features. Quiescent templates (Class 4) have nearly Rayleigh-Jeans SEDs typical of starlight. Class 5 templates show a dust continuum starting to rise at 5–6 µm with little PAH emission. These nine templates (Figure 9) have a strong [S IV] emission line at 10.5 µm. The local galaxies in Class 5 are either young, blue, and compact or Wolf-Rayet galaxies (Wu et al., 2008), consistent with the strong [S IV] line (Inami et al., 2013).
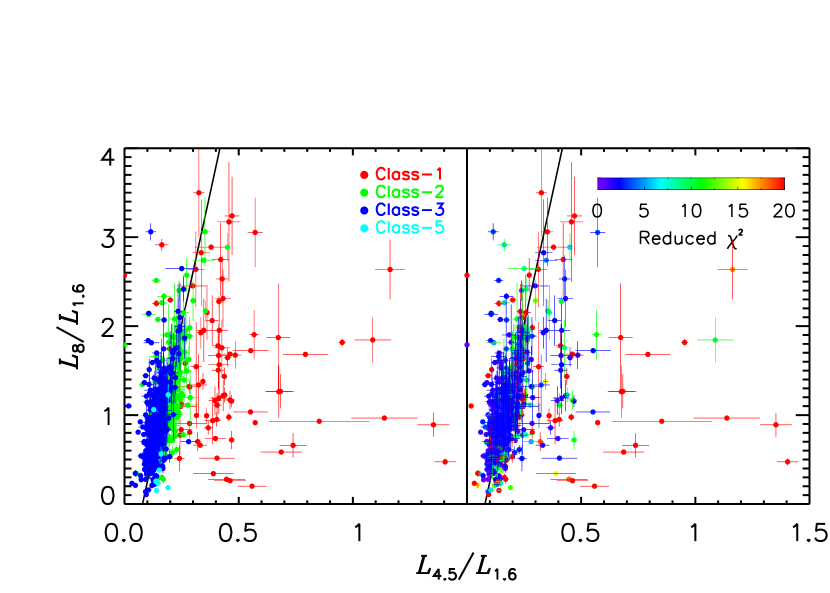
When spectral information is not available, a color–color diagram can be used to classify galaxies though with some uncertainty as shown in Figure 10. Galaxies with significant star formation (Class 3) have a strong correlation between and :
| (2) |
indicating that dust emission associated with star formation produces the MIR continuum (Huang et al., 2007). Strong AGN (Class 1) templates have SEDs resembling a power law with 4.5 µm emission not much less than that at 8 µm. Composite (Class 2) templates resemble Class 3 but have slightly more 4.5 µm emission than the corresponding star-forming templates as a result of the AGN contribution.
3.2 SED Fitting with the Local-Galaxy Template Set
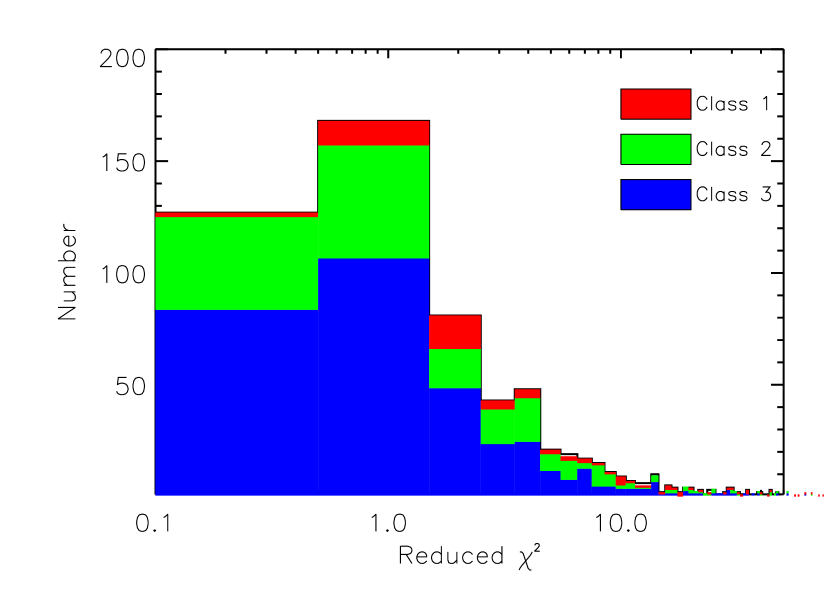
We fit SEDs only in the observed MIR wavelength range µm. At , this corresponds to rest-frame µm, where a galaxy SED has PAH emission and silicate absorption features and is little affected by dust extinction. In order to calculate of the fits, we recalculated photometric uncertainties by putting artificial objects into the published images and measuring the photometric errors. EGS has shallower IRAC and 16µm depth than the GOODS fields and yields larger uncertainties. Our SED fitting gave reduced for 447 galaxies in the sample, and only 21 have (Figure 11). Table LABEL:tab:SED_fitting gives the best-fit template Class distribution for each field. No sources in the entire sample were fit by Class 4 (quiescent galaxy) templates. Detecting a pure-starlight passive galaxy at 16 µm, even in the deep GOODS fields, would require M☉. Such massive galaxies are rare, and failing to detect even one in the area surveyed is no surprise.
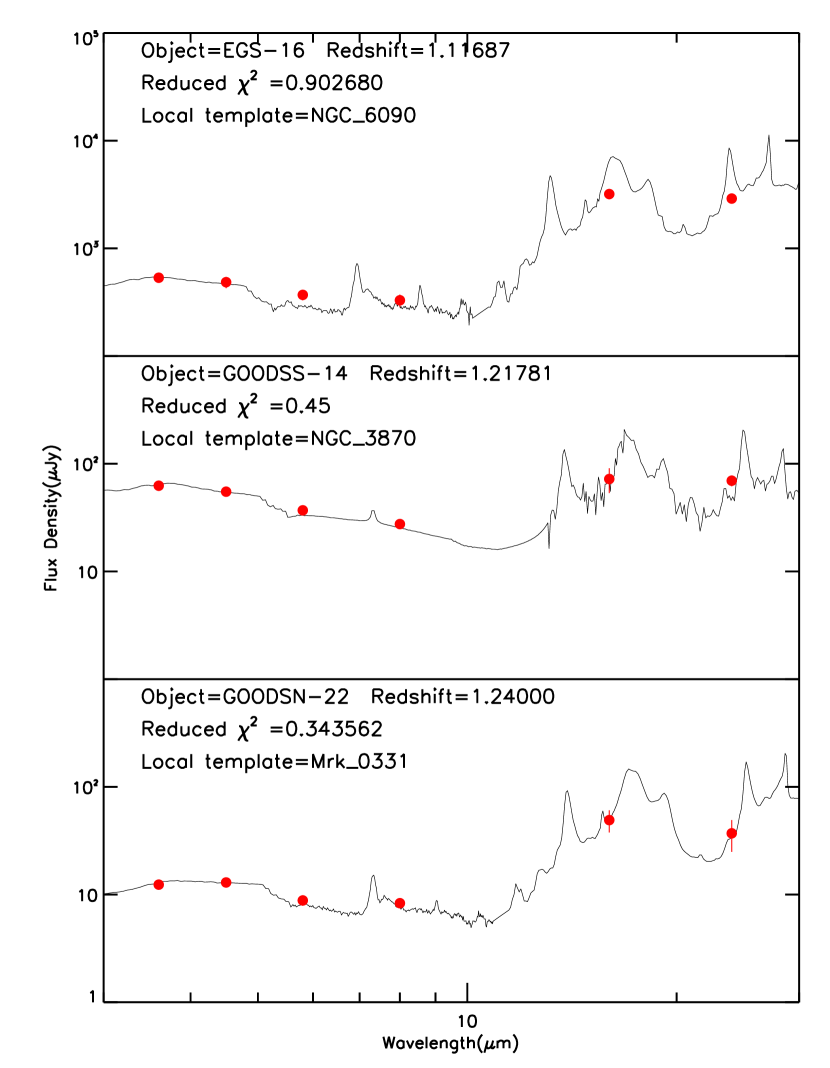
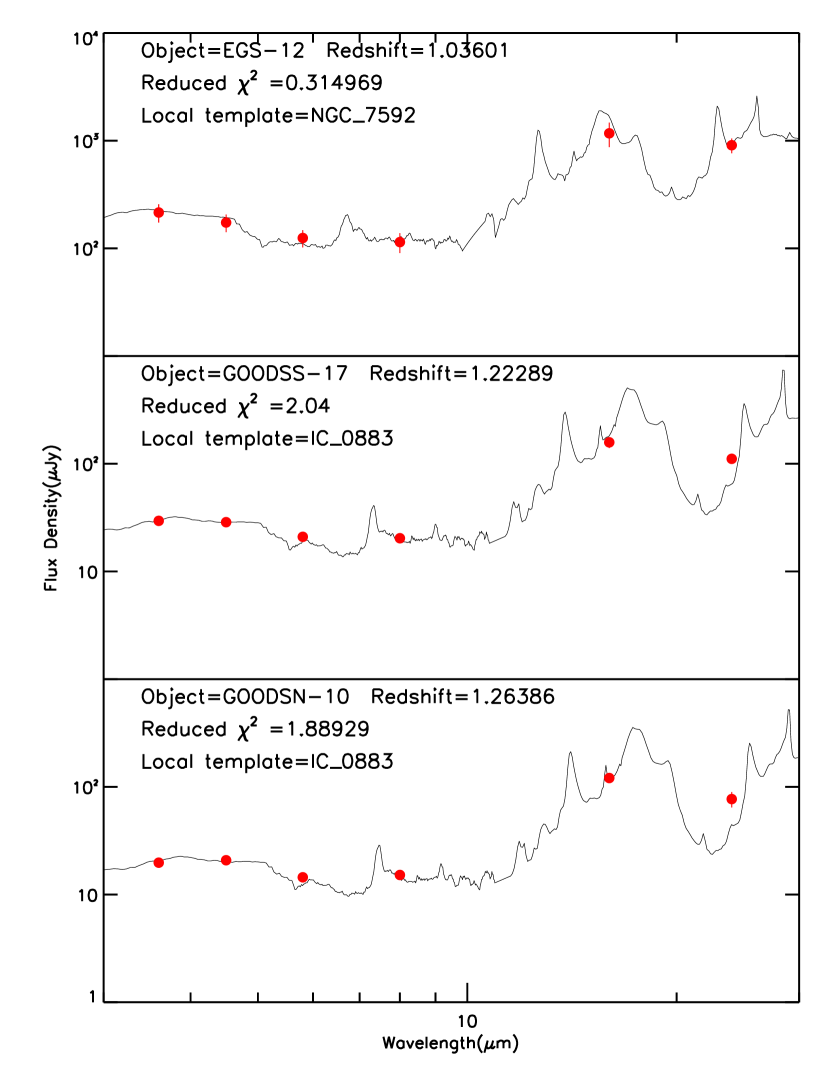
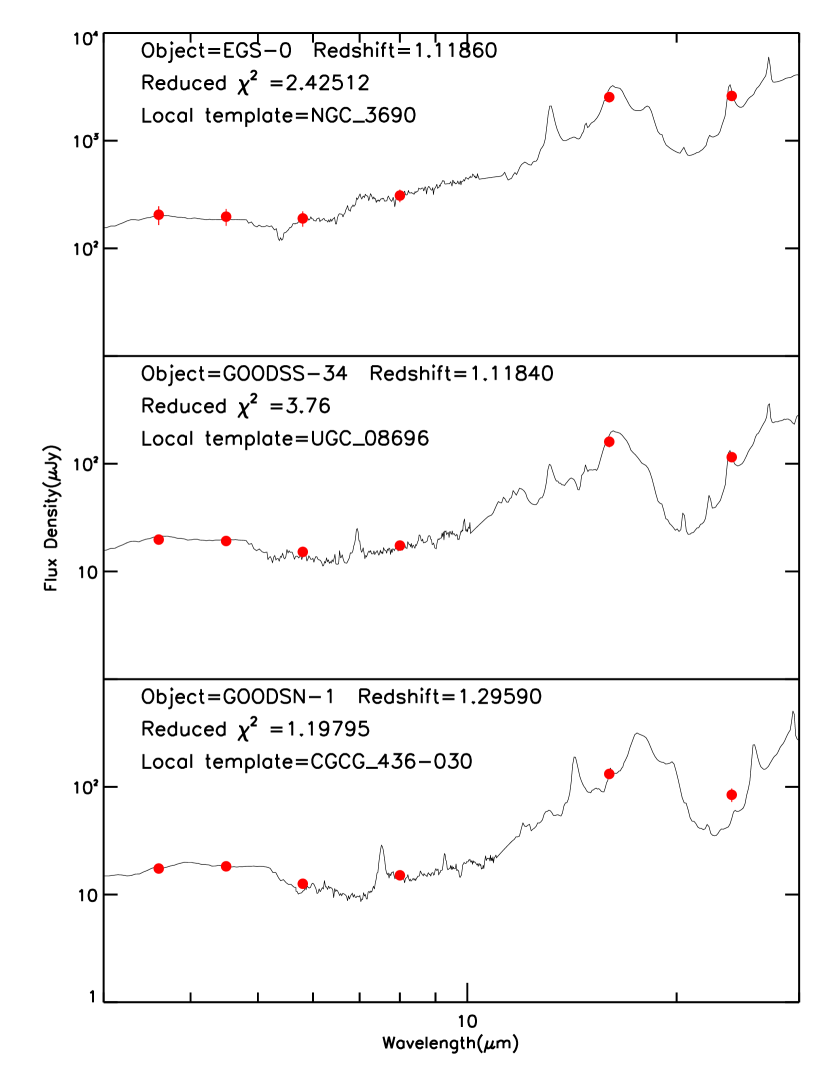
The best fits are for star-forming galaxies, as shown by the lower values in Figure 11. The Class 3 template set covers a wide range of colors and PAH EWs as shown in Figures 4 and 10, and therefore it is not surprising that a good template can nearly always be found. Figures 13 and 14 show examples of good fits with Class 3 templates.
Fitting SEDs for galaxies with Class 1 (AGN) templates yields slightly higher reduced than for star-forming galaxies. Examples are shown in Figure 15. While AGN variability could be a factor at the 0.1 mag level (Kozlowski et al., 2016), two related factors likely contribute more to the higher . One is that our AGNs are much more luminous than local ones and may not be represented in the local templates. The other is that there are only nine Class 1 templates in the set, and these may not represent the full range of AGN SEDs even among local galaxies. A further contributing factor is that the AGN galaxies generally have high signal-to-noise ratios, and therefore even minor deviations from the templates will give large . Figure 10 shows the wide range of color space the AGNs map out and the paucity of templates within that space. Figure 5 shows that the templates include not only a range of continuum slopes but also multiple absorption and emission features, e.g., water absorption at 3.1 µm, PAH emission at 3.3 µm, and the bare carbon absorption feature at 3.4 µm (Imanishi et al., 2001). Nine templates are simply not enough to cover the full range of parameters. An example is shown in Figure 17, where the local UGC 5101 template includes lots of features but still deviates from the observed GOODSN-54 SED.
With only six photometry points for each object used in template fitting, multiple templates might fit an observed SED within the uncertainties. To evaluate such degeneracies, we compared the best and the second-best templates for each galaxy. We defined a limit as , where are the reduced for the best and second-best templates, respectively. There are 262 galaxies within this limit. In 170 of them, both templates belong to the same Class. For 86 objects, the two templates belong to adjacent Classes, either Class 1 and Class 2 or Class 2 and Class 3. Only six objects have one of the two best-fit templates from Class 1 and the other from Class 3. All of these six are in the EGS field, where larger photometric errors may contribute. In summary, most cases of degenerate template-fitting results are due to the similarities between the templates as shown in Figures 4 and 10, and the majority of our sample have a clear SED identifications.
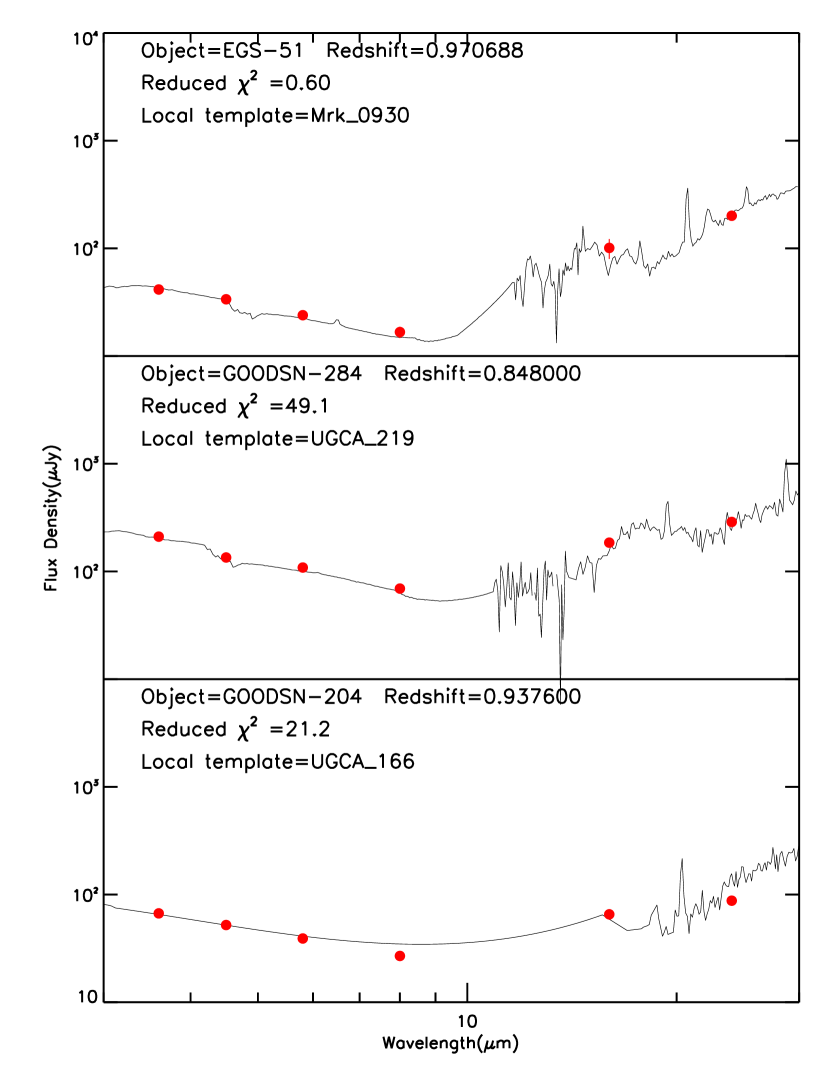
The fitting procedure identified nine objects in the sample with weak or absent 8 µm PAH in their SEDs but red continua near that wavelength. The best fits to these objects are SEDs of UGCA 166, UGCA 219, UGCA 410, and Mrk 930. These Class 5 templates show no or extremely weak PAH features (Wu et al., 2008), but unlike normal AGNs whose strong continuum emission starts around 3 µm, their hot dust emission starts around rest-frame 6 µm (Figure 16). Local galaxies with this MIR SED are typically Wolf-Rayet or blue compact galaxies with M☉. The lack of PAH emission is a result of either low metallicity (Engelbracht et al., 2005; Shao et al., 2020) or vigorous star formation with intense UV radiation destroying PAH molecules. The existence of OB stars and intense UV radiation in local galaxies of this type is supported by the detection of the [S IV] 10.54 µm and He II 4686 Å lines in their spectra. Ionization potentials are 35 eV and 25 eV respectively, demanding the presence of hard UV photons to produce the lines. Recent Herschel and ALMA observations of blue compact galaxies UGCA 166 and SBS 0335052 found FIR SED peaks between 20 and 60 µm (Hunt et al., 2014), indicating high dust temperatures in these systems. This is consistent with a strong UV radiation from compact star-formation regions. Previous studies concluded that these two galaxies are very young with M☉ (Houck et al., 2004; Wu et al., 2008; Hunt et al., 2014). However, the nine objects in our sample fitting Class 5 templates have M☉. They are therefore unlikely to have low metallicity or be in the early stages of star formation. The galaxies show no strong X-ray emission or excess continuum emission at rest-frame 4.5 µm, making AGN an unlikely cause for the absence of PAH. Further study of this population is needed.
3.3 AGNs in the 16 µm-Selected Sample
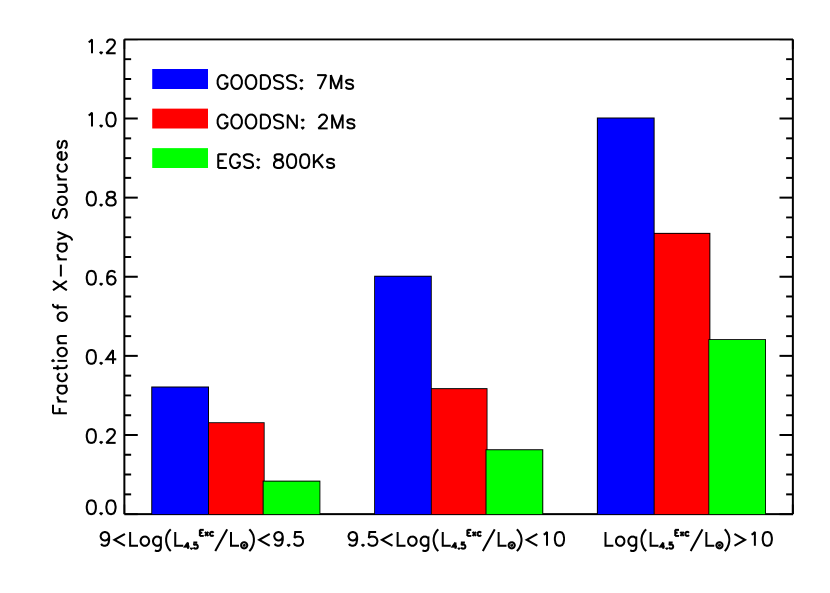
Our SED results identify that about 15% galaxies in the sample are best fit by local AGN templates, and another 32% have composite SEDs with both AGN and star-formation contributions. Confirmation of AGNs through spectroscopy is challenging, and we therefore resorted to X-ray observations (Nandra et al., 2015; Xue et al., 2016; Luo et al., 2017) for AGN confirmations. About 18% of the whole 16 µm sample are X-ray detected. Table LABEL:tab:X-sample gives the X-ray depth of each field and the percentages of X-ray detections for each field in each Class. In all fields, Class 1 sources were detected at a much higher rate than other Classes, consistent with the AGN classification. However, even with the 7 Ms depth in GOODS-S, fewer than half the presumed AGNs were X-ray detected.
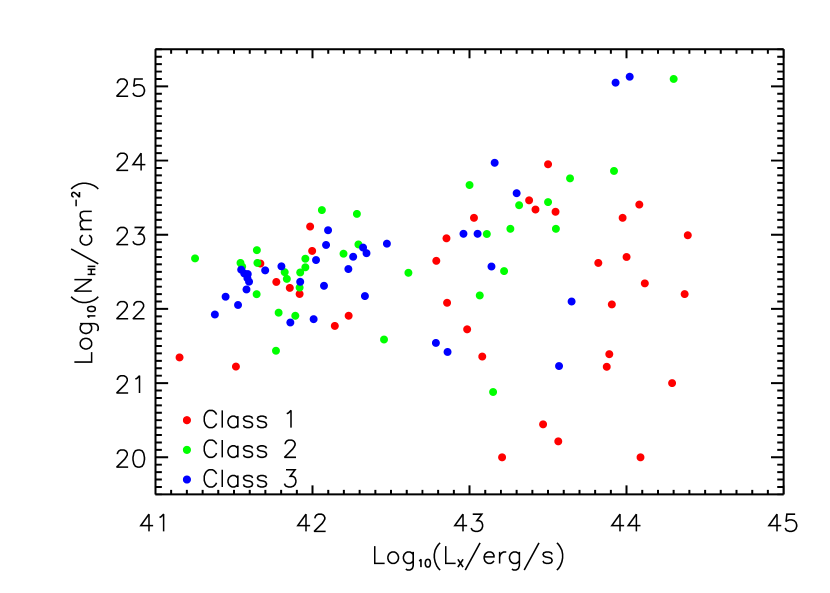
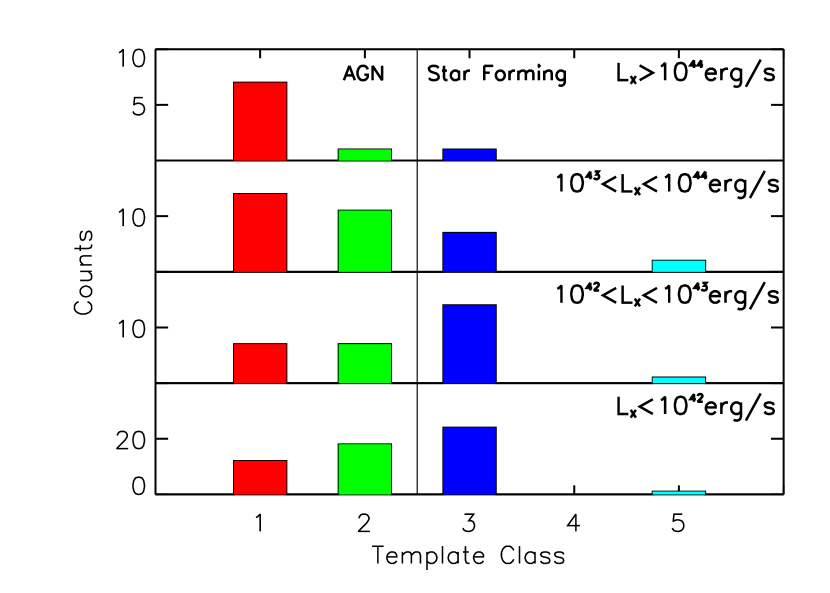
Nandra et al. (2015); Xue et al. (2016); Luo et al. (2017) derived physical properties from the X-ray SEDs including X-ray luminosities and obscuration expressed as gas column density . Figure 18 shows that about 70% of the X-ray AGNs in this sample have cm-2, which corresponds to visual extinction mag (Valencic & Smith, 2015), i.e., a dusty AGN. Three X-ray sources have cm-2, qualifying them as Compton-thick. They have apparent erg s-1, in the classical AGN range, but none of these three objects has a Class 1 SED, and two are Class 3. With such large extinction, the true X-ray luminosity is uncertain and may be lower than estimated. A more important factor may be the extinction, which corresponds to mag and mag (Hensley & Draine, 2020). Figure 18 shows other, less extreme examples of X-ray-luminous objects with Class 3 SEDs. While the extinction amounts are uncertain, AGNs can be so well hidden that MIR SEDs reveal no trace of them. Figure 19 shows the distribution of SED Classes for four ranges of X-ray luminosity. Almost all X-ray sources with erg s-1, i.e., the X-ray QSOs, have Class 1 SEDs. In contrast, most X-ray sources with ergs have a Class 3 SED, indicating that they are predominantly star-forming galaxies. X-ray sources with intermediate luminosity show a range of Classes including many composites. Overall the percentage of objects with Class 1 SEDs increases with X-ray luminosity, showing a good correlation between the X-ray luminosity and MIR SED Class.
Our SED fitting also yields accurate measurement of MIR luminosities characterizing both star formation and AGN. Several studies showed a correlation between AGNs’ MIR and X-ray luminosities (e.g., Carleton et al., 1987; Lutz et al., 2004; Lanzuisi et al., 2009; Fiore et al., 2009; Stern, 2015; Suh et al., 2019). This correlation was found for AGNs with erg s-1, which have strong MIR continuum emission (Stern, 2015; Dai et al., 2018), and is the same for Type 1 (broad-line) and Type 2 (narrow line) AGNs (Suh et al., 2019). Luminosity at rest-frame 6 µm, was often used to represent the MIR luminosity in these previous studies. Most of the X-ray sources in our sample also have PAH emission in the MIR bands. This is consistent with many Class 1 templates (Figure 5) and all the Class 2s and 3s (Figures 6, 7) and is probably a result of the 16 µm sample selection favoring sources having 7.7 µm emission features. PAH emission being present means that could be contaminated by the 6.2 µm feature. We therefore used rest-frame 4.5 µm luminosity as a MIR measure of AGN accretion power. and were directly derived from each object’s SED. These luminosities come from both star formation and AGN. As explained in the Appendix, the excess luminosity at 4.5 µm, attributed to an AGN, is
| (3) |
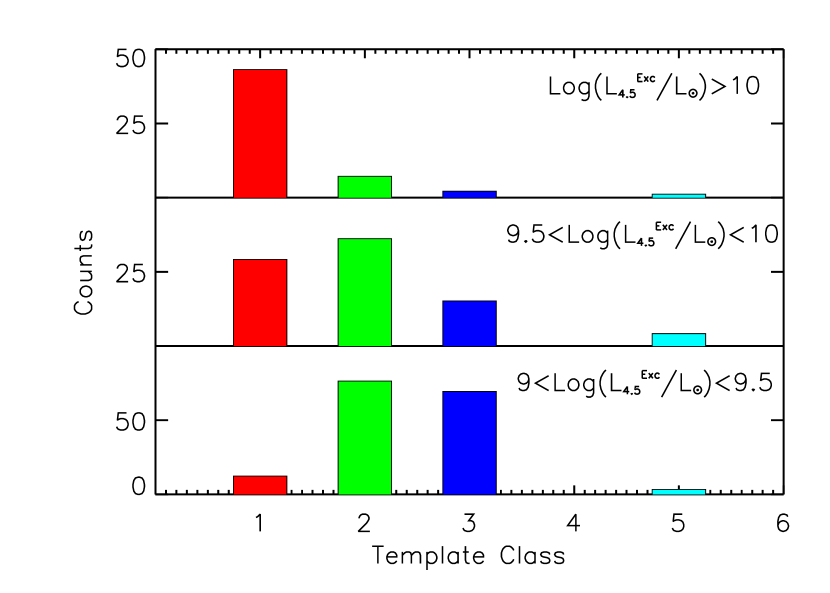
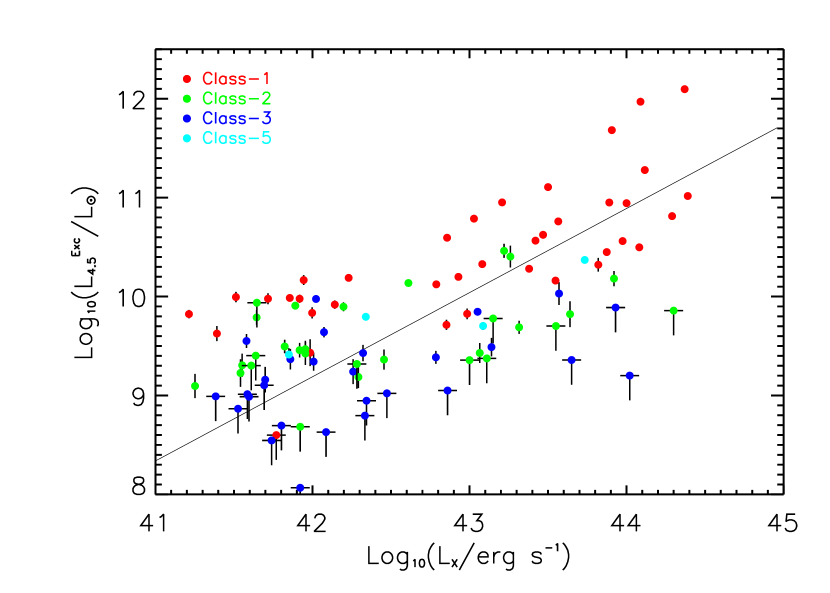
where . Objects with are those with a significant excess. (Flux density uncertainties at both 8 and 16 µm contribute to , the uncertainty of .) It is not surprising that most -excess objects have an SED best fit by Class 1 templates, as shown in Figure 20. There is a good correlation between and for X-ray sources in our sample, as shown in Figure 21. The best fit is
| (4) |
X-ray sources at erg s-1 could be powered purely by star formation, but a few of these have high and Class 1 SEDs, indicating their AGN nature. These may be X-ray-obscured. The correlation between and suggests that the excess MIR luminosity is a signature of the active nucleus and can be used as a measure of AGN luminosity.
There are many galaxies in the sample with strong but no X-ray detection. The 3 and 5 limits are roughly at and 10. According to Equation 4, the two limits roughly correspond to and erg s-1, respectively. AGN at these X-ray luminosities should have been detected by Chandra, but only half of them were. This is consistent with at least half of all AGN being obscured in X-rays (Gilli, Comastri, & Hasinger, 2007; Hickox & Alexander, 2018; Lambrides et al., 2020). We did not find any significant difference between the MIR-excess-selected objects with and without X-ray detection, but as shown in Figure 22, the percentage of X-ray-detected sources increases with exposure time and with luminosity . This trend suggests that the MIR-excess targets without X-ray detections are X-ray-obscured, at least in the GOODS fields. (In the EGS, the relatively shallow X-ray depth may also play a role.) Selecting on the basis of MIR excess gives 140 objects. Of these, 63 have a Class 1 SED, 45 have a Class 2 SED, and 32 have a Class 3 SED. In the first category, all the Class 1 templates have a MIR excess, but with the available , the simple calculation finds only about 60% of the individual objects fitting the AGN templates. The 32 Class 3 objects with detectable MIR excess are 9% of all Class 3 objects. Even though their MIR emission is powered mainly by star formation, these objects show a detectable amount of AGN emission. There might be another 4% or so that would show an excess if higher observations were available. The overall number of AGNs found by MIR excess is about double the number of erg s-1 AGNs in this sample (Table LABEL:tab:X-sample). The combination of MIR and X-ray selection yields a more complete AGN sample than X-ray selection alone, as has been found before (Hickox et al., 2011).
4 Star Formation in the 16 µm-Selected Galaxies
4.1 SFR Estimators from the UV to FIR
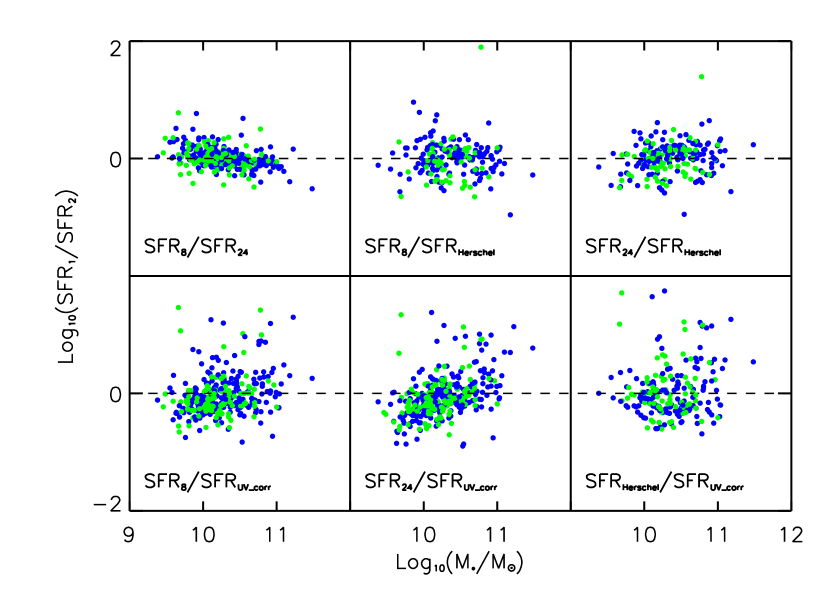
One goal of this project is to compare various SFR estimators for galaxies. Our sample has luminosities available in the UV, MIR, and FIR, all of which can be used to estimate SFR. For this work, SFRUV was calculated from UV–visible SED modeling of CANDELS data (Grogin et al., 2011), including dust correction (Fang et al., 2018). SFR was based on (rest frame as derived from the 16 µm photometry) converted to SFR according to the Elbaz et al. (2011) conversion. SFR24 was calculated using the observed 24 µm flux density and an appropriate template (Chary & Elbaz, 2001). SFRFIR was based on from Herschel FIR SEDs. We excluded galaxies with significant to avoid confusion by AGN contamination. Fang et al. (2018) found SFRUV and SFR24 to be consistent for galaxies. Figure 23 shows that all SFR estimates yield consistent results on average, but SFRUV,corr shows considerably more scatter with the other three indicators than any of them shows with another. There is a slight trend for SFR24 to be lower than the other SFRs at the lowest masses. Some galaxies have very low SFRUV, probably because the modeling underestimated dust extinction. Though there are arguments that PAH emission may vary when tracing SFRs due to metallicity difference (Shao et al., 2020) or heating from evolved stars (Crocker et al., 2013), the correlation between SFR and PAH luminosity has held up albeit with scatter (Treyer et al., 2010) or some systematics at low and high luminosity (Mahajan et al., 2019). Elbaz et al. (2011) found SFR to be better than SFR24 at . Our results show that is a good SFR estimator for this LIRG sample at , indicating that the PAH emission is associated with star-forming regions in these LIRGs.
4.2 Star Formation in AGNs
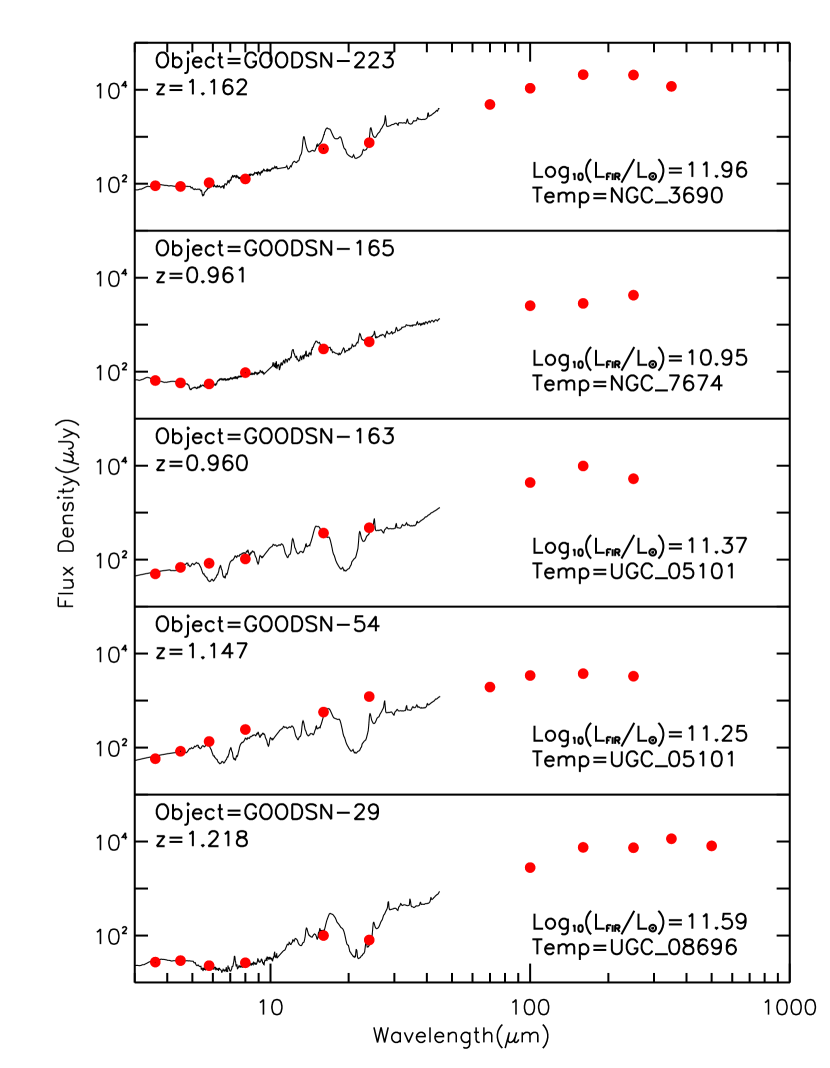
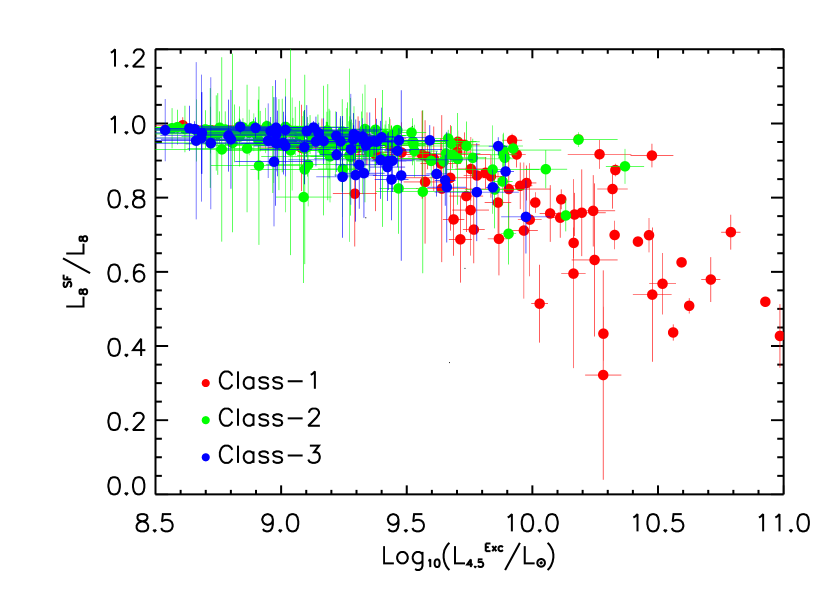
As shown above, AGNs tend to produce MIR emission, which will cause overestimated SFR if not excluded. The appendix shows how to solve a set of linear equations to separate the components into and . For most galaxies, the AGN correction from to and the star-formation correction from to are modest. Figure 24 shows that for most objects, an AGN contributes at most 10–20% of . However, for L☉, will overestimate SFR for a significant fraction of galaxies, nearly all of them having Class 1 SEDs. In the whole sample, 20 galaxies have , and a few have consistent with zero. For these objects, neither nor is a good SFR estimator. The FIR luminosity, , being less affected by the AGN emission (Dai et al., 2018), should however still be a valid SFR measure. All but six of the 20 galaxies have enough FIR detections to give SFR. Figure 17 shows SEDs for five examples with at least three Herschel detections. Their qualifies them as LIRGs. The overall picture confirms the correlation between and SFR for all galaxies (Elbaz et al., 2011), including AGNs at . Our study refines the SFR estimates and allows studying the relation between star formation and AGN (§4.3).
4.3 Co-Evolution of Galaxies and Central SMBHs
Galaxy mass assembly is correlated with central SMBH growth. This is supported by the observed correlation between the galaxy-bulge stellar mass and central SMBH mass (e.g., Magorrian et al., 1998; Kormendy & Ho, 2013). This co-evolution scenario implies correlation between SFR and the SMBH’s accretion rate as calculated from (e.g., Netzer, 2009; Rosario et al., 2013; Dai et al., 2018; Yang et al., 2019). Several studies found that AGNs, especially with erg s-1, show a good correlation between SFR and (e.g., Lutz et al., 2010; Rosario et al., 2012; Chen et al., 2013, 2015; Hickox et al., 2014; Azadi et al., 2015; Xu et al., 2015; Dai et al., 2018; Yang et al., 2019).
Practical estimates of the stellar mass for AGNs can be complicated. A strong AGN has significant emission in both the visible and NIR bands, and this emission must be subtracted when estimating host-galaxy stellar mass. Stellar masses for galaxies in the CANDELS fields were derived using SEDs (Mobasher et al., 2015). This method in principle fits and subtracts the AGN contribution but with some uncertainty. Most X-ray AGNs in this sample have large H I column densities, suggesting they are dust-obscured in visible light. According to Silva et al. (2004); Aird et al. (2018), an AGN with cm-2 has a negligible contribution to its host SED in the visible bands. MIR-selected AGNs without X-ray detection are also likely to be dusty. The sample has only two AGNs with ergs and cm-2. Yet their stellar masses are already on the lower end, at and 10.45 M☉, respectively. It therefore seems unlikely that AGNs are causing large overestimates in stellar mass. Mobasher et al. (2015) estimated the uncertainties in their masses to be 0.16 dex, but uncertainties for strong AGNs will be larger.
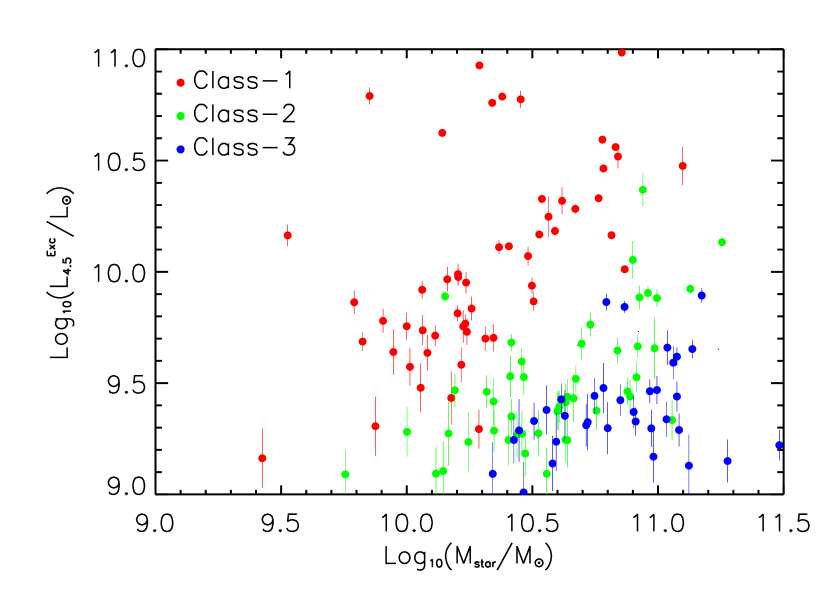
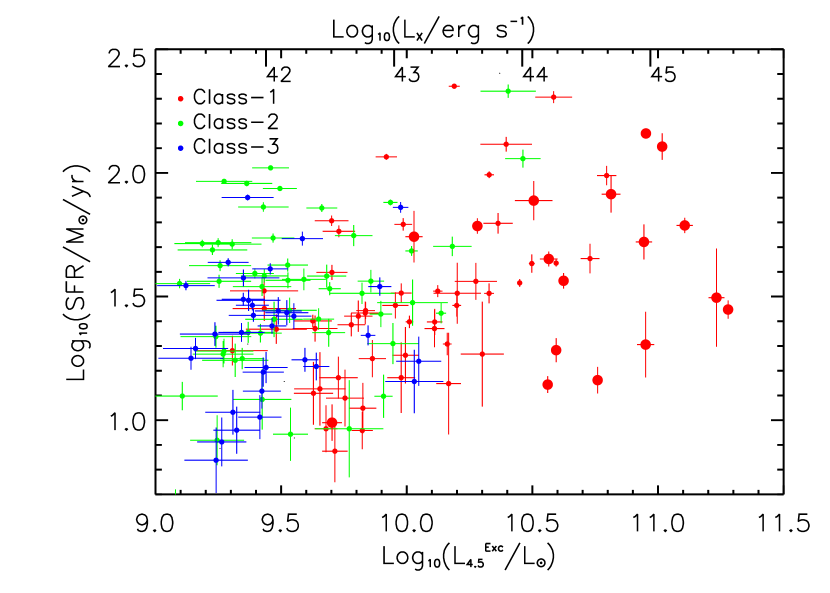
Figure 25 shows that the AGN luminosity, , is not correlated with host galaxy stellar mass. (For this study, we have used instead of as a proxy for AGN luminosity.) The Class 1 subsample (AGNs) has the lowest average stellar mass ( standard deviation), and objects with Class 3 SEDs (star forming galaxies) have the highest average stellar mass (). Values for Class 2 are intermediate .
Figure 26 shows a positive but weak correlation between and SFR for objects with Class 1 SEDs (Spearman rank coefficient ). Previous studies in this AGN luminosity range (Chen et al., 2013; Rosario et al., 2013; Hickox et al., 2014; Azadi et al., 2015; Chen et al., 2015; Xu et al., 2015; Dai et al., 2018) yielded a wide range of relations between AGN luminosity and SFR from almost linear to none. At a given , objects with a Class 2 SED have a higher SFR than objects with a Class 1 SED. This is consistent with the definition of a Class 2 SED as a composite one, consisting of both strong star formation and AGN features. There are 32 objects with significant and a Class 3 SED, but most are weak AGNs with L☉ and erg s-1.
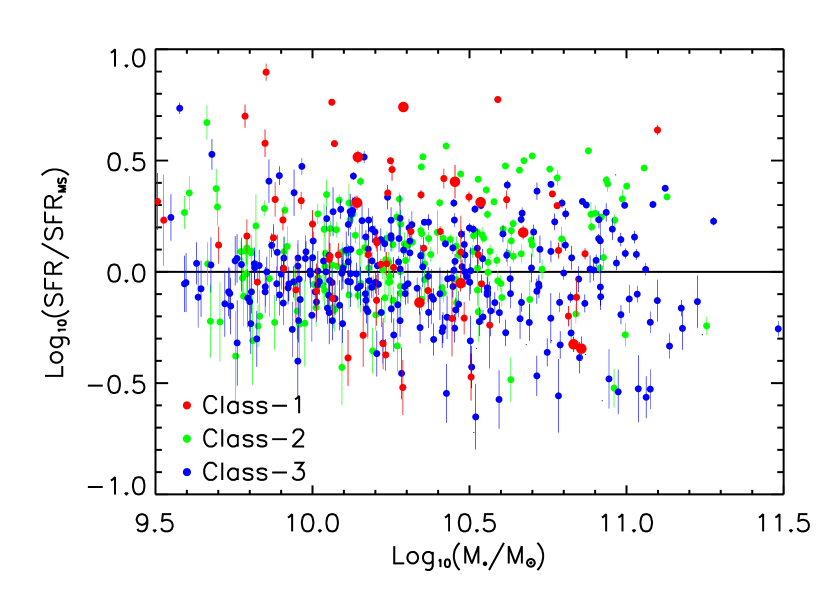
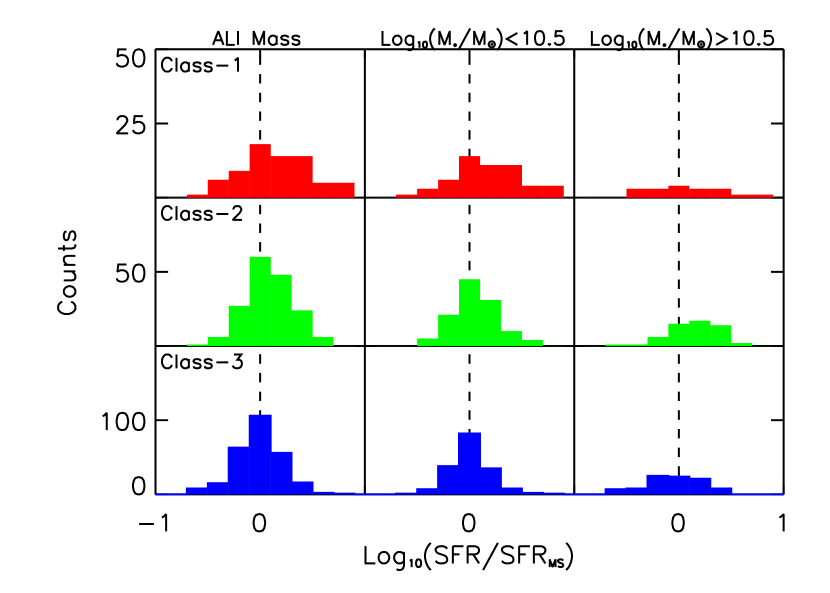
Most galaxies at have SFR correlated with their stellar mass; this is known as the main-sequence relation (Elbaz et al., 2011). When star formation is quenched, a galaxy drops off the main-sequence relation and becomes quiescent. Several models (e.g., Ishibashi & Fabian, 2012; Fabian, 2012; Alatalo et al., 2015; Man & Belli, 2018; Chen et al., 2020) propose that an AGN is involved in quenching the star formation. Figure 27 shows SFR relative to the main-sequence SFR at each galaxy’s redshift. Most galaxies scatter around the main sequence regardless of their SED Class. This is further demonstrated in Figure 28, which shows that most galaxies, including those with AGNs, have SFR on the main sequence. Indeed a majority of galaxies with M☉ and Class 1 or Class 2 SEDs have SFR above the main sequence despite all AGNs having a symmetric distribution around the main sequence. This is generally consistent with previous observations that X-ray-selected AGNs up to are on the main sequence (e.g., Mullaney et al., 2015; Aird et al., 2019; Bernhard et al., 2019; Suh et al., 2019). Our sample does not include a substantial AGN population below the main sequence as found by some (Shimizu et al., 2015; Bain, Sanders, McPartland, & Auge, 2020; Stemo et al., 2020) for local and for distant but AGNs. Presumably this is a result of our rest 8 µm sample selection. The SED Class of each AGN host in our sample is mainly controlled by AGN luminosity. Galaxies with higher AGN luminosities tend to fall into Class 1 because the AGN overwhelms star-formation signatures. The overall tendency of galaxies in all Classes to follow the main-sequence relation suggests that AGN luminosity and SFR change in tandem.
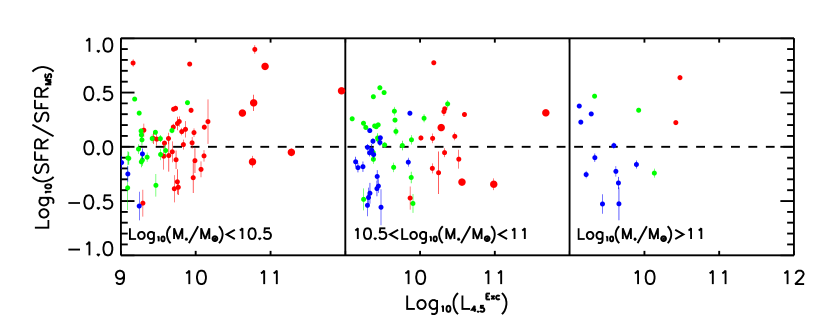
Galaxies in our sample show no reduction in SFR when an AGN is present, as one might expect in an AGN-quenching scenario (Fabian, 2012; Ishibashi & Fabian, 2012; Alatalo et al., 2015; Man & Belli, 2018). Figure 28 shows that galaxies with an AGN component show a similar SFR/SFRMS distribution to that of star-forming galaxies. Indeed an AGN component could exist in most galaxies in our sample, though it would be veiled in the ones with a higher SFR. On the other hand, galaxies with Class 1 SEDs, along with high-mass galaxies having Class 2 SEDs, tend to lie above the main sequence. This implies if anything enhanced star formation in AGN-dominated galaxies. To further test this, Figure 29 tracks how SFRs are affected by AGNs in each mass bin. Class 1 SEDs become rarer as stellar masses increases, consistent with increasing dominance of the star-formation component in massive galaxies. In addition, very few AGNs with have SFR below the main sequence value. This is particularly noticeable for AGNs in the bin. One interpretation of Figure 29 is that AGN luminosity decreases when its host galaxy evolves across the main sequence line. In the highest-mass bin, all AGNs have lower , and only three of them are above the main sequence. The implication on the distribution of AGNs along the main sequence is two-fold: (1) AGN accretion increases together with the star formation activity; (2) whatever quenches the star formation may also quench its central AGN accretion. Given the very different timescales involved, it is difficult to draw conclusions about AGN feedback as a quenching mechanism from the comparison of AGN emission and IR SFRs in our sample, but the parallel decline in AGN accretion rate and SFR seen here is consistent with so-called halo-quenching models, in which halo gas cooling becomes less effective as halo mass increases (e.g., Correa et al., 2018). The decline in global cool-gas inflow thus deprives both the galaxy and the black hole of further fuel to grow.
5 SUMMARY
A sample of 705 16 µm-selected, galaxies mostly have , qualifying them as LIRGs. In most cases, their rest-frame µm SEDs are well fit by local galaxy SED templates. Most galaxies in the sample follow the galaxy main sequence relation between stellar mass and SFR. Their 8 µm luminosity function shows a strong evolution from corresponding to the strong SFRD evolution over that redshift range.
Based on fitting the MIR SEDs, 84% of the galaxies in our 16 µm sample are star forming: best fit by either star-forming or composite templates. While all of these are likely to show PAH emission and be forming stars, about 17% of the Class 2+3 galaxies show an AGN component revealed by either 4.5 µm luminosity exceeding that from stellar processes (stellar photospheres plus dust heated by star formation) or X-ray luminosity exceeding 1042 erg s-1. About 15% of the sample are best fit by an AGN template. No object in our sample can be fit by a quiescent galaxy template, not surprising given the 16 µm selection. Nine objects (1.3%) show neither PAH emission nor strong rest-4.5 µm continuum. All of these objects have M☉ although the local templates that fit their SEDs have M☉. Further investigation is needed for these special objects.
Our fitting of galaxy SEDs for the sample permits accurate separation of MIR luminosities contributed by star formation and an AGN component. This is because the and color–color diagram shows a close correlation for star-forming galaxies, but galaxies with an AGNs show excess emission at 4.5 µm (). This excess correlates well with X-ray luminosities for galaxies having Chandra X-ray detections, and should therefore be a useful AGN luminosity indicator, as it is for local galaxies. As to SFR indicators, SFRs estimated from 8 µm luminosity (), 24 µm flux density, FIR luminosity, and UV-corrected flux yield consistent results for this sample of LIRGs. SFRs derived from and 24 µm flux density have the lowest scatter. Therefore we suggest that can trace the SFR as accurately as the 24 µm flux density for this LIRG sample and more accurately than SFR derived from UV flux.
Our sample galaxies show a correlation between AGN luminosity (as measured by ) and SFR, indicating a coevolution between black hole accretion rate and star formation. Also, galaxies with high AGN luminosities and an SED showing a dominant AGN tend to lie above the star formation main sequence. These galaxies are seen predominantly at low stellar mass and are absent at M☉. AGN accretion therefore appears to shut down along with star formation when enough stellar mass has been accumulated. Although galaxies with and without AGN follow the main sequence, we cannot rule out the possibility of AGN-related quenching. Nevertheless, the positive correlation between AGN and SFR and the lack of AGNs at the massive end tends to favor the halo-mass quenching mechanism, which stops not only galaxy-wide star formation but also gas feeding the accretion of the central massive black hole.
| (A1) |
and
| (A2) |
Here and consist of both photospheric emission from stars and dust emission from star-formation regions, and is taken to be AGN luminosity. For both and , we adopt the relation found in Figure 10, and we assume that is only from stellar photospheres:
| (A3) |
The AGN intrinsic SED model from Mullaney et al. (2011) gives a power law with for the AGN component. This gives
| (A4) |
By solving the above three equations, we reach
| (A5) |
where , a weak function of . For the expected , . (–0.098 for the range of above.) The star forming component in is then
| (A6) |
Qualitatively, measures SFR with a modest AGN correction while measures the AGN with a modest star-formation correction. For this LIRG sample, photospheric emission at rest 8 µm is only 2–3% of . We therefore need not subtract photospheric emission from when calculating SFR, and the relatively small coefficient on shows that any AGN contribution at 1.6 µm will make little difference. Error bars, including uncertainties in the parameters, for and were propagated according to the above equations.
References
- Aird et al. (2018) Aird, J., Coil, A. L., & Georgakakis, A. 2018, MNRAS, 474, 1225
- Aird et al. (2019) Aird, J., Coil, A. L., & Georgakakis, A. 2019, MNRAS, 484, 4360
- Alatalo et al. (2015) Alatalo, K., Lacy, M., Lanz, L., et al. 2015, ApJ, 798, 31
- Alonso-Herrero et al. (2012) Alonso-Herrero, A., Pereira-Santaella, M., Rieke, G. H., & Rigopoulou, D. 2012, ApJ, 744, 2
- Alonso-Herrero et al. (2006) Alonso-Herrero, A., Rieke, G. H., Rieke, M. J., et al. 2006, ApJ, 650, 835
- Assef et al. (2008) Assef, R. J., Kochanek, C. S., Brodwin, M., et al. 2008, ApJ, 676, 286
- Assef et al. (2010) Assef, R. J., Kochanek, C. S., Brodwin, M., et al. 2010, ApJ, 713, 970
- Azadi et al. (2015) Azadi, M., Aird, J., Coil, A. L., et al. 2015, ApJ, 806, 187
- Bain, Sanders, McPartland, & Auge (2020) Bain, C., Sanders, D., McPartland, C., & Auge, C. 2020, AAS Meeting Abstracts, 283.07
- Balestra et al. (2010) Balestra, I., Mainieri, V., Popesso, P., et al. 2010, A&A, 512, A12
- Bell, McIntosh, Katz, & Weinberg (2003) Bell, E. F., McIntosh, D. H., Katz, N., & Weinberg, M. D. 2003, ApJS, 149, 289
- Bernhard et al. (2019) Bernhard, E., Grimmett, L. P., Mullaney, J. R., et al. 2019, MNRAS, 483, L52
- Borch et al. (2006) Borch, A., Meisenheimer, K., Bell, E. F., et al. 2006, A&A, 453, 869
- Boselli, Lequeux, & Gavazzi (2004) Boselli, A., Lequeux, J., & Gavazzi, G. 2004, A&A, 428, 409
- Brandl et al. (2006) Brandl, B. R., Bernard-Salas, J., Spoon, H. W. W., et al. 2006, ApJ, 653, 1129
- Brown et al. (2014) Brown, M. J. I., Moustakas, J., Smith, J.-D. T., et al. 2014, ApJS, 212, 18
- Burgarella et al. (2009) Burgarella, D., Buat, V., Takeuchi, T. T., Wada, T., & Pearson, C. 2009, PASJ, 61, 177
- Calzetti et al. (2007) Calzetti, D., Kennicutt, R. C., Engelbracht, C. W., et al. 2007, ApJ, 666, 870
- Carleton et al. (1987) Carleton, N. P., Elvis, M., Fabbiano, G., et al. 1987, ApJ, 318, 595
- Chabrier (2003) Chabrier, G. 2003, PASP, 115, 763
- Chary & Elbaz (2001) Chary, R. & Elbaz, D. 2001, ApJ, 556 562
- Chen et al. (2020) Chen, Z., Faber, S. M., Koo, D. C., et al. 2020, ApJ, 897, 102
- Chen et al. (2013) Chen, C.-T. J., Hickox, R. C., Alberts, S., et al. 2013, ApJ, 773, 3
- Chen et al. (2015) Chen, C.-T. J., Hickox, R. C., Alberts, S., et al. 2015, ApJ, 802, 50
- Correa et al. (2018) Correa, C. A., Schaye, J., Wyithe, J. S. B., et al. 2018, MNRAS, 473, 538
- Cortzen et al. (2019) Cortzen, I., Garrett, J., Magdis, G., et al. 2019, MNRAS, 482, 1618
- Crocker et al. (2013) Crocker, A. F., Calzetti, D., Thilker, D. A., et al. 2013, ApJ, 762, 79
- Caputi et al. (2007) Caputi, K. I., Lagache, G., Yan, L., et al. 2007, ApJ, 660, 97
- Daddi et al. (2010) Daddi, E., Elbaz, D., Walter, F., et al. 2010, ApJ, 714, L118
- Dahlen et al. (2013) Dahlen, T., Mobasher, B., Faber, S. M., et al. 2013, ApJ, 775, 93
- Dai et al. (2014) Dai, Y. S., Elvis, M., Bergeron, J., et al. 2014, ApJ, 791, 113
- Dai et al. (2018) Dai, Y. S., Wilkes, B. J., Bergeron, J., et al. 2018, MNRAS, 478, 4238
- Dale et al. (2012) Dale, D. A., Aniano, G., Engelbracht, C. W., et al. 2012, ApJ, 745, 95
- Dale et al. (2017) Dale, D. A., Cook, D. O., Roussel, H., et al. 2017, ApJ, 837, 90
- Davies et al. (2019) Davies, L. J. M., Lagos, C. del P., Katsianis, A., et al. 2019, MNRAS, 483, 1881
- Desai et al. (2009) Desai, V., Soifer, B. T., Dey, A., et al. 2009, ApJ, 700, 1190
- Driver & Robotham (2010) Driver, S. P., & Robotham, A. S. G. 2010, MNRAS, 407, 2131
- Elbaz et al. (1999) Elbaz, D., Cesarsky, C. J., Fadda, D., et al. 1999, A&A, 351, L37
- Elbaz et al. (2011) Elbaz, D., Dickinson, M., Hwang, H. S., et al. 2011, A&A, 533, A119
- Elbaz et al. (2018) Elbaz, D., Leiton, R., Nagar, N., et al. 2018, A&A, 616, A110
- Engelbracht et al. (2005) Engelbracht, C. W., Gordon, K. D., Rieke, G. H., et al. 2005, ApJ, 628, L29
- Faber et al. (2007) Faber, S. M., Willmer, C. N. A., Wolf, C., et al. 2007, ApJ, 665, 265
- Fabian (2012) Fabian, A. C. 2012, ARA&A, 50, 455
- Fang et al. (2014) Fang, G., Huang, J.-S., Willner, S. P., et al. 2014, ApJ, 781, 63
- Fang et al. (2018) Fang, J. J., Faber, S. M., Koo, D. C., et al. 2018, ApJ, 858, 100
- Farrah et al. (2008) Farrah, D., Lonsdale, C. J., Weedman, D. W., et al. 2008, ApJ, 677, 957
- Fiore et al. (2009) Fiore, F., Puccetti, S., Brusa, M., et al. 2009, ApJ, 693, 447
- Fu et al. (2010) Fu, H., Yan, L., Scoville, N. Z., et al. 2010, ApJ, 722, 653
- Galliano et al. (2005) Galliano, F., Madden, S. C., Jones, A. P., Wilson, C. D., & Bernard, J.-P. 2005, A&A, 434, 867
- Genzel et al. (1998) Genzel, R., Lutz, D., Sturm, E., et al. 1998, ApJ, 498, 579
- Gilli, Comastri, & Hasinger (2007) Gilli, R., Comastri, A., & Hasinger, G. 2007, A&A, 463, 79
- Goto et al. (2015) Goto, T., Oi, N., Ohyama, Y., et al. 2015, MNRAS, 452, 1684
- Grogin et al. (2011) Grogin, N. A., Kocevski, D. D., Faber, S. M., et al. 2011, ApJS, 197, 35
- Gruppioni et al. (2002) Gruppioni, C., Lari, C., Pozzi, F., et al. 2002, MNRAS, 335, 831
- Hao et al. (2005b) Hao, L., Spoon, H. W. W., Sloan, G. C., et al. 2005b, ApJ, 625, L75
- Hao et al. (2005a) Hao, C. N., Xia, X. Y., Mao, S., Wu, H., & Deng, Z. G. 2005a, ApJ, 625, 78
- Hao et al. (2008) Hao, C.-N., Xia, X.-Y., Shu-DeMao, Deng, Z.-G., & Wu, H. 2008, Chinese J. Astron. Astrophys., 8, 12
- Helou et al. (2001) Helou, G., Malhotra, S., Hollenbach, D. J., Dale, D. A., & Contursi, A. 2001, ApJ, 548, L73
- Hensley & Draine (2020) Hensley, B. S., & Draine, B. T. 2020, ApJ, 895, 38
- Hickox & Alexander (2018) Hickox, R. C., & Alexander, D. M. 2018, ARA&A, 56, 625
- Hickox et al. (2014) Hickox, R. C., Mullaney, J. R., Alexander, D. M., et al. 2014, ApJ, 782, 9
- Hickox et al. (2011) Hickox, R. C., Myers, A. D., Brodwin, M., et al. 2011, ApJ, 731, 117
- Hogg et al. (2005) Hogg, D. W., Tremonti, C. A., Blanton, M. R., et al. 2005, ApJ, 624, 162
- Hopkins et al. (2007) Hopkins, P. F., Richards, G. T., & Hernquist, L. 2007, ApJ, 654, 731
- Houck et al. (2004) Houck, J. R., Charmandaris, V., Brandl, B. R., et al. 2004, ApJS, 154, 211
- Huang et al. (2003) Huang, J.-S., Glazebrook, K., Cowie, L. L., & Tinney, C. 2003, ApJ, 584, 203
- Huang et al. (2007) Huang, J.-S., Rigopoulou, D., Papovich, C., et al. 2007, ApJ, 660, L69
- Huang et al. (2009) Huang, J.-S., Faber, S. M., Daddi, E., et al. 2009, ApJ, 700, 183
- Huang et al. (2013) Huang, J.-S., Faber, S. M., Willmer, C. N. A., et al. 2013, ApJ, 766, 21
- Hunt et al. (2014) Hunt, L. K., Testi, L., Casasola, V., et al. 2014, A&A, 561, A49
- Imanishi et al. (2001) Imanishi, M., Dudley, C. C., & Maloney, P. R. 2001, ApJ, 558, L93
- Inami et al. (2013) Inami, H., Armus, L., Charmandaris, V., et al. 2013, ApJ, 777, 156
- Ishibashi & Fabian (2012) Ishibashi, W. & Fabian, A. C. 2012, MNRAS, 427, 2998
- Kormendy & Ho (2013) Kormendy, J. & Ho, L. C. 2013, ARA&A, 51, 511
- Kormendy & Richstone (1995) Kormendy, J. & Richstone, D. 1995, ARA&A, 33, 581
- Kozlowski et al. (2016) Kozłowski, S., Kochanek, C. S., Ashby, M. L. N., et al. 2016, ApJ, 817, 119
- Lacy et al. (2004) Lacy, M., Storrie-Lombardi, L. J., Sajina, A., et al. 2004, ApJS, 154, 166
- Lambrides et al. (2020) Lambrides, E. L., Chiaberge, M., Heckman, T., et al. 2020, ApJ, 897, 160
- Lanzuisi et al. (2009) Lanzuisi, G., Piconcelli, E., Fiore, F., et al. 2009, A&A, 498, 67
- Lanzuisi et al. (2017) Lanzuisi, G., Delvecchio, I., Berta, S., et al. 2017, A&A, 602, A123
- Lapi et al. (2014) Lapi, A., Raimundo, S., Aversa, R., et al. 2014, ApJ, 782, 69
- Le Floc’h et al. (2005) Le Floc’h, E., Papovich, C., Dole, H., et al. 2005, ApJ, 632, 169
- Lee et al. (2015) Lee, N., Sanders, D. B., Casey, C. M., et al. 2015, ApJ, 801, 80
- Li & Draine (2002) Li, A. & Draine, B. T. 2002, ApJ, 572, 232
- Luo et al. (2017) Luo, B., Brandt, W. N., Xue, Y. Q., et al. 2017, ApJS, 228, 2
- Lutz et al. (2004) Lutz, D., Maiolino, R., Spoon, H. W. W., & Moorwood, A. F. M. 2004, A&A, 418, 465
- Lutz et al. (2010) Lutz, D., Mainieri, V., Rafferty, D., et al. 2010, ApJ, 712, 1287
- Lutz et al. (2011) Lutz, D., Poglitsch, A., Altieri, B., et al. 2011, A&A, 532, A90
- Mobasher et al. (2015) Mobasher, B., Dahlen, T., Ferguson, H. C., et al. 2015, ApJ, 808, 101. doi:10.1088/0004-637X/808/1/101
- Madau & Dickinson (2014) Madau, P., & Dickinson, M. 2014, ARA&A, 52, 415
- Magdis et al. (2010) Magdis, G. E., Rigopoulou, D., Huang, J.-S., & Fazio, G. G. 2010, MNRAS, 401, 1521
- Magdis et al. (2011) Magdis, G. E., Elbaz, D., Hwang, H. S., et al. 2010, MNRAS, 409, 22
- Magorrian et al. (1998) Magorrian, J., Tremaine, S., Richstone, D., et al. 1998, AJ, 115, 2285
- Mahajan et al. (2019) Mahajan, S., Ashby, M. L. N., Willner, S. P., et al. 2019, MNRAS, 482, 560
- Man & Belli (2018) Man, A. & Belli, S. 2018, Nature, 2, 695
- Matute et al. (2006) Matute, I., La Franca, F., Pozzi, F., et al. 2006, A&A, 451, 443
- McGaugh & Schombert (2014) McGaugh, S. S., & Schombert, J. M. 2014, AJ, 148, 77
- Moorwood (1986) Moorwood, A. F. M. 1986, A&A, 166, 4
- Moster et al. (2011) Moster, B. P., Somerville, R. S., Newman, J. A., & Rix, H.-W. 2011, ApJ, 731, 113
- Mullaney et al. (2011) Mullaney, J. R., Alexander, D. M., Goulding, A. D., & Hickox, R. C. 2011, MNRAS, 414, 1082
- Mullaney et al. (2015) Mullaney, J. R., Alexander, D. M., Aird, J., et al. 2015, MNRAS, 453, L83
- Nandra et al. (2015) Nandra, K., Laird, E. S., Aird, J. A., et al. 2015, ApJS, 220, 10
- Netzer (2009) Netzer, H. 2009, MNRAS, 399, 1907
- Newman et al. (2013) Newman, J. A., Cooper, M. C., Davis, M., et al. 2013, ApJS, 208, 5
- Oliver et al. (2012) Oliver, S. J., Bock, J., Altieri, B., et al. 2012, MNRAS, 424, 1614
- Pahre, Ashby, Fazio, & Willner (2004) Pahre, M. A., Ashby, M. L. N., Fazio, G. G., & Willner, S. P. 2004, ApJS, 154, 235
- Pearson et al. (2010) Pearson, C. P., Oyabu, S., Wada, T., et al. 2010, A&A, 514, A8
- Peeters et al. (2004) Peeters, E., Allamandola, L. J., Bauschlicher, C. W., et al. 2004, ApJ, 604, 252
- Pety et al. (2005) Pety, J., Teyssier, D., Fossé, D., et al. 2005, A&A, 435, 885
- Polletta et al. (2007) Polletta, M., Tajer, M., Maraschi, L., et al. 2007, ApJ, 663, 81
- Rieke et al. (2009) Rieke, G. H., Alonso-Herrero, A., Weiner, B. J., et al. 2009, ApJ, 692, 556
- Rigopoulou et al. (2009) Rigopoulou, D., Mainieri, V., Almaini, O., et al. 2009, MNRAS, 400, 1199
- Rigopoulou et al. (1999) Rigopoulou, D., Spoon, H. W. W., Genzel, R., et al. 1999, AJ, 118, 2625
- Roche et al. (1991) Roche, P. F., Aitken, D. K., Smith, C. H., & Ward, M. J. 1991, MNRAS, 248, 606
- Rodighiero et al. (2004) Rodighiero, G., Lari, C., Fadda, D., et al. 2004, A&A, 427, 773
- Rosario et al. (2012) Rosario, D. J., Santini, P., Lutz, D., et al. 2012, A&A, 545, A45
- Rosario et al. (2013) Rosario, D. J., Santini, P., Lutz, D., et al. 2013, ApJ, 771, 63
- Rosenberg et al. (2006) Rosenberg, J. L., Ashby, M. L. N., Salzer, J. J., & Huang, J.-S. 2006, ApJ, 636, 742
- Shao et al. (2020) Shao, X., et al. 2020, in preparation
- Shimizu et al. (2015) Shimizu, T. T., Mushotzky, R. F., Meléndez, M., Koss, M., & Rosario, D. J. 2015, MNRAS, 452, 1841
- Silva et al. (2004) Silva, L., Maiolino, R., & Granato, G. L. 2004, MNRAS, 355, 973
- Silverman et al. (2008) Silverman, J. D., Green, P. J., Barkhouse, W. A., et al. 2008, ApJ, 679, 118
- Spoon et al. (2007) Spoon, H. W. W., Marshall, J. A., Houck, J. R., et al. 2007, ApJ, 654, L49
- Stemo et al. (2020) Stemo, A., Comerford, J. M., Barrows, R. S., et al. 2020, ApJ, 888, 78
- Stern (2015) Stern, D. 2015, ApJ, 807, 129
- Stern et al. (2005) Stern, D., Eisenhardt, P., Gorjian, V., et al. 2005, ApJ, 631, 163
- Suh et al. (2019) Suh, H., Civano, F., Hasinger, G., et al. 2019, ApJ, 872, 168
- Teplitz et al. (2011) Teplitz, H. I., Chary, R., Elbaz, D., et al. 2011, AJ, 141, 1
- Treyer et al. (2010) Treyer, M., Schiminovich, D., Johnson, B. D., et al. 2010, ApJ, 719, 1191
- Valencic & Smith (2015) Valencic, L. A., & Smith, R. K. 2015, ApJ, 809, 66
- Wada et al. (2007) Wada, T., Oyabu, S., Ita, Y., et al. 2007, PASJ, 59, S515
- Wang et al. (2017) Wang, T., Elbaz, D., Alexander, D. M., et al. 2017, A&A, 601, A63
- Ward et al. (1987) Ward, M., Elvis, M., Fabbiano, G., et al. 1987, ApJ, 315, 74
- Wirth et al. (2004) Wirth, G. D., Willmer, C. N. A., Amico, P., et al. 2004, AJ, 127, 3121
- Wu et al. (2005) Wu, H., Cao, C., Hao, C.-N., et al. 2005, ApJ, 632, L79
- Wu et al. (2008) Wu, Y., Charmandaris, V., Houck, J. R., et al. 2008, ApJ, 676, 970
- Xu et al. (2015) Xu, L., Rieke, G. H., Egami, E., et al. 2015, ApJ, 808, 159
- Xue et al. (2016) Xue, Y. Q., Luo, B., Brandt, W. N., et al. 2016, ApJS, 224, 15
- Yang et al. (2019) Yang, G., Brandt, W. N., Alexander, D. M., et al. 2019, MNRAS, 485, 3721


| Field | Area | # of | # of | redshift referencesaaMajor surveys are indicated, but additional redshifts were collected from other publications. | |
|---|---|---|---|---|---|
| arcmin2 | Jy | objects | , | ||
| EGS | 432 | 130 | 263 | 190 | Newman et al. (2013), Huang et al. (2013) |
| GOODS-N | 158 | 30 | 334 | 264 | Wirth et al. (2004), Dahlen et al. (2013) |
| GOODS-S | 104 | 30 | 108 | 102 | Balestra et al. (2010), Dahlen et al. (2013) |
| total | 694 | 605 | 556 |
| )aaUnits of are galaxies per comoving Mpc-3 for km s-1 Mpc-1. | )aaUnits of are galaxies per comoving Mpc-3 for km s-1 Mpc-1. | |
|---|---|---|
| 9.8 | 2.95 | 0.43 |
| 10.0 | 2.29 | 0.13 |
| 10.2 | 2.47 | 0.07 |
| 10.4 | 2.43 | 0.05 |
| 10.6 | 2.33 | 0.04 |
| 10.8 | 2.43 | 0.04 |
| 11.0 | 2.76 | 0.05 |
| 11.2 | 3.21 | 0.09 |
| 11.4 | 4.01 | 0.17 |
| 11.6 | 4.66 | 0.24 |
| Template | type | 6.2 µm PAH EW | |
|---|---|---|---|
| Class 1 | AGN | ||
| Class 2 | Composite | ||
| Class 3 | Star Forming | ||
| Class 4 | Quiescent | ||
| Class 5 | Blue Compact |
| Field | Class 1 | Class 2 | Class 3 | Class 5 |
|---|---|---|---|---|
| AGN | Composite | Star-forming | Blue Compact | |
| EGS | 43 | 78 | 142 | 0 |
| GOODS N | 49 | 115 | 161 | 9 |
| GOODS S | 15 | 30 | 63 | 0 |
| All | 107 | 223 | 366 | 9 |
| Fractions | 15.2% | 31.6% | 51.9% | 1.3% |
| Field | Chandra | Class 1 | Class 2 | Class 3 |
|---|---|---|---|---|
| exp. time | AGN | Composite | Star-forming | |
| all Chandra X-ray detections | ||||
| EGS | 0.8 Ms | 7 | 10 | 7 |
| GOODS-N | 2 Ms | 22 | 17 | 16 |
| GOODS-S | 7 Ms | 12 | 10 | 24 |
| with erg s-1 | ||||
| EGS | 7 | 10 | 7 | |
| GOODS-N | 20 | 9 | 10 | |
| GOODS-S | 4 | 2 | 2 | |