Pebble trapping in vortices: three-dimensional simulations
Abstract
Disk vortices have been heralded as promising routes for planet formation due to their ability to trap significant amounts of pebbles. While the gas motions and trapping properties of two-dimensional vortices have been studied in enough detail in the literature, pebble trapping in three dimensions has received less attention, due to the higher computational demand. Here we use the Pencil Code to study 3D vortices generated by convective overstability and the trapping of solids within them. The gas is unstratified whereas the pebbles settle to the midplane due to vertical gravity. We find that for pebbles of normalized friction times of and , and dust-to-gas ratio , the vortex column in the midplane is strongly perturbed. Yet, when the initial dust-to-gas ratio is decreased the vortices remain stable and function as efficient pebble traps. Streaming instability is triggered even for the lowest dust-to-gas ratio () and smallest pebble sizes () we assumed, showing a path for planetesimal formation in vortex cores from even extremely subsolar metallicity. To estimate if the reached overdensities can be held together solely by their own gravity we estimate the Roche density at different radii. Depending on disk model and radial location of the pebble clump we do reach concentrations higher than the Roche density. We infer that if self-gravity was included for the pebbles then gravitational collapse would likely occur.
1 Introduction
Vortices, hydrodynamical flow in closed elliptic streamings, have long been considered as a possible route for planet formation since Barge & Sommeria (1995); Adams & Watkins (1995) and Tanga et al. (1996) independently suggested that they would be exceptional sites for trapping solids aerodynamically. The shear in a Keplerian disk means that only anticyclonic vortices survive; being high pressure regions, these type of vortices will behave as dust traps (Whipple, 1972; Bracco et al., 1999; Chavanis, 2000), concentrating the marginally coupled pebbles that would otherwise drift toward the star (Weidenschilling, 1980; Klahr & Bodenheimer, 2006).
Dust trapping in 2D was subsequently studied by Inaba & Barge (2006), finding that solids rapidly sink toward the center of the vortices and increase the solids-to-gas ratio by at least an order of magnitude. Lyra et al. (2008a, 2009a, 2009b) performed global models, also in 2D, and including selfgravity, finding that the concentration of solids collapsed to objects of lunar and Mars-mass, that subsequently undergo further collisions and pebble accretion, building up Earth-mass planets.
Because these results were obtained in 2D, where the turbulent cascade is inverse, the question remained whether a vortex could be formed and sustained in 3D, where the vortices spontaneously develop internal turbulence (Lesur & Papaloizou, 2009), leading to direct cascade and vortex destruction. Lyra (2009) presented evidence that vortices would be sustained in 3D via the Rossby wave instability (RWI, Lovelace et al., 1999) in special locations, namely the boundary between viscosity transitions or the gaps opened by a planet. Sustenance of Rossby vortices in 3D was subsequently demonstrated by Meheut et al. (2010, 2012a, 2012b, 2012c); Lin (2012a, b); Lyra & Mac Low (2012); Lin (2013) and Lyra et al. (2015). Beyond the RWI, Lesur & Papaloizou (2010) and Lyra & Klahr (2011) also showed that in non-isothermal disks, a mechanism for vortex formation exists in the bulk of the gas, a baroclinic instability, first thought to be nonlinear, but then found to be linear, and renamed Convective Overstability (COV, Klahr & Hubbard, 2014; Lyra, 2014). Other non-magnetized hydrodynamical instabilities in the disk Ohmic zone, the zombie vortex instability (Marcus et al., 2015, 2016; Barranco et al., 2018) and the vertical shear instability (Nelson et al., 2013; Stoll & Kley, 2014; Richard et al., 2016; Manger & Klahr, 2018; Flock et al., 2020; Manger et al., 2020; Pfeil & Klahr, 2020) also show the formation of large scale vortices in 3D (see Lyra & Umurhan, 2019, for a review).
While these results from the last decade of research on gas dynamics in protoplanetary disks decisively settled the question of vortex formation and sustenance in 3D, two-dimensional simulations with dust cast doubt on the survival of dusty vortices once the dust feedback becomes too strong and disrupts the elliptic streamlines (Fu et al., 2014; Raettig et al., 2015; Surville et al., 2016; Miranda et al., 2017). This is a phenomenon that had already been noted by Inaba & Barge (2006), that the lifetime of vortices was lowered as the dust accumulation increased. This has lead to the suggestion that the asymmetries seen in ALMA dust continuum observations of transition disks (van der Marel et al., 2013, 2020) are not vortices, despite the fact that the observational results are generally consistent with the analytical predictions for vortex-trapped dust in steady-state between drag and diffusion (Klahr & Henning, 1997; Lyra & Lin, 2013; Sierra et al., 2017; Casassus et al., 2019). The question therefore remains whether dusty vortices survive in 3D.
To answer this question, we conduct three-dimensional unstratified gas simulation of the convective overstability, as in Lesur & Papaloizou (2010); Lyra & Klahr (2011) and Lyra (2014), but with pebbles that are allowed to sediment due to stellar gravity. As we will see, the dust vertical stratification dramatically changes the result of two-dimensional models, since pebbles sediment with a different scale height than the gas, undergo vertical motion and are subject to vertical stirring. Another important factor is how the pebbles affect the vortex structure, which we already saw in our 2D simulations, most strongly for loosely coupled grains (Raettig et al., 2015). In 3D with sedimentation, three different outcomes are possible:
-
1.
The vortex column is stable and pebbles accumulate inside the column.
-
2.
The pebbles disrupt the vortex column in the layer they reside around the midplane, but do not affect the vortex column above and below the pebble layer. The question is then how the remaining vortex column will affect the pebbles concentration.
-
3.
The entire vortex column is destroyed by the pebbles. Pebbles settle to the midplane with no significant difference with respect to non-turbulent runs. The baroclinic vortex cannot be reestablished.
As shown in Lyra et al. (2018), the second option is the dominant outcome. Here we detail and expand this result; the phenomenology depends strongly on the pebble radius and the dust-to-gas ratio. First we will introduce in Sect. 2 the new physics that is needed for three-dimensional estimates. The numerical setup is presented in Sect. 3. In Sect. 4 we will analyze the evolution of pebbles in the simulations and, finally, discuss our results.
2 Model Equations
We model a local patch of the disk following the shearing box approximation. The gas is rendered unstable to the COV by introducing baroclinicity in the box, in the form of a linearized pressure gradient. The equations of motion are
| (1) | |||||
| (2) | |||||
In the equations above, is the gas density is the velocity, is the Keplerian frequency, is the dust density, is the dust velocity, is the friction time between gas and dust, is the entropy, is the temperature, is the radiative conductivity, is the heat capacity at constant volume, is the adiabatic index, is the heat capacity at constant pressure, is the gas equilibrium temperature, and is the cooling time. The operator
| (4) |
represents the Lagrangian derivative of a fluid parcel. It is the only place where the (linearized) Keplerian flow appears explicitly. The function is
| (5) |
where the parameter , (with the disk aspect ratio, and the sound speed), is related to the power law of the pressure gradient
| (6) |
where is the cylindrical radius and is a reference radius. The overbar indicates that this quantity is time-independent. The total pressure is =, where is the local fluctuation. Linearizing this pressure gradient contributes an extra term in the momentum equation and in the energy equation, respectively. The derivation of this extra term and the limitations of the approach are detailed in Lyra & Klahr (2011). All the symbols used in this work are listed in
table:symbols.
The advection is made Galilean-invariant by means of the SAFI algorithm (Johansen et al., 2009). The simulations were done with the Pencil Code 111See http://pencil-code.nordita.org (Brandenburg & Dobler, 2002, 2010; Brandenburg et al., 2020), a collocated finite-difference code which integrates the partial differential equations with sixth-order spatial derivatives, and a third-order Runge–Kutta time integrator. We add explicit sixth-order hyperdiffusion, hyperviscosity, and hyper heat conductivity to the mass, momentum, and entropy equations, respectively, explained in Lyra et al. (2008b, 2009a, 2017). They are needed because the high-order scheme of the Pencil Code has little overall numerical dissipation (McNally et al., 2012). We use dimensionless code units; with all simulations using , , , and . The models are scale-free and, thus, the translation to physical units depends on specific parameter choices, as well as on the distance from the box to the star. For densities of the Minimum-Mass Solar Nebula, (MMSN, Weidenschilling, 1977; Hayashi, 1981), and temperature of 100 K at 5AU and 30 K at 50 AU, the disk is stable against gravitational instabillity (Safronov, 1960; Toomre, 1964), having a Toomre value of 50 at 5 AU and 20 at 50AU.
2.1 Pebble evolution
The pebbles are represented by numerical particles that evolve Lagrangianly according to
| (7) | |||||
where is the pebble position and is the pebble velocity corrected by the sub-Keplerian parameter
| (9) |
The extra velocity is added to the pebbles, as explained in Raettig et al. (2015). This term is needed because the frame of reference is sub-Keplerian, as ensured by the extra term in Eq. (2). In the reference frame of the box, the sub-Keplerian gas is stationary, and the pebbles flow with azimuthal velocity. This is constrated with simulations by Johansen et al. (2006) where the reference frame is Keplerian, i.e. the pebbles are stationary and the gas flows with azimuthal velocity. Here we use , which corresponds to a pressure gradient and disk aspect ratio . The terminal velocities of the pebbles for a given Stokes number relative to the Keplerian flow are
| (10) | |||||
| (11) |
In the vertical direction, the pebbles settle with a constant velocity so that . This leads to
| (12) |
and
| (13) |
Here pebbles will approach the midplane exponentially but never reach it. For pebbles with the term is negligible and the equation of motion reduces to
| (14) |
where
| (15) |
is a solution. Heavy solids will oscillate around the midplane, never settling permanently. In a real protoplanetary disk there are additional effects acting on the solids that will change this idealized picture. The sedimentation time scale for small grains can be deduced from Eq. (13). After a time a pebble will have sedimented by a factor of its original height. The pebble stirring works as an effective diffusion, so that the evolution of the pebble density can be described by
| (16) |
where is the diffusion constant. For steady-state (Dubrulle et al., 1995; Klahr & Henning, 1997; Lyra & Lin, 2013), the pebble distribution settles as a Gaussian around the midplane, with pebble scale height
| (17) |
where is the gas scale height and is a dimensionless diffusion coefficient similar to the Shakura-Sunyaev -viscosity coefficient (Shakura & Sunyaev, 1973). The ratio of and defines the dimensionless Schmidt number
| (18) |
The pebble scale height then is
| (19) |
| Symbol | Definition | Description | Symbol | Definition | Description | |
|---|---|---|---|---|---|---|
| gas density | pressure gradient | |||||
| gas velocity | gas scale height | |||||
| gas pressure | gas aspect ratio | |||||
| gas entropy | scaled pressure gradient | |||||
| gas temperature | gas vorticity | |||||
| radiative conductivity | sub-Keplerian parameter | |||||
| sound speed | Stokes number | |||||
| Specific heat at constant volume | sedimentation time | |||||
| Specific heat at constant pressure | dimensionless diffusion coefficient | |||||
| Adiabatic index | diffusion coefficient | |||||
| Reference radius | dust scale height | |||||
| Keplerian frequency at | dimensionless viscosity coefficient | |||||
| Keplerian velocity at | viscosity coefficient | |||||
| cylindrical radius | Schmidt number | |||||
| Cartesian radial coordinate | dust-to-gas ratio | |||||
| Cartesian azimuthal coordinate | wavenumber | |||||
| vertical coordinate | box length | |||||
| time | gas column density | |||||
| dust density | dust column density | |||||
| dust velocity | Random phase | |||||
| drag time | pebble radius | |||||
| cooling time | pebble internal density | |||||
| Roche density |
| Run | feedback | |||||||||||
|---|---|---|---|---|---|---|---|---|---|---|---|---|
| 3DG | - | - | - | 2 | - | - | - | - | - | - | - | - |
| 3DF05nt | 0.05 | yes | 0 | 1.20 | 0.72 | 0.72 | 0.1 | 13.87 | 43.4 | 41.6 | - | |
| 3DNF05 | 0.05 | no | 2 | 2.57 | 3.31 | 3.31 | 1.12 | 33.83 | 40.7 | 3540.0 | - | |
| 3DF05 | 0.05 | yes | 2 | 2.23 | 2.49 | 2.49 | 0.66 | 26.7 | 38.2 | 111.2 | 98.44 | |
| 3DF05E-3 | 0.05 | yes | 2 | - | - | - | - | - | 25.3 | 8.7 | 25.67 | |
| 3DF05E-4 | 0.05 | yes | 2 | - | - | - | - | - | 20.0 | 2.1 | 1.12 | |
| 3DNF1 | 1.0 | no | 2 | 0.99 | 9.84 | 9.84 | 0.94 | 9.51 | 22.4 | 15630.0 | - | |
| 3DF1 | 1.0 | yes | 2 | 0.85 | 7.20 | 7.20 | 0.26 | 3.72 | 22.8 | 945.4 | 98.73 | |
| 3DF1E-3 | 1.0 | yes | 2 | - | - | - | - | - | 7.7 | 227.7 | 26.41 | |
| 3DF1E-4 | 1.0 | yes | 2 | - | - | - | - | - | 9.7 | 34.2 | 14.46 |
3 Numerical Setup
3.1 Gas Setup
Since we do not include vertical gravity for the gas simulations, the gas setup is the same as in Raettig et al. (2015), with initial noise in the density according to
| (20) |
where is the box size, and the phase determines the randomness. The subscripts underscore that the phase is the same for all grid points, only changing with wavenumber. The constant sets the strength of the perturbation. The width is set to . In this setup no vertical modes are excited, but radial and azimuthal modes are excited in all vertical layers of the box. Additionally, we add Gaussian noise to the velocity. The physical size of our box is the same in radial () and azimuthal () direction as in the 2D runs in Raettig et al. (2013, 2015). We model in the vertical direction. This is a compromise between an adequately large physical domain to capture the elliptical instability inside the vortex cores, but not high enough resolution to resolve all modes that contribute to the streaming instability. The vertical resolution is the same as in the radial direction. We restrict ourselves to an entropy gradient of , since we established in Raettig et al. (2013) that the main difference between and lower entropy gradients was the time to reach saturation. The size of the vortices and strength of relevant parameters such as kinetic stresses depend only weakly on . For a resolution of is appropriate to resolve the COV to convergence (Lyra & Klahr, 2011; Raettig et al., 2013; Lyra, 2014).
3.2 Pebble Setup
For the pebbles, we add the vertical equation of motion, also including linear vertical gravity . As in the 2D simulations we first evolve the gas alone for 200 local orbits before adding the pebbles. In these simulations, the pebbles are randomly distributed in the plane as before, but now they follow a Gaussian profile in the vertical direction
| (21) |
where is the dust density, a normalization constant and gives the scale height of the initial distribution. We set , which gives a well settled profile, and speeds up the initial relaxation. Like in the 2D simulations (Raettig et al., 2015) we want to have about super-particles per grid point initially, to mitigate numerical effects due to Poisson noise (Johansen et al., 2007). Because most pebbles will settle into the midplane, we only need to take into account 10 grid points around the midplane in this estimate, leading to a particle count of .
Pebble feedback onto the gas is included for all simulations except for the control runs. We restrict ourselves to two pebble sizes, for loosely coupled pebbles and for more strongly coupled pebbles. The Stokes number scales with grain size as
| (22) |
where is the grain radius and its internal density. In the simulations we fix , not the grain radius, so effectively varies dynamically with and due to compressibility. However, in practice, the vortices are not too compressible, with density variations of 50% at most. For the MMSN and assuming silicate density (), the corresponding grain sizes for at 1, 5, and 50 AU are 10cm, 1cm, and 0.3 mm. For ice internal density (), the sizes would be scaled by about 3, so about 30cm, 3cm, and 1 mm. For , the grain radii would be 2m, 20cm, and 0.6cm at 1, 5, and 50 AU for silicate density, and 6m, 60cm, and 2cm for ices at the same distances. For a nebula 5 times more massive than MMSN (Toomre at 5 AU and 5 at 50 AU, marginally stable at these distances) the sizes are scaled up by 5. In short, the particles represent cm-sized pebbles in the inner disk and mm-sized in the outer disk, whereas particles represent m-sized boulders in the inner disk and cm-sized pebbles in the outer disk. While coagulation/fragmentation equilibrium does not predict the existence of m-sized boulders (Güttler et al., 2010; Zsom et al., 2010), the particles representing cm-sized range in the outer disk is a pebble size important for planet formation and captured by VLA observations (Casassus et al., 2019).
We expect the setup to develop (Lyra, 2014). If we assume for now that the Schmidt number for our system is 1, then the pebble scale height for is . Therefore, a pebble layer of around the midplane should be resolved with 12 grid points. The layer of will not be resolved. We set the initial dust-to-gas ratio to . Additionally, we perform runs with and . We also perform one simulation with for for a control run without turbulence. All setups are listed in Table 2. Particle block domain decomposition is used for load balance (Johansen et al., 2011).
4 Results
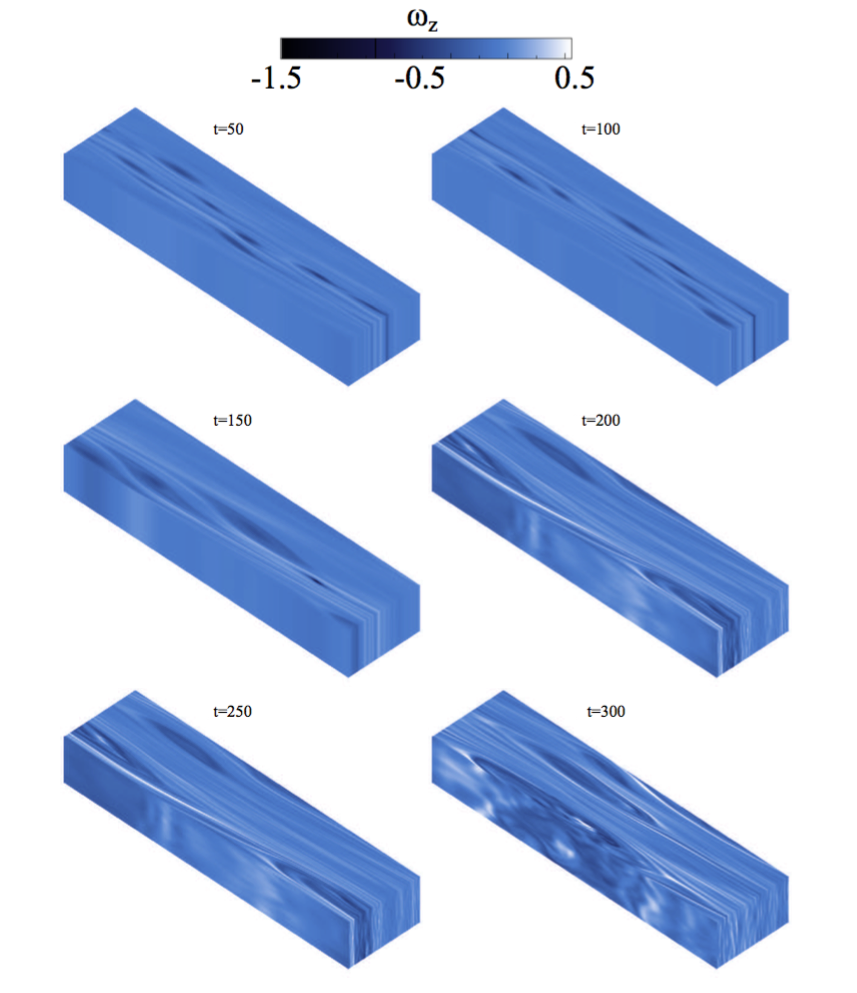
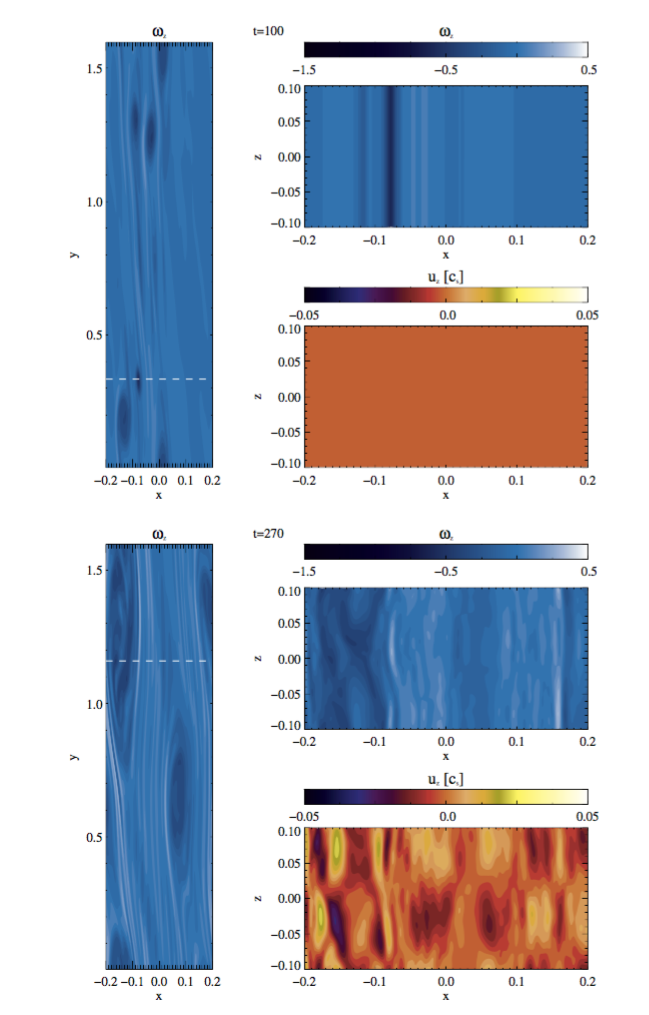
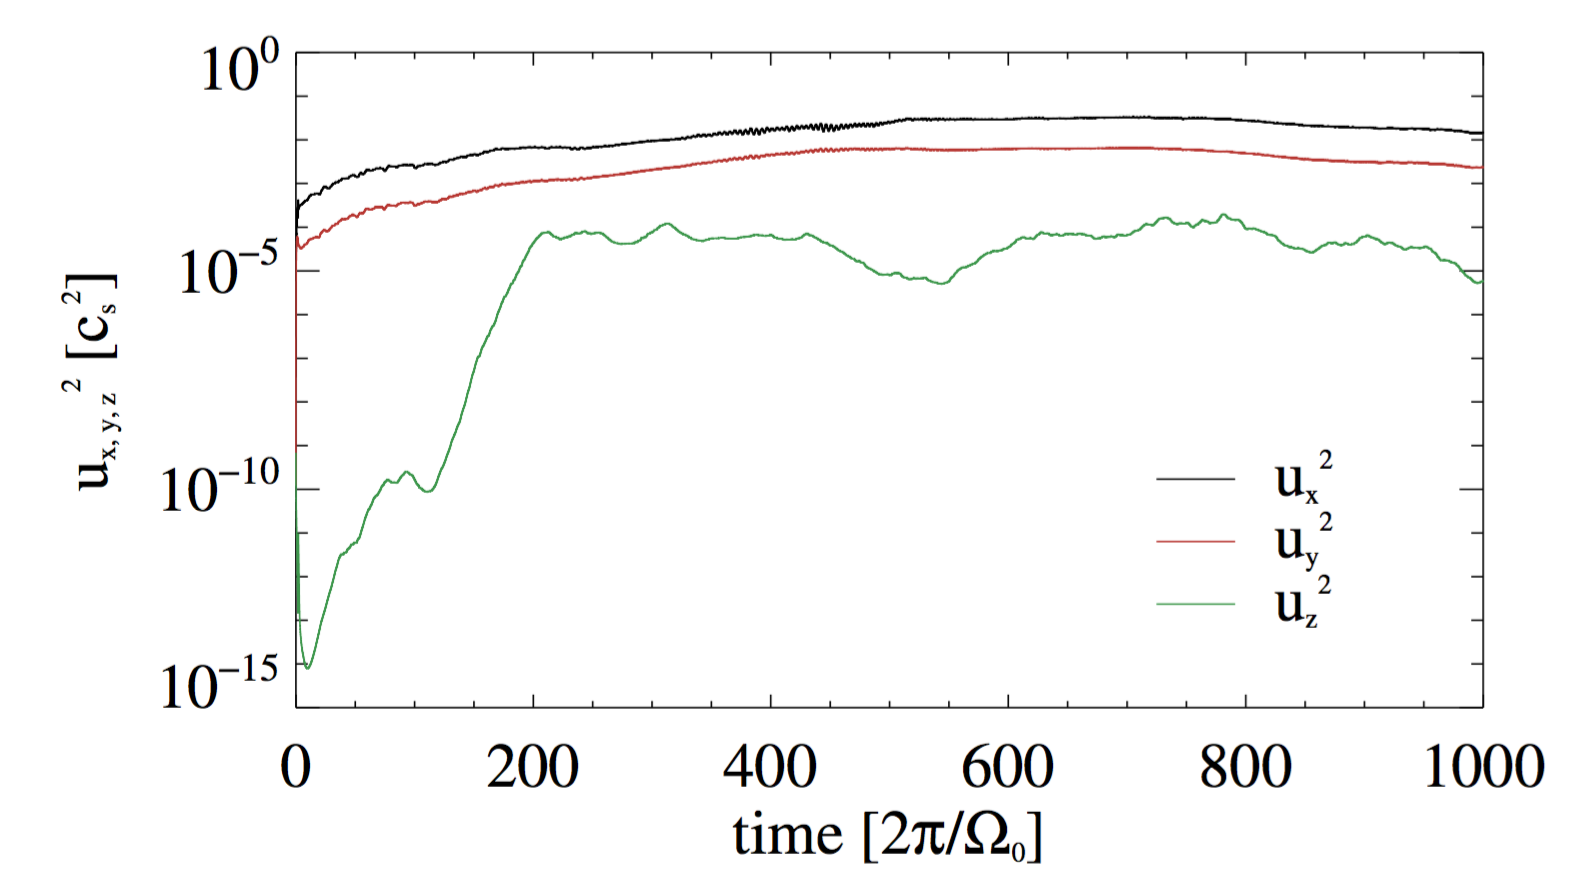
The evolution of the vortex in a 3D unstratified box is very similar to the two-dimensional case. First, a number of small vortices emerge. These vortices are then amplified by the convective overstability mechanism (Lesur & Papaloizou, 2010; Lyra & Klahr, 2011; Klahr & Hubbard, 2014; Lyra, 2014) and also merge. Fig. 1 shows snapshots of the vorticity in the fiducial model. At some point the vertical gas motion sets in and generates turbulent features in the vorticity structure (compare top and bottom panel of Fig. 2). After about 100 local orbits there is a steep increase in vertical gas velocity, due to elliptical instability (Kerswell, 2002; Lesur & Papaloizou, 2009, 2010; Lyra & Klahr, 2011; Lyra, 2013). Yet it remains orders of magnitude lower than the radial and azimuthal velocity components (Fig. 3).
4.1 Pebble evolution
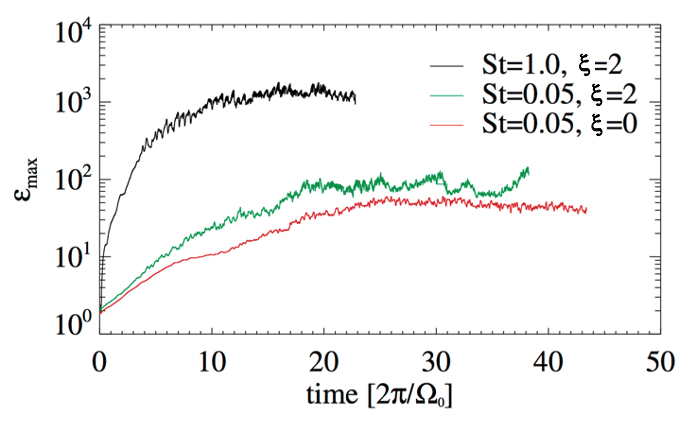
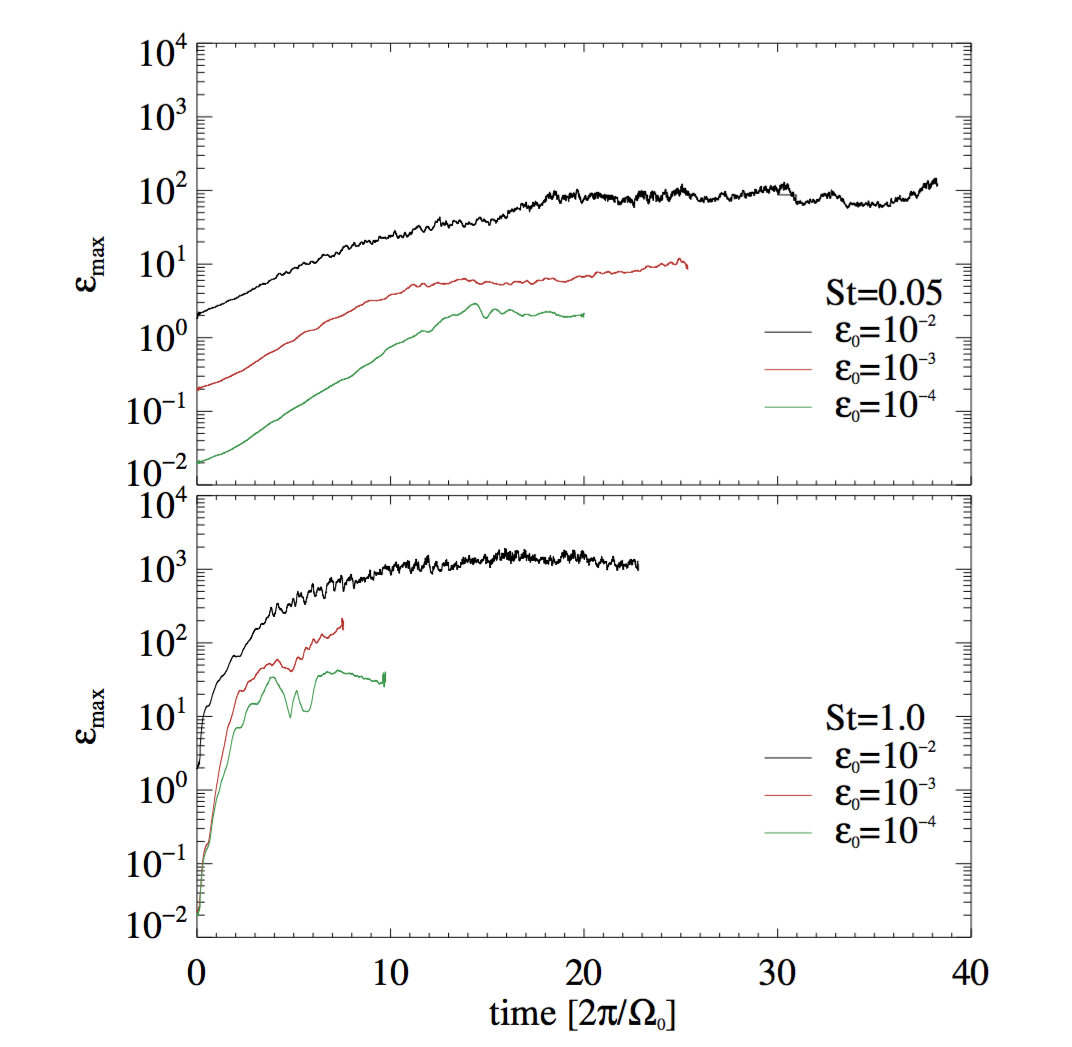
We first discuss the run without baroclinic driving. As expected, the pebbles settle to the midplane, soon triggering the streaming instability. Although we assumed an overall initial dust-to-gas ratio of , the initial dust-to-gas ratio in the midplane is already and increases even further as the sedimentation progresses. The maximum dust-to-gas ratio of the simulation with pebbles and without baroclinic driving can be seen in Fig. 4 (red line). The other two lines in the plot show the maximum dust-to-gas ratios for the simulation with , (green line) and pebbles (black line).
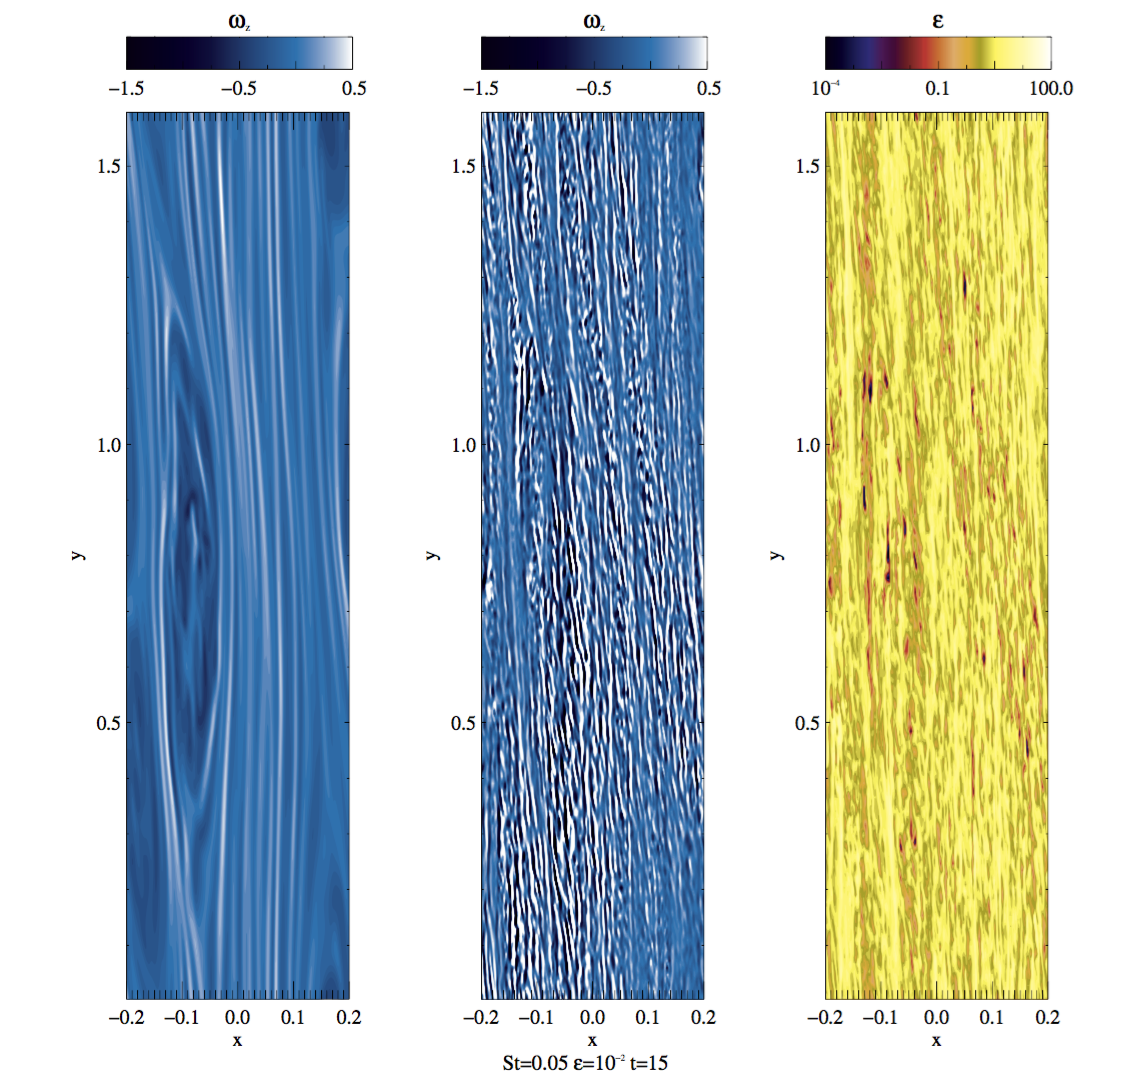
The maximum concentration for with baroclinic driving is only a factor of two higher than in the case without it. Inspecting the evolution of the dust density in the baroclinic simulation, we see that, as expected, the pebbles settle to the midplane and get trapped in the vortices. Yet, after only 3 orbits, the pebbles start to perturb the vortices in the midplane via the streaming instability. Like in the 2D simulations of Raettig et al. (2015), high pebble densities generate local perturbations of the velocity field visible as steep vorticity gradients. Fig. 5 shows the vorticity at the top of the box (left panel), in the midplane (middle panel) and the dust-to-gas ratio in the midplane for . We see that although the vortex in the midplane is heavily disrupted, the vortex column above and below the midplane is still present. Since there are no pebbles in the upper and lower areas of the box, there is no disruption, and we expect these vortex columns to stay stable over long times.
As we will discuss later, these vortex columns still have a minor influence on the pebbles. The explanation for why we do not see a high increase of dust-to-gas ratio for simulations with baroclinic vortices compared to simulations without baroclinic driving lies in the disruption of vortices in the midplane. To test whether there is a strong dust concentration when vortices are stable, and also to account for the fact that not all pebbles will be of the same size we perform simulations with lower initial dust-to-gas ratios, and .
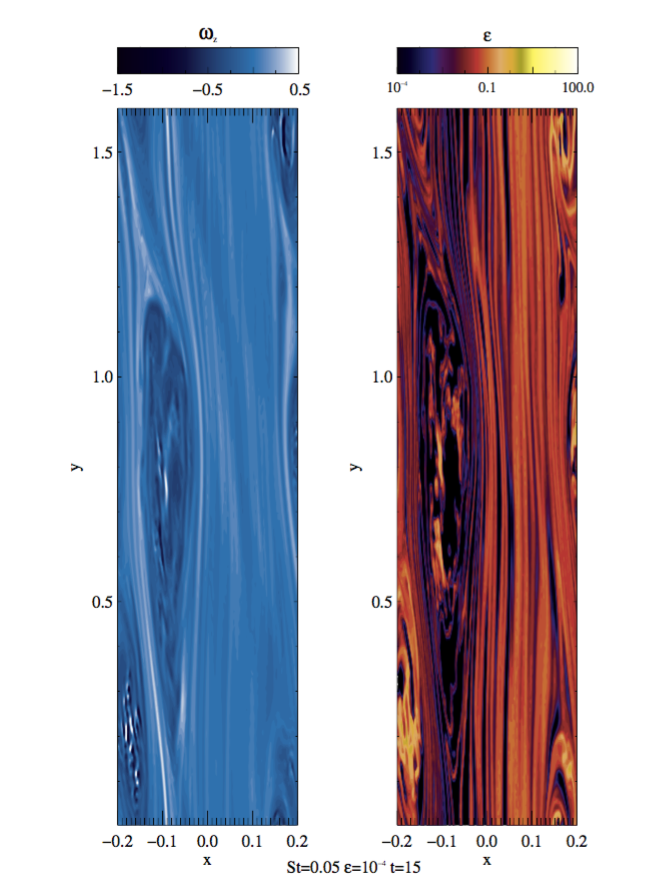
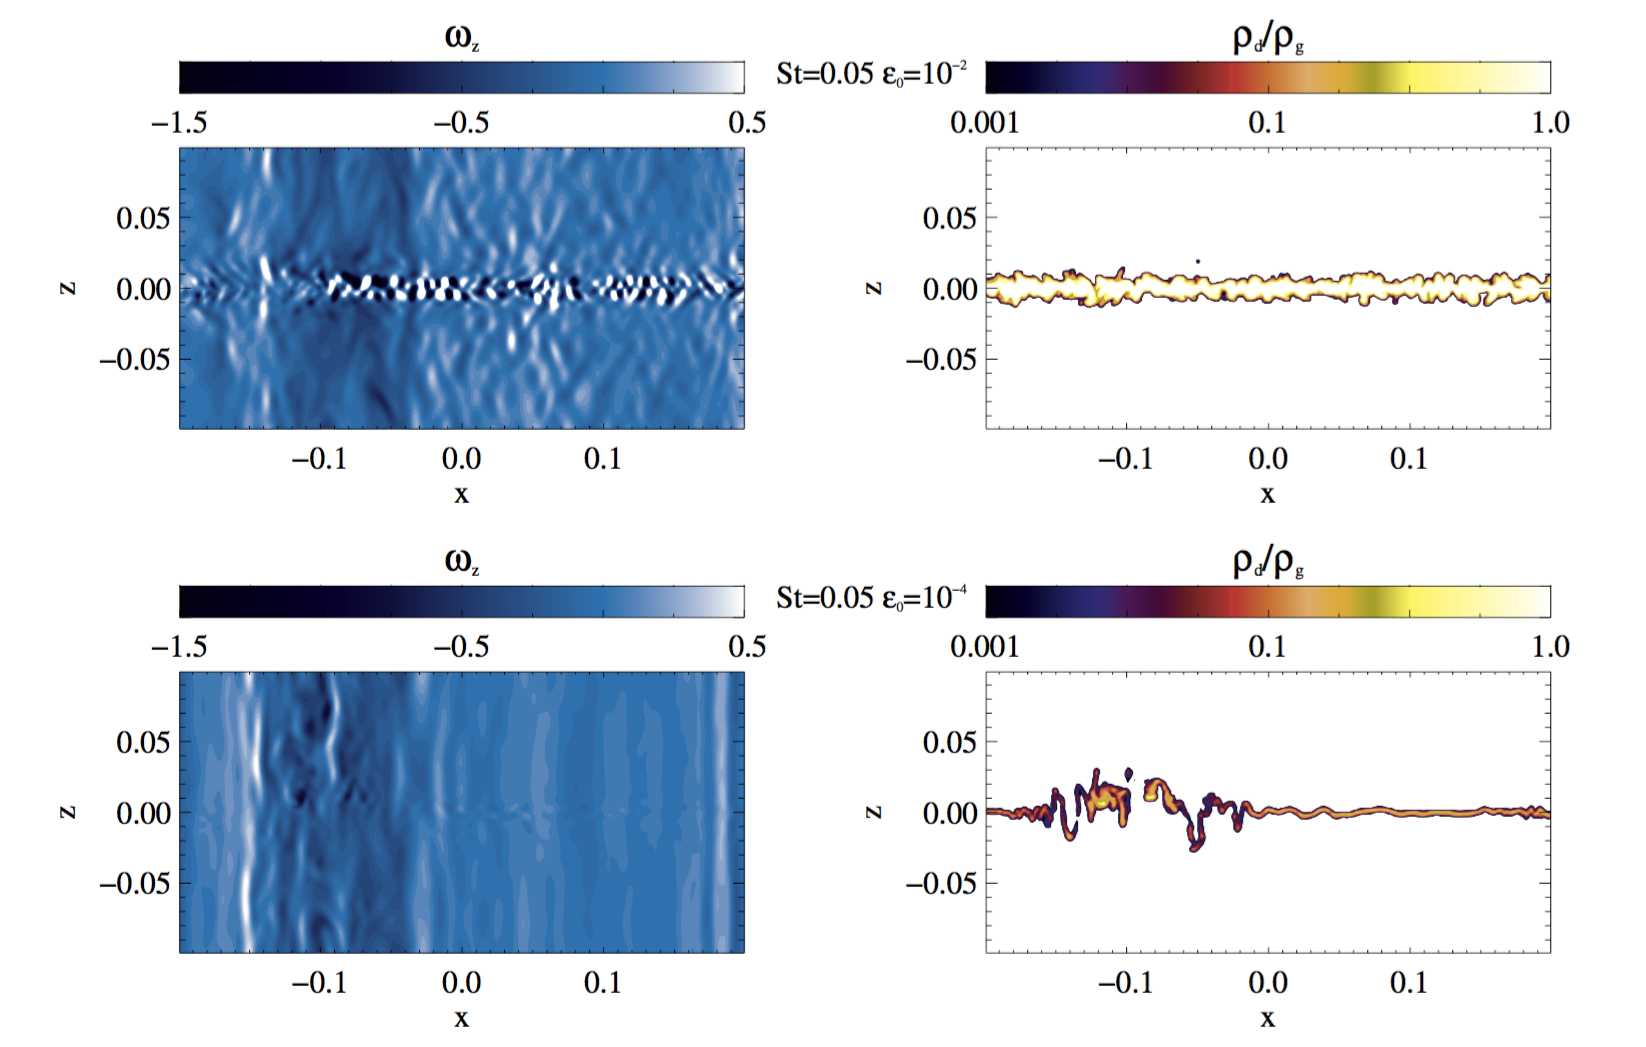
Already for we see a different picture. The pebbles settle to the midplane, but the vortices there are no longer disrupted: the entire vortex column is a stable feature. Pebbles accumulate inside of the vortices, as we saw in the 2D simulations, and then migrate slowly with them. Fig. 6 shows the midplane vertical vorticity (left panel) and dust-to-gas ratio (right panel) for and after 15 orbits. Strong dust concentration is achieved in the vortex, yet no strong vortex disruption in the midplane is observed. Fig. 7 shows a vertical cut of the vertical vorticity (left panels) and dust-to-gas ratio (right panel), again at 15 orbits, for the simulation (upper panel) and the simulation (lower panel). For the vortex located around is strongly perturbed around the midplane. For the vortex column remains roughly undisturbed.
Table 2 and Fig. 8 show the maximum values of . We see that in all simulations is reached and that streaming is triggered. The baroclinic vortices prove to be an efficient pebble trap, even at extreme subsolar metallicity. Even an initial dust-to-gas ratio of is sufficient to trigger the streaming instability inside a vortex.
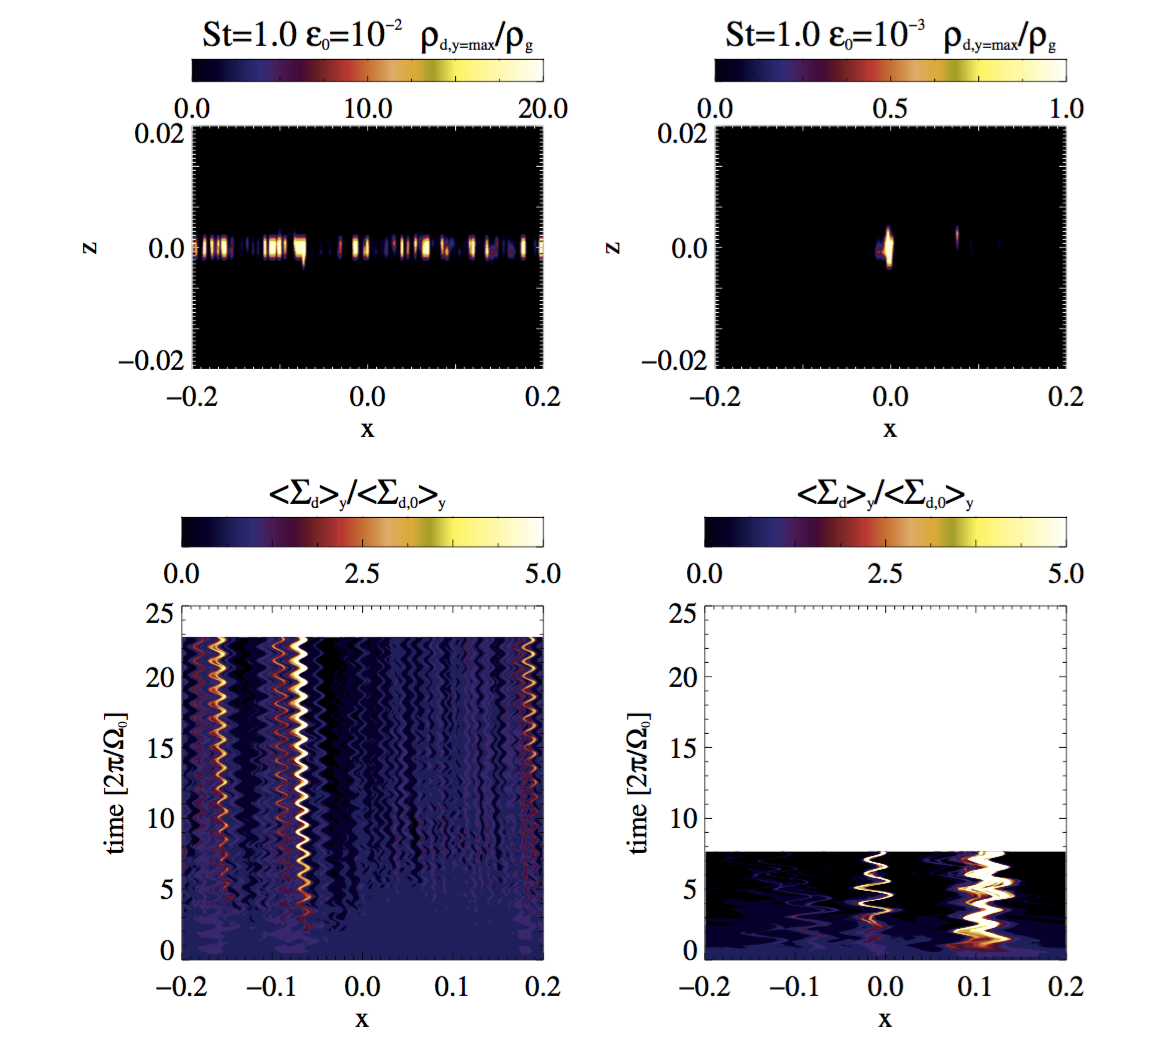
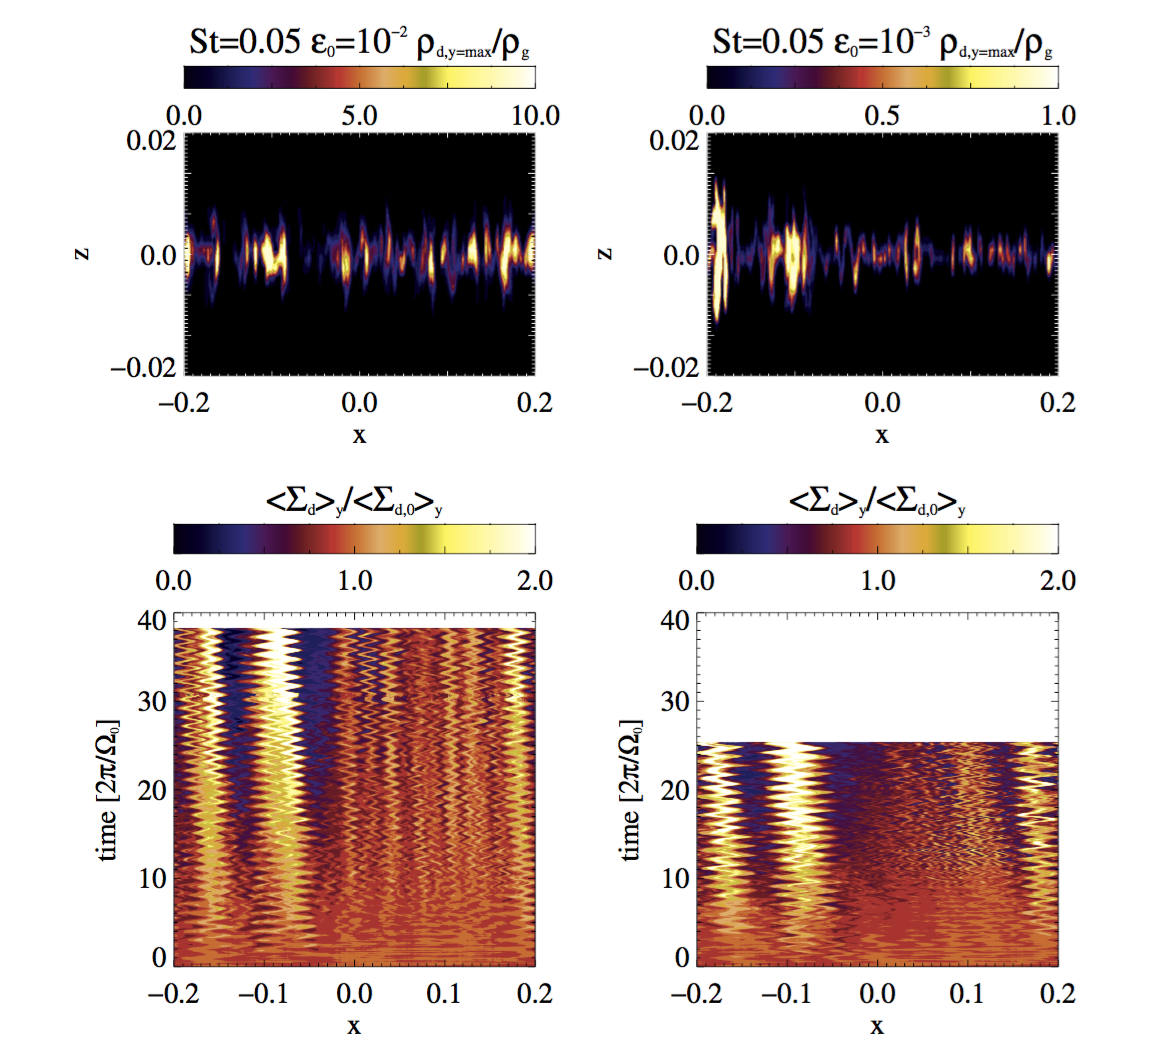
Fig. 9 shows the azimuthally-averaged pebble column density as a function of time (bottom panels), as well as the pebble density in the meridional plane of the maximum pebble density (upper panels). The left hand side panels are for and the right hand side panels for , both for pebbles. The same graphs but for pebbles are shown in Fig. 10. The time evolution shows bands of high pebble concentration that are slowly migrating radially inwards. The migration speed is equal for both and pebbles, which evidences that this drift is not the pebble flux. Indeed, this radial migration corresponds to the migration of the vortices (Paardekooper et al., 2010). The oscillations in these bands are the epicyclic motion of the trapped pebbles, induced by the internal vortex motion. We highlight that these are simulations where the vortex motion was disrupted around the midplane. The vortex column, above and below the disrupted midplane, keeps the pebbles trapped.
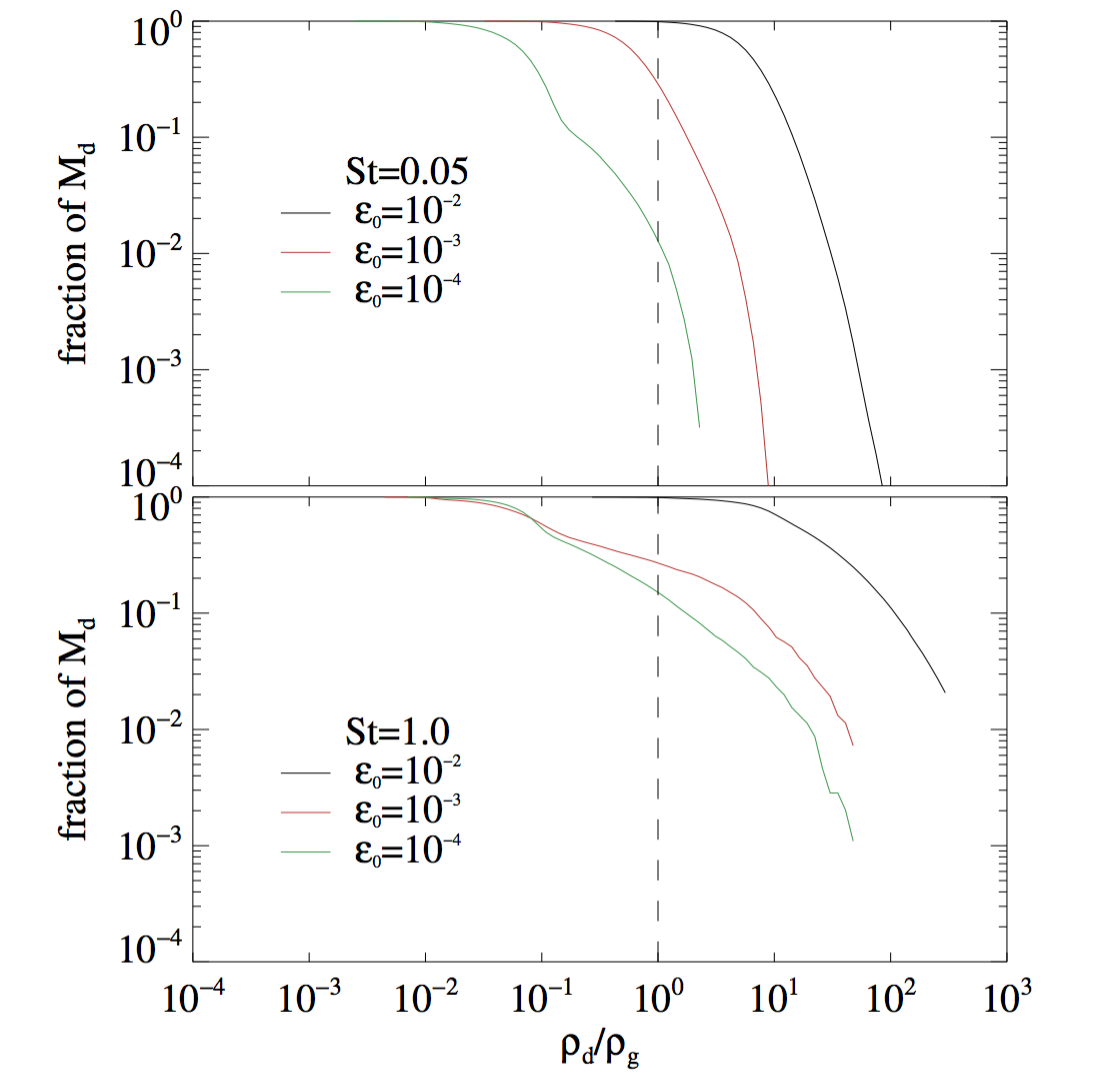
We measured the intensity of pebble accumulation at different dust-to-gas ratios. The result is shown in Fig. 11 for the two pebble sizes we consider, and three different . This quantity, the mass fraction that participates in the streaming, is also shown in the last column of Table 2 as . As expected, simulations with higher also have more mass in large bins. Promising for planet formation, even simulations with pass the threshold of , where the streaming instability sets in. While only 1% of pebbles accumulate in regions with for , this is an important step towards higher concentrations and may eventually lead to gravitational collapse.
4.2 Possible Gravitational Collapse
In 2D runs (Raettig et al., 2015) the pebble densities reached were lower than the Roche density. But in 3D, sedimentation brings the density above this threshold. We compare the achieved pebble densities with the Roche density to assess if gravitational collapse would happen had we included self-gravity in the simulation. We consider the same two disk models as in Raettig et al. (2015), one with the MMSN with (5.2 AU) = 150 g cm-2 (cases 1 and 2) and a more massive disk model with (5.2 AU) = 800 g cm-2 (cases 3 and 4). The Roche density at the two radii that we consider is (case 1 and 3) and (case 2 and 4).
In Table 3 we show the maximum dust-to-gas ratios that were reached at the end of the computational time. The last four columns show the ratio of and the gas density for the two disk profiles and the two radii. If exceeds this ratio, it means that the local dust-to-gas ratio exceeds at that radius, and the pebble accumulation would collapse in the absence of diffusion (indicated by bold face in Table 3).
We see that at 1 AU the maximum dust densities are lower than the Roche density for all runs except for pebbles with . Yet if we go to 5.2AU there are three more runs for the more massive disk model that exceed the critical . This means that the clumps with these high overdensities should collapse and form bodies that are held together by their own gravity. It is easier to form planetesimals at larger radii, because falls off more steeply than . Therefore, the ratio decreases radially, making it easier for dust densities to cross the critical density threshold.
| Run | |||||
|---|---|---|---|---|---|
| case 1 (5.2AU) | case 2 (1AU) | case 3 (5.2AU) | case 4 (1AU) | ||
| 3DF05 | 111.2 | 262 | 1607 | 49 | 301 |
| 3DF05E-3 | 8.7 | 262 | 1607 | 49 | 301 |
| 3DF05E-4 | 2.1 | 262 | 1607 | 49 | 301 |
| 3DF1 | 945.4 | 262 | 1607 | 49 | 301 |
| 3DF1E-3 | 227.7 | 262 | 1607 | 49 | 301 |
| 3DF1E-4 | 34.2 | 262 | 1607 | 49 | 301 |
4.3 Limitations
One limitation of the work is that we include vertical gravity only for the pebbles, treating the gas as unstratified. We can assess how important this would be. Since the pebble scale height is much smaller than the gas scale height , the gas density is essentially constant over a distance . At one dust scale height, the gas density is 99.0% and 99.95% of the original density for and , respectively. We do not expect this variation to be dynamically significant. An important point, though, is the exclusion of vertical shear, given by (Lyra & Umurhan, 2019)
| (23) |
This vertical shear can in principle be of dynamical consequence (even though the oscillations leading to vertical shear instability are stabilized by buoyancy in our setup with finite cooling time). Yet, let us compare this gravity-induced vertical shear to the shear the pebbles impart on the gas, due to the backreaction of the drag force. In the absence of gas, the pebbles would move at the Keplerian rate. Where the pebbles dominate dynamically (at dust-to-gas ratios above unity), in the midplane, the drag force backreaction accelerates the gas layer to move at the Keplerian rate. This establishes a strong localized vertical shear in the gas that, in turn, breaks into Kelvin-Helmholtz instability (Johansen et al., 2006) generating turbulence and diffusion. This velocity difference is of magnitude , so the shear over a distance is
| (24) |
So, for (ignoring the density gradient for the argument), the ratio of the shear given by gravity and the one caused by the pebbles is
| (25) |
which is vanishingly small in the midplane. For it yields . For , this translates into for and for . That is, the pebbles dominate the vertical shear as long as . Fundamentally, the approximation is justified because the pebble layer is very thin in comparison to the gas layer. Still, the effect of vertical gravity on the gas, even if small, should be considered in future work.
5 Conclusion
In this paper we have performed three-dimensional simulations of self-sustained baroclinic vortices, generated by the convective overstability, along with Lagrangian particles to simulate and pebbles in the disk, including the drag force and its backreaction. These values of correspond roughly to cm-sized pebbles in the inner disk ( 5 AU) and mm-sized pebbles in the outer disk ( 50 AU) for , and m-sized boulders in the inner disk and cm-sized pebbles in the outer disk for While the gas is unstratified, we included vertical gravity for the pebbles, to allow for sedimentation. Fu et al. (2014) report, via long evolution time 2D simulations of Rossby vortices, a decreased vortex lifetime as the dust feedback increases, either as a result of higher dust-to-gas ratio of larger pebble sizes. In our 3D simulations, and consistent with these 2D results, for or the vortex midplane is not disrupted, remaining coherent over the simulation period. Also consistent with the 2D results, for initial dust-to-gas ratio of we see that the vortex column in the midplane is disrupted after a very short time of pebble concentration. Raettig et al. (2015) report a similar picture in the two-dimensional simulations for pebbles when the local dust-to-gas ratio exceeded a value of 10. Due to the sedimentation of dust, this dust-to-gas ratio is reached after only a few orbital periods for both pebble sizes.
Yet, here we show with 3D models that because the pebble sedimentation occurs only in a thin layer around the midplane, the vortex column remains coherent above and below the midplane, and retains its ability to trap pebbles. The pebbles disrupt the vortex flow within the thickness of the pebble layer, but they do not destroy the vortex column. The initial concentration in the vortex grows as the simulations progress. The pebble overdensity drifts not at the pebble flux rate, but rather in the slower migration timescale of the vortex, evidencing efficient trapping. Our results are important because based on the previous 2D result suggesting eventual disruption, the vortex interpretation of ALMA observations has been called into question. We show instead that the vortex behaves like a Taylor column, and the pebbles as obstacles to the flow.
For lower dust-to-gas ratio, although the concentration remains below the high concentrations seen for , they still reach local enhancements of and, consequently, trigger the streaming instability. To determine whether the local pebble density enhancements can cause gravitational collapse were we to turn on pebble self-gravity, we compare their density with the Roche density. Depending on the disk model and radial position in the disk, we see that pebbles with a high initial dust-to-gas ratio, or pebbles with can exceed the Roche density. Had we considered selfgravity, they would have formed gravitationally bound objects.
We conclude that baroclinic vortices in 3D are an efficient mechanism for trapping and concentrating pebbles, allowing streaming instability and planetesimal formation even at subsolar metallicity. In a future work we will include selfgravity in order to assess the mass distribution formed in these baroclinic vortices.
References
- Adams & Watkins (1995) Adams, F. C., & Watkins, R. 1995, ApJ, 451, 314, doi: 10.1086/176221
- Barge & Sommeria (1995) Barge, P., & Sommeria, J. 1995, A&A, 295, L1
- Barranco et al. (2018) Barranco, J. A., Pei, S., & Marcus, P. S. 2018, ApJ, 869, 127, doi: 10.3847/1538-4357/aaec80
- Bracco et al. (1999) Bracco, A., Chavanis, P. H., Provenzale, A., & Spiegel, E. A. 1999, Physics of Fluids, 11, 2280, doi: 10.1063/1.870090
- Brandenburg & Dobler (2002) Brandenburg, A., & Dobler, W. 2002, Computer Physics Communications, 147, 471, doi: 10.1016/S0010-4655(02)00334-X
- Brandenburg & Dobler (2010) —. 2010, Pencil: Finite-difference Code for Compressible Hydrodynamic Flows, Astrophysics Source Code Library. http://ascl.net/1010.060
- Brandenburg et al. (2020) Brandenburg, A., Johansen, A., Bourdin, P. A., et al. 2020, arXiv e-prints, arXiv:2009.08231. https://arxiv.org/abs/2009.08231
- Casassus et al. (2019) Casassus, S., Marino, S., Lyra, W., et al. 2019, MNRAS, 483, 3278, doi: 10.1093/mnras/sty3269
- Chavanis (2000) Chavanis, P. H. 2000, A&A, 356, 1089
- Dubrulle et al. (1995) Dubrulle, B., Morfill, G., & Sterzik, M. 1995, Icarus, 114, 237, doi: 10.1006/icar.1995.1058
- Flock et al. (2020) Flock, M., Turner, N. J., Nelson, R. P., et al. 2020, arXiv e-prints, arXiv:2005.11974. https://arxiv.org/abs/2005.11974
- Fu et al. (2014) Fu, W., Li, H., Lubow, S., Li, S., & Liang, E. 2014, ApJL, 795, L39, doi: 10.1088/2041-8205/795/2/L39
- Güttler et al. (2010) Güttler, C., Blum, J., Zsom, A., Ormel, C. W., & Dullemond, C. P. 2010, A&A, 513, A56, doi: 10.1051/0004-6361/200912852
- Hayashi (1981) Hayashi, C. 1981, Progress of Theoretical Physics Supplement, 70, 35, doi: 10.1143/PTPS.70.35
- Inaba & Barge (2006) Inaba, S., & Barge, P. 2006, ApJ, 649, 415, doi: 10.1086/506427
- Johansen et al. (2006) Johansen, A., Henning, T., & Klahr, H. 2006, ApJ, 643, 1219, doi: 10.1086/502968
- Johansen et al. (2011) Johansen, A., Klahr, H., & Henning, T. 2011, A&A, 529, A62, doi: 10.1051/0004-6361/201015979
- Johansen et al. (2007) Johansen, A., Oishi, J. S., Mac Low, M.-M., et al. 2007, Nature, 448, 1022, doi: 10.1038/nature06086
- Johansen et al. (2009) Johansen, A., Youdin, A., & Klahr, H. 2009, ApJ, 697, 1269, doi: 10.1088/0004-637X/697/2/1269
- Kerswell (2002) Kerswell, R. R. 2002, Annual Review of Fluid Mechanics, 34, 83, doi: 10.1146/annurev.fluid.34.081701.171829
- Klahr & Bodenheimer (2006) Klahr, H., & Bodenheimer, P. 2006, ApJ, 639, 432, doi: 10.1086/498928
- Klahr & Hubbard (2014) Klahr, H., & Hubbard, A. 2014, ApJ, 788, 21, doi: 10.1088/0004-637X/788/1/21
- Klahr & Henning (1997) Klahr, H. H., & Henning, T. 1997, Icarus, 128, 213, doi: 10.1006/icar.1997.5720
- Lesur & Papaloizou (2009) Lesur, G., & Papaloizou, J. C. B. 2009, A&A, 498, 1, doi: 10.1051/0004-6361/200811577
- Lesur & Papaloizou (2010) —. 2010, A&A, 513, A60, doi: 10.1051/0004-6361/200913594
- Lin (2012a) Lin, M.-K. 2012a, ApJ, 754, 21, doi: 10.1088/0004-637X/754/1/21
- Lin (2012b) —. 2012b, MNRAS, 426, 3211, doi: 10.1111/j.1365-2966.2012.21955.x
- Lin (2013) —. 2013, ApJ, 765, 84, doi: 10.1088/0004-637X/765/2/84
- Lovelace et al. (1999) Lovelace, R. V. E., Li, H., Colgate, S. A., & Nelson, A. F. 1999, ApJ, 513, 805, doi: 10.1086/306900
- Lyra (2009) Lyra, W. 2009, PhD thesis, Uppsala University
- Lyra (2013) Lyra, W. 2013, in European Physical Journal Web of Conferences, Vol. 46, European Physical Journal Web of Conferences, 04003, doi: 10.1051/epjconf/20134604003
- Lyra (2014) —. 2014, ApJ, 789, 77, doi: 10.1088/0004-637X/789/1/77
- Lyra et al. (2008a) Lyra, W., Johansen, A., Klahr, H., & Piskunov, N. 2008a, A&A, 491, L41, doi: 10.1051/0004-6361:200810626
- Lyra et al. (2008b) —. 2008b, A&A, 479, 883, doi: 10.1051/0004-6361:20077948
- Lyra et al. (2009a) —. 2009a, A&A, 493, 1125, doi: 10.1051/0004-6361:200810797
- Lyra et al. (2009b) Lyra, W., Johansen, A., Zsom, A., Klahr, H., & Piskunov, N. 2009b, A&A, 497, 869, doi: 10.1051/0004-6361/200811265
- Lyra & Klahr (2011) Lyra, W., & Klahr, H. 2011, A&A, 527, A138, doi: 10.1051/0004-6361/201015568
- Lyra & Lin (2013) Lyra, W., & Lin, M.-K. 2013, ApJ, 775, 17, doi: 10.1088/0004-637X/775/1/17
- Lyra & Mac Low (2012) Lyra, W., & Mac Low, M.-M. 2012, ApJ, 756, 62, doi: 10.1088/0004-637X/756/1/62
- Lyra et al. (2017) Lyra, W., McNally, C. P., Heinemann, T., & Masset, F. 2017, AJ, 154, 146, doi: 10.3847/1538-3881/aa8811
- Lyra et al. (2018) Lyra, W., Raettig, N., & Klahr, H. 2018, Research Notes of the American Astronomical Society, 2, 195, doi: 10.3847/2515-5172/aaeac9
- Lyra et al. (2015) Lyra, W., Turner, N. J., & McNally, C. P. 2015, A&A, 574, A10, doi: 10.1051/0004-6361/201424919
- Lyra & Umurhan (2019) Lyra, W., & Umurhan, O. M. 2019, PASP, 131, 072001, doi: 10.1088/1538-3873/aaf5ff
- Manger & Klahr (2018) Manger, N., & Klahr, H. 2018, MNRAS, 480, 2125, doi: 10.1093/mnras/sty1909
- Manger et al. (2020) Manger, N., Klahr, H., Kley, W., & Flock, M. 2020, MNRAS, 499, 1841, doi: 10.1093/mnras/staa2943
- Marcus et al. (2016) Marcus, P. S., Pei, S., Jiang, C.-H., & Barranco, J. A. 2016, ApJ, 833, 148, doi: 10.3847/1538-4357/833/2/148
- Marcus et al. (2015) Marcus, P. S., Pei, S., Jiang, C.-H., et al. 2015, ApJ, 808, 87, doi: 10.1088/0004-637X/808/1/87
- McNally et al. (2012) McNally, C. P., Maron, J. L., & Mac Low, M.-M. 2012, ApJS, 200, 7, doi: 10.1088/0067-0049/200/1/7
- Meheut et al. (2010) Meheut, H., Casse, F., Varniere, P., & Tagger, M. 2010, A&A, 516, A31, doi: 10.1051/0004-6361/201014000
- Meheut et al. (2012a) Meheut, H., Keppens, R., Casse, F., & Benz, W. 2012a, A&A, 542, A9, doi: 10.1051/0004-6361/201118500
- Meheut et al. (2012b) Meheut, H., Meliani, Z., Varniere, P., & Benz, W. 2012b, A&A, 545, A134, doi: 10.1051/0004-6361/201219794
- Meheut et al. (2012c) Meheut, H., Yu, C., & Lai, D. 2012c, MNRAS, 422, 2399, doi: 10.1111/j.1365-2966.2012.20789.x
- Miranda et al. (2017) Miranda, R., Li, H., Li, S., & Jin, S. 2017, ApJ, 835, 118, doi: 10.3847/1538-4357/835/2/118
- Nelson et al. (2013) Nelson, R. P., Gressel, O., & Umurhan, O. M. 2013, MNRAS, 435, 2610, doi: 10.1093/mnras/stt1475
- Paardekooper et al. (2010) Paardekooper, S.-J., Lesur, G., & Papaloizou, J. C. B. 2010, ApJ, 725, 146, doi: 10.1088/0004-637X/725/1/146
- Pfeil & Klahr (2020) Pfeil, T., & Klahr, H. 2020, arXiv e-prints, arXiv:2008.11195. https://arxiv.org/abs/2008.11195
- Raettig et al. (2015) Raettig, N., Klahr, H., & Lyra, W. 2015, ApJ, 804, 35, doi: 10.1088/0004-637X/804/1/35
- Raettig et al. (2013) Raettig, N., Lyra, W., & Klahr, H. 2013, ApJ, 765, 115, doi: 10.1088/0004-637X/765/2/115
- Richard et al. (2016) Richard, S., Nelson, R. P., & Umurhan, O. M. 2016, MNRAS, 456, 3571, doi: 10.1093/mnras/stv2898
- Safronov (1960) Safronov, V. S. 1960, Annales d’Astrophysique, 23, 979
- Shakura & Sunyaev (1973) Shakura, N. I., & Sunyaev, R. A. 1973, A&A, 24, 337
- Sierra et al. (2017) Sierra, A., Lizano, S., & Barge, P. 2017, ApJ, 850, 115, doi: 10.3847/1538-4357/aa94c1
- Stoll & Kley (2014) Stoll, M. H. R., & Kley, W. 2014, A&A, 572, A77, doi: 10.1051/0004-6361/201424114
- Surville et al. (2016) Surville, C., Mayer, L., & Lin, D. N. C. 2016, ApJ, 831, 82, doi: 10.3847/0004-637X/831/1/82
- Tanga et al. (1996) Tanga, P., Babiano, A., Dubrulle, B., & Provenzale, A. 1996, Icarus, 121, 158, doi: 10.1006/icar.1996.0076
- Toomre (1964) Toomre, A. 1964, ApJ, 139, 1217, doi: 10.1086/147861
- van der Marel et al. (2013) van der Marel, N., van Dishoeck, E. F., Bruderer, S., et al. 2013, Science, 340, 1199, doi: 10.1126/science.1236770
- van der Marel et al. (2020) van der Marel, N., Birnstiel, T., Garufi, A., et al. 2020, arXiv e-prints, arXiv:2010.10568. https://arxiv.org/abs/2010.10568
- Weidenschilling (1977) Weidenschilling, S. J. 1977, APSS, 51, 153, doi: 10.1007/BF00642464
- Weidenschilling (1980) —. 1980, Icarus, 44, 172, doi: 10.1016/0019-1035(80)90064-0
- Whipple (1972) Whipple, F. L. 1972, in IAU Symposium, Vol. 45, The Motion, Evolution of Orbits, and Origin of Comets, ed. G. A. Chebotarev, E. I. Kazimirchak-Polonskaia, & B. G. Marsden, 401
- Zsom et al. (2010) Zsom, A., Ormel, C. W., Güttler, C., Blum, J., & Dullemond, C. P. 2010, A&A, 513, A57, doi: 10.1051/0004-6361/200912976