The University of Arizona, Tucson, AZ 85721, 11email: fmelia@email.arizona.edu
The Anomalous 21-cm Absorption at High Redshifts
Abstract
The EDGES collaboration has reported the detection of a global 21-cm signal with a plateau centered at 76 MHz (i.e., redshift 17.2), with an amplitude of mK. This anomalous measurement does not comport with standard cosmology, which can only accommodate an amplitude mK. Nevertheless, the line profile’s redshift range () suggests a possible link to Pop III star formation and an implied evolution out of the ‘dark ages.’ Given this tension with the standard model, we here examine whether the observed 21-cm signal is instead consistent with the results of recent modeling based on the alternative Friedmann-Lemaître-Robertson-Walker cosmology known as the universe, showing that—in this model—the CMB radiation might have been rethermalized by dust ejected into the IGM by the first-generation stars at redshift . We find that the requirements for this process to have occurred would have self-consistently established an equilibrium spin temperature K in the neutral hydrogen, via the irradiation of the IGM by deep penetrating X-rays emitted at the termination shocks of Pop III supernova remnants. Such a dust scenario has been strongly ruled out for the standard model, so the spin temperature ( K) inferred from the 21-cm absorption feature appears to be much more consistent with the profile than that implied by CDM, for which adiabatic cooling would have established a spin temperature K.
1 Introduction
The EDGES collaboration has recently reported the detection of a 21-cm signal in absorption between redshifts 20 and 15, with an amplitude of 500 mK, roughly twice the strength expected from cosmological simulations Bowman:2018 . The most likely origin of this signal is the absorption of CMB photons by neutral atomic hydrogen and, given that it arises from the redshift interval in which the first generation of (Pop III) stars is believed to have formed, may have important implications for the early phase of cosmic structure formation.
A complication with the analysis of this signal, however, is the challenge of making this measurement, given the very large foreground of Galactic diffuse synchrotron emission. Though this foreground is spectrally smooth above 50 MHz, it unfortunately requires several components for a proper modeling Bernardi:2015 . The reality of the anomalous 21-cm absorption feature associated with the cosmic microwave background (CMB) has therefore been called into question. Nevertheless, Bowman et al. (2018) performed numerous hardware and processing tests to validate their detection, demonstrating that no other astronomical or atmospheric mechanism could have produced the observed profile. Until future observations, e.g., with the Square Kilometre Array (SKA; ref. Pritchard:2014 ), can confirm or reject this finding, the implications of such a global high-redshift 21-cm absorption line on cosmological models remain somewhat ambiguous and warrant further investigation. In this paper, we shall advocate for the reality of this anomalous signal and adopt the following essential characteristics: the 21-cm line extends over the redshift range , with an amplitude of mK at the confidence level. Its plateau is centered at a frequency of MHz, corresponding to a redshift of . The depth of this feature is effectively away from the prediction of standard cosmology (CDM) which, as we shall discuss shortly, cannot accommodate an amplitude greater than mK.
Given the disparity between the measured and predicted profile of the global 21-cm line, our principal focus in this paper will be to gauge whether this anomalous measurement might instead offer some observational support for the alternative Friedmann-Lematre-Robertson-Walker (FLRW) cosmology known as the universe MeliaShevchuk:2012 ; Melia:2020a , which has much in common with CDM, differing with it principally via an essential constraint from general relativity referred to as the “zero active mass condition,” i.e., an equation-of-state in the cosmic fluid, in terms of the total energy density, , and pressure, Melia:2019a .
As we shall demonstrate in this paper, the gas temperature at required to produce the observed 21-cm signal is consistent with the physical conditions of the intergalactic medium (IGM) expected during this epoch, if the expansion history of the Universe reflects the dynamics implied by this equation-of-state. In § 2, we shall summarize the status of this recent work and then, in § 3, describe the stellar and IGM environment expected in this model. We end with a discussion of our results and a conclusion in § 4.
2 The Universe
This FLRW cosmology has been under development for over a decade, and its predictions have been tested using a broad range of data, incorporating both integrated and differential signatures at all redshifts (for some recent developmental papers, see refs. Melia:2016 ; Melia:2017 ; Melia:2019a ; for a summary of the comparative tests, see Table 2 in ref. Melia:2018a ; a complete description of this model is presented in ref. Melia:2020a ). The zero active mass condition implies an equation-of-state , with at all epochs, under the assumption that the pressure of matter is always negligible. Throughout this paper, , and denote, respectively, the radiation, matter and dark-energy densities, and . We shall write in the special case where dark-energy is assumed to be a cosmological constant.
In this picture, the luminosity distance (z) and Hubble rate of expansion have very simple forms, dependent only on the parameter :
| (1) |
and
| (2) |
The cosmology is flat (i.e., ), for otherwise the gravitational radius would not equal Melia:2018b . Therefore, from the first Friedmann equation MeliaShevchuk:2012 , one easily finds that
| (3) |
where
| (4) |
is the critical energy density. For simplicity, we scale all relevant quantities to the Planck value of though, in reality, the actual in is somewhat different. Even so, it would differ from this value by no more than (see, e.g., ref. MeliaMaier:2013 ).
Our imposition of the zero active mass constraint on the cosmic fluid implies that the fractional representation of the various species is modified from the evolution seen in CDM. As we shall discuss further below, this is partly the reason why the rate of structure formation in this model, notably the halo growth rate and stellar formation rate, differ considerably from their counterparts in the standard model. Let us define the dark energy density as . The equation-of-state in does not tell us the value of , but we know from observations of the local Universe that of at low redshifts is comprised of (luminous and dark) matter. Thus, if at , the expression for implies that , precluding any possibility of dark energy being a cosmological constant. We do not know whether this equation-of-state changes with redshift, but if we assume for simpicity that is constant, then the early Universe must have both radiation and dark energy, in proportions such that at . Dark energy is therefore always present in , though its fractional contribution to evolves slightly from at early times to locally. In concert with this change, radiation is gradually replaced by matter, with
| (5) |
and
| (6) |
If we further reasonably assume that the radiation is always a blackbody, the temperature evolves according to the standard free-streaming relation
| (7) |
after decoupling (at ), but follows the modified form
| (8) | |||||
at high redshifts.
In recent work Melia:2020b , we discussed the reasons (both theoretical and observational) why in this model cannot be as large (i.e., ) as in the standard model. Indeed, we may see right away from Equations (7) and (8) that this transition must occur, crudely, at the redshift where these two expressions overlap, i.e., at . More quantitatively, Planck Planck:2016 has identified an angular scale on the last scattering surface (LSS), interpreted as the acoustic horizon—the maximum distance traveled by sound waves in the early universe (see, e.g., refs. PeeblesYu:1970 ; White:1994 ; Hu:1995 ; Seo:2005 ). The comoving distance corresponding to this scale is thought to have remained constant thereafter.
A characteristic scale has also been seen in the correlation function of galaxies and the Ly- forest Meiksin:1999 ; Seo:2005 ; Jeong:2006 ; Crocce:2006 ; Eisenstein:2007 ; Nishimichi:2007 ; Seo:2010 ; Font-Ribera:2014 ; Delubac:2015 ; Alam:2017 . Interpreting the peak seen in large galaxy surveys as the subsequent manifestation of the acoustic horizon, the baryon acoustic oscillation (BAO) comoving scale in the context of has been determined to have the value Mpc MeliaLopez:2017 ; Melia:2018a , and it is straightforward to show from Equation (1) that
| (9) |
where is the gravitational (or Hubble) radius today. Taking the measurement errors into account, we therefore infer that (in the cosmology),
| (10) |
corresponding to a cosmic time Myr. Matter could therefore not have been ionized at this redshift, so the recombination picture for the origin of the CMB could not work in this model. A recent analysis Melia:2020b of the dust injected into the IGM by Pop III stars instead suggests that the primordial radiation field would have been rethermalized by grains at to produce the CMB we see today. In this picture, the CMB anisotropies therefore reflect the large-scale structure seen just prior to the onset of reionization at .
Additional evidence for the value of in Equation (10) is provided by the CMB angular correlation function MeliaLopez:2018 . The lack of large-angle correlations in the CMB temperature fluctuations conflicts with the predictions of inflationary CDM at a high level of confidence (; ref. Copi:2015 ). Following a careful analysis of the latest Planck release, we now understand that the weakness of the large-angle correlations is probably due to a non-zero minimum wavenumber in the primordial power spectrum MeliaLopez:2018 . Its relevance to the subject of this paper is that, if real, the inferred value of , in the context of , corresponds to a redshift —a compelling confirmation of the estimate shown in Equation (10), based on an entirely different argument.
But is it really possible to even contemplate a dusty origin for the CMB, given that all of the evidence today appears to overwhelmingly favour recombination at ? In the next section, we shall summarize the extensive analysis carried out to address this far-fetched idea. As it turns out, such a model was actually seriously considered in the late 1900’s before its evident flaws made it redundant. But we now know that, while a dust model for the CMB is untenable in CDM, it may still be viable in other cosmologies. As it turns out, dust could still play a critical role in forming the microwave background if is the correct model. And as we shall see, this scenario also self-consistently accounts for the 21-cm signal measured by the EDGES collaboration, which (subject to confirmation by future measurements) is otherwise not consistent with the standard model.
3 Reassessing Dust’s Role in Forming the CMB
Placing the last scattering surface (LSS) at may seem to be at odds with many kinds of observation, but this is only true in the case of CDM. As shown in ref. Melia:2020b , there are at least three principal observational signatures one may use to distinguish a CMB originating via recombination at from one due to reprocessing by dust at . These are: the spectrum itself, which appears to be a true blackbody Mather:1990 ; the presence or absence of recombination lines Rubino-Martin:2006 ; Rubino-Martin:2008 , and a test of whether the angular power spectrum varies with frequency Planck:2016 .
The physical attributes required of an LSS at in the context of ironically echo some of the theoretical ideas explored for a dusty origin of the CMB several decades ago Rees:1978 ; Rowan:1979 ; Wright:1982 . Before attempting to rescue this now defunct model in order to explain the anomalous 21-cm signal, however, it is essential to consider whether such a proposal even makes sense based on what we know today.
The first issue is quite obvious: recombination lines ought to be present at some level in the CMB spectrum if the standard picture is correct, whereas dust rethermalization at would have wiped all of them out. Extensive simulations have already been carried out to predict the level at which we should see such lines in CDM Rubino-Martin:2006 ; Rubino-Martin:2008 , but unfortunately the effect of recombination lines on the angular power spectrum is expected to be quite small. Though it may eventually be separated from other effects with the improved sensitivities of future experiments, there is no evidence today of recombination lines in the CMB, so this test must await future developments.
Arguably the most convincing observation made to support the recombination scenario was COBE’s discovery Mather:1990 that the CMB’s spectrum is a near perfect blackbody. We shall not repeat the argument made in ref. Melia:2020b , but it is not difficult to show that optically thick dust in thermal equilibrium with the radiation it rethermalizes near the photosphere (at the LSS) also produces a near perfect blackbody field, as was already suggested by some of the earlier work Rowan:1979 . Thus, the key issue is not that dust opacity is frequency dependent but, rather, that dust would need to reach local thermal equilibrium with the radiation. This question hinges on how much dust was produced by Pop III stars in the redshift range , and we shall discuss this in § 3.1 below.
The third issue is whether the angular power spectrum of the CMB is frequency-dependent, as one might expect if the anisotropies in the temperature distribution across the sky vary among surveys conducted at different wavelengths. One would not expect photospheric optical depths to affect the observed distribution of fluctuations with Thomson scattering because the optical depth it produces is independent of frequency. Maps made at different wavelengths should therefore be identical in CDM. But this would not be the case if the opacity were frequency dependent, as would happen in the case of dust. Though photospheric depth effects might not significantly change the larger fluctuations from one map to another, they could still alter the observed anisotropy distribution on smaller scales, which would in turn produce variations in the inferred CMB power spectrum constructed at different wavelengths. A careful analysis of this frequency dependence Planck:2018 shows that indeed the location of the LSS changes somewhat with frequency. Variations can be as high as at , increasing to for . If real, these changes would argue against a Thomson scattering opacity, but would be consistent with the dust model in (see ref. Melia:2020b ) as long as the location of the LSS were restricted to the redshift range . This period would have lasted Myr, after which the Pop III and the early Pop II supernovae would have completely destroyed the dust, making the IGM transparent again and initiating the epoch of reionization at . Under these constraints, a frequency-dependent opacity would have impacted the CMB spectrum by no more than a few percent, consistent with the current Planck observational measurements.
3.1 Pop III Stars in the Universe
Assessing the CMB-imposed constraints on the Pop III star formation rate and evolution is critical to understanding whether the IGM at could also have produced the observed global 21-cm signal. Again, we won’t repeat the detailed analysis carried out in ref. Melia:2020b , but we shall here merely summarize the key findings from that work. In order for every photon in the CMB to have been absorbed by dust prior to , we would require the dust number density to have been cm-3 for a bulk density of g cm-3 of silicate grains, and a grain radius micron. This restricts the IGM metallicity near the end of the Pop III star formation and evolution era to of the solar value, comfortably small to avoid any obvious inconsistency with the general perception that the bulk of today’s abundances grew across subsequent phases of star formation.
In order for the dust temperature to have remained in equilibrium with the CMB during that period, two important factors had to be satisfied. The first has to do with the average heating and cooling rates for a given dust particle, while the second is based on the fact that each absorption of a photon produces a quantum change in the dust particle’s temperature, and is thus strongly dependent on its size Weingartner:2001 ; Draine:2001 . Under the conditions expected in the IGM at that redshift, it would have taken a m sized particle roughly seconds to reach equilibrium at a dust temperature K, so the first condition would have been satisfied trivially. The second issue is more constraining. The assumption of a smooth evolution in starts to break down for grains smaller than m Draine:2001 , at which point the heating starts to produce temperature spikes. Putting these estimates together, we see that the dust model required for consistency with the observed CMB spectrum would therefore be based on silicates with size m, perhaps even larger, though sizes much larger than m would violate our earlier estimate of and the reasonable value of the metallicity .
Let us now see what these constraints have to say about the Pop III star formation rate and evolution. Believed to have reached masses Bromm:2004 ; Glover:2004 , these stars emitted copious high-energy radiation that ionized the halos within which they were born. At the end of their brief ( yr) lives, most of them exploded as SNe Heger:2003 , ejecting heavy elements into the IGM Whalen:2008 , also producing X-rays via shock acceleration that penetrated deeply into the IGM (more on this below). Given the above estimates for the dust size and number density, one can infer that roughly g Mpc-3 (co-moving volume) of dust material had to be injected into the IGM during this epoch (). Thus, adopting a typical mass , with a typical ejection fraction of Heger:2002 , we see that Mpc-3 Pop III stars must have exploded as SNe between and to provide the dust required to completely thermalize with the CMB radiation. As we shall see below, this star-formation rate (SFR) is critical to understanding how the global 21-cm signal could have been produced within the context of .
Those familiar with current models of star formation during this epoch (see, e.g., refs. Xu:2016a ; Xu:2016b ; Mebane:2018 ; Visbal:2018 ; Jaacks:2019 ; Sarmento:2019 would realize that such an aggressive SFR would be orders of magnitude greater than what is expected in the context of CDM. Comparable simulations have not yet been completed using as the background cosmology, but already we have firm indications that large-scale structure (LSS) formation proceeded at a very different rate in this model, due to several influential factors, including: (i) the seeding of a primordial fluctuation spectrum Melia:2019b ; (ii) the alternative redshift dependence of the relative abundances (Eqns. 5, 6); (iii) the different timeline versus redshift Melia:2014 ; (iv) the modified growth equation, which has now been solved semi-analytically Yennapureddy:2018 ; Yennapureddy:2019 ; Yennapureddy:2020 . What emerges from a comparison of LSS formation in these two cosmologies is a significant difference in the growth rate of stellar mass at , reaching values exceeding at . The observational evidence one may use to distinguish between these two scenarios is still controversial and strongly debated, but a quick inspection of figures 2–7 in ref. Yennapureddy:2019 would reveal that the data do not yet rule out the higher rates predicted by . Indeed, the currently inferred halo mass function appears to differ from what is expected at in CDM by over 4 orders of magnitude Steinhardt:2016 . Some additional support for the timeline in is also provided by its consistency with the early appearance of supermassive black holes Melia:2015 , which would otherwise pose quite a challenge to the time versus redshift relation in the standard model.
In addition to the dust they subsequently ejected into the IGM, Pop III stars also emitted copious amounts of UV light during their lives, and X-rays via their supernova remnants. A typical Pop III star with mass was a blackbody emitter with radius and surface effective temperature K. It is straightforward to estimate from this that, during their evolution, they would have bathed the IGM with an energy density erg Mpc-3. Compared to the energy density in the CMB at that time, this would have amounted to no more than of the total radiation field, but these UV photons would have had important consequences concerning the HI gas and spin temperature we shall be discussing shortly.
3.2 The Gas and Spin Temperature at in the Universe
The principal effort in modeling the global 21-cm signal is directed towards understanding the gas kinetic () and HI spin temperature () during the epoch () when the absorption line formed. The 21-cm line is the triplet-to-singlet hyperfine transition of the atomic hydrogen ground state due to the coupling of the magnetic moments of the proton and electron (for a review, see, e.g., ref. Pritchard:2012 ). For a system in thermal equilibrium, the relative populations of the two spin levels are given by the ratio
| (11) |
where eV is the energy difference between the two distinct spin states, and is the ratio of the statistical degeneracy factors of the two levels.
The spin temperature coupled to either the gas or CMB temperature, depending on which physical processes dominated the excitation of the line at . There appear to be three dominant effects: (1) the absorption of CMB photons which, in the absence of other interactions, would imply that ; (2) nucleon-nucleon collisions, which would couple to the gas temperature ; and (3) excitation due to the so-called Wouthuysen-Field effect Wouthuysen:1952 . In this process, Ly- photons produced, say, by the Pop III stars, excited the ground state of atomic hydrogen to the 2P level, which then re-emited Ly- photons and entered either of the two spin states, creating an asymmetric redistribution of the electrons between the hyperfine levels. In equilibrium Hirata:2006 , one has
| (12) |
In this expression, is the collisional coupling coefficient for H-H and H-e-1 scatterings Zygelman:2005 . The middle term accounts for the Wouthuysen-Field effect, with a coupling coefficient Hirata:2006
| (13) |
where is a factor of order unity describing the detailed atomic physics of the scattering mechanism, and is the Ly- background (number) intensity in units of cm-2 s-1 Hz-1 sr-1. This process couples to an effective color temperature which, however, never deviates from by more than (see fig. 4 in ref. Hirata:2006 ), due to the recoils induced by repeated scatterings.
It is straightforward to estimate from the total Pop III emissivity discussed in the previous subsection. One finds for the redshift range in that
| (14) |
This value does not include the possible contribution from nascent quasars, which might have started forming during this epoch as well, so it should be viewed as a lower limit. Thus, the coefficient in Equation (12) would have been , and consequently the spin temperature would have been tightly coupled to the gas temperature throughout the period where the global 21-cm absorption line was formed.
The 21-cm brightness temperature (relative to the CMB) averaged over the whole sky is given by ref. Zaldarriaga:2004
| (15) | |||||
where is the fraction of neutral hydrogen ( in this regime), is the fractional overdensity (which is smaller than , so that ), and and are, respectively, the matter and baryonic densities today in units of the critical density. The quantity is the velocity gradient along the line of sight and is approximately equal to within this redshift range.
The application of Equation (15) to the observed global 21-cm signal thus implies that (and therefore ) must have been approximately K during this epoch (remembering that is actually negative), compared to the CMB temperature K. So the key question is now “How did the gas reach this equilibrium at ?”
Let us first consider the situation in the standard model. The conventional assumption in CDM is that, while the radiation effectively decoupled from the baryons at (LSS), the particles were much less numerous and therefore remained thermalized with the radiation for much longer Peebles:1968 . The rate of energy transfer per unit volume between the CMB photons and free electrons may be written Weymann:1965
| (16) |
where is the Thomson cross section, is the radiation constant, is the Boltzmann constant, is the electron mass, is the photon temperature, is the electron temperature, is the nucleon number density and is the free electron fraction. One further assumes that the electrons preserved thermal contact with the nucleons, so that was effectively the gas temperature . Using this expression, one may find the redshift at which thermal contact between the matter and the CMB was broken, which occured when the ratio of the heat content of the matter to the heat-transfer rate in Equation (16) exceeded the characteristic expansion time of the Universe. Beyond this time, matter continued to cool adiabatically, , at a rate faster than radiation. In CDM, one finds that , and so one expects the gas temperature at to have been
| (17) |
But as we have just seen, in order to account for the observed global 21-cm signal, the gas temperature could not have been higher than K. Thus, to correctly account for the observed profile of the 21-cm absorption line, adiabatic cooling in the standard model would have to have started much earlier, at . This is the reason the 21-cm signal measured by EDGES is considered to be an anomaly.
In the universe, the temperature at high redshifts (Eq. 8) is lower than that in the standard model, so adiabatic cooling of the gas would have started even earlier than in CDM, due to the much smaller free electron fraction . Applying the same matter-radiation decoupling algorithm described above, one finds that in this model, producing a much colder gas than implied by Equation (17). This too is inconsistent with the 21-cm line profile, unless some other mechanism intervened to reheat the gas at .
This is where the Pop III stars we discussed in the previous subsection enter the picture. We pointed out that these early stellar sources not only injected large quantities of dust and UV photons (which were critical in coupling the spin temperature to the gas temperature via Eqn. 12) into the IGM, but also irradiated the cosmic background with an X-ray intensity emitted at the termination shocks of their supernova remnants. As we pointed out, however, an important caveat with this analysis is that the Pop III star formation rate required for this to work would have greatly exceeded the predictions in CDM. It would have been much more in line with the expansion scenario expected in , though the question still remains open regarding which of them is favoured by the data (see, e.g., ref. Steinhardt:2016 ).
To produce the amount of dust required to rethermalize the CMB radiation at (see Eqn. 10), we found in § 3.1 that
| (18) |
Pop III stars of average mass must have terminated their lives as supernova explosions. Such stars reach this terminal state as pair-instability explosions Heger:2002 , releasing
| (19) |
of energy per event. Within the ejecta, a fraction of the total supernova energy is converted into accelerated electrons. The efficiency of this process depends on the density of the medium surrounding the supernova. For low densities, the shock is weak and the efficiency is low. Supernova remnants impacting high-density clouds in the local Universe can have much larger efficiencies. We still do not have a precise understanding of how the shocks would have evolved in the early IGM, though simulations suggest that the efficiency might have been near the bottom of the range Reynolds:2008 , i.e.,
| (20) |
The relativistic electrons produced in this fashion radiated a fraction of their energy as X-rays, the dominant radiation field responsible for heating the IGM. This fraction is also subject to uncertainties, e.g., the strength of the magnetic field in the radiation zone but, based on the modeling of supernova remnants in the local Universe, one would expect
| (21) |
Some attention has already been paid to the fate of this X-radiation in the high-redshift IGM, once the first generation of Pop III stars brought an end to the dark ages. Prior to the reionization of HI gas, UV photons would have been mostly trapped near their sources, creating localized HII bubbles, but X-rays would have penetrated to much larger distances. They therefore most likely constituted the high-energy radiative background throughout the IGM, initiating the ionization of the neutral gas far from the stars (see, e.g., ref. FurlanettoStoever:2010 . Most of their energy would have been deposited indirectly, starting with photoionization and subsequently dispersed by the fast electrons released in this process. It is believed that the electrons energized by X-rays from the Pop III supernovae Oh:2001 ; Venkatesan:2001 , were responsible for heating the IGM before reionization began in earnest KuhlenMadau:2005 ; Furlanetto:2006 . Some have even speculated—well before the EDGES measurement was known—that this heating and ionization could have important observational consequences on the highly redshifted 21-cm signal produced by the early IGM Furlanetto:2006 ; KuhlenMadau:2006 ; Pritchard:2007 .
In their detailed simulations of the energy deposited into the IGM from the photoionization of neutral atoms by X-rays, ref. FurlanettoStoever:2010 found that ejected electrons with energy eV could not interact with any atoms or ions and thus dispersed all of their energy as heat. As the photon energy increased, however, approaching the X-ray region of the spectrum, more and more excitation and ionization processes became available and the fraction of energy deposited as heat decreased. But this trend came to an end once the number of such process had been saturated, and the fraction of incoming energy deposited as heat eventually approached a reasonably constant value at keV. These authors found that in highly neutral gas, with , approximately of the electron’s energy was deposited as heat, with the remainder split roughly equally between ionization and excitation. They also found that these results are insensitive to at high energies, because most of the heating comes from secondary electrons with energies below 10 eV. Since, in addition, only a small fraction of the X-ray photon’s energy is used to photoionize hydrogen in this regime, we may simply write
| (22) |
for the fraction of X-ray energy deposited as heat throughout the IGM during the time (i.e., ) that Pop III stars ended their lives as supernova explosions.
Thus, all told, the Pop III X-ray energy converted into IGM heat during the epoch may be estimated as follows:
| (23) | |||||
As we have seen, adiabatic cooling of the gas in would have resulted in an IGM at much colder than , so it is safe to assume that at would have been entirely due to the X-ray re-heating implied by Equation (23). And if we were to put
| (24) |
(given that both the electron and densities were negligible compared to ), we would find that
| (25) | |||||
One would like to think that the remarkable consistency between the spin temperature ( K) measured by the EDGES collaboration and the gas temperature we have just estimated ( K) is strong evidence in favour of this model. Of course, this is almost certainly partially a coincidence, given that every parameter in Equation (25) contributing to this outcome was assigned its fiducial value. On the other hand, the fact that this analysis produced this level of consistency without any optimization of the physical inputs does suggest that the scenario we have explored here is at least viable. None of the estimates had to be ‘stretched’ to unlikely values, and all were internally consistent with the basic premise that the CMB we see was produced by dust rethermalization of the primordial radiation field during the Pop III star-formation era. The principal caveat with this analysis concerns the Pop III star formation rate, which differs by several orders of magnitude between the CDM and cosmologies. The picture we have painted in this paper holds together self-consistently as long as the rate is correct, but would break down if future observations reveal that the large-scale structure formation rate at was more in line with the predictions of the standard model.
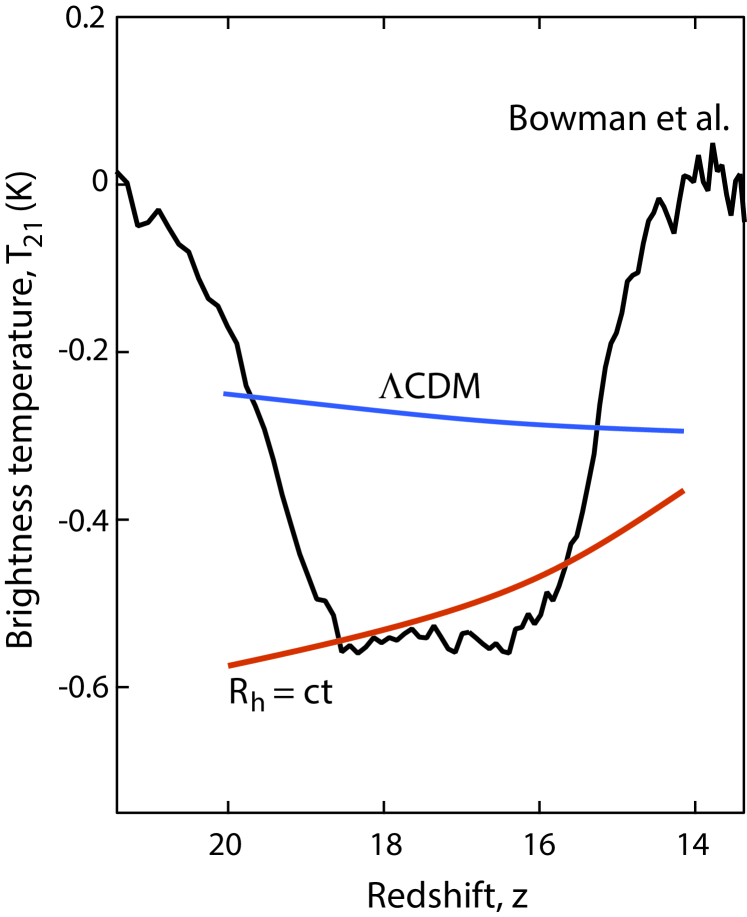
Once the global 21-cm signal is confirmed by upcoming observations, a more detailed simulation than that attempted here ought to be carried out, highlighting the evolution of the physical state of the IGM from to . The EDGES absorption line was seen throughout this region, so a natural question to address is whether the brightness temperature calculated with Equation (15) is consistent with the radiation () and spin () temperatures we have estimated thus far. The answer appears to be yes, given that changes slowly at , evolving from the free-streaming relation in Equation (7) to the expression in Equation (8). So, for example, while K at , it increases only slightly to K by , implying that mK at and mK at . The physical conditions therefore appear to be quite similar throughout the epoch though, in reality, there must have been an evolution in the heating rate of the IGM gas as the number of Pop III SNe ramped up. A more detailed calculation, with a more realistic Pop III star formation rate throughout this period, should show whether the inferred physical state of the IGM is truly consistent with the observed 21-cm line profile.
Nevertheless, even at this level of approximation, the brightness temperature of the 21-cm signal predicted by the universe appears to be more consistent with the EDGES observation than that calculated using the standard model (see fig. 1). As noted earlier, the limitation with our simplified approach in this paper is that the physical conditions within the redshift range are estimated more or less as averages, so we are not yet in a position to show a true time-evolution across this transition region. The brightness temperature (Eqn. 15), however, does trace the evolution in CMB temperature according to Equation (7) in CDM, and according to a transition from Equation (8) to (7) in , so we may at least gauge how well the 21-cm line profile matches the CMB temperature in these two models within this redshift range. As one may see in figure 1, the correspondence is much better for than for CDM, largely due to two principal effects: (i) the difference in spin temperature predicted by these two cosmologies ( K in the former, versus K in the latter); and (ii) the somewhat different redshift dependence of the CMB temperature at , given by Equation (7) in CDM and Equation (8) in .
4 Discussion and Conclusion
There is no question that the debate between a recombination versus dust origin for the CMB has shifted strongly in favour of the former following the dramatic discoveries by COBE, WMAP and Planck over the past two decades. Yet this issue has slowly resurfaced in the face of growing tension between the predictions of the standard model and the ever improving precision of cosmological measurements. A good example is the Hubble constant , which characterizes the current expansion rate of the Universe and determines its absolute distance scale. The accuracy of measuring has been significantly improved recently, but its value ( km ; ref. Planck:2016 inferred from the CMB observations in the context of flat CDM disagrees with that based on local Type Ia SNe calibrated by the Cepheid distance ladder ( km ; ref. Riess:2019 ) at a level of significance.
A previously completed thorough analysis of the evidence in favour of recombination Melia:2020b demonstrated that a dust scenario for the origin of the CMB is still viable, though not in the context of CDM. Instead, the observed characteristics of the microwave background, such as its distribution of anisotropies and the implied acoustic scale, could be consistent with the alternative FLRW cosmology known as the universe, which is effectively CDM, though with an additional constraint on its overall equation-of-state derived from the zero active mass condition in general relativity Melia:2020a . The work we have reported in this paper has a significant impact on this discussion because it represents one of the earliest tests of the dust model based on a very different kind of observation.
The observed profile of the global 21-cm signal associated with the CMB is largely consistent with the expectations of CDM, except that its amplitude is more than a factor of two greater than the largest predictions. Like the disparity with , this anomaly represents a statistically significant indication that the standard model may not be quite right. It may need an infusion of new physics or, at worst, a complete replacement. The universe is a compromise, because it actually does not replace any of the essential features of the standard model (other than the inflationary phase, which itself appears to be problematic; ref. Melia:2013 ), but only adds the requirement that at all times. From a theoretical standpoint, the Local Flatness Theorem in general relativity Melia:2019a leaves no doubt that the use of FLRW is valid only with the inclusion of this equation-of-state. And its observational support continues to grow with the completion of each new comparative test (see, e.g., Table 2 in ref. Melia:2018a ). The fact that presents a viable mechanism by which the measured 21-cm signal could have formed at constitutes additional observational support for this model.
If confirmed, the EDGES detection Bowman:2018 is critically important to astrophysics in general, perhaps even to particle physics, because it opens up a window on the early phase of cosmic structure formation, and provides us with the physical state of the cosmic environment at the start of the epoch of reionization. As we have seen in this paper, the requirements for the rethermalization of the CMB by dust at in the context of seemlessly weave together a narrative in which the onset of Pop III star formation at self-consistently initiated a re-heating of the IGM, an increase in metallicity and the concomitant injection of dust into the background medium. A single population of stars produced all of the physical attributes needed to account for the CMB spectrum, the apparent frequency dependence of its distribution of anisotropies, and an equilibrium IGM gas (and spin) temperature reflected in the global 21-cm profile produced during this epoch. This represents a comprehensive set of developments fulfilling the cosmic transition away from the dark ages and into the subsequent era of reionization and large-scale formation of structure.
Fortunately, it appears that we shall not have to wait very long to see a confirmation of the EDGES measurement. Several other similar experiments are underway, including the Large-Aperture Experiment to Detect the Dark Ages (LEDA Bernardi:2016 ; the Sonda Cosmológica de las Islas para la Detección de Hidrógeno Neutro (SCI-HI Voytek:2014 ); and the Shaped Antenna measurement of the background Radio Spectrum 2 (SARAS2 Singh:2017 ). Farther afield, the observation of the 21-cm line should be significantly enhanced by the use of interferometric arrays, such as the Hydrogen Epoch of Reionization Array (HERA DeBoer:2017 ); and the Square Kilometre Array (SKA; https://www.skatelescope.org), among others. When constructed, the SKA Low-Frequency Aperture Array will detect the power spectrum associated with the EDGES absorption profile, and should also be able to image the 21-cm signal, providing more fertile ground for testing the scenario we have explored in this paper, in which the physical conditions producing the 21-cm absorption line are inextricably linked to the requirements for rethermalizing the CMB at , just prior to the epoch of reionization.
Acknowledgements.
I am very grateful to the anonymous referee for their exceptional review of this paper and very helpful suggestions that have led to an improved presentation of the results. I am also grateful to Amherst College for its support through a John Woodruff Simpson Lectureship, and Purple Mountain Observatory in Nanjing, China, for its hospitality while part of this work was being carried out.References
- (1) J. D. Bowman, A.E.E. Rogers, R. A. Monsalve, T. J. Mozdzen & N. Mahesh, Nature 555 (2018) 67
- (2) G. Bernardi, M. McQuinn & L. J. Greenhill, ApJ 799 (2015) 90
- (3) J. Pritchard, K. Ichiki, A. Mesinger, R. B. Metcalf, A. Pourtsidou, M. Santos, F. B. Abdalla et al., Proceedings of Advancing Astrophysics with the Square Kilometre Array (AASKA14). 9-13 June, 2014. Giardini Naxos, Italy. Online at http://pos.sissa.it/cgi-bin/reader/conf.cgi?confid=215 (2014) id 12
- (4) F. Melia & A. Shevchuk, MNRAS 419 (2012) 2579
- (5) F. Melia, The Cosmic Spacetime (New York: Taylor & Francis) (2020)
- (6) F. Melia, Annals of Physics 411 (2019) 167997
- (7) F. Melia, Front. Phys. 11 (2016) 119801
- (8) F. Melia, Front. Phys. 12 (2017) 129802
- (9) F. Melia, MNRAS 481 (2018) 4855
- (10) F. Melia, Am. J. Phys. 86 (2018) 585
- (11) F. Melia & R. S. Maier, MNRAS 432 (2013) 2669
- (12) F. Melia, EPJ Plus 135 (2020) 511
- (13) Planck Collaboration, A&A 594 (2016) A15
- (14) P.J.E. Peebles & J. T. Yu, ApJ 162 (1970) 815
- (15) M. White & J. Silk, ARAA 32 (1994) 319
- (16) W. Hu & N. Sugiyama, ApJ 444 (1995) 489
- (17) H.-J. Seo & D. J. Eisenstein, ApJ 633 (2005) 575
- (18) A. Meiksin, M. White & J. A. Peacock, MNRAS 304 (1999) 851
- (19) D. Jeong & E. Komatsu, ApJ 651 (2006) 619
- (20) M. Crocce & R. Scoccimarro, Phys. Rev. D 73 (2006) 063520
- (21) D. J. Eisenstein, H.-J. Seo & M. White, ApJ 664 (2007) 660
- (22) T. Nishimichi, H. Ohmuro, M. Nakamichi et al., PASJ 59 (2007) 1049
- (23) H.-J. Seo et al., ApJ 720 (2010) 1650
- (24) A. Font-Ribera et al., JCAP 5 (2014) 27
- (25) T. Delubac, J. E. Bautista, N. G. Busca, J. Rich, D. Kirkby, S. Bailey, A. Font-Ribera et al., A&A 574 (2015) A59
- (26) A. Alam, M. Ata, S. Bailey, F. Beutler, D. Bizyaev, J. A. Blazek, A. S. Bolton et al., MNRAS 470 (2017) 2617
- (27) F. Melia & M. López-Corredoira, IJMP-D 26 (2017) 1750055
- (28) F. Melia & M. López-Corredoira, A&A 610 (2018) A87
- (29) C. J. Copi, D. Huterer, D. J. Schwarz & G. D. Starkman, MNRAS 451 (2015) 2978
- (30) J. C. Mather, E. S. Cheng, R. E. Jr. Eplee, R. B. Isaacman, S. S. Meyer, R. A. Shafer, R. Weiss et al., ApJL 354 (1990) L37
- (31) J. A. Rubino-Martin, J. Chluba & R. A. Sunyaev, MNRAS 371 (2006) 1939
- (32) J. A. Rubino-Martin, J. Chluba & R. A. Sunyaev, A&A 485 (2008) 377
- (33) M. J. Rees, Nature 275 (1978) 35
- (34) M. Rowan-Robinson, J. Negroponte & J. Silk, Nature 281 (1979) 635
- (35) E. L. Wright, ApJ 255 (1982) 401
- (36) Planck Collaboration, A&A in press (arXiv:1906.02552) (2018)
- (37) J. C. Weingartner & B. T. Draine, ApJ 548 (2001) 296
- (38) B. T. Draine & A. Li, ApJ 551 (2001) 807
- (39) V. Bromm & R. B. Larson, ARA&A 42 (2004) 79
- (40) S.C.O. Glover, Space Sci Review 117 (2004) 445
- (41) A. Heger, C. L. Fryer, S. E. Woosley, N. Langer & D. H. Hartmann, ApJ 591 (2003) 288
- (42) D. Whalen, B. van Veelen, B. W. O’Shea & M. L. Norman, ApJ 682 (2008) 49
- (43) A. Heger & S. E. Woosley, ApJ 567 (2002) 532
- (44) H. Xu, M. Norman, B. W. O’Shea & J. H. Wise, ApJ 823 (2016) 140
- (45) H. Xu, M. Norman, B. W. O’Shea & J. H. Wise, ApJ 833 (2016) 84
- (46) R. H. Mebane, J. Mirocha & S. R. Furlanetto, MNRAS 479 (2018) 4544
- (47) E. Visbal, Z. Haiman & G. L. Bryan, MNRAS 475 (2018) 5246
- (48) J. Jaacks, S. L. Finkelstein & V. Bromm, MNRAS 488 (2019) 2202
- (49) R. Sarmento, E. Scannapieco & B. Côté, ApJ 871 (2019) 206
- (50) F. Melia, EPJ-C 79 (2019) 455
- (51) F. Melia, AJ 147 (2014) 120
- (52) K. M. Yennapureddy & F. Melia, PDU 20 (2018) 50
- (53) K. M. Yennapureddy & F. Melia, EPJ-C 79 (2019) 571
- (54) K. M. Yennapureddy & F. Melia, PDU in press (2020)
- (55) C. L. Steinhardt, P. Capak, D. Masters & J. S. Speagle, ApJ 824 (2016) 21
- (56) F. Melia & T. M. McClintock, Proc. R. Soc. A 471 (2015) 20150449
- (57) J. R. Pritchard & A. Loeb, Rep. Prog. Phys. 75 (2012) 086901
- (58) S. A. Wouthuysen, AJ 57 (1952) 31
- (59) C. M. Hirata, MNRAS 367 (2006) 259
- (60) B. Zygelman, ApJ 622 (2005) 1356
- (61) M. Zaldarriaga, S. R. Furlanetto & L. Hernquist, ApJ 608 (2004) 622
- (62) P.J.E. Peebles, ApJ 153 (1968) 1
- (63) R. Weymann, Phys. Fluids 8 (1965) 2112
- (64) J. P. Reynolds, ARAA 46 (2008) 89
- (65) S. R. Furlanetto & S. J. Stoever, MNRAS 404 (2010) 1869
- (66) S. P. Oh, ApJ 553 (2001) 499
- (67) A. Venkatesan, M. L. Girous & J. J. Shull, ApJ 563 (2001) 1
- (68) M. Kuhlen & P. Madau, MNRAS 363 (2005) 1069
- (69) S. R. Furlanetto, MNRAS 371 (2006) 867
- (70) M. Kuhlen, P. Madau & R. Montgomery, ApJL 637 (2006) L1
- (71) J. J. Pritchard & S. R. Furlanetto, MNRAS 376 (2007) 1680
- (72) A. G. Riess, S. Casertano, W. Yuan, L. M. Macri & D. Scolnic, ApJ 876 (2019) 85
- (73) F. Melia, A&A 553 (2013) A76
- (74) G. Bernardi et al., MNRAS 461 (2016) 2847
- (75) T. C. Voytek, A. Natarajan, J. Jauregui Garcia, J. B. Peterson & O. López-Cruz, ApJL 782 (2014) L9
- (76) S. Singh et al., ApJL 845 (2017) L12
- (77) D. R. DeBoer et al., PASP 129 (2017) 045001