Dense gas in local galaxies revealed by multiple tracers
Abstract
We present 3 mm and 2 mm band simultaneously spectroscopic observations of HCN 1-0, HCO+ 1-0, HNC 1-0, and CS 3-2 with the IRAM 30 meter telescope, toward a sample of 70 sources as nearby galaxies with infrared luminosities ranging from several 10 to more than 10. After combining HCN 1-0, HCO+ 1-0 and HNC 1-0 data from literature with our detections, relations between luminosities of dense gas tracers (HCN 1-0, HCO+ 1-0 and HNC 1-0) and infrared luminosities are derived, with tight linear correlations for all tracers. Luminosities of CS 3-2 with only our observations also show tight linear correlation with infrared luminosities. No systematic difference is found for tracing dense molecular gas among these tracers. Star formation efficiencies for dense gas with different tracers also do not show any trend along different infrared luminosities. Our study also shows that HCN/HCO+ line ratio might not be a good indicator to diagnose obscured AGN in galaxies.
keywords:
galaxies: star formation; galaxies: starburst; galaxies: ISM; galaxies: active1 Introduction
Dense gas tracers, lines from molecules with high dipole moment (e.g., HCN, HCO+, HNC, and CS), which have high critical densities () greater than cm-3, directly represent molecular content involved in forming stars (Lada et al., 2012). Observing star-forming molecular gas is one of the direct ways to measure star formation activities in galaxies and in the Milky Way. The star formation law, the relation between star formation rate (SFR) and local gas density, was first proposed by Schmidt (1959) and observationally studied with total gas, including atomic gas traced by HI 21 cm emission and molecular gas traced by CO 1-0 emission, and SFR by Kennicutt (1998). With observations of HCN 1-0 toward 65 galaxies, Gao & Solomon (2004) found a tight linear correlation between the luminosities of HCN 1-0 and infrared emission. This relation has been extended to Galactic dense cores (Wu et al., 2005) and possibly high-z galaxies and QSOs (Gao et al., 2007).
However, since there are several choices of molecules (HCN, HNC, HCO+ and CS) with high dipole moments, different masses of dense gas will be obtained with different tracers, with conversion factor of line luminosity to gas mass in galaxies. It was argued if HCN was a true tracer of dense molecular gas in luminous infrared galaxies (LIRGs) and ultra-luminous infrared galaxies (ULIRGs) (Graciá-Carpio et al., 2006). Further observational results in literature indicated that HCO+/HCN 1-0 line ratio varied from 0.36 to 1.83, while HNC/HCN 1-0 ratios were from 0.20 to 1.09 in a sample of 23 galaxies (Costagliola et al., 2011), most of which are (U)LIRGs. Thus, there will be large uncertainties of estimating dense gas masses in individual galaxies with only line luminosity of one dense gas tracer, even though the correlations between line luminosities of deferent dense gas tracers and IR luminosities have been well established (Gao & Solomon, 2004; Wang, Zhang, & Shi, 2011; Zhang et al., 2014). Observations of multiple dense gas tracers toward a relatively large sample up to about one hundred of galaxies are essential for determining the uncertainty of estimating dense gas masses there. With these lines detected in galaxies, one can also determine the line ratios between each of them among different types of galaxies: with active galactic nucleus (AGN) or without AGN, starburst or normal star forming galaxies.
The other way for better understanding dense gas properties is to detect optically thin isotopic lines of dense gas tracer with deep observations (Wang et al., 2014, 2016; Li et al., 2020). The isotopic lines of dense gas tracers together with dense gas tracers themselves, can be used to derive optical depths of dense gas tracers, which allows us to constrain dense gas masses more accurately than without isotopic lines. The optical depths of HCN 1-0 derived with HCN/H13CN 1-0 line ratios vary from less than 1 to more than 10 in a limited sample of 5 galaxies (Li et al., 2020). Such variation can cause large uncertainty of estimating dense gas masses with line luminosity of HCN 1-0 in galaxies. However, due to the weak intensities of these isotopic lines, only extremely local star forming galaxies or nearby extremely active starburst galaxies with strong line emission can be done for such study. Thus, it is almost impossible to detect isotopic lines of dense gas tracers toward a large sample of galaxies with a reasonable amount of telescope time. Observations of multiple dense gas tracers toward different types of galaxies with infrared luminosities spanning several orders of magnitude will be the best way to testify the consistence of different dense gas tracers in galaxies.
In this paper, we will describe the sample in §2, observation and data reduction in §3, present the main results in §4 and discussions in §5, make the brief summary in §6.
2 The sample of galaxies
We obtained new observations for a sample of local galaxies including a wide range of infrared luminosities, from about several 10 to more than 10 spanning about 7 orders of magnitude. Firstly, 60 sources with bright infrared emission from the IRAS Revised Bright Galaxy Sample (Sanders et al., 2003) with DEC higher than -20∘ and are selected. Sources within that criteria which had been observed by Costagliola et al. (2011) are excluded. Since there are large fraction of sources with between 10 and 10, we also excluded some sources within this range, especially if their LST ranges are good for Galactic plane observations. Other ten sources reach this criteria observed with our previous projects are also included. They are six infrared bright galaxies: M 82 (center), NGC 3079, IC 694, Mrk 231, NGC 6240, and NGC 6946 from Li et al. (2020), as well as four different positions along the major axis of M 82 (Li et al. in preparation).
3 Observations and data reduction
3.1 Millimeter spectroscopic observations with IRAM 30m and data reduction
The HCN 1-0, HCO+ 1-0, HNC 1-0 and CS 3-2 lines were observed simultaneously with the IRAM 30 meter millimeter telescope (IRAM 30m) at Pico Veleta, Spain on February, May, July and August 2019. The critical densities of HCN 1-0, HCO+ 1-0, HNC 1-0 and CS 3-2 are 6.8cm-3, 4.7cm-3, 1.4cm-3, and 4.4cm-3, when kinematic temperature of H2 is 10 K, while the effective excitation densities for these lines are about 1/50 of the critical densities (Shirley, 2015).
We used the 3 mm (E0) and 2mm (E1) band of The Eight Mixer Receiver (EMIR) simultaneously and the Fourier Transform Spectrometers (FTS) backend to cover 8 GHz bandwidth and 195 kHz spectral resolution for each band with dual polarization. Standard wobbler switching mode with beam throws of 60 and a switching frequency of 0.5 Hz were used. The beam sizes of IRAM 30m range from FWHM 28 at 88 GHz to 17 at 146 GHz. The typical system temperatures are around 100 K in the 3-mm band and around 150 K in the 2-mm band. The detailed informations of the sample are shown in Table LABEL:tab:observation_parameters, which includes source name, coordinates, IRAS 100m flux, and luminosity distance (Sanders et al., 2003), as well as observing dates, telescope time (ON+OFF) and typical system temperature at 3mm band. Observations done in 2017 and 2019 Feb are with project 058-17 (Li et al., 2020) and 186-18 (Li et al. in preparation), respectively, while the rest observations are all with project 066-19. The weather varies from good (3.8 mm) to mediocre (9.4 mm) conditions during the observations. Pointing was checked every 2 h with nearby strong millimetre emitting quasi-stellar objects. We also checked and corrected the focus at the beginning of each run and during sunsets and sunrises. The antenna temperature () was converted to the main beam brightness temperature (), using =, where the forward efficiency is 0.95 and beam efficiency is 0.81 for 3 mm band, while is 0.93 and is 0.73 for 2 mm band. Each scan consists of 2 minutes with an on-source integration of 1 minute. The total telescope time (ON+OFF) was about one hour towards each source.
Data reduction was conducted with the class package, which is a part of the GILDAS111http://www.iram.fr/IRAMFR/GILDAS software. Firstly, each individual spectrum was checked. Then, we discarded the spectra with issues related to their baseline flatness, standing wave, system temperature, etc. Most of the spectra have good qualities. All reliable spectra of a given source tuned at the same frequency were averaged into one spectrum. A first-order polynomial baseline was fitted and subtracted from the averaged spectrum. Due to the broad line widths of these galaxies, the final spectra were smoothed to a velocity spacing of 20–40 km s-1. The rest frequencies of each line from the NIST database222https://pml.nist.gov/cgi-bin/micro/table5/start.pl were used for the line identification.
3.2 Infrared data and line luminosities
To measure the total infrared luminosities (3 m - 1000m), we obtained infrared archival imaging data from Spitzer MIPS and Herschel PACS instruments from the NASA/IPAC Infrared Science Archive (IRSA). The data have been processed to level 2 for MIPS 24 m and level 2.5 or 3 for PACS 70 m, 100 m, and 160 m bands. To match the molecular emission, the infrared luminosities have been corrected from the whole galaxy to the region within the IRAM 30-m telescope beam. Following the same approach as adopted by Tan et al. (2018), Spitzer and Herschel data have been convolved to 28′′ and 17′′ resolution, corresponding to the beam-size of the 3 mm and 2 mm band, respectively. For the galaxies with only Spitzer MIPS 24 m image, we used MIPS 24 m image to obtain the ratio of such a region to the whole galaxy. Then, with the 24 m flux ratio, we estimated the infrared luminosity within the beam by scaling the total infrared luminosity from Sanders et al. (2003), which is similar to the method in Wang, Zhang, & Shi (2011). We computed the line luminosities for all dense gas tracers using equation (2) in Gao & Solomon (2004) for all galaxies:
| (1) |
where IHCN is the observed integrated line intensity, d is the luminosity distance.
The infrared luminosity is calculated from
| (2) |
where is the calibration coefficients for various combinations of bands, is the resolved luminosity in a given band in units of (Tan et al., 2018). The values of are from Tan et al. (2018). The total error estimated for includes errors of photometry of (Balog et al., 2014), the flux calibration error of , and the error of tracing TIR with a combined IR band of (Galametz et al., 2013) .
4 Results
4.1 Detections of dense gas tracers in local galaxies with IRAM 30 meter
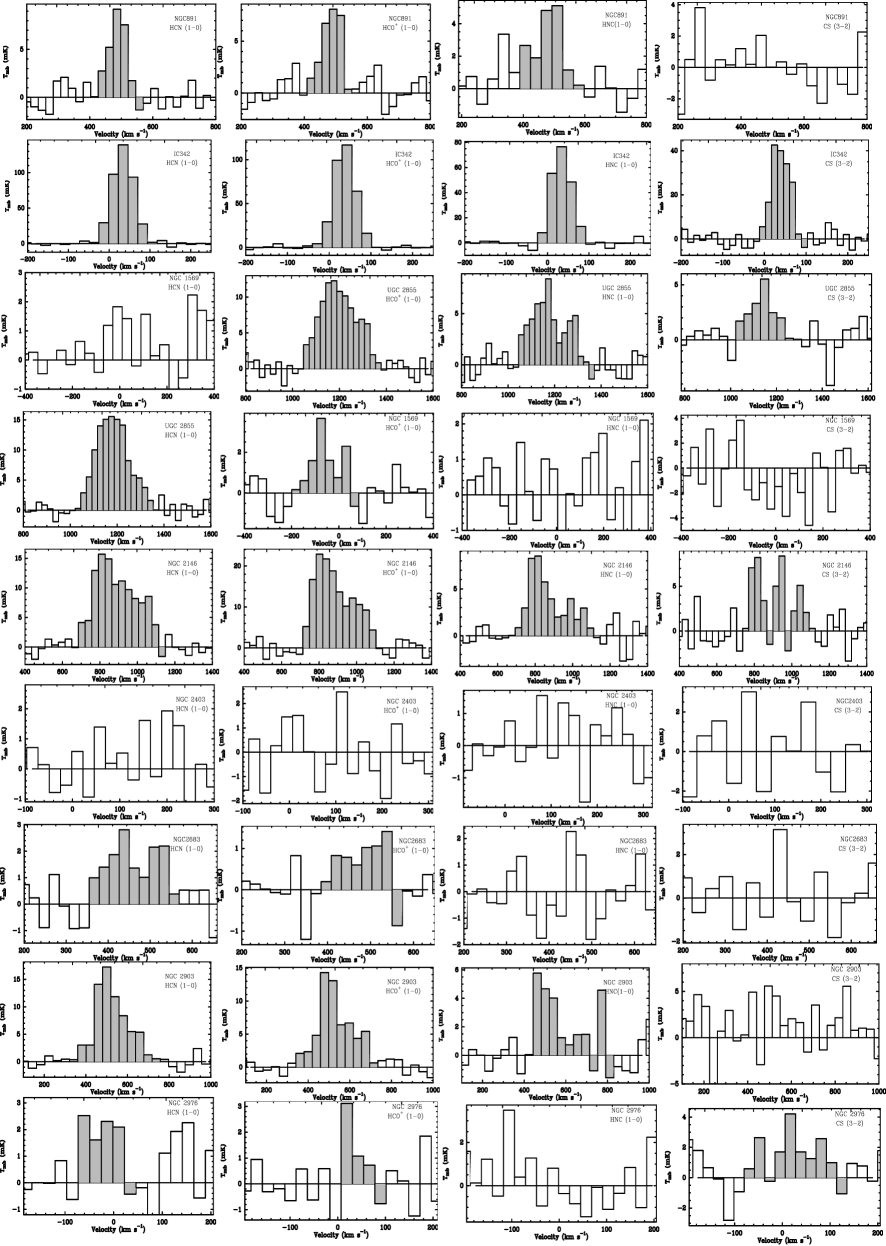
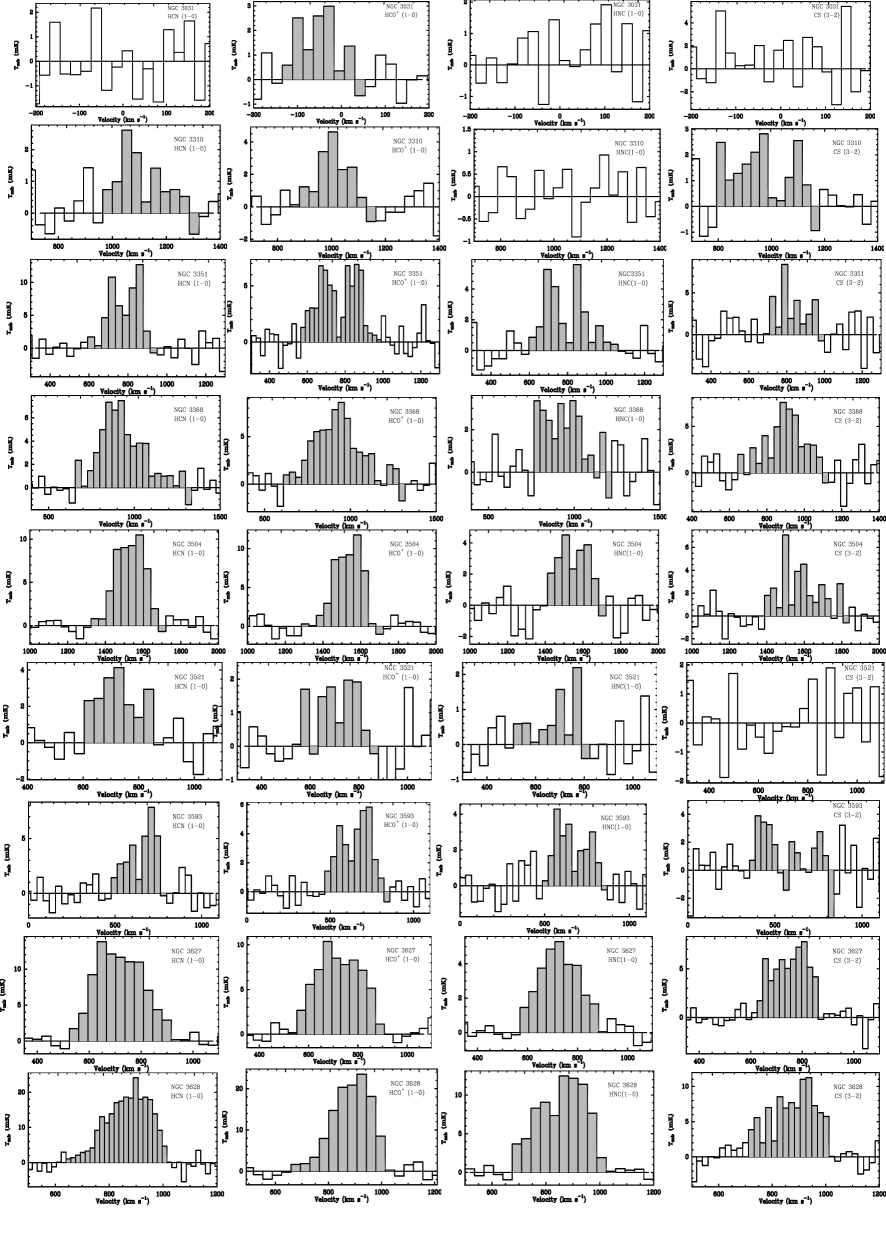
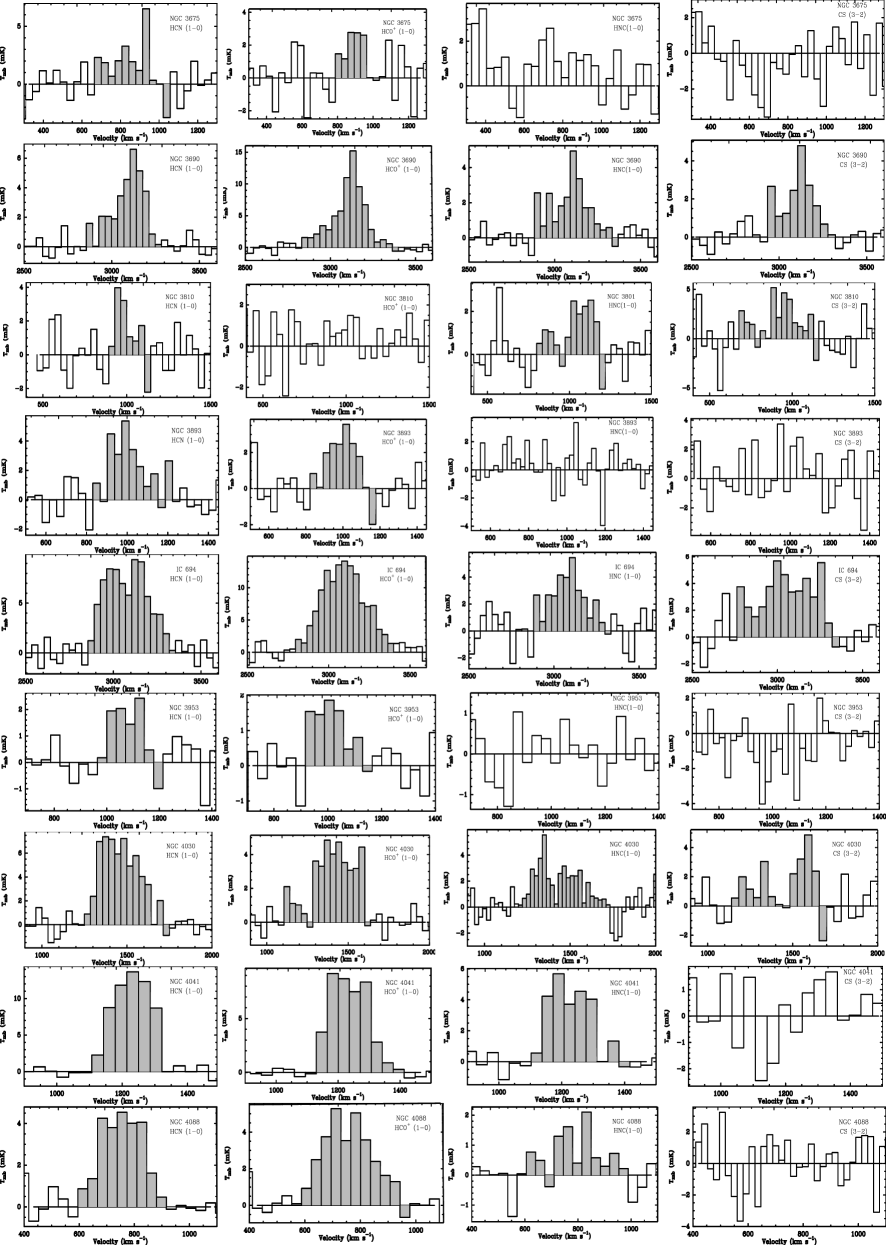
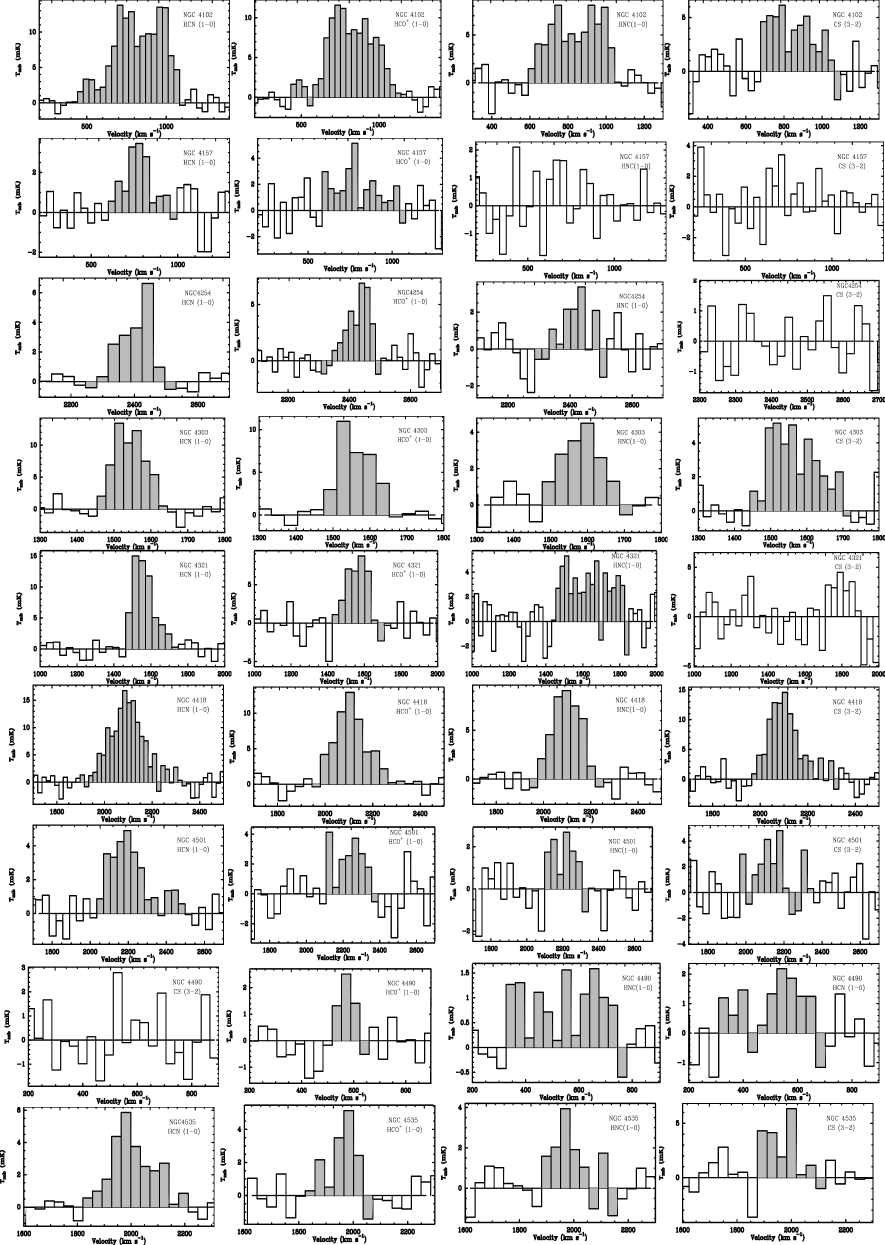
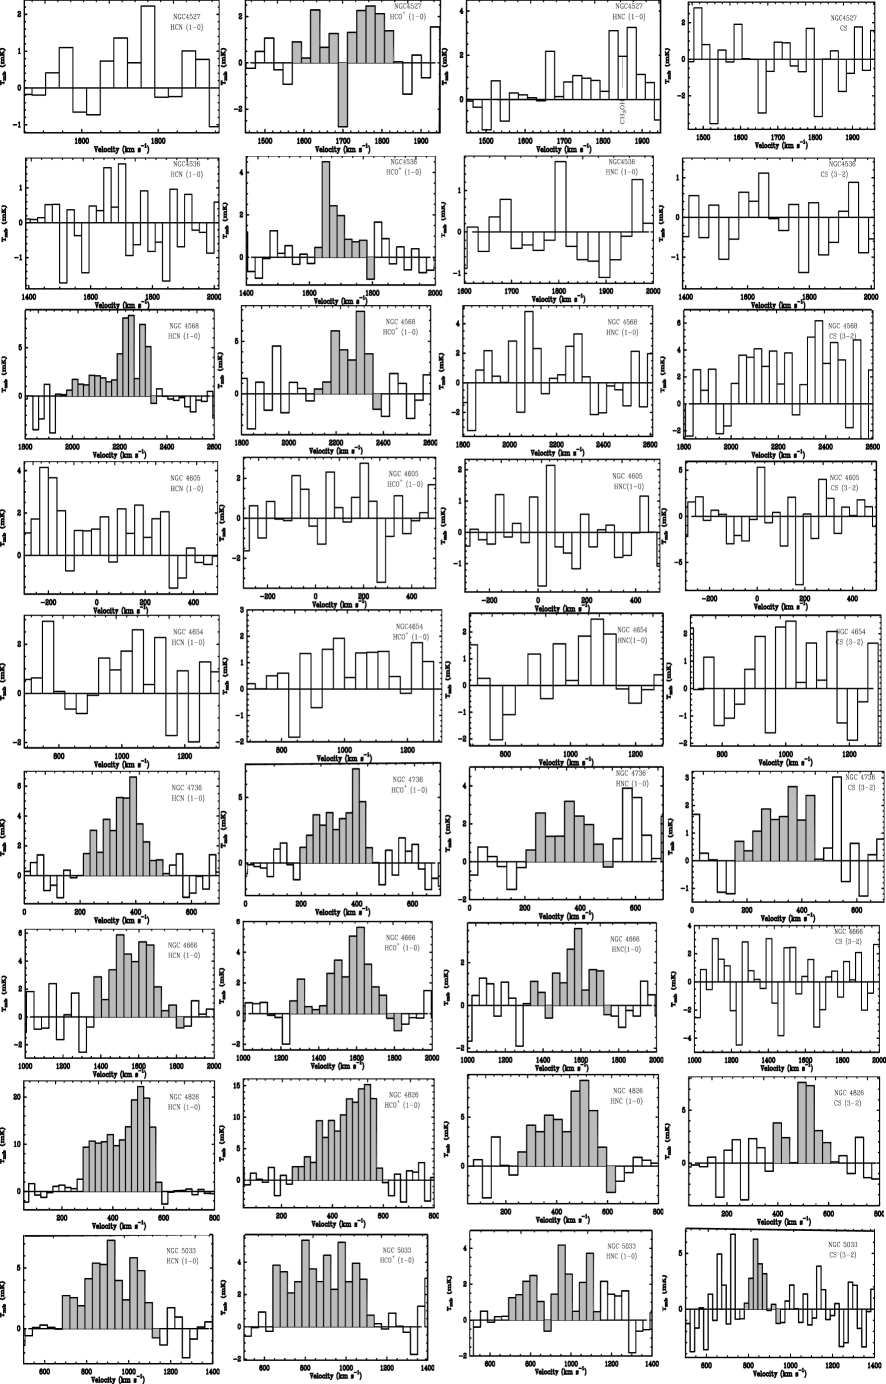
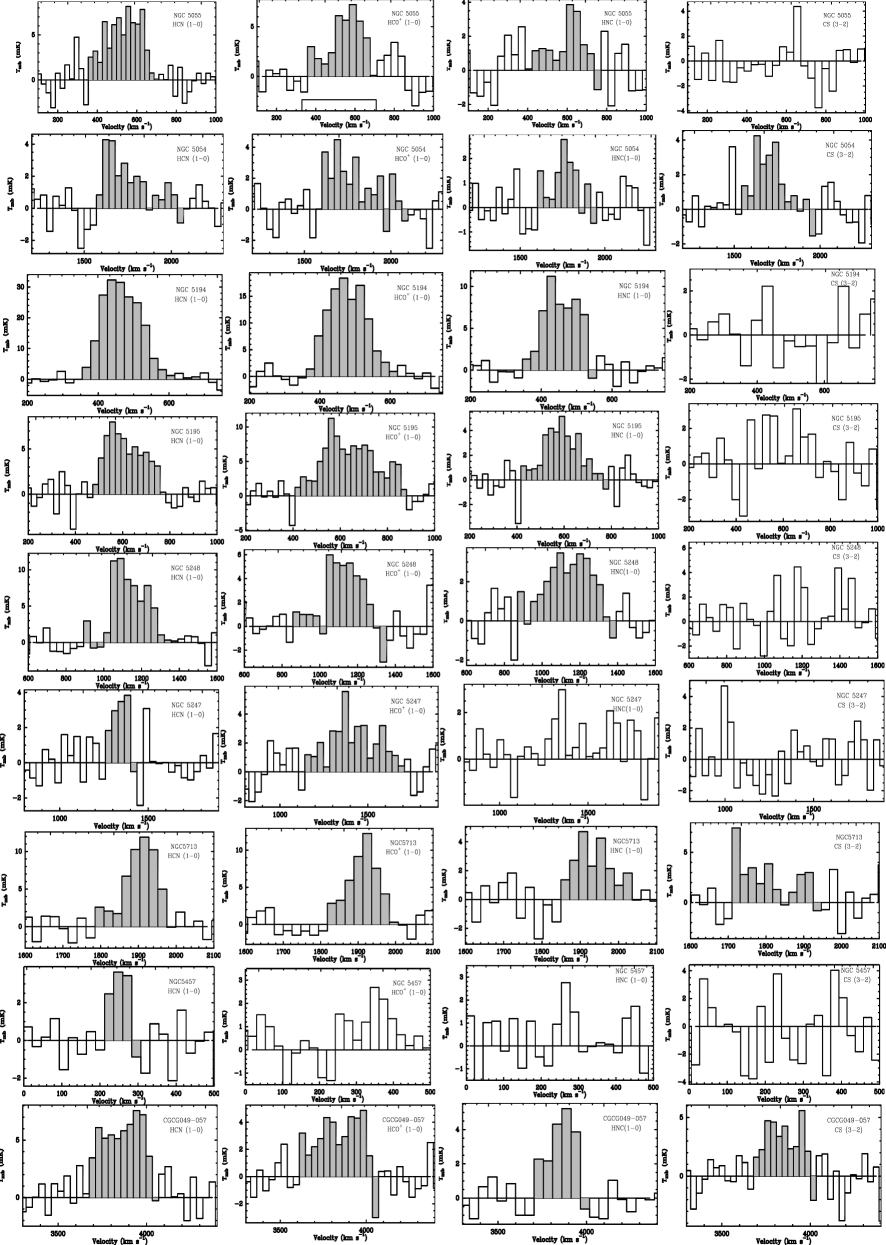
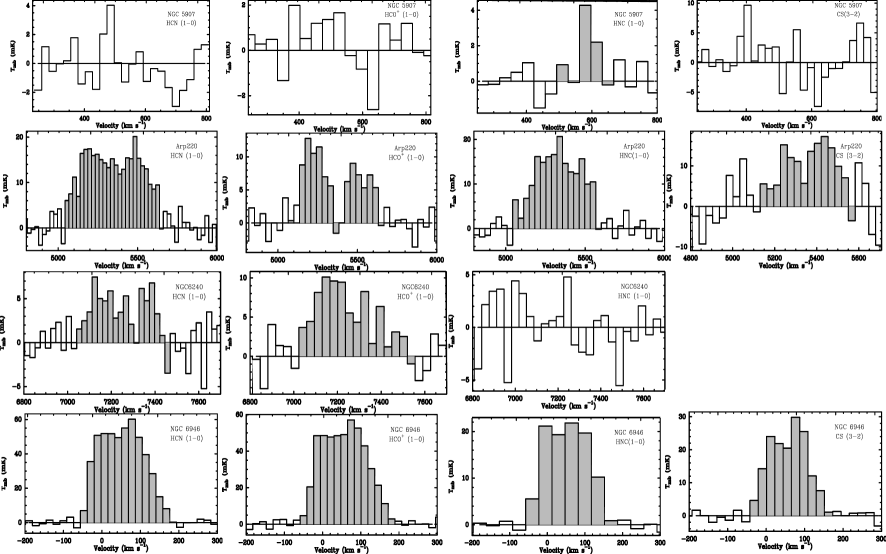
The targets with new observations, which include 70 sources, are listed in Table LABEL:tab:observation_parameters. Dense gas tracers in these sources were detected with detection rate of 89%, 90%, 73%, and 51% for HCN 1-0, HCO+ 1-0, HNC 1-0 and CS 3-2, respectively. The velocity-integrated intensities of these four lines are shown in Table LABEL:tab:intensity. For HCN 1-0 and HCO+ 1-0, most of them are solid detections above 5 , while, some marginal detections at 3 to 4 level are shown for HNC 1-0 and CS 3-2. 3 upper limits for the velocity-integrated intensity of the undetected lines are also derived. The 3 upper limits are calculated from = RMS, where RMSchannel is the baseline rms of the smoothed spectrum at 30 km/s-40 km/s and is the line width and is the channel width. For the sources of non-detection in all four species, including NGC 2403, NGC 4605, NGC 4654 and NGC 6822, we use the CO line width to estimate the upper limits of velocity-integrated intensity, due to the central velocity of HCN 1-0 is consistent with that of the detected lines of CO 1-0 (Israel, Tacconi, & Baas, 1995) and CO 3-2 (Mao et al., 2010). For the other sources, we use line width of the detected lines to estimate the upper limits of velocity-integrated intensity of the undetected lines for the same source. Note that CS 3-2 is not covered by the observed frequency range in Mrk 231 and NGC 6240. The spectra of these dense gas tracers are shown in Figure 5, with the grey shaded region in each subfigure to indicate velocity range of identified detections.
For comparison, Arp 220, which was included in Privon et al. (2015), is also observed. However, fluxes measured by our observations are only about 70% of that in Privon et al. (2015). Our fluxes are consistent with results reported in Greve et al. (2009) and Wang et al. (2016). We speculate the mis-match of line fluxes of Arp 220 in Privon et al. (2015) may be due to poor velocity resolution, which can cause un-resolved absorption dip at central velocity (Greve et al., 2009; Wang et al., 2016), or poor baselines, which can cause over-estimation of line widths. Another evidence that such different fluxes can not be caused by the pointing error of our observation is that the peak emissions are similar in all observations (Greve et al., 2009; Privon et al., 2015; Wang et al., 2016), which is about 17mK () for HCN 1-0 (see Figure 5). Since line widths in most of other sources in Privon et al. (2015) are not as broad as that in Arp 220 and absorption dip is not as important as that in Arp 220, such mis-match of line fluxes in Privon et al. (2015) should not be a big issue.
Mrk 231, NGC 3079, NGC 4194, NGC 4418 and NGC 6240 were also included both in Costagliola et al. (2011) and our observations, with similar velocity integrated fluxes. Results from our observations are used in discussion. By combining our new IRAM data with literature data, including 57 local (U)LIRGs (Privon et al., 2015) and 12 local galaxies (Costagliola et al., 2011), we reconstruct a sample of 140 galaxies with HCN 1-0, HCO+ 1-0 and HNC 1-0 observations, containing 125, 124, 85 detections, respectively.
4.2 The luminosities of dense gas tracers v.s. infrared luminosities
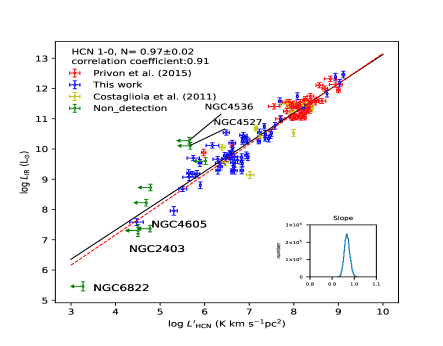
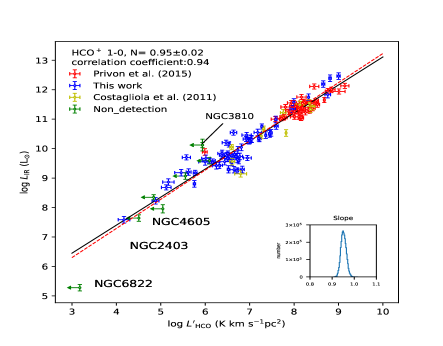
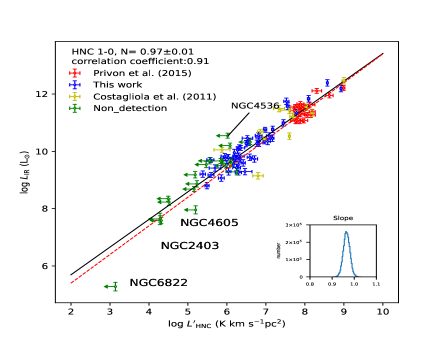
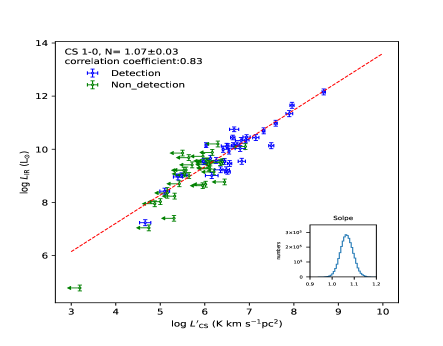
The correlations between and (HCN 1-0, HCO+ 1-0, and HNC 1-0, and CS 3-2) are presented in Figure 1, with the data listed in Table LABEL:tab:luminosity, including our data with new observations as well as HCN 1-0, HCO+ 1-0 and HNC 1-0 detections in local galaxies from literature (Costagliola et al., 2011; Privon et al., 2015). We adopt the Markov Chain Monte Carlo (MCMC) method using package emcee (Foreman-Mackey et al., 2013) to account for measurement uncertainties. Only detections are adopted to fit the relationship, while the upper limits are just plotted in the Figures. The of sample galaxies span 7 orders of magnitude from a few 105L⊙ to several times of 1012L⊙. However, dense gas tracers are not detected in the low infrared luminosity galaxies, including NGC 6822, NGC 2403, and NGC 4605. Thus, the lowest infrared luminosity with detection of dense gas tracers (HCN and HCO+ 1-0) is NGC 4605 with , while it is in NGC 2976 with CS 3-2 detection. Note that due to different beam sizes, there are large difference of for regions corresponding to HCN 1-0 and CS 3-2 (see Table LABEL:tab:luminosity), such as that in NGC 2976. The overall spanning of is about 5 orders of magnitude with detections of dense gas tracers. In the following, the fitted slope and uncertainties are the median and one standard deviation of the resulting MCMC chain:
| (3) |
| (4) |
| (5) |
| (6) |
The fitting results are shown as the black solid line in Figure 1, with a Spearman rank correlation coefficient of 0.91, 0.94, 0.91 and 0.83, for HCN 1-0, HCO+ 1-0, HNC 1-0, and CS 3-2, respectively. As shown with blue dotted line in this figure, only our IRAM data were used to fit the relationship, which gave a similar slope of 1.030.02, 0.990.02 and 1.010.02 for HCN 1-0, HCO+ 1-0 and HNC 1-0, yielding a Spearman rank correlation coefficient () of 0.83, 0.85 and 0.86, respectively, with worse Spearman rank correlation coefficient than the whole sample, which should mainly due to less sources in only our data than the whole sample. On the other hand, no clear difference of correlation coefficient, can be found among the four tracers, which is from a Spearman rank correlation analysis.
5 Discussion
5.1 Dense gas star formation law derived with different dense gas tracers
Dense molecular gas and star formation had been studied from the relation between HCN 1-0 and infrared luminosities (Solomon, Downes, & Radford, 1992; Gao & Solomon, 2004), with a tight linear correlation. However, unlike low CO lines as total molecular gas tracers, there are many choices of dense gas tracers with transitions of high dipole moment molecules, such as HCN, HCO+, HNC, CS, CN, and HC3N. Even though there are dense gas tracers other than HCN 1-0 which also provide linear correlation in the past years: CS 5-4 (Wang, Zhang, & Shi, 2011), HCN 4-3, CS 7-6 and HCO+ 4-3 (Zhang et al., 2014), and HCN 3-2 (Li et al., 2020), sub-linear relation with slope of 0.790.09 for HCN 3-2 (Bussmann et al., 2008) and super-linear relation with HCN 1-0 (Graciá-Carpio et al., 2008; García-Burillo et al., 2012) were also reported. However, the sub-linear slope of and reported in Bussmann et al. (2008) is mainly caused by over-estimation of in galaxies with HCN 3-2 emission, because the beam size of SMT for HCN 3-2 observations is smaller than the sizes of nearby galaxies. After correcting the infrared emission to the same as observed HCN 3-2, a linear correlation was derived (Li et al., 2020). On the other hand, far-IR luminosities instead of IR luminosities are used in Graciá-Carpio et al. (2008) and García-Burillo et al. (2012), which may be the main reason of super linear correlation since linear correlation was obtained with a similar sample by Privon et al. (2015).
As shown in Figure 1, the relations between the line luminosities of HCN 1-0, HCO+ 1-0, HNC 1-0, and CS 3-2 and infrared luminosity are all close to linear correlation. All the data, including our observations and that from Privon et al. (2015) and Costagliola et al. (2011), used in Figure 1, are observed with IRAM 30m, which provides the same beam size for each line to avoid the problem of beam matching for different observations. The high Spearman rank correlation coefficients between infrared luminosities and luminosities of HCN 1-0, HCO+ 1-0, HNC 1-0 and, CS 3-2 with slopes close to unity indicate that even though there might be several times uncertainties of the conversion factor from line luminosity of dense gas tracers to dense molecular gas mass in individual galaxy, no clear systematic bias of such conversion factor for different tracers. The star formation law obtained with different dense gas tracers is consistent with each other. Note that not only the detections follow the good correlation in Figure 1, but also the upper limits agree well with the relation, with infrared luminosities spanning 7 orders of magnitude. However, since the normally used dense gas tracers are optically thick, the self absorption of these lines, as well as the abundance issue due to different chemical conditions, such as radiation field and shocks, can cause large uncertainties of estimating dense gas mass from only one line. Such uncertainties may be the main reason of the scatter in the relation plotted in Figure 1.
5.2 Possible reason for sources with deviation from the correlation and note for several individual sources
Even though the relations between luminosities of dense gas tracers and infrared luminosities are pretty tight with high Spearman rank correlation coefficients for HCN 1-0, HCO+ 1-0, HNC 1-0, and CS 3-2, there are large scatters up to about 10 times for some sources (see Figure 1). Such deviation may be real for those sources because of low or high star formation efficiency for dense gas, or the uncertainties of converting dense gas mass from line luminosity of dense gas tracers, since the observational parameters are only line fluxes, which can be used to obtain line luminosities with known distances. For the conversion factor from line luminosity to dense gas mass, several properties can cause the uncertainty, including optical depth, excitation conditions (density and temperature), and abundance of dense gas tracers caused by metallicity and other properties such as PDRs. However, since star formation rates, traced by infrared luminosities or hydrogen recombination lines, such as H, is counting for massive young stars, while dense gas traced by those dense gas tracers is counting for the gas that will form stars in the near future, the correlation can break if there are large differences of star formation evolutions in different galaxies. Another effect that can overestimate star formation rate from infrared luminosity is AGN contribution, especially in galaxies with low star formation activities.
There are several sources, which are not detected in one or more lines, should be noted for deviation from the correlation in Figure 1. No detections were found for all four lines in NGC 2403, NGC 4605 and NGC 6822. Even though they are in the regions away from the fitting lines, they are still consistent with the correlation, since they are upper limits of line emission. If the lines can be detected with more sensitive observations, it should be closer to the fited lines or even at the other side of the lines. Based on the current results, the real deviations can be seen for NGC 4527, NGC 4536, NGC 3810, and NGC 5907. Especially, only HCO+ 1-0 is detected in NGC 4536 at 4.5 level, while other three lines remain non-detected. If the conversion factor of dense gas mass from dense gas tracer luminosity in these sources are similar to that of other galaxies, it will imply that there are less dense gas than expected. In NGC 4536, the metallicity is within normal range and with strong CO 1-0 (525.674.49 Jy km s-1) and 13CO 1-0 (54.513.98 Jy km s-1) emission (Cao et al., 2017). While even HCO+ 1-0 detected in NGC 4536 is only 0.230.05 K km s-1, which corresponds to about 1.2 Jy km s-1. The dense gas fraction is really low, based on the line ratio of HCN and HCO+ 1-0 to CO and 13CO 1-0. For comparison, the line ratio of CO/HCN 1-0 in starburst galaxies are normally around 10 (Aalto et al., 2002), much lower than than in NGC 4536. No AGN activity is found in NGC 4536. Thus, we suggest that the most possible reason for the lack of dense gas in these galaxies, including NGC 4536, is that star formation activities are at late evolutionary stages with strong feedback to the molecular gas, which causes the low dense gas fraction.
5.3 Star formation efficiency v.s. infrared luminosity revealed by different dense gas tracers
Star formation efficiency (SFE) of dense gas, SFR/, can be derived with . With ratio for galaxies with between 10 to several times of 10, García-Burillo et al. (2012) claimed that SFE increased with the increment of SFR (), with large scatter. However, no clear trends of and , or and were found in Privon et al. (2015).
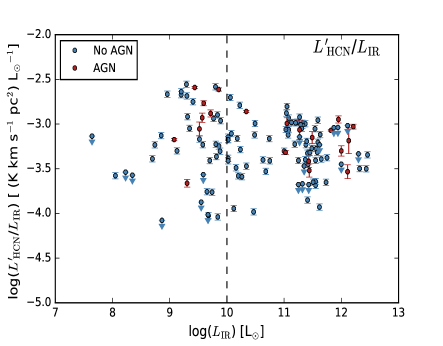
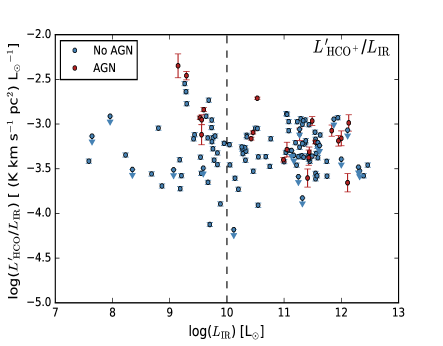
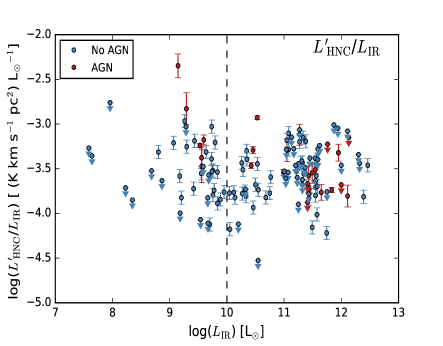
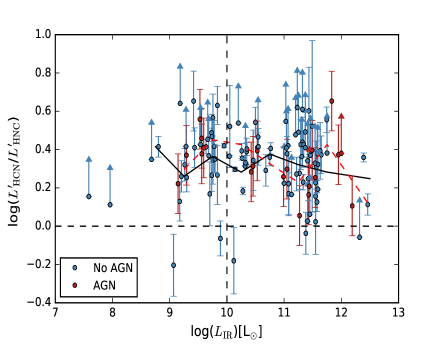
Figure 2 shows the / versus , including our new data and literature data from Privon et al. (2015) and Costagliola et al. (2011). No trend of / versus can be found for HCN 1-0, HCO+ 1-0, and HNC 1-0, with spanning range larger than that discussed in García-Burillo et al. (2012) and Privon et al. (2015). On the other hand, / can vary more than ten times for different galaxies with similar . In figures 2, 3, and 4, the sources marked as “AGN" are identified with AGN activity from NED333The NASA/IPAC Extragalactic Database (NED) is funded by the National Aeronautics and Space Administration and operated by the California Institute of Technology., while sources marked as “No AGN" are without known AGN activity also from NED. However, some of “No AGN" sources may still be with AGN activity.
Sources with known AGN activities do not show clear difference when compared with those without known AGN activities. Thus, the dense gas depletion time to form stars from dense molecular gas, does not relate to SFR traced by infrared luminosity. No bias can be found for different dense gas tracers (HCN 1-0, HCO+ 1-0 and HNC 1-0), or with or without known AGN activities. We would like to suggest that star formation from dense molecular gas follows the similar law in different galaxies: low or high SFR, with or without known AGN. However, the dense gas fraction: the ratio of dense gas to total molecular gas, and molecular gas to atomic gas ratio, which are important to affect star formation from gas, still need to be studied for understanding star formation efficiency in different types of galaxies. Metallicities, merging history, AGN feedback, and other properties, can affect star formation in galaxies. The formation from atomic gas to molecular gas, the collapse of molecular clouds to dense cores, should be understood in further studies, which may also be compared with gas to star ratios in different galaxies.
5.4 Line ratios between different dense gas tracers in individual galaxies
HCN/HCO+ line ratio had been used to distinguish between AGNs and starburst signatures in galactic centers (Kohno et al., 2001; Imanishi et al., 2004, 2007; Krips et al., 2008), while HCN/HNC ratio together with HCN/CN ratio had beed used to discuss starburst evolution in galaxies (Aalto et al., 2002). With HCN/HCO+ 4-3 ratio and CS 7-6 ratio in a sample of galaxies with AGN or without known AGN, Izumi et al. (2013, 2016) and Krips et al. (2008) suggested that HCN can be enhanced in AGNs and HCN/HCO+ line ratio can be used to diagnose AGN and starburst contribution in galaxies. Lower average HCN/HCO+ 1-0 line ratio in LIRGS and starbursts than that in AGNs was found in a limited sample (Costagliola et al., 2011), which was consistent with the weak trend found in Kohno et al. (2001) and Imanishi et al. (2007).
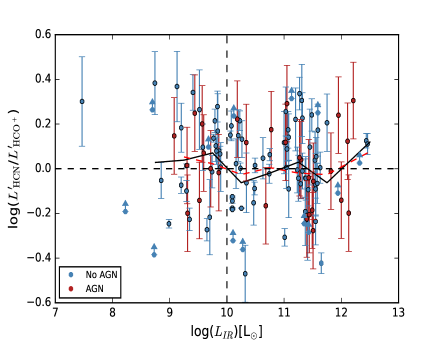
However, with limited sample of galaxies in Krips et al. (2008), Costagliola et al. (2011) and Izumi et al. (2013, 2016), it is hard to conclude if such line ratios can be used to diagnose AGN and/or starburst in galaxies, since some exceptions of HCN/HCO+ line ratio had been found in literature: a sample of (U)LIRGs (Privon et al., 2015), and NGC 4258 with AGN (Li et al., 2019). With the sample including our observations and that from Costagliola et al. (2011) and Privon et al. (2015), we complied a sample with more than 100 galaxies, with detection of a least two lines of HCN, HCO+, and HNC 1-0. The plots of line ratios of HCN/HCO+ 1-0 and HCN/HNC 1-0 versus infrared luminosities and luminosity distances are presented in Figure 3. HCN/HCO+ 1-0 ratio varies from about 0.38 in IC 1623 (Privon et al., 2015) to 2.2 in NGC 4535 (see Table LABEL:tab:intensity), while HCN/HNC 1-0 ratio varies from 0.86 in NGC 891 to 4.3 in NGC 2903 (see Table LABEL:tab:intensity). No clear trend was found for the line ratios and infrared luminosities, which is consistent with the results for HCN/HCO+ 1-0 ratio in Privon et al. (2015). With HCN and HCO+ 1-0 data in a large sample of galaxies observed simultaneously in Costagliola et al. (2011), Privon et al. (2015) and our observations, which can avoid errors of flux ratio due to the uncertainties of absolute flux calibration and pointing errors with different observations, HCN/HCO+ 1-0 ratios in these galaxies do not vary with different infrared luminosities, however, with large scatters even with similar infrared luminosities (see Figure 3). Thus, different HCN/HCO+ 1-0 ratios in galaxies should not be caused by star formation activities, as suggested by Graciá-Carpio et al. (2006) for higher HCN/HCO+ ratios in ULIRGs than galaxies with lower infrared luminosity.
Red dashed lines represent averaged values with axis bins for “AGN” sources, while black lines for “No AGN” sources, are also presented in Figure 3. No clear difference between these two sub-groups: “AGN” and “No AGN”, is found in Figure 3. Abundance, opacity and excitation of HCN and HCO+ molecules can affect the line ratio of HCN/HCO+ 1-0. Even if starburst activities, which cause strong photon dominated regions (PDRs), or AGN activities, which cause strong X-ray dominated regions (XDRs), may enhance HCN or HCO+ abundances, it is hard to use line ratio of such optically thick lines: HCN and HCO+ 1-0, to derive the abundance ratio of HCN and HCO+. Such line ratio may not be a good tracer of AGN activity had been pointed out by Costagliola et al. (2011) and Privon et al. (2015) with smaller sample than ours. With the comparison with X-ray emission, Privon et al. (2020) had pointed out that HCN/HCO+ line ratios can not be a reliable method to find AGN, which is consistent with our results.
As optically thin lines, H13CN and H13CO+ 1-0, the isotopic lines of HCN and HCO+, will be a better choice than HCN and HCO+ 1-0 to derive abundance ratio of HCN and HCO+. However, it is hard to do large sample survey due to weak emission of these isotopic lines, which are normally several times to tens of times weaker than their main isotopic lines, as seen in NGC 1068 (Wang et al., 2014), Arp 220 (Wang et al., 2016), Mrk 231 (Lindberg et al., 2016; Li et al., 2020), M82 and NGC 3079 (Li et al., 2020), and NGC 4418 (Costagliola et al., 2015; Li et al., 2020). ALMA observations of H13CN and H13CO+ lines toward local galaxies in the future will help us to determine the enhancement of these molecules due to starburst or AGN activities.
Neither any trend of HCN/HNC 1-0 ratio along with infrared luminosity, nor clear difference between “AGN” and “No AGN” groups for HCN/HNC 1-0 ratios versus infrared luminosities, can be found (see Figure 3). We also notice that the sources with low HCN/HNC 1-0 ratios in Aalto et al. (2002): 1.0 in IC 694 and Mrk 231 may not be real. With better sensitivity than that in Aalto et al. (2002) and simultaneous observation, our data show that this ratio is 3.60.4 in IC 694 and 2.30.1 in Mrk 231 (see Table LABEL:tab:intensity). Especially, the simultaneous observation can avoid the uncertainties of pointing error to obtain the line ratio. Similar to that of determining possible enhancement of HCN or HCO+ molecules due to starburst or AGN activities, optically thin isotopic lines of HCN and HNC 1-0 should be used to derive HCN/HNC abundance ratio, even if this ratio can reflect starburst evolution with gas phase chemistry in molecular clouds.
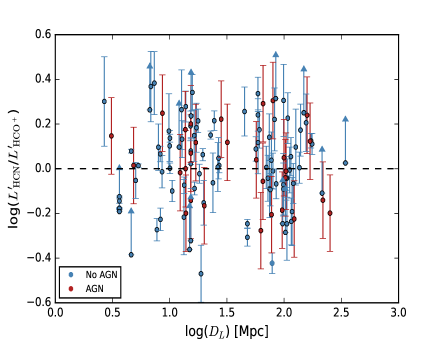
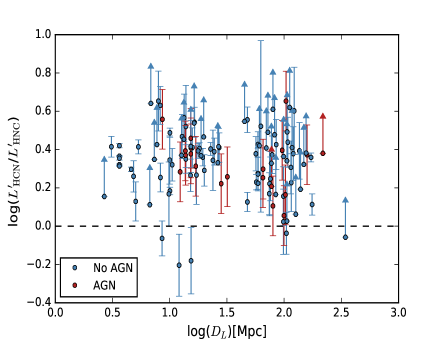
HCN/HCO+ 1-0 and HCN/HNC 1-0 ratios versus luminosity distances are also presented in Figure 3. Since the beam of IRAM 30m at 3mm band can cover only central region of nearby galaxies, while it can cover entire galaxy for distant sources. There is no obvious trend of HCN/HCO+ 1-0 and HCN/HNC 1-0 ratios with distance (see Figure 3). Thus, the covering area of one galaxy with IRAM 30m beam () is not a dominate factor for the line ratios, which is consistent with that in Privon et al. (2015).
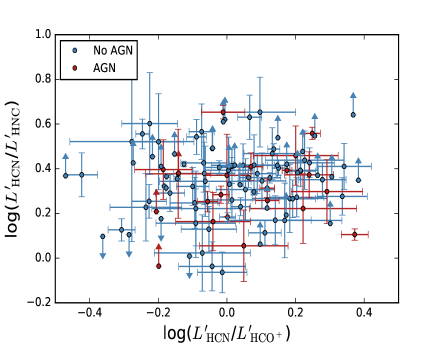
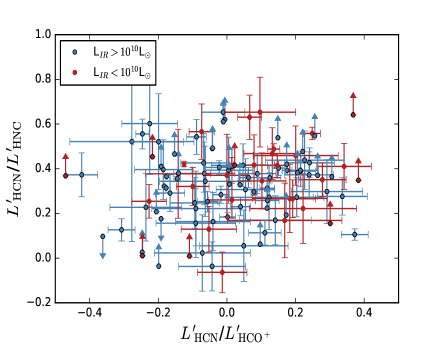
We also try to use the combination of HCN/HCO+ 1-0 and HCN/HNC 1-0 ratio to determine the effect of AGN and starburst activities. Plots of HCN/HCO+ 1-0 and HCN/HNC 1-0 ratios are presented in Figure 4. In the left of Figure 4, the sample is separated into two sub-groups as “AGN” in red and “No AGN” in blue, while it is separated into two sub-groups with in blue and in red at the right of Figure 4. It is impossible to separate “AGN” and “No AGN”, or starburst and normal star forming galaxies, with the combination of HCN/HCO+ 1-0 and HCN/HNC 1-0 ratios.
6 summary and conclusion remarks
With simultaneous observations of HCN 1-0, HCO+ 1-0, HNC 1-0, and CS 3-2 toward 70 local galaxies with a wide infrared luminosity coverage from several 10 to more than 10, we detected these lines with detection rate of 89%, 90%, 73%, and 51%, respectively. After combining data from literature (Privon et al., 2015; Costagliola et al., 2011), we complied a sample of 140 galaxies with simultaneous observations of HCN 1-0, HCO+ 1-0, and HNC 1-0. With comparison of luminosities of dense gas tracers and infrared luminosity, line ratios, the main conclusions are listed below:
1. The slopes of global relations between luminosities of dense gas tracers (HCN 1-0, HCO+ 1-0, HNC 1-0, and CS 3-2) and infrared luminosities are close to unity. Even though there may be several times uncertainties of estimating dense gas mass in individual galaxy from one dense gas tracer, these dense gas tracers give similar results for dense gas star formation law.
2. No clear trend is found for the relation between infrared luminosities and star formation efficiencies derived with HCN 1-0, HCO+ 1-0 and HNC 1-0, which means that dense gas depletion time to form stars from dense molecular gas does not relate to SFR.
3. HCN/HCO+ line ratio can not be a good tool to diagnose obscured AGN in galaxies. Even combining with HCN/HNC line ratio will not improve such diagnostic.
Acknowledgements
This work is supported by the National Natural Science Foundation of China grant 11590783, and U1731237. This study is based on observations carried out under project number 066-19, 186-18 and 058-17 with the IRAM 30-m telescope. IRAM is supported by INSU/CNRS (France), MPG (Germany) and IGN (Spain). This research has made use of the NASA/IPAC Extragalactic Database, which is funded by the National Aeronautics and Space Administration and operated by the California Institute of Technology.
Data availability
The original data observed with IRAM 30 meter can be accessed by IRAM archive system at https://www.iram-institute.org/EN/content-page-386-7-386-0-0-0.html. If anyone is interested in the reduced data presented in this paper, please contact Junzhi Wang at jzwang@shao.ac.cn.
| Source Name | RA | DEC | F100μm | cz | Distance | Obs Month | tint | Tsys |
|---|---|---|---|---|---|---|---|---|
| (J2000) | (J2000) | (Jy) | km s-1 | (Mpc) | (YYYY MM) | (minutes) | (K) | |
| NGC 891 | 02:22:33.5 | +42:21:18 | 172.23 | 533 | 8.57 | 2019 Aug | 80 | 103 |
| IC 342 | 03:46:49.4 | +68:05:49 | 391.66 | 31 | 4.60 | 2019 Aug | 20 | 100 |
| UGC 02855 | 03:48:19.4 | +70:08:03 | 89.18 | 1184 | 19.46 | 2019 Aug | 100 | 108 |
| NGC 1569 | 04:30:49.5 | +64:51:01 | 55.29 | -97 | 4.60 | 2019 Aug | 102 | 126 |
| NGC 2146 | 06:18:39.8 | +78:21:25 | 194.05 | 885 | 16.47 | 2019 Aug | 61 | 122 |
| NGC 2403 | 07:36:51.3 | +65:36:30 | 99.13 | 161 | 3.22 | 2019 Aug | 81 | 101 |
| NGC 2683 | 08:52:40.1 | +33:25:23 | 30.68 | 425 | 7.34 | 2019 Aug | 204 | 122 |
| NGC 2903 | 09:32:10.5 | +21:30:05 | 130.43 | 566 | 8.26 | 2019 Jul | 37 | 99 |
| NGC 2976 | 09:47:14.5 | +67:55:10 | 33.43 | 11 | 2.68 | 2019 Aug | 86 | 106 |
| NGC 3031 | 09:55:33.6 | +69:03:56 | 174.02 | -34 | 3.63 | 2019 Aug | 88 | 107 |
| M82_1 | 09:55:48.0 | +69:40:40 | 1373.69 | 187 | 3.63 | 2019 Feb | 115 | 83 |
| M82_2 | 09:55:50.0 | +69:40:43 | 1373.69 | 187 | 3.63 | 2019 Feb | 116 | 94 |
| M82_3(center) | 09:55:53.1 | +69:40:41 | 1373.69 | 187 | 3.63 | 2017 Jul | 106 | 145 |
| M82_4 | 09:55:55.0 | +69:40:50 | 1373.69 | 187 | 3.63 | 2019 Feb | 118 | 134 |
| M82_5 | 09:55:57.0 | +69:40:55 | 1373.69 | 187 | 3.63 | 2019 Feb | 89 | 101 |
| NGC 3079 | 10:01:57.9 | +55:40:51 | 104.69 | 1166 | 16.1 | 2017 Jul | 122 | 90 |
| NGC 3310 | 10:38:46.2 | +53:30:08 | 44.19 | 1060 | 19.81 | 2019 Feb | 120 | 83 |
| NGC 3351 | 10:43:58.1 | +11:42:10 | 41.10 | 769 | 9.99 | 2019 Jul | 65 | 112 |
| NGC 3368 | 10:46:45.6 | +11:49:13 | 31.63 | 916 | 10.51 | 2019 Jul | 47 | 93 |
| NGC 3504 | 11:03:11.1 | +27:58:22 | 34.05 | 1550 | 27.07 | 2017 Jul | 67 | 99 |
| NGC 3521 | 11:05:49.2 | -00:02:15.0 | 121.76 | 736 | 6.84 | 2019 Feb | 102 | 90 |
| NGC 3593 | 11:14:37.4 | +12:49:02 | 36.44 | 578 | 5.04 | 2019 Jul | 64 | 91 |
| NGC 3627 | 11:20:15.3 | +12:59:32 | 136.56 | 740 | 10.04 | 2019 Feb | 85 | 87 |
| NGC 3628 | 11:20:17.4 | +13:35:19 | 105.76 | 825 | 10.04 | 2019 Feb | 52 | 90 |
| NGC 3675 | 11:26:09.0 | +43:35:04 | 36.56 | 804 | 12.69 | 2019 Jul | 74 | 101 |
| NGC 3690 | 11:28:31.0 | +58:33:48 | 111.42 | 3159 | 47.74 | 2019 Feb | 102 | 82 |
| NGC 3810 | 11:40:57.8 | +11:28:18 | 35.07 | 1001 | 15.36 | 2019 Jul | 63 | 106 |
| NGC 3893 | 11:48:37.7 | +48:42:45 | 36.80 | 892 | 16.35 | 2019 Jul | 78 | 105 |
| IC 694 | 11:28:34.2 | +58:33:48 | 111.42 | 3100 | 47.74 | 2017 Jul | 120 | 83 |
| NGC 3953 | 11:53:48.4 | +52:19:44 | 31.12 | 1016 | 17.58 | 2019 May | 120 | 115 |
| NGC 4030 | 12:00:23.8 | -01:06:03 | 50.92 | 1427 | 24.50 | 2019 Jul | 81 | 108 |
| NGC 4041 | 12:02:12.8 | +62:08:07 | 31.74 | 1243 | 22.78 | 2019 May | 100 | 92 |
| NGC 4088 | 12:05:35.1 | +50:32:24 | 61.68 | 696 | 13.37 | 2019 Feb | 81 | 98 |
| NGC 4102 | 12:06:23.6 | +52:42:36 | 70.29 | 859 | 16.89 | 2019 Jul | 47 | 99 |
| NGC 4157 | 12:11:04.2 | +50:29:04 | 50.67 | 790 | 13.30 | 2019 Jul | 71 | 99 |
| NGC 4217 | 12:15:50.3 | +47:05:30 | 41.19 | 1028 | 17.13 | 2019 May | 102 | 90 |
| NGC 4254 | 12:18:51.0 | +14:24:50 | 91.86 | 2403 | 15.29 | 2019 Feb | 94 | 86 |
| NGC 4303 | 12:21:55.4 | +04:28:24 | 78.74 | 1570 | 15.29 | 2019 Feb | 83 | 92 |
| NGC 4321 | 12:22:53.9 | +15:49:22 | 68.37 | 1571 | 15.20 | 2019 Jul | 48 | 130 |
| NGC 4414 | 12:26:26.9 | +31:13:24 | 70.69 | 720 | 17.68 | 2019 Feb | 77 | 85 |
| NGC 4418 | 12:26:54.7 | -00:52:42 | 31.94 | 2104 | 31.90 | 2019 Feb | 81 | 108 |
| NGC 4501 | 12:31:57.6 | +14:25:20 | 62.97 | 2284 | 15.29 | 2019 Jul | 54 | 109 |
| NGC 4490 | 12:30:34.9 | +41:38:47 | 88.61 | 641 | 10.48 | 2019 Feb | 102 | 90 |
| NGC 4535 | 12:34:19.9 | +08:11:52 | 32.52 | 1957 | 15.77 | 2019 Jul | 67 | 105 |
| NGC 4527 | 12:34:09.9 | +02:39:04 | 65.68 | 1771 | 15.29 | 2019 Feb | 102 | 85 |
| NGC 4536 | 12:34:28.5 | +02:11:08 | 44.51 | 1802 | 14.92 | 2019 Feb | 138 | 85 |
| NGC 4568 | 12:36:33.7 | +11:14:32 | 56.80 | 2262 | 15.29 | 2019 Aug | 37 | 112 |
| NGC 4605 | 12:40:00.9 | +61:36:28 | 30.55 | 117 | 3.90 | 2019 Jul | 64 | 107 |
| NGC 4631 | 12:42:07.1 | +32:32:33 | 160.08 | 630 | 7.73 | 2019 Aug | 34 | 94 |
| NGC 4654 | 12:43:56.6 | +13:07:39 | 37.77 | 1037 | 15.29 | 2019 Aug | 47 | 94 |
| NGC 4736 | 12:50:52.9 | +41:07:15 | 120.69 | 323 | 4.83 | 2019 Aug | 74 | 86 |
| NGC 4666 | 12:45:07.7 | -00:27:41 | 85.95 | 1495 | 12.82 | 2019 Jul | 41 | 99 |
| Mrk 231 | 12:56:14.2 | +56:52:25 | 29.74 | 12139 | 175 | 2017 Jul | 153 | 94 |
| NGC 4826 | 12:56:42.6 | +21:41:05 | 81.65 | 349 | 3.09 | 2019 Aug | 29 | 82 |
| NGC 5033 | 13:13:27.2 | +36:35:40 | 50.23 | 869 | 13.76 | 2019 Aug | 34 | 91 |
| NGC 5055 | 13:15:49.5 | +42:01:39 | 139.82 | 500 | 7.96 | 2019 Aug | 40 | 91 |
| NGC 5054 | 13:16:59.0 | -16:38:04 | 31.53 | 1737 | 23.87 | 2019 Jul | 78 | 114 |
| NGC 5194 | 13:29:53.5 | +47:11:42 | 221.21 | 468 | 8.63 | 2019 Aug | 81 | 87 |
| NGC 5195 | 13:30:00.0 | +47:16:00 | 31.33 | 450 | 8.30 | 2019 Aug | 54 | 90 |
| NGC 5248 | 13:37:31.8 | +08:53:12 | 53.48 | 1152 | 13.82 | 2019 Jul | 84 | 140 |
| NGC 5247 | 13:38:03.4 | -17:53:04 | 41.83 | 1362 | 18.77 | 2019 Jul | 58 | 112 |
| NGC 5713 | 14:40:10.9 | -00:17:22 | 37.28 | 1904 | 26.74 | 2019 Aug | 55 | 119 |
| NGC 5457 | 14:03:09.0 | +54:21:24 | 252.84 | 241 | 6.70 | 2019 Aug | 54 | 94 |
| NGC 5775 | 14:53:58.0 | +03:32:32 | 55.64 | 1642 | 26.34 | 2019 Jul | 47 | 94 |
| CGCG 049-057 | 15:13:12.7 | +07:13:30 | 31.53 | 3893 | 59.06 | 2019 Jul | 47 | 96 |
| NGC 5907 | 15:15:58.9 | +56:18:36 | 37.43 | 612 | 12.08 | 2019 Aug | 102 | 186 |
| Arp 220 | 15:34:57.1 | +23:30:10 | 119.25 | 5450 | 79.90 | 2019 Aug | 47 | 94 |
| NGC 6240 | 16:52:58.6 | +02:24:03 | 26.49 | 7298 | 103.86 | 2017 Jul | 38 | 164 |
| NGC 6822 | 19:44:56.8 | -14:48:24 | 95.42 | -56 | 0.54 | 2019 Jul | 70 | 115 |
| NGC 6946 | 20:34:52.6 | +60:09:12 | 290.69 | 53 | 5.32 | 2017 Jul | 51 | 90 |
| Source Name | IHCN(1-0) | I | IHNC(1-0) | ICS(3-2) |
|---|---|---|---|---|
| (K km s-1) | (K km s-1) | (K km s-1) | (K km s-1) | |
| NGC 891 | 0.63 0.07 | 0.65 0.08 | 0.73 0.13 | |
| IC 342 | 9.40 0.13 | 7.84 0.11 | 4.75 0.11 | 2.45 0.13 |
| UGC 2855 | 2.82 0.11 | 2.44 0.12 | 1.23 0.12 | 0.59 0.14 |
| NGC 1569 | 0.34 0.10 | |||
| NGC 2146 | 4.15 0.16 | 5.09 0.27 | 1.19 0.21 | 1.22 0.23 |
| NGC 2403 | ||||
| NGC 2683 | 0.29 0.06 | 0.12 0.03 | ||
| NGC 2903 | 2.69 0.14 | 2.31 0.14 | 0.63 0.14 | |
| NGC 2976 | 0.20 0.07 | 0.10 0.03 | 0.31 0.09 | |
| NGC 3031 | 0.28 0.05 | |||
| M 82_1 | 16 0.04 | 24 0.07 | 6.9 0.06 | 4.94 0.08 |
| M 82_2 | 26 0.08 | 39.6 0.09 | 12.4 0.08 | 11.35 0.08 |
| M 82_3 | 27.6 0.07 | 41.5 0.11 | 13.4 0.08 | 12.93 0.45 |
| M 82_4 | 25.8 0.57 | 36 0.11 | 11.4 0.08 | 9.50 0.33 |
| M 82_5 | 15 0.06 | 20 0.10 | 5.7 0.14 | 4.31 0.13 |
| NGC 3079 | 5.6 0.14 | 5.9 0.56 | 2.2 0.14 | 3.12 0.20 |
| NGC 3310 | 0.38 0.06 | 0.54 0.09 | 0.53 0.06 | |
| NGC 3351 | 1.86 0.23 | 1.47 0.15 | 0.84 0.11 | 0.88 0.25 |
| NGC 3368 | 1.82 0.12 | 2.29 0.20 | 0.87 0.16 | 1.43 0.21 |
| NGC 3504 | 2.11 0.10 | 2.04 0.12 | 0.82 0.14 | 0.94 0.15 |
| NGC 3521 | 0.70 0.10 | 0.30 0.10 | ||
| NGC 3593 | 1.01 0.16 | 1.14 0.11 | 0.75 0.13 | 0.58 0.16 |
| NGC 3627 | 3.26 0.09 | 2.38 0.07 | 1.06 0.05 | 1.34 0.09 |
| NGC 3628 | 4.32 0.16 | 4.30 0.17 | 2.83 0.07 | 2.09 0.17 |
| NGC 3675 | 0.68 0.17 | 0.37 0.12 | ||
| NGC 3690 | 1.07 0.08 | 2.17 0.11 | 0.80 0.07 | 0.68 0.09 |
| NGC 3810 | 0.31 0.10 | 0.47 0.11 | 0.69 0.24 | |
| NGC 3893 | 0.76 0.13 | 0.54 0.11 | ||
| IC 694 | 2.66 0.10 | 4.69 0.11 | 0.74 0.11 | 2.01 0.22 |
| NGC 3953 | 0.31 0.07 | 0.25 0.05 | ||
| NGC 4030 | 2.23 0.11 | 1.36 0.12 | 0.91 0.14 | 0.51 0.13 |
| NGC 4041 | 2.15 0.07 | 1.52 0.04 | 0.85 0.06 | 0.50 0.07 |
| NGC 4088 | 0.92 0.05 | 1.09 0.07 | 0.25 0.07 | |
| NGC 4102 | 5.16 0.14 | 3.94 0.16 | 2.51 0.23 | 1.42 0.25 |
| NGC 4157 | 0.54 0.13 | 0.89 0.27 | ||
| NGC 4217 | 0.61 0.07 | 0.40 0.09 | 0.33 0.11 | |
| NGC 4254 | 0.60 0.04 | 0.50 0.06 | 0.23 0.07 | |
| NGC 4303 | 1.41 0.09 | 1.20 0.06 | 0.55 0.07 | 0.76 0.08 |
| NGC 4321 | 1.99 0.12 | 1.28 0.18 | 1.08 0.20 | |
| NGC 4414 | 2.57 0.21 | 1.57 0.14 | 1.04 0.04 | |
| NGC 4418 | 2.48 0.13 | 1.89 0.11 | 1.37 0.10 | 1.91 0.15 |
| NGC 4501 | 0.92 0.11 | 0.58 0.15 | 0.32 0.09 | 0.48 0.15 |
| NGC 4490 | 0.28 0.09 | 0.19 0.04 | 0.19 0.04 | |
| NGC 4535 | 0.90 0.06 | 0.41 0.07 | 0.35 0.08 | 0.60 0.10 |
| NGC 4527 | 0.21 0.07 | 0.21 0.07 | ||
| NGC 4536 | 0.23 0.05 | |||
| NGC 4568 | 0.99 0.14 | 0.94 0.20 | ||
| NGC 4605 | ||||
| NGC 4631 | 0.64 0.06 | 1.20 0.08 | ||
| NGC 4654 | ||||
| NGC 4736 | 0.91 0.09 | 0.88 0.11 | 0.50 0.08 | 0.52 0.12 |
| NGC 4666 | 1.41 0.19 | 1.04 0.14 | 0.48 0.11 | |
| Mrk 231 | 1.6 0.05 | 1.2 0.05 | 0.7 0.03 | |
| NGC 4826 | 4.08 0.12 | 2.91 0.17 | 1.57 0.19 | 0.64 0.16 |
| NGC 5033 | 1.76 0.16 | 1.76 0.19 | 0.75 0.31 | 0.37 0.12 |
| NGC 5055 | 1.71 0.19 | 1.37 0.29 | 0.38 0.13 | |
| NGC 5054 | 0.64 0.12 | 0.74 0.18 | 0.29 0.09 | 0.75 0.14 |
| NGC 5194 | 4.59 0.14 | 2.59 0.12 | 1.27 0.07 | |
| NGC 5195 | 1.40 0.14 | 2.36 0.14 | 0.78 0.11 | |
| NGC 5248 | 2.22 0.18 | 1.17 0.16 | 0.99 0.15 | |
| NGC 5247 | 0.42 0.09 | 1.24 0.25 | ||
| NGC 5713 | 1.17 0.11 | 1.05 0.10 | 0.45 0.09 | 0.45 0.13 |
| NGC 5457 | 0.22 0.04 | |||
| NGC 5775 | 0.60 0.12 | 0.59 0.08 | 0.27 0.13 | |
| CGCG049-057 | 2.35 0.21 | 1.35 0.19 | 0.88 0.11 | 1.14 0.20 |
| NGC 5907 | 0.15 0.05 | 0.24 0.04 | ||
| Arp 220 | 8.58 0.31 | 3.64 0.30 | 6.73 0.31 | 4.97 0.31 |
| NGC 6240 | 2.7 0.05 | 2.77 0.40 | 0.60 0.04 | |
| NGC 6822 | ||||
| NGC 6946 | 9.34 0.10 | 9.05 0.13 | 3.60 0.30 | 3.61 0.11 |
| Source | log | log | log | log | loga | logb | Type |
|---|---|---|---|---|---|---|---|
| (K km s-1) | (K km s-1) | (K km s-1) | (K km s-1) | log | log | ||
| NGC 891 | 5.98 0.05 | 5.99 0.05 | 6.04 0.08 | 9.89 0.11 | 9.690.11 | SA(s)b | |
| IC 342 | 6.61 0.01 | 6.53 0.01 | 6.32 0.01 | 6.02 0.02 | 10.14 0.09 | 10.070.09 | SAB(rs)cd |
| ∗UGC 2855 | 7.34 0.02 | 7.28 0.02 | 6.98 0.04 | 0.66 0.10 | 10.75 0.09 | 10.750.09 | SB |
| NGC 1569 | 5.17 0.13 | 8.86 0.11 | 8.360.11 | IBm | |||
| NGC 2146 | 7.36 0.02 | 7.45 0.02 | 6.82 0.08 | 6.83 0.08 | 10.50 0.11 | 9.550.11 | SB |
| NGC 2403 | 7.64 0.11 | 7.040.11 | SAB(s)cd | ||||
| NGC 2683 | 5.51 0.09 | 5.12 0.11 | 8.68 0.11 | 8.240.09 | SA(rs)b | ||
| NGC 2903 | 6.58 0.02 | 6.51 0.03 | 5.95 0.10 | 9.83 0.09 | 9.730.09 | SAB(rs)bc | |
| NGC 2976 | 4.47 0.15 | 4.17 0.13 | 4.66 0.13 | 7.59 0.09 | 7.230.11 | SAc | |
| NGC 3031 | 4.88 0.08 | 8.23 0.11 | 8.030.11 | SA(s)ab | |||
| M 82_1 | 6.64 0.001 | 6.81 0.001 | 6.27 0.004 | 6.13 0.01 | 10.04 0.11 | 9.650.11 | SB |
| M 82_2 | 6.85 0.001 | 7.03 0.001 | 6.53 0.003 | 6.49 0.01 | 10.330.11 | 10.110.11 | SB |
| M 82_3 | 6.87 0.001 | 7.05 0.001 | 6.560.003 | 6.55 0.02 | 10.310.11 | 9.930.11 | SB |
| M 82_4 | 6.85 0.01 | 6.99 0.001 | 6.490.003 | 6.41 0.02 | 10.270.11 | 10.100.11 | SB |
| M 82_5 | 6.61 0.001 | 6.73 0.002 | 6.19 0.01 0.01 | 6.07 0.01 | 9.95 0.12 | 9.500.11 | SB |
| NGC 3079 | 7.58 0.01 | 7.60 0.04 | 7.17 0.03 | 7.32 0.03 | 10.770.11 | 10.700.11 | SB |
| NGC 3310 | 6.48 0.07 | 6.64 0.07 | 6.63 0.05 | 10.540.09 | 10.440.11 | SB | |
| NGC 3351 | 6.58 0.05 | 6.48 0.04 | 6.23 0.11 | 6.25 0.12 | 9.750.11 | 9.580.11 | SB(r)b |
| NGC 3368 | 6.61 0.03 | 6.71 0.04 | 6.29 0.08 | 6.51 0.06 | 9.260.09 | 9.150.09 | SAB(rs)ab |
| NGC 3504 | 7.50 0.02 | 7.48 0.03 | 7.09 0.07 | 7.15 0.07 | 10.530.11 | 10.440.11 | SB |
| NGC 3521 | 5.83 0.06 | 5.46 0.14 | 9.180.11 | 8.700.11 | SAB(rs)bc | ||
| NGC 3593 | 5.72 0.26 | 5.77 0.04 | 5.59 0.08 | 5.480.12 | 9.170.09 | 9.030.09 | SA(s) |
| NGC 3627 | 6.83 0.01 | 6.69 0.01 | 6.34 0.02 | 6.440.03 | 9.730.11 | 9.540.11 | SB |
| NGC 3628 | 6.95 0.02 | 6.95 0.02 | 6.77 0.01 | 6.640.04 | 10.280.11 | 10.130.11 | SB |
| NGC 3675 | 6.35 0.11 | 6.09 0.14 | 9.50 0.09 | 9.260.09 | SA(s)b | ||
| NGC 3690 | 7.69 0.03 | 8.00 0.02 | 7.56 0.04 | 7.49 0.06 | 11.570.12 | 10.13 0.11 | SB |
| ∗NGC 3810 | 6.17 0.14 | 6.36 0.10 | 6.520.15 | 10.120.09 | 10.120.11 | SB | |
| ∗NGC 3893 | 6.62 0.07 | 6.47 0.09 | 10.200.09 | 10.200.09 | SB | ||
| IC 694 | 8.08 0.02 | 8.33 0.01 | 7.52 0.06 | 7.960.05 | 11.740.11 | 11.650.11 | SB |
| NGC 3953 | 6.290.10 | 6.200.09 | 8.96 0.09 | 8.770.11 | SB(r)bc | ||
| NGC 4030 | 7.43 0.02 | 7.22 0.04 | 7.05 0.07 | 6.790.11 | 10.350.11 | 10.030.09 | SB |
| NGC 4041 | 7.36 0.01 | 7.21 0.01 | 6.95 0.03 | 6.720.06 | 10.350.11 | 10.190.09 | SB |
| NGC 4088 | 6.53 0.02 | 6.60 0.03 | 5.96 0.12 | 9.760.11 | 9.480.09 | SB | |
| NGC 4102 | 7.48 0.01 | 7.36 0.02 | 7.17 0.04 | 6.920.08 | 10.460.11 | 10.350.11 | SB/AGN |
| NGC 4157 | 6.29 0.10 | 6.51 0.13 | 5.84 0.00 | 9.660.09 | 9.42 0.09 | SB | |
| NGC 4217 | 6.56 0.05 | 6.38 0.10 | 6.30 0.14 | 9.830.11 | 9.560.11 | SB | |
| NGC 4254 | 6.45 0.03 | 6.37 0.05 | 6.03 0.13 | 9.780.11 | 9.56 0.11 | SB | |
| NGC 4303 | 6.83 0.03 | 6.76 0.02 | 6.42 0.06 | 6.560.05 | 9.600.11 | 9.460.11 | SB |
| NGC 4321 | 6.97 0.03 | 6.78 0.06 | 6.71 0.08 | 9.730.11 | 9.530.09 | SB | |
| NGC 4414 | 7.22 0.04 | 7.00 0.04 | 6.82 0.02 | 10.260.09 | 9.880.09 | SB | |
| NGC 4418 | 7.71 0.02 | 7.59 0.03 | 7.45 0.03 | 7.600.03 | 10.990.09 | 10.980.11 | SB/AGN |
| NGC 4501 | 6.64 0.05 | 6.44 0.11 | 6.18 0.12 | 6.350.14 | 9.560.09 | 9.230.11 | SB/AGN |
| NGC 4490 | 5.75 0.14 | 5.58 0.09 | 5.58 0.09 | 9.700.09 | 9.410.09 | SB | |
| NGC 4535 | 6.66 0.03 | 6.31 0.07 | 6.25 0.10 | 6.480.07 | 9.430.11 | 9.230.09 | SB |
| NGC 4527 | 6.00 0.14 | 6.00 0.14 | 9.550.11 | 8.680.11 | SB | ||
| NGC 4536 | 6.02 0.09 | 9.670.11 | 9.860.11 | SB | |||
| NGC 4568 | 6.67 0.06 | 6.65 0.09 | 9.280.11 | 8.770.11 | SB | ||
| NGC 4605 | 4.78 0.00 | 4.84 0.00 | 8.350.09 | 7.950.09 | SB(s)c | ||
| NGC 4631 | 5.89 0.04 | 6.17 0.03 | 9.540.11 | 9.230.11 | SB | ||
| NGC 4654 | 9.590.11 | 9.300.11 | SB | ||||
| NGC 4736 | 5.64 0.04 | 5.63 0.05 | 5.38 0.07 | 5.40 0.10 | 9.200.11 | 8.960.11 | AGN |
| NGC 4666 | 6.67 0.06 | 6.54 0.06 | 6.21 0.10 | 9.740.11 | 9.150.11 | SB | |
| Mrk 231 | 8.94 0.01 | 8.81 0.03 | 8.58 0.02 | 12.390.11 | 8.960.11 | SB | |
| NGC 4826 | 5.90 0.01 | 5.76 0.03 | 5.49 0.05 | 5.10 0.12 | 8.800.11 | 8.420.11 | AGN |
| NGC 5033 | 6.83 0.04 | 6.83 0.05 | 6.46 0.18 | 6.170.14 | 9.290.11 | 9.010.11 | SB/AGN |
| NGC 5055 | 6.35 0.05 | 6.25 0.09 | 5.69 0.15 | 9.420.11 | 9.010.11 | SB | |
| ∗NGC 5054 | 6.87 0.08 | 6.93 0.11 | 6.53 0.13 | 6.940.08 | 10.340.09 | 10.340.09 | SB |
| NGC 5194 | 6.85 0.01 | 6.60 0.02 | 6.29 0.02 | 9.530.11 | 9.070.11 | SB/AGN | |
| NGC 5195 | 6.30 0.04 | 6.52 0.03 | 6.04 0.06 | 9.300.12 | 9.210.11 | I0 | |
| NGC 5248 | 6.94 0.04 | 6.66 0.06 | 6.59 0.07 | 9.790.11 | 9.54 0.11 | SB | |
| NGC 5247 | 6.48 0.09 | 6.95 0.09 | 6.11 0.00 | 9.680.09 | 9.500.09 | SB | |
| NGC 5713 | 7.23 0.04 | 7.18 0.08 | 6.81 0.87 | 6.810.13 | 10.540.11 | 10.330.11 | SB |
| NGC 5457 | 5.31 0.08 | 7.960.14 | 7.40 0.11 | SB | |||
| NGC 5775 | 6.93 0.09 | 6.92 0.07 | 10.320.09 | 10.100.09 | SB | ||
| CGCG049-057 | 8.21 0.04 | 7.97 0.06 | 7.78 0.05 | 7.900.08 | 11.340.11 | 11.200.11 | SB |
| NGC 5907 | 5.65 0.14 | 5.86 0.07 | 9.060.11 | 8.630.11 | SA(s)c | ||
| Arp 220 | 9.03 0.02 | 8.66 0.04 | 8.92 0.02 | 8.67 0.04 | 12.190.11 | 12.160.11 | SB/AGN |
| NGC 6240 | 8.75 0.01 | 8.76 0.06 | 8.09 0.03 | 11.830.11 | 11.780.11 | SB/AGN | |
| NGC 6822 | 5.280.15 | 4.780.11 | IB(s)m | ||||
| NGC 6946 | 6.74 0.00 | 6.72 0.01 | 6.32 0.04 | 5.980.03 | 9.630.11 | 9.530.11 | SB |
| IRAS17208 | 9.11 0.03 | 9.00 0.04 | 9.00 0.05 | 12.460.11 | SB | ||
| IC 860 | 7.96 0.05 | 7.76 0.06 | 7.69 0.07 | 11.190.11 | SB | ||
| NGC 1614 | 7.86 0.16 | 8.13 0.09 | 7.33 0.42 | 11.510.11 | SB | ||
| NGC 4388 | 6.46 0.08 | 6.61 0.06 | 6.09 0.18 | 9.52 0.11 | SB/AGN | ||
| NGC 6090 | 8.20 0.07 | 8.43 0.04 | 7.60 0.22 | 11.400.12 | SB | ||
| NGC 7469 | 8.29 0.02 | 8.34 0.02 | 8.03 0.04 | 11.510.11 | SB/AGN | ||
| NGC 7771 | 8.41 0.02 | 8.37 0.02 | 8.18 0.04 | 11.290.11 | SB | ||
| NGC 660 | 7.24 0.02 | 7.26 0.02 | 6.96 0.03 | 9.860.09 | SB/AGN | ||
| NGC 3556 | 6.39 0.06 | 6.59 0.04 | 5.87 0.21 | 9.310.09 | SB | ||
| NGC 1068 | 7.99 0.01 | 7.82 0.01 | 7.60 0.02 | 10.770.11 | SB/AGN | ||
| ∗UGC 2866 | 7.15 0.04 | 7.32 0.02 | 6.86 0.07 | 10.680.09 | SB | ||
| NGC 2273 | 7.02 0.08 | 6.80 0.13 | 6.80 0.13 | 10.180.11 | SB/AGN | ||
| NGC 34 | 7.92 0.07 | 8.13 0.06 | 11.440.09 | SB/AGN | |||
| MCG –02-01-052 | 8.08 0.10 | 11.410.09 | SB | ||||
| MCG –02-01-051 | 7.56 0.13 | 7.81 0.10 | 11.410.09 | SB | |||
| IC 1623 | 8.26 0.04 | 8.68 0.02 | 7.88 0.09 | 11.650.09 | SB | ||
| MCG –03-04-014 | 8.51 0.06 | 8.51 0.04 | 8.12 0.14 | 11.630.09 | SB | ||
| IRAS 01364-1042 | 11.760.09 | SB/AGN | |||||
| IC 214 | 7.97 0.12 | 8.16 0.09 | 11.370.09 | SB | |||
| NGC 0958 | 11.170.09 | SB | |||||
| ESO 550-IG 025 | 8.13 0.11 | 8.03 0.13 | 11.450.09 | SB | |||
| UGC 3094 | 8.13 0.08 | 11.350.09 | SB | ||||
| NGC 1797 | 7.70 0.10 | 7.58 0.09 | 11.000.09 | SB | |||
| VII Zw 31 | 9.01 0.14 | 11.940.09 | SB | ||||
| IRAS F05189-2524 | 8.58 0.08 | 8.45 0.10 | 8.30 0.12 | 12.110.09 | SB/AGN | ||
| IRAS F05187-1017 | 8.25 0.06 | 8.26 0.08 | 11.230.09 | SB | |||
| IRAS F06076-2139 | 8.63 0.08 | 11.590.09 | SB | ||||
| NGC 2341 | 7.57 0.00 | 11.250.09 | SB | ||||
| NGC 2342 | 7.84 0.07 | 7.88 0.08 | 11.250.09 | SB | |||
| IRAS 07251+0248 | 8.82 0.14 | 12.320.09 | SB | ||||
| NGC 2623 | 8.49 0.08 | 8.45 0.10 | 11.540.09 | SB | |||
| IRAS 09111-1007W | 8.70 0.06 | 8.84 0.08 | 12.000.09 | SB/AGN | |||
| IRAS 09111-1007E | 12.000.09 | SB | |||||
| UGC 5101 | 9.00 0.04 | 8.76 0.06 | 8.63 0.09 | 11.950.09 | SB/AGN | ||
| CGCG 011-076 | 8.37 0.06 | 8.41 0.06 | 11.370.09 | SB | |||
| IRAS F12224-0624 | 11.270.09 | SB | |||||
| CGCG 043-099 | 11.620.09 | SB | |||||
| ESO 507-G 070 | 8.34 0.07 | 8.52 0.05 | 7.94 0.12 | 11.490.09 | SB/AGN | ||
| NGC 5104 | 8.21 0.08 | 7.99 0.12 | 11.2 0.09 | SB | |||
| IC 4280 | 8.02 0.10 | 8.11 0.09 | 7.80 0.14 | 11.080.09 | SB | ||
| NGC 5257 | 7.86 0.11 | 7.94 0.08 | 7.84 0.13 | 11.550.09 | SB | ||
| NGC 5258 | 7.91 0.10 | 8.00 0.06 | 7.75 0.12 | 11.550.09 | SB | ||
| UGC 8739 | 8.15 0.06 | 8.01 0.09 | 7.98 0.09 | 11.080.09 | SB | ||
| NGC 5331 | 8.39 0.06 | 8.21 0.10 | 11.590.09 | SB | |||
| CGCG 247-020 | 8.33 0.07 | 8.10 0.09 | 7.89 0.11 | 11.320.09 | SB | ||
| IRAS F14348-1447 | 8.97 0.00 | 12.300.09 | SB | ||||
| CGCG 049-057 | 8.35 0.04 | 8.01 0.06 | 8.07 0.07 | 11.270.09 | SB | ||
| NGC 5936 | 7.95 0.06 | 7.77 0.06 | 11.070.09 | SB | |||
| ARP 220 | 9.18 0.03 | 8.88 0.05 | 8.99 0.03 | 12.210.09 | SB/AGN | ||
| IRAS F16164-0746 | 8.14 0.09 | 8.38 0.06 | 7.92 0.12 | 11.550.09 | SB | ||
| CGCG 052-037 | 8.15 0.08 | 8.19 0.06 | 8.19 0.08 | 11.380.09 | SB | ||
| IRAS F16399-093 | 8.28 0.06 | 8.23 0.06 | 7.98 0.13 | 11.560.09 | SB | ||
| NGC 6285 | 11.560.09 | SB | |||||
| NGC 6286 | 8.31 0.06 | 8.32 0.05 | 11.320.09 | SB | |||
| IRAS F17138-1017 | 7.97 0.05 | 8.06 0.05 | 7.72 0.10 | 11.420.09 | SB | ||
| UGC 11041 | 8.16 0.07 | 8.16 0.06 | 11.04 0.09 | SB | |||
| CGCG 141-034 | 8.15 0.09 | 11.130.09 | SB | ||||
| IRAS 18090+0130 | 8.26 0.06 | 8.33 0.06 | 7.88 0.12 | 11.580.09 | SB | ||
| NGC 6701 | 8.25 0.03 | 8.16 0.04 | 7.87 0.08 | 11.050.09 | SB | ||
| NGC 6786 | 8.01 0.07 | 8.05 0.09 | 7.85 0.11 | 11.430.09 | SB/AGN | ||
| UGC 11415 | 7.75 0.00 | 8.04 0.10 | 11.430.09 | SB | |||
| ESO 593-IG 008 | 11.870.09 | SB | |||||
| NGC 6907 | 7.97 0.06 | 7.71 0.09 | 7.42 0.07 | 11.030.09 | SB | ||
| IRAS 21101+5810 | 8.37 0.07 | 8.17 0.11 | 7.99 0.01 | 11.750.09 | SB | ||
| ESO 602-G 025 | 8.20 0.11 | 8.16 0.07 | 8.15 0.12 | 11.270.09 | SB/AGN | ||
| UGC 12150 | 8.28 0.05 | 8.35 0.04 | 7.86 0.12 | 11.290.09 | SB | ||
| IRAS F22491-1808 | 12.110.09 | SB | |||||
| CGCG 453-062 | 8.26 0.07 | 7.95 0.14 | 11.310.09 | SB | |||
| NGC 7591 | 8.06 0.06 | 7.76 0.08 | 7.76 0.13 | 11.050.09 | SB/AGN | ||
| IRAS F23365+3604 | 8.94 0.14 | 9.14 0.09 | 12.130.09 | SB/AGN |
References
- Aalto et al. (2002) Aalto S., Polatidis A. G., Hüttemeister S., Curran S. J., 2002, A&A, 381, 783. doi:10.1051/0004-6361:20011514
- Balog et al. (2014) Balog Z., Müller T., Nielbock M., Altieri B., Klaas U., Blommaert J., Linz H., et al., 2014, ExA, 37, 129. doi:10.1007/s10686-013-9352-3
- Bussmann et al. (2008) Bussmann R. S., Narayanan D., Shirley Y. L., Juneau S., Wu J., Solomon P. M., Vanden Bout P. A., et al., 2008, ApJL, 681, L73. doi:10.1086/590181
- Cao et al. (2017) Cao Y., Wong T., Xue R., Bolatto A. D., Blitz L., Vogel S. N., Leroy A. K., et al., 2017, ApJ, 847, 33. doi:10.3847/1538-4357/aa88c5
- Costagliola et al. (2015) Costagliola F., Sakamoto K., Muller S., Martín S., Aalto S., Harada N., van der Werf P., et al., 2015, A&A, 582, A91. doi:10.1051/0004-6361/201526256
- Costagliola et al. (2011) Costagliola F., Aalto S., Rodriguez M. I., Muller S., Spoon H. W. W., Martín S., Peréz-Torres M. A., et al., 2011, A&A, 528, A30. doi:10.1051/0004-6361/201015628
- Foreman-Mackey et al. (2013) Foreman-Mackey D., Hogg D. W., Lang D., Goodman J., 2013, PASP, 125, 306. doi:10.1086/670067
- Galametz et al. (2013) Galametz M., Kennicutt R. C., Calzetti D., Aniano G., Draine B. T., Boquien M., Brandl B., et al., 2013, MNRAS, 431, 1956. doi:10.1093/mnras/stt313
- Gao & Solomon (2004) Gao Y., Solomon P. M., 2004, ApJ, 606, 271. doi:10.1086/382999
- Gao et al. (2007) Gao Y., Carilli C. L., Solomon P. M., Vanden Bout P. A., 2007, ApJL, 660, L93. doi:10.1086/518244
- García-Burillo et al. (2012) García-Burillo S., Usero A., Alonso-Herrero A., Graciá-Carpio J., Pereira-Santaella M., Colina L., Planesas P., et al., 2012, A&A, 539, A8. doi:10.1051/0004-6361/201117838
- Graciá-Carpio et al. (2006) Graciá-Carpio J., García-Burillo S., Planesas P., Colina L., 2006, ApJL, 640, L135. doi:10.1086/503361
- Graciá-Carpio et al. (2008) Graciá-Carpio J., García-Burillo S., Planesas P., Fuente A., Usero A., 2008, A&A, 479, 703. doi:10.1051/0004-6361:20078223
- Greve et al. (2009) Greve T. R., Papadopoulos P. P., Gao Y., Radford S. J. E., 2009, ApJ, 692, 1432. doi:10.1088/0004-637X/692/2/1432
- Imanishi et al. (2004) Imanishi M., Nakanishi K., Kuno N., Kohno K., 2004, AJ, 128, 2037. doi:10.1086/424620
- Imanishi et al. (2007) Imanishi M., Nakanishi K., Tamura Y., Oi N., Kohno K., 2007, AJ, 134, 2366. doi:10.1086/523598
- Israel, Tacconi, & Baas (1995) Israel F. P., Tacconi L. J., Baas F., 1995, A&A, 295, 599
- Izumi et al. (2016) Izumi T., Kohno K., Aalto S., Espada D., Fathi K., Harada N., Hatsukade B., et al., 2016, ApJ, 818, 42. doi:10.3847/0004-637X/818/1/42
- Izumi et al. (2013) Izumi T., Kohno K., Martín S., Espada D., Harada N., Matsushita S., Hsieh P.-Y., et al., 2013, PASJ, 65, 100. doi:10.1093/pasj/65.5.100
- Kennicutt (1998) Kennicutt R. C., 1998, ApJ, 498, 541. doi:10.1086/305588
- Kohno et al. (2001) Kohno K., Matsushita S., Vila-Vilaró B., Okumura S. K., Shibatsuka T., Okiura M., Ishizuki S., et al., 2001, ASPC, 249, 672
- Krips et al. (2008) Krips M., Neri R., García-Burillo S., Martín S., Combes F., Graciá-Carpio J., Eckart A., 2008, ApJ, 677, 262. doi:10.1086/527367
- Lada et al. (2012) Lada C. J., Forbrich J., Lombardi M., Alves J. F., 2012, ApJ, 745, 190. doi:10.1088/0004-637X/745/2/190
- Li et al. (2019) Li F., Wang J., Kong M., Li S., 2019, MNRAS, 482, 4763. doi:10.1093/mnras/sty2880
- Li et al. (2020) Li F., Wang J., Fang M., Li S., Zhang Z.-Y., Gao Y., Kong M., 2020, MNRAS, 494, 1095. doi:10.1093/mnras/staa676
- Li et al. (2020) Li F., Wang J., Fang M., Tan Q.-H., Zhang Z.-Y., Gao Y., Li S., 2020, PASJ, 72, 41. doi:10.1093/pasj/psaa025
- Lindberg et al. (2016) Lindberg J. E., Aalto S., Muller S., Martí-Vidal I., Falstad N., Costagliola F., Henkel C., et al., 2016, A&A, 587, A15. doi:10.1051/0004-6361/201527457
- Mao et al. (2010) Mao R.-Q., Schulz A., Henkel C., Mauersberger R., Muders D., Dinh-V-Trung, 2010, ApJ, 724, 1336. doi:10.1088/0004-637X/724/2/1336
- Privon et al. (2015) Privon G. C., Herrero-Illana R., Evans A. S., Iwasawa K., Perez-Torres M. A., Armus L., Díaz-Santos T., et al., 2015, ApJ, 814, 39. doi:10.1088/0004-637X/814/1/39
- Privon et al. (2020) Privon G. C., Ricci C., Aalto S., Viti S., Armus L., Díaz-Santos T., González-Alfonso E., et al., 2020, ApJ, 893, 149. doi:10.3847/1538-4357/ab8015
- Sanders et al. (2003) Sanders D. B., Mazzarella J. M., Kim D.-C., Surace J. A., Soifer B. T., 2003, AJ, 126, 1607. doi:10.1086/376841
- Schmidt (1959) Schmidt M., 1959, ApJ, 129, 243. doi:10.1086/146614
- Shirley (2015) Shirley Y. L., 2015, PASP, 127, 299. doi:10.1086/680342
- Solomon, Downes, & Radford (1992) Solomon P. M., Downes D., Radford S. J. E., 1992, ApJL, 387, L55. doi:10.1086/186304
- Tan et al. (2018) Tan Q.-H., Gao Y., Zhang Z.-Y., Greve T. R., Jiang X.-J., Wilson C. D., Yang C.-T., et al., 2018, ApJ, 860, 165. doi:10.3847/1538-4357/aac512
- Vila-Vilaro, Cepa, & Zabludoff (2015) Vila-Vilaro B., Cepa J., Zabludoff A., 2015, ApJS, 218, 28. doi:10.1088/0067-0049/218/2/28
- Wang, Zhang, & Shi (2011) Wang J., Zhang Z., Shi Y., 2011, MNRAS, 416, L21. doi:10.1111/j.1745-3933.2011.01090.x
- Wang et al. (2014) Wang J., Zhang Z.-Y., Qiu J., Shi Y., Zhang J., Fang M., 2014, ApJ, 796, 57. doi:10.1088/0004-637X/796/1/57
- Wang et al. (2016) Wang J., Zhang Z.-Y., Zhang J., Shi Y., Fang M., 2016, MNRAS, 455, 3986. doi:10.1093/mnras/stv2580
- Wu et al. (2005) Wu J., Evans N. J., Gao Y., Solomon P. M., Shirley Y. L., Vanden Bout P. A., 2005, ApJL, 635, L173. doi:10.1086/499623
- Zhang et al. (2014) Zhang Z.-Y., Gao Y., Henkel C., Zhao Y., Wang J., Menten K. M., Güsten R., 2014, ApJL, 784, L31. doi:10.1088/2041-8205/784/2/L31
Appendix A Spectra of dense gas tracers for individual galaxies