Quantifying the mobility of chromatin during embryogenesis: Nuclear size matters
Chromatin moves dynamically inside the cell nucleus, and its motion is often correlated with gene functions such as DNA recombination and transcription. A recent study has shown that during early embryogenesis of the nematode, Caenorhabiditis elegans, the chromatin motion markedly decreases. However, the underlying mechanism for this transition has yet to be elucidated. We systematically investigated the impact of nuclear size to demonstrate that it is indeed a decisive factor in chromatin mobility. To this end, we established a method to quantify chromatin motion inside the nucleus, while excluding the contribution of the movement of the nucleus itself, which allowed us to extract the intrinsic mean-squared displacement (iMSD) of individual chromosomal loci in moving nuclei from the correlated motion of two loci. We show that a simple theoretical description, which takes into account the topological constraints of chromatin polymers, can quantitatively describe the relationship between the nucleus size and the chromatin motion in vivo. Our results emphasize a regulatory role of nuclear size in restricting chromatin motion, and a generic polymer physics model plays a guiding role in capturing this essential feature.
How does chromatin move? This question has attracted broad interest in both the fundamental and applied sciences, from biology to physics. To address this question, a standard method is a live-cell tracking, in which the real-time motion of fluorescently labeled individual chromatin loci under a microscope are tracked Robinett_JCB1996 . In analyzing the stochastic trajectory obtained , a common practice is to calculate the mean-square displacement (MSD): , where the averaging occurs over the time of origin and/or the different ensemble Barkai_PT2012 . Previous experiments have reported that, in many cases, the MSD of chromatin loci exhibits a power-law dependence on the lag-time ;
| (1) |
where the MSD exponent typically falls in the range Bronstein_PRL2009 ; Weber_PRL2010 ; Weber_PNAS2012 ; Bancaud_GR2013 . An immediate question follows: why is so small? The fact that indicates that the diffusion of chromatin loci is anomalous, and there have been intense efforts to clarify the physical mechanism responsible for this observation. Several models have been proposed to explain the observed MSD exponent taking into account the role of, for example, the viscoelasticity inside the nucleus, the metabolic activity in living cells, or the topological constraints (TCs) relevant for long polymers Amitai_PRE2013 ; Vandebroek_PRE2015 ; Sakaue_SoftMatter2017 ; Tamm_PRL2018 ; Put_PRE2019 ; Rubinstein_Macro2016 .
Compared to the MSD exponent , less attention has been paid to the amplitude or mobility in Eq. (1). An earlier observation of telomeres in human chromosomes reported a large variability in from one telomere to another Bronstein_PRL2009 , which may be attributed to environmental heterogeneity. A more recent experiment has reported that the dynamics of the loci become slower as the cell division proceeded during embryogenesis of C. elegans Arai_SR2017 , which may be quantified through . These observations call for a thorough investigation into the mechanisms controlling the mobility and its biological implications. The significant reduction in mobility observed during embryogenesis may be related to the global nuclear organization involved in differentiation.
In the present study, we aimed to investigate the relationship between chromatin mobility and the size of the nucleus in vivo. We adopted the C. elegans embryo as a model experimental system, in which the nuclear size decreases naturally through cell division, or can be changed artificially by genetic manipulation Hara_MBoC2013 . A major difficulty of tracking experiments using embryonic cells lies in the fact that the nucleus itself moves actively, which hampers the quantification of the intrinsic chromatin mobility relative to the container (the nucleus). To overcome this problem, we propose a method two-point correlation tracking, with which one can extract various dynamical information, including the intrinsic chromatin mobility. We elucidate the physical mechanism behind the nuclear size-dependent chromatin mobility by providing a simple theoretical description based on the notion of TC, the predictions of which is in good agreement with experimental results.
Relationship between chromatin mobility and nuclear size.— In this study, we imaged the movement of the lacO locus integrated into a pair of sister chromosomes in the C. elegans genome using the LacI-GFP fusion protein, as reported previously Bilgir_G32013 ; Arai_SR2017 . As already mentioned, the tracking analysis of a single locus may lead to an erroneous interpretation, because of a possible influence caused by the translational and rotational motion of the nucleus itself. To exclude such an extrinsic effect, we tracked the positions and of the pair of lacO spots in sister chromosomes, and calculated at each time step the distance between them. From the time series of , we deduced the mean square change in distance (MSCD) as a function of lag-time ;
| (2) |
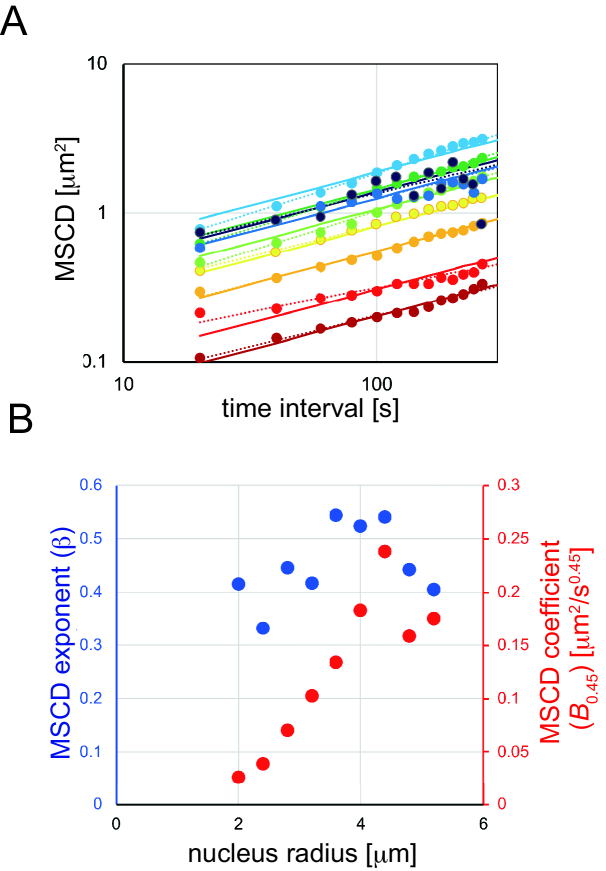
where is the initial distance MineHattab_NCB2012 ; Arai_SR2017 . Fig. 1 summarizes the results for wild-type cells, where we take the average over . Similar to the MSD (Eq. (1)), the MSCD can be fitted with a power-law scaling
| (3) |
Previously, we reported that the MSCD exponent is almost insensitive to the early embryonic stage from 2-cells to 48-cells, but the amplitude decreases as the stage progresses Arai_SR2017 . Because embryonic development is accompanied by a reduction in nuclear size, we hypothesized that the reduction in was induced by the reduction in nuclear size. In the present study, to focus on the relationship between the nuclear size (radius ) and chromatin mobility (MSCD), we first grouped nuclei of similar sizes (i.e., , ) (Fig. 1A). We fitted the MSCD data from each group of nuclei to Eq. (3). The MSCD exponent was almost insensitive to (Fig. 1B (blue), = 0.3), consistent with our previous report Arai_SR2017 . We fitted the MSCD data for each group of nuclei to Eq. (3) by fixing the exponent to the average value . The amplitude obtained () exhibited a clear trend against nuclear size, in that it takes a smaller value for smaller (Fig. 1B (red), = 0.002). These results demonstrate a correlation between chromatin mobility and nuclear size, a finding which is consistent with the previously established correlation between chromatin mobility and the early embryonic stage Arai_SR2017 .
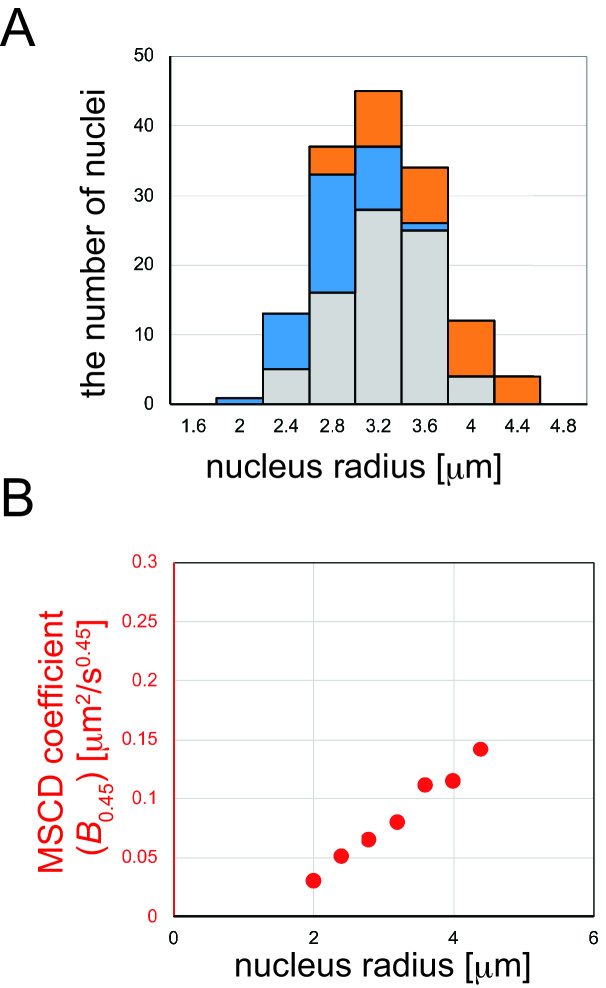
Isolating the impact of nuclear size— To verify whether changes in nuclear size can cause changes in chromatin motion in a cell-stage independent manner, we induced changes in nuclear size using genetic manipulation. RNA-mediated interference (RNAi) of ima-3 and C27D9.1 genes induce smaller and larger nuclear sizes, respectively Hara_MBoC2013 ; Weber_CB2015 . We focused on the 8-cell stage, which may correspond to a transition from high to low mobility of the chromatin Arai_SR2017 . The RNAi of the ima-3 and C27D9.1 genes widened the range of nuclear size (Fig. 2A). When we plot the amplitude of the chromatin motion with the fixed exponent of in Eq. (3) as shown in Fig. 1B, but only from the eight-cell stage nuclei, we detected a clear correlation between the chromatin motion and the nuclear size (Fig. 2B, Sup. Fig. S1). These results strongly support our hypothesis that chromatin mobility depends on nuclear size.
Two-point correlation tracking.— Our two-point tracking experiments allowed us not only to calculate the MSCD, but also to evaluate the contribution of the motion of the nucleus in the ”observed MSD (oMSD)” from the dynamic correlation of two loci. Let be a vector connecting two loci points at time . Its increment during a time interval is expressed as the sum of the displacements of two loci during the same interval; that is, , where for . Thus, the mean squared change in this vector can be decomposed as , which can be rearranged as
| (4) |
If the nucleus itself is quiescent, the displacement correlation between two loci will become negligibly small compared to oMSD Zidovska_PNAS2013 ; Michieletto_MacrLett2021 . In this case, the mean square change in is reduced to approximately twice the oMSD.
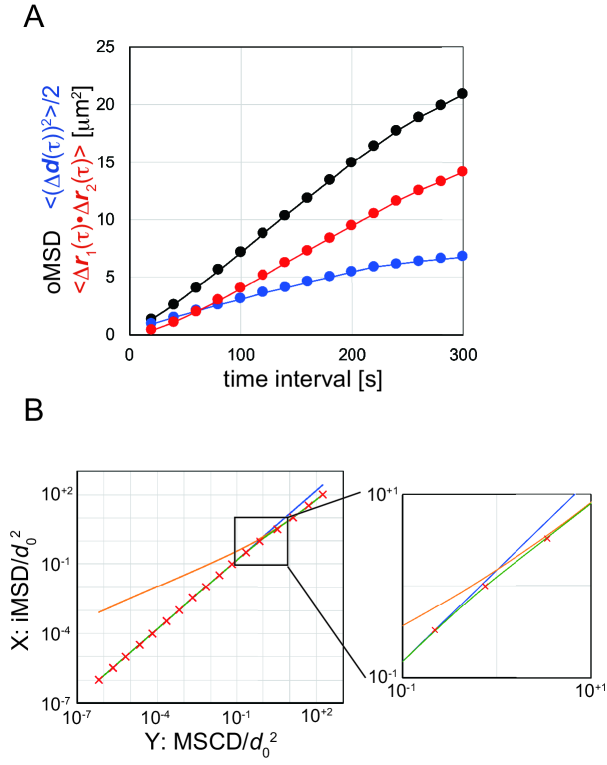
In Fig. 3, we compare the three terms in Eq. (4) measured in our experiment (Fig. 3A, Sup. Fig. S2). It is evident that the observed MSD is dominated by the correlation , which increases almost linearly with time. Note that the origin of measured correlation is not the coherent motion of the chromosomes inside the nucleus Zidovska_PNAS2013 ; Michieletto_MacrLett2021 . Rather, the above observation, in particular the linear scaling of the correlation, indicates that the two tracked loci move together with the nucleus undergoing Brownian motion.
Mapping to intrinsic MSD.— Although our use of MSCD is motivated by experiments, its relationship with an ”intrinsic MSD (iMSD)”, the movement of the loci excluding the contribution of the nuclear movement, must be clarified. In addition to its familiarity, the latter has an advantage in that it is more compatible with theoretical analysis. We obtained a formula relating iMSD and MSCD as follows: , where and (Fig. 3B; see SI for derivation and simulation). Because MSCD is an index of chromatin motion independent of the movement of the nucleus, the iMSD obtained from the MSCD is also independent of the movement of the nucleus.
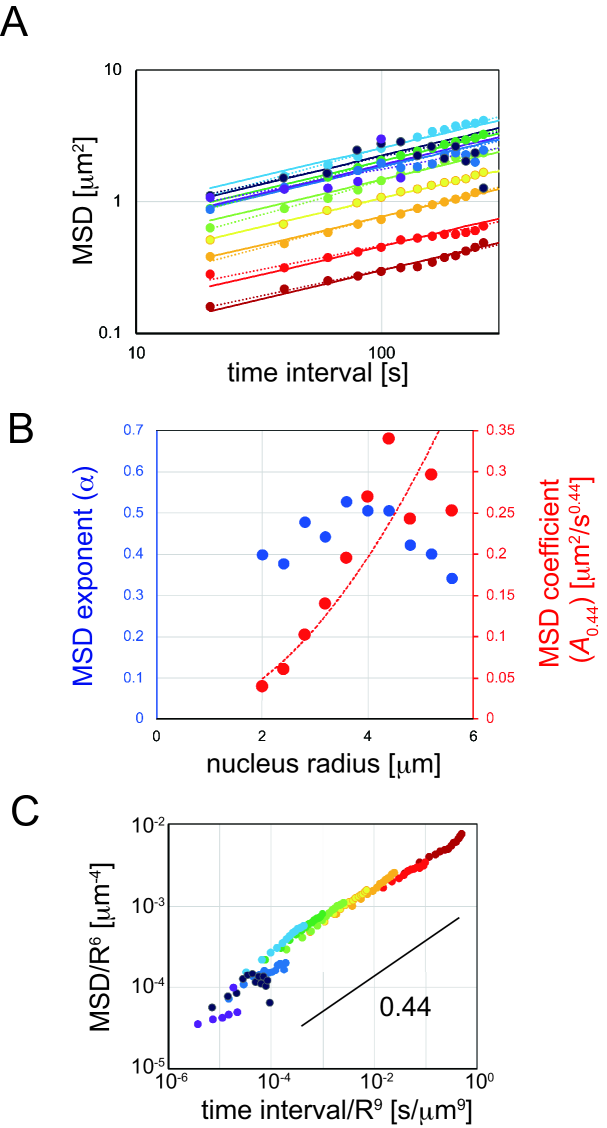
By applying this formula to the MSCD data obtained by two-point tracking, we obtained the iMSD of loci, which results entirely from the intrinsic chromatin dynamics (Fig. 4A). Similar to the MSCD, we found that the MSD exponent is relatively insensitive to nuclear size (Fig. 4B, blue). The average was (95% confidence interval [CI]). By fitting MSD from nuclei grouped according to their size to the formula (1) with , we could obtain the mobility (i.e. MSD coefficient) as a function of nuclear size (Fig. 4B). This analysis yields the relation
| (5) |
which quantitatively describes the mobility reduction in smaller nuclei (Fig. 4B, red dotted line).
Topological constraints are tighter in a smaller nucleus.— We now discuss the physics underlying the nuclear size dependence of chromatin mobility. During embryogenesis, the nuclear size becomes smaller almost in proportion to the cell size Hara_CB2009 , while the amount of genetic material in individual nuclei remains constant. At these stages, chromatin is distributed almost uniformly in the nucleus Arai_SR2017 . This means that the chromatin concentration becomes higher with a smaller nucleus. It might appear that the lower mobility at higher chromatin concentration is intuitively obvious because, by invoking the Stokes-Einstein law for a colloid particle in a viscous fluid, viscosity might become higher at higher chromatin concentrations. Despite the intuitive nature of this understanding, there is a deficit in the above naive argument, in which one confuses the length scales associated with the viscosity. By convention, viscosity is a macroscopic concept; thus, in the present context, we have implicitly discussed viscosity at the nuclear scale (or the scale of the colloid particle), where one can describe the nucleoplasm as a continuum. However, the motion of chromatin loci themselves occurs in a more local environment. Invoking such a length-scale dependent local viscosity (or, more generally, viscoelastisity) often encountered in complex fluids, it is reasonable to assume that the chromatin loci move in a background fluid, whose viscosity is comparable to that of water. In a simple polymer model such as the Rouse model, the mobility of monomers should not depend on the polymer concentration deGennes_book ; Rubinstein_book .
To formulate the concentration-dependency of chromatin mobility, we focused on the TCs associated with the chain connectivity of the polymer. As chromatin chains are very long polymers, and are packed in the nucleus at high concentrations, there should be severe motion restrictions arising from the fact that these long polymers cannot freely pass through each other. We emphasize here that the presence of TC does not necessarily indicates the chromatin in nucleus can be viewed as the entangled concentrated linear polymer solutions. Rather, the chromosome conformational capture experiments invoke the abundance of large loop structures on the order of Mbp Liberman-Aiden_Sci2009 , which suggests the similarity with the dense solution of non-concatenated ring polymers Rosa_PLCB2008 ; Halverson_RPP2014 . In the latter, rings are not entangled in a classical sense, but their conformation and dynamics are dictated by the immense TCs Cates_JP1986 ; Sakaue_PRL2011 ; Smrek_JPCM2015 ; Rubinstein_Macro2016 ; Michieletto_PRL2017 ; Sakaue_SoftMatter2018 ; Landuzzi_PRR2020 .
On purely dimensional grounds, one can write the MSDs of chromatin loci as
| (6) |
where is a characteristic length scale relevant to the process under consideration, is the corresponding time scale, and is a nontrivial exponent characterizing the large-scale loci dynamics Weber_PRL2010 ; Weber_PNAS2012 ; Bancaud_GR2013 ; Amitai_PRE2013 ; Vandebroek_PRE2015 ; Sakaue_SoftMatter2017 ; Tamm_PRL2018 ; Put_PRE2019 . Over long length and time scales, the conformation and dynamics of chromatin will be dominated by TC Rosa_PLCB2008 ; Halverson_RPP2014 ; Cates_JP1986 ; Sakaue_PRL2011 ; Smrek_JPCM2015 ; Rubinstein_Macro2016 ; Sakaue_SoftMatter2018 ; Landuzzi_PRR2020 ; Michieletto_PRL2017 , which set our basic length scale to be a so-called tube diameter deGennes_book ; Rubinstein_book . In a larger length scale (), the chromatin will exhibit a non-trivial conformation, which also affects the motion of chromatin loci at long time scale ().
Once we consider the TCs, the length scale depends on the concentration of chromatin monomers. Assuming that the short scale () conformation of chromatin obeys random walk statistics, one can then follow the standard argument in polymer physics to find , where is the corresponding genomic distance with being the size of chromatin monomers Lin_Macro1987 ; Kavassalis_PRL1987 ; Uchida_JCP2008 (see the SI for more details). Similarly, the concentration dependence of the time scale at the scale of the tube diameter is evaluated as , where is the thermal energy and is the so-called mesh size, above which the solvent-mediated hydrodynamic interactions are screened deGennes_book ; Rubinstein_book . Substituting these relations into Eq. (6), we obtained the concentration dependence in MSD of chromatin loci
| (7) |
Because , this leads to . Using the experimentally obtained exponent , our theory predicts that the chromatin mobility depends on the nuclear size as , which agrees well with experimental observations (Fig. 4B). Other models of entanglement predict qualitatively similar results, but with different exponents for dependence; see the SI for comparisons with other models of entanglement.
Time-nuclear size superposition. — Our basic formula (6) for MSD suggests that the distinct MSD vs. data from different nuclear sizes can be collapsed to a single master curve upon proper rescaling of the length and time.
| (8) |
where and . In Fig. 4C and Sup. Fig. S3, we collect MSD data obtained from various nuclear sizes , and construct the rescaled plot on a double logarithmic scale. The observed excellent collapse into a master curve (Fig. 4C and Sup. Fig. S3) supports the proposed physical picture. This analysis scheme provides an efficient way to extend the time range, which is usually limited by factors such as experimental apparatus and experimental conditions. This phenomenon is analogous to the so-called time-temperature superposition principle adopted in rheological measurement to obtain the viscoelastic modulus over a wide time (or frequency) range from measurements of a shorter time range at various temperatures Larson_book . While rescaling (i.e., a “shift” in logarithmic scale) factors in rheological time-temperature superposition originate from the temperature dependence of the friction coefficient, they arise from, in our case, the concentration dependence of the topological constraints. The experimentally accessible time range for tracking chromatin loci is limited to s in the present study, but the rescaled plot covers an effective time range spanning almost five orders of magnitude.
Perspectives — Recent studies have shown that nuclear size affects the formation of nucleoli Weber_CB2015 and chromosome condensation Hara_MBoC2013 . We have shown that nuclear size also affects the intrinsic mobility of chromatin in early embryos C. elegans. We have succeeded in establishing a theory to relate chromatin movement and nuclear size, as , taking the TCs of polymers into account. Since nuclear size reduces with cell stage, we speculate that the reduction in nuclear size has a regulatory role in controlling nuclear functions during embryogenesis. We expect that the present method will have versatile applicability to the quantification of intrinsic chromatin mobility in live cells, and it is an interesting challenge to clarify whether the proposed mechanism based on the TC is at work to control chromatin dynamics in other types of cells.
We thank Kazuko Ohishi for technical assistance, and Masaki Sasai, Tetsuya Yamamoto, Masaaki Sugiyama, and Hiroshi Kimura from the research group of ”Chromatin Potential” area, Yuta Shimamoto and the members of the Kimura lab and Sakaue lab for discussion. This project was supported by JSPS KAKENHI (grant numbers: JP18H05529 to T.S. and A.K., and 20114008, JP16H05119, JP16H00816 to A.K.).
References
- (1) Robinett, C.C., Straight, A., Li, G., Willhelm, C., Sudlow, G., Murray, A. and Belmont, A.S. In vivo localization of DNA sequences and visualization of large-scale chromatin organization using lac operator/repressor recognition. J. Cell Biol. 135(6), 1685 (1996).
- (2) Barkai, E., Garini, Y. and Metzler, R. Strange kinetics of single molecules in living cells. Physics Today 65(8), 29 (2012).
- (3) Bronstein, I., Israel, Y., Kepten, E., Mai, S., Shav-Tal, Y., Barkai, E. and Garini, Y. Transient Anomalous Diffusion of Telomeres in the Nucleus of Mammalian Cells. Phys. Rev. Lett. 103, 018102 (2009).
- (4) Weber, A.C., Spakowitz, A.J. and Theriot, J.A. Phys. Rev. Lett. 104, 238102 (2010).
- (5) Weber, A.C., Spakowitz, A.J. and Theriot, J.A. Nonthermal ATP-dependent fluctuations contribute to the in vivo motion of chromosomal loci. Proc. Natl. Acad. Sci (USA) 109, 7338 (2012).
- (6) Hajjoul, H., Mathon, J., Ranchon, H. et al. High-throughput chromatin motion tracking in living yeast reveals the flexibility of the fiber throughout the genome. Genome Res. 23, 1829 (2013).
- (7) Amitai, A. and Holcman, D. Polymer model with long-range interactions: Analysis and applications to the chromatin structure. Phys. Rev. E 88 052604 (2013).
- (8) Vandebroek, H. and Vanderzande, C. Dynamics of a polymer in an active and viscoelastic bath. Phys. Rev. E 92, 060601(R) (2015).
- (9) Sakaue, T. and Saito, T. Active diffusion of model chromosomal loci driven by athermal noise. Soft Matter 13, 81 (2017).
- (10) Polovnikov, K.E., Gherardi. M., Cosentino-Lagomarsino, M. and Tamm, M.V. Fractal Folding and Medium Viscoelasticity Contribute Jointly to Chromosome Dynamics. Phys. Rev. Lett. 120, 088101 (2018).
- (11) Put, S., Sakaue, T. and Vanderzande, C. Active dynamics and spatially coherent motion in chromosomes subject to enzymatic force dipoles. Phys. Rev. E 99, 032421 (2019).
- (12) Ge, T., Panyukov, S. and Rubinstein, M. Self-Similar Conformations and Dynamics in Entangled Melts and Solutions of Nonconcatenated Ring Polymers. Macromolecules 49, 2 (2016).
- (13) Arai, R., Sugawara, T., Sato, Y. et al. Reduction in chromosome mobility accompanies nuclear organization during early embryogenesis in Caenorhabditis elegans. Sci Rep 7, 3631 (2017).
- (14) Hara, Y., Iwabuchi, M., Ohsumi, K. and Kimura, A. Intranuclear DNA density affects chromosome condensation in metazoans. Mol. Biol. Cell 24, 2442 (2013).
- (15) Bilgir, C., Dombecki, C. R., Chen, P. F., Villeneuve, A. M. and Nabeshima, K. Assembly of the Synaptonemal Complex is a Highly Temperature-Sensitive Process that is Supported by PGL-1 during Caenorhabditis elegans Meiosis. G3 (Bethesda) 3, 585 (2013).
- (16) Miné-Hattab, J. and Rothstein, R. Increased chromosome mobility facilitates homology search during recombination. Nat. Cell Biol. 14, 510 (2012).
- (17) Weber, S.C. and Brangwynne, C.P. Inverse size scaling of the nucleolus by a concentration-dependent phase transition. Curr. Biol. 25, 641 (2015).
- (18) Zidovska, A., Weitz, D.A. and Mitchison, T.J. Micron-scale coherence in interphase chromatin dynamics. Proc. Natl. Acad. Sci (USA) 110, 15555 (2013).
- (19) Michieletto, D. and Sakaue, T. Dynamical Entanglement and Cooperative Dynamics in Entangled Solutions of Ring and Linear Polymers, ACS Macro Letters 10, 129 (2021).
- (20) Hara, Y. and Kimura, A. Cell-size-dependent spindle elongation in the Caenorhabditis elegans early embryo. Curr. Biol. 19, 1549-1554 (2009).
- (21) de Gennes, P.-G. Scaling Concepts in Polymer Physics, Cornell University Press, Ithaca (1979).
- (22) Rubinstein, M. and Colby, R. Polymer Physics, Oxford University Press, Oxford (2003).
- (23) Lieberman-Aiden, E., Van Berkum, N.L., Williams, L., et al. Comprehensive mapping of long-range interactions reveals folding principles of the human genome. Science 326, 289 (2009).
- (24) Halverson, J.D., Smrek, J., Kremer, K. and Grosberg, A.Y. From a melt of rings to chromosome territories: the role of topological constraints in genome folding. Rep. Prog. Phys. 77, 022601 (2014).
- (25) Rosa, A. and Everaers, R. Structure and Dynamics of Interphase Chromosomes. PLoS Comput. Biol. 4, e1000153 (2008).
- (26) Cates, M.E., Deutsch, J.M. Conjectures on the statistics of ring polymers. J. Phys. (Paris) 47, 2121 (1986).
- (27) Sakaue, T, Ring Polymers in Melts and Solutions: Scaling and Crossover. Phys. Rev. Lett. 106, 167802 (2011).
- (28) Smrek, J. and Grosberg, A.Y. Understanding the dynamics of rings in the melt in terms of the annealed tree model. J. Phys.: Condens. Matter 27, 064117 (2015).
- (29) Michieletto, D., Nahali, N. and Rosa, A. Glassiness and Heterogeneous Dynamics in Dense Solutions of Ring Polymers. Phys. Rev. Lett. 119, 197801 (2017).
- (30) Sakaue, T. Topological free volume and quasi-glassy dynamics in the melt of ring polymers. Soft Matter 14, 7507 (2018).
- (31) Landuzzi, F., Nakamura, T., Michieletto, D. and Sakaue, T. Persistence homology of entangled rings. Phys. Rev. Research 2, 033529 (2020).
- (32) Lin, Y.H. Number of entanglement strands per cubed tube diameter, a fundamental aspect of topological universality in polymer viscoelasticity. Macromolecules 20, 3080 (1987).
- (33) Kavassalis, T.A. and Noolandi, J. New View of Entanglements in Dense Polymer Systems. Phys. Rev. Lett. 59, 2674 (1987).
- (34) Uchida, N., Grest, G.S. and Everaers, R. Viscoelasticity and primitive path analysis of entangled polymer liquids: From F-actin to polyethylene. J. Chem. Phys. 128, 044902 (2008).
- (35) Larson, R.G. The Structure and Rheology of Complex Fluids, Oxford University Press, Oxford and New York (1999).