Informed Novelty Detection in Sequential Data by Per-Cluster Modeling
Abstract
Novelty detection in discrete sequences is a challenging task, since deviations from the process generating the normal data are often small or intentionally hidden. In many applications data is generated by several distinct processes so that models trained on all the data tend to over-generalize and novelties remain undetected. We propose to approach this challenge through decomposition: by clustering the data we break down the problem, obtaining simpler modeling tasks in each cluster which can be modeled more accurately. However, this comes at a cost, since the amount of training data per cluster is reduced. This is a particular problem for discrete sequences where state-of-the-art models are data-hungry. The success of this approach thus depends on the quality of the clustering, i.e., whether the individual learning problems are sufficiently simpler than the joint problem. In this paper we adapt a state-of-the-art visual analytics tool for discrete sequence clustering to obtain informed clusters from domain experts, since clustering discrete sequences automatically is a challenging and domain-specific task. We use LSTMs to further model each of the clusters. Our empirical evaluation indicates that this informed clustering outperforms automatic ones and that our approach outperforms standard novelty detection methods for discrete sequences in three real-world application scenarios.
1 Introduction
The task of identifying point anomalies, as classified by (Chandola et al., 2009), with respect to previously observed data is at the core of many applications: in cybersecurity, a novel kind of interaction with a web service can indicate an attack, and in news verification, detecting a deviation in the writing style can hint at an article being fake. If a dataset of previously observed instances without anomalies is available, this form of anomaly detection is called novelty detection. This task is particularly challenging for discrete sequential data, since deviations may occur only in the order of elements or in the frequency of patterns within the sequence. Usually anomaly and novelty detection methods are based on some form of similarity measure between instances, but approaches that only compare sequences by the elements that they contain will fail in such cases. Instead, the state-of-the-art approach is to use metrics designed for sequences, such as the longest common sub-sequence distance (Chandola et al., 2008; Budalakoti et al., 2006), or to use sequential pattern mining to extract features to be used with Euclidean distances (Feremans et al., 2019). Nevertheless, it is always hard to choose the features that will suit the task at hand or the distance measure that captures the novel behavior best. A more general approach is to model the process that generates the sequences (Marchi et al., 2015; Warrender et al., 1999; Florez-Larrahondo et al., 2005) and check whether an observed sequence is likely under that model. For this predictive modeling to work, it is paramount that the process is imitated accurately, since novelties often deviate only slightly from previously observed sequences. Recurrent neural networks, such as long short-term memory networks (LSTMs) or gated recurrent unit networks (GRUs), achieve high accuracy, outperforming both sequential metrics and pattern mining approaches (Chalapathy & Chawla, 2019). However, often sequences are generated not by a single process, but by several distinct processes, e.g., different behavioral patterns of users of a system or separate topics of news that will vary in the domain-specific language used. Modeling all of them jointly can lead to over-generalization which results in a lower sensitivity to small deviations. In predictive modeling, an approach to improve the modeling accuracy is decomposition: the data is decomposed into parts that are supposed to constitute easier sub-problems. The idea is that models trained on each part—sometimes referred to as local experts (Nowlan & Hinton, 1991)—outperform the global model (Sharkey, 1999a). Even though this decomposition reduces the available training data per model, it has been observed that given a good decomposition, this approach is beneficial. For example, in natural language processing, domain-specific modeling outperforms global models, even for high-capacity model classes such as recurrent neural networks (Joshi et al., 2012).
This paper proposes to use decomposition in novelty detection in discrete sequences.
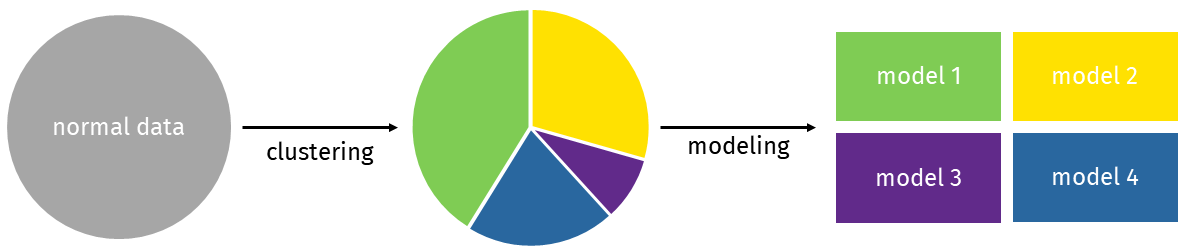
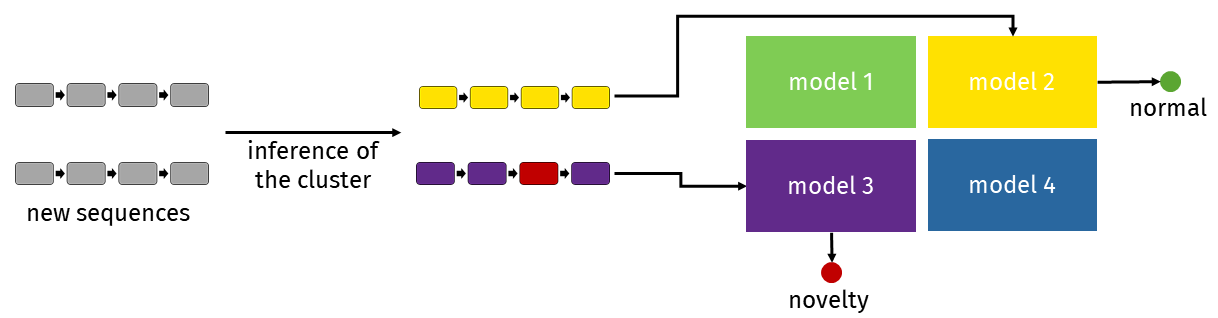
That is, the training data is decomposed into clusters, on each of which a model is trained (Fig. 1). During inference, a new data point is assigned to a cluster and the likelihood under the respective model is used to determine whether it is a novelty (Fig. 2). This general framework allows for many choices of decomposition and modeling techniques. A major challenge is identifying the right decomposition automatically. This is hard for sequential data, in particular, due to its high dimensionality and structure. However, for a human it is often quite simple to find meaningful groups in data. Visual analytics tools for including a human in the loop are widely employed directly for anomaly detection (Janetzko et al., 2014; Leite et al., 2018) and also for analysis of behavior as sequences of actions in various applications (Shi et al., 2020). This paper uses visual analytics to obtain a human knowledge based, semantically informed clustering. For that, we extend a visual analytics tool developed for finding user behavior clusters (Chen et al., 2019). This interface was evaluated by domain experts and got very positive feedback as a clustering technique allowing for deep insights into the sequential data and flexible decomposition of sequences into semantically sound clusters111For a detailed demonstration see http://simingchen.me/docs/tvcg19_lda.mp4. We derive a method for assigning new incoming sequences to clusters obtained by this tool in order to use it in our framework. We then train LSTMs (Hochreiter & Schmidhuber, 1997) per cluster and use them to determine whether a new sequence is a novelty based on the perplexity score of their predictions—a widely applied technique for evaluating the quality of language models in natural language processing application (Jurafsky, 2000).
This decomposition framework for novelty detection in discrete sequences differs fundamentally from the classical use of clustering to identify anomalies directly (Pavlov, 2003; Chandola et al., 2008; Cadez et al., 2000). It also differs from approaches that use modeling only to obtain a representation of the data, e.g., the use of the transformation by an autoencoder neural network as feature vector for classical anomaly detection methods (Yuan et al., 2017; Corizzo et al., 2020). We show that this approach outperforms a global model trained on all data in three real-world applications, despite the fact that the amount of training data for the global model is substantially larger than for the cluster models. We also show that the human-knowledge based informed clustering can outperform automatic clustering techniques, e.g., k-nearest neighbor (kNN) or Latent Dirichlet Allocation (LDA). Moreover, this approach substantially outperforms standard approaches for novelty detection in discrete sequential data based on sequence metrics and sequential pattern mining. Thus, this technique can improve the detection of fake news or attacks in cybersecurity.
In summary, the contributions are: (i) a novel framework that combines informed decomposition and modeling for novelty detection in discrete sequential data, (ii) an extension of a visual analytics tool that allows human experts to easily identify meaningful clusters of discrete sequences, and (iii) an evaluation of the framework for novelty detection in sequential data in three real-world scenarios.
2 Related Work
2.1 Novelty Detection in Discrete Sequences
Novelty and anomaly detection are particularly challenging for discrete sequences (Domingues et al., 2019; Chandola et al., 2010), since anomalies often only deviate in the order of elements or the frequency of patterns. State-of-the-art approaches use common outliers detection algorithms in combination with sequence specific metrics, or sequence specific features (e.g., sequential patterns). However, these approaches are computationally expensive and become infeasible for large amounts of data and long sequences: computing the longest common sub-sequence of two sequences has a runtime linear in the product of their lengths, and sequential pattern mining is in #P (Dong & Pei, 2007). Note that detecting novel discrete sequences is fundamentally different from outlier detection in time-series, where a single time point constitutes an outlier. Therefore, approaches for outlier detection in time series (Ren et al., 2019; Zhang et al., 2019, cf.) cannot be straight-forwardly applied.
A different way is to model the normal sequences and use the models for novelty detection. A successful approach to discrete sequence modeling is adapting tools from natural language processing, particularly LSTM-based neural language models (Chalapathy & Chawla, 2019). The task of a language model is to identify the likelihood of a sequence of words and it is usually trained in an unsupervised way on a vast amount of unlabeled data, therefore it allows to understand which sequences do not belong to the learned language distribution. In the general case of discrete sequences, objects organized in sequences are treated as words, and the model learns the probability distribution over the space of object sequences. Language modeling was already employed in anomaly detection for network security. For example, (Tuor et al., 2018) applied character level language modeling for separate lines of logging files in order to identify fraudulent actions. This approach was shown to perform well on one of the publicly available datasets, but is rather sensitive to the format of logging information, e.g., having information about the IP address of the request and success of the performed action. It also does not employ the information of the sequences of actions performed in each interaction. (Kim et al., 2016) instead use an ensemble of language models that are learning normal user behavior from sequences of actions. Both (Tuor et al., 2018) and (Kim et al., 2016) mention the need of separate modeling for particular groups of behaviors. However, (Tuor et al., 2018) only partitions data based on the timespan of sessions and (Kim et al., 2016) does not partition data at all, but instead uses an ensemble of different models. Our goal is to demonstrate that modeling applied after clustering is more beneficial than straightforward modeling or other non-modeling based approaches. The model (here LSTMs) can be replaced with specialized approaches, based e.g., on GRUs or VAEs (Su et al., 2019).
2.2 Decomposition for Modeling
This paper proposes to decompose data by informed clustering and model each cluster separately. Clustering has previously been used directly for outlier detection, either performed in the space of items themselves (Campello et al., 2013), in the space of models (Cadez et al., 2000), or in the space of features (Liu et al., 2008). It groups data points together based on a notion of density, or connectivity. Outliers are data points that cannot be assigned to any cluster. However, these methods are oblivious to the modeling task, the goal is only to get clusters directly pointing to anomalies. At the same time in data mining and knowledge extraction from data, decomposition has been empirically shown to be beneficial for modeling unlabeled interesting features (Baxt, 1990; Buntine, 1996). Indeed, (Sharkey, 1999b) argues that the decomposition is mainly motivated by the performance improvement gained through a better bias-variance trade-off for the models.
Our paper considers decomposition in the space of items (i.e., sequences). In the literature (cf. Maimon & Rokach, 2005) this is termed space decomposition or horizontal decomposition. Examples are mixture of experts (Nowlan & Hinton, 1991), local linear regression (Draper & Smith, 1981), or adaptive subspace models (Ramamurti & Ghosh, 1999). Such decomposition is performed during training, while our approach is to cluster beforehand. Up to our knowledge, decomposition has not yet been used for novelty detection by modeling the data generating process. This proposed approach differs from previous methods, such as local modeling and ensembles, in that it decouples decomposition from modeling and thus is more likely to avoid overfitting. The approach is similar in spirit to the work of (Bergman & Hoshen, 2019), where multiple transformations of a dataset are created and an outlier detection model is learned for each transformation, but aims at finding such subspaces within the initial space itself.
Note that the additional runtime due to decomposition is often negligible, since it is performed only once, while individual models in this case process less training data which can actually improve the runtime. Moreover, in some applications, lower-capacity models can be chosen as local models to further improve the runtime.
In this work, we choose high-capacity models for each cluster for which it might be an issue that decomposition leads to parts of the data having so few training examples that no meaningful model will be learned. Surprisingly, our empirical evaluation shows that for the task of novelty detection well-performing models can be trained even on very limited amounts of data, depending on the clustering method. We conjecture that in this case the decomposition through clustering indeed reduces the complexity of the learning task, and that for novelty detection slight overfitting on a local dataset is not as detrimental as in predictive modeling. Moreover, in many applications data is abundant so that local cluster size will not be an issue. For example, in cybersecurity (Faraoun & Boukelif, 2006) note that the amount of data is constantly growing, e.g., log files of network monitoring systems are constantly updated.
It should be noted that for sequence modeling, where sequences are generated from different processes, a global model trained on the entire data may perform poorly, since it is difficult to identify these processes automatically (unless additional information, such as labels, is given) (Joshi et al., 2012). Similarly, automatic decomposition would be a challenging task. However, for human experts it is often easy to cluster data. Visual analytics provides a natural interface that allows to extract this implicit and intuitive knowledge of human experts (Liu et al., 2017).
3 Combining Clustering and Novelty Detection
We assume a dataset of normal sequences over a finite vocabulary of words, i.e., with . We assume the sequences are drawn iid. according to a distribution over . For this distribution, we assume that it is a mixture of distributions , where each corresponds to a different process generating the sequences. For example, each can represent different types of user behavior in the interaction with a web service, or different news topics. The task is to decide for a new sequence , if it is an anomaly with respect to , i.e., if it is a novelty.
A sequence clustering is a function that assigns each sequence to one of clusters. We assume clustering algorithms that take as input a dataset and the parameter and output a clustering . We further assume that each data point has a unique cluster assigned to it—that is, the clustering is a partition of into sets , i.e., and for all it holds that . Ideally, and each cluster corresponds to a distribution in the mixture.
Novelty detection on sequences is an unsupervised learning task. A powerful modelling technique for sequences are LSTM-based neural networks that model the process that generates the sequences. This, however, is a supervised task: given a prefix of a sequence the model predicts the next element in a sequence by assigning each possible element from a likelihood score. That is, given the prefix of a sequence , where , the model outputs the likelihoods . The predicted next element is the one with the highest likelihood. The true label for training is a vector with a likelihood of assigned to the correct element at that place and to all other elements. Note that an LSTM can predict further elements in the sequence, but we do not make use of this, here. After training on a given set of normal sequences, we can use such a process model for novelty detection: instead of using the predicted elements, we compute for each prefix the probability the model assigns to the actual element in , i.e., . If one or multiple elements in a sequence are predicted to be very unlikely given their prefix, then these elements are unusual given the modeled distribution. We combine the individual probabilities into a novelty score using the perplexity score (Jurafsky, 2000)
| (1) |
where is the number of words in a sequence and is the predicted likelihood of , the -th element in . The larger the perplexity score, the less probable it is that the sequence has originated from the same distribution that the model was trained on. Thus, a high perplexity score indicates novelty.
Modelling on a sample from requires the model to generalize over all distributions in the mixture which can result in lower sensitivity to small deviations. Ideally, we want to train an individual model for each . Since the actual mixture is typically unknown, we use the clustering as an approximation. The proposed approach, given in Algorithm 1, first using a clustering algorithm on the input data to obtain a clustering . The optimal number of clusters can be determined via the standard silhouette value (Rousseeuw, 1987). Then, a model is trained for each cluster . The novelty score of a sequence is obtained by first assigning to a cluster and then computing . If , is reported as novelty.
As described above, this approach follows the intuition that a model trained for each individual distribution in the mixture is more precise for that distribution, such that novelties will be detected more accurately. Given a good clustering, i.e., one for which clusters correspond to distributions in the mixture, the novelty detection capabilities of the models should improve over a model trained on the entire mixture. At the same time, the clustering reduces the effective training set size for the individual models, in turn reducing their capabilities. In Section 5 we show empirically on a variety of different applications that the advantage of per-cluster modelling substantially outweighs the reduction in training set size. Since the success of this approach highly depends on the quality of clustering, we propose to use a visual analytics based approach for human experts to inform an LDA-based clustering in the following section.
4 Visual Informed Clustering
To obtain a good decomposition of sequences, the input data has to be clustered in a meaningful way. Techniques like k-means or topic modeling with LDA are able to cluster sequences, but often fail to find application-domain specific partitions and to be meaningful for high-dimensional data. Experts often have domain knowledge that can improve clustering, but it is non-trivial to extract this knowledge. We adapt a visual analytics tool that is proven to enable domain experts to cluster data in an intuitive and comfortable way (Chen et al., 2019). With this tool, semantically meaningful informed clusters can be defined without setting any parameters a priori. The interactive visual analytics tool was introduced by (Chen et al., 2019) for behavior clustering. It was thoroughly evaluated in case studies with security management system and amusement park visiting behaviors. The domain expert’s feedback confirmed the usefulness and efficiency of the visual approach for identifying meaningful groups of behaviors. Based on this positive evaluation, we incorporate the tool into the novelty detection framework and extend it with an inference technique for identifying the cluster of a new sequence based on the analysis performed by experts. The tool performs multiple topic modeling runs on the normal data . For that, each of the sequences is transformed into a bag of words: each sequence is represented by a vector , where is the count of word in . In the following we refer to any kind of discrete objects organized into sequences as words (for consistensy with NLP terminology). Then, multiple rounds of LDA (Blei et al., 2003), each with a different setting of the number of topics, are used to produce a set of topics . From that we produce an initial visualization based on a topic-word matrix (i.e., probabilities corresponding to each of the words in for each of the topics in ), and a sequence-topic matrix (i.e., probabilities corresponding to each of the topics in according to the corresponding LDA model for each of the sequences from ).
On startup, the interface displays the initial visualization based on the topic-word and sequence-topic matrix obtained from the multiple runs of LDA. The tool projects the generated topics (as vectors of word probabilities) on space using t-SNE (Maaten & Hinton, 2008) in order to provide an overview of their distribution and similarities (Fig. 3, top part). A pie chart glyph represents each of the topics. The colors in the glyph encode the word classes labeled by the experts which allows for more coarse coloring of the topics compared to the word level. By investigating and comparing the glyphs, experts can gain an interpretable information about the topics and assess their similarity. This part of the interface provides an overview that allow experts to investigate different granularities of the clustering, e.g., a small number of topics will lead to more general feature clusters, while a large number of topics helps to obtain a finer clustering. This interface also serves as an interactive panel in which experts can unite similar topics and by this compose informed clusters.
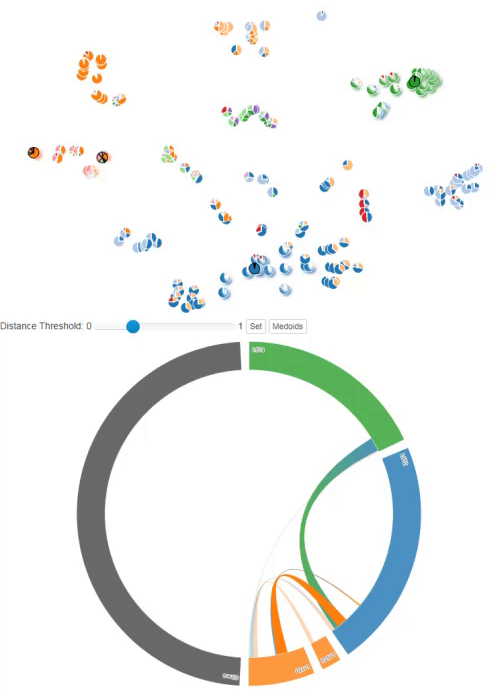
The topic-word matrix is also displayed in the interface by means of a matrix visualization. The goal of the view is to enable an understanding of the topic features in terms of the word probabilities. A chord diagram visualizes the similarity between topics according to the sequence-topic matrix (Fig. 3, bottom part). The separate parts of the circle represent topics, and their sizes indicate the number of associated sequences. The color encodes the word class that has the highest probability in the topic. Interconnections between them represent shared associated sequences.
Using the interactive interface human experts select a group of topics. The identified topic groups correspond to a partition of the data and are considered to be informed clusters. As a result of the visual analysis, we obtain clusters composed of topics . We propose the following method to perform inference of the cluster for a new sequence : (i) produce probabilities for each of the topics in for (ii) identify the cluster of topics that has the largest average probability. Applying this scheme, we obtain a clustering that partitions the initial data into and allows us to infer the cluster of a novel sequence . Due to the visual interface the clusters can be identified even by non-experts just visually and it does not require any effort, while still giving a benefit of easy sequences separation. We empirically verify the performance of informed clustering in the following section.
5 Empirical Evaluation
We evaluate the proposed novelty detection framework on three real-world datasets with diverse areas of application: cybersecurity, fake reviews, and server usage monitoring 222The code is available at github.. We show that per-cluster modeling is beneficial when compared to modelling an LSTM on all data (Global LSTM) and that informed clustering (IC-LSTMs) outperforms automatic clustering. Since the informed clustering is based on LDA, we use standard LDA as a baseline (LDA Cluster LSTMs), as well as standard k-means (k-means Cluster LSTMs). Note that for the cybersecurity dataset the informed clusters are produced by domain experts, while for the other two use cases clusters were produced by data scientists from our group. The LSTMs per cluster are trained with parameters obtained via a parameter evaluation on an independent subset of the data. Furthermore, we compare per-cluster modelling to the natural baseline of using a clustering for outlier detection, in particualr the standard kNN with Minkowski distance and density-based clustering (HDBSCAN (McInnes et al., 2017)). We also compare to the standard outlier detection approaches one-class SVM (OC-SVM) (Schölkopf et al., 2001), and isolation forests (IsoForests) (Liu et al., 2008). HDBSCAN, OC-SVM, and IsoForests are designed for tabular data and not sequences. Thus, we use the two common approaches for obtaining such features from sequences, the bag of words (BoW) approach, and using the top-800 sequence patters (SP) (obtained using the prefixspan algorithm (Han et al., 2001)), as well as the combination of both (BoW+SP). Hyper-parameter of HDBSCAN (min. cluster size, min. samples amount), OC-SVM ( and for RBF kernel), and isolation forests (max. number of features, number of estimators, and max. number of samples) are optimized on the test set (see published code for details), so that their results can be optimistic. We report ROC AUC computed over all choices of the threshold , and the sensitivity (Sens.) and specificity (Spec.) scores for the optimal value of in ROC space. We report mean of Sens. and Spec., i.e., a score that gives equal importance to both.
5.1 Cybersecurity
| Method | AUC | Sens. | Spec. | |
|---|---|---|---|---|
| IC-LSTMs | ||||
| Global LSTM | ||||
| k-means Cluster LSTMs | ||||
| LDA Cluster LSTMs | ||||
| \hdashlinekNN with Mink. dist. | ||||
| HDBSCAN on BoW | ||||
| HDBSCAN on SP | ||||
| HDBSCAN on BoW+SP | ||||
| OC-SVM on BoW | ||||
| OC-SVM on SP | ||||
| OC-SVM on BoW+SP | ||||
| IsoForests on BoW | ||||
| IsoForests on SP | ||||
| IsoForests on BoW+SP |
We first evaluate the proposed approach on a network intrusion detection task. We use the public ADFA-LD (Creech & Hu, 2013) dataset. This dataset is considered to be the state-of-the-art benchmarking collection for evaluating intrusion detection approaches. The sequences of actions are logged from system calls in the Ubuntu Linux operating system. The normal behavior sequences are logged from usual activity, e.g., browsing through web pages or document editing. Attack sessions are generated according to known vulnerabilities of the system, e.g., brute force of user passwords. This application from cybersecurity is quite challenging, because attackers that want to infiltrate a network try to disguise their attacks as normal behavior (Sommer & Paxson, 2010). Thus, accurately modeling normal behavior is crucial. Behavioral patterns were shown to provide important insights into the possibilities of attacks (Ussath et al., 2017; Pannell & Ashman, 2010). In this task, sequences are sessions of users accessing a system consisting of actions that they perform while being in this session.
Using the visual analytics tool, we partition historical logs of activities into semantically sound behavior clusters. We obtained the clustering for our experiments in collaboration with security operators from an industrial partner.
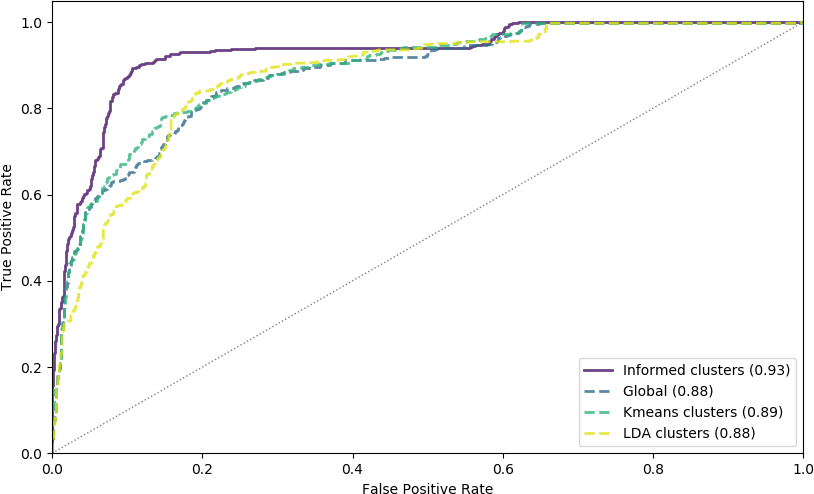
Table 1 shows the baseline results for the dataset. We report AUC for all the baselines together with mixture of sensitivity and specificity, as discussed in the introduction to the section. According to these two criteria our approach outperforms all the baselines. The ROC curve for all methods is shown in Figures 5 and 5. Our approach substantially outperforms baseline anomaly detection approaches, as well as a global model trained on all data. Moreover, the informed clustering performs better than automatic clustering using k-means or LDA. Thus, we conclude that LSTM-based methods are a suitable technique for this task and clustering before modeling is beneficial. Figure 6 (left) shows the comparison of area under the ROC curve (AUC) per cluster compared to the AUC of the global model on that cluster. Interestingly, the size of the cluster seems not to impact the outliers detection performance of the model. Rather, the performance of both local and global model are correlated over clusters. This suggests that the lower amount of training data has only little impact on the performance, whereas the quality of decomposition has a stronger effect.
5.2 Fake Reviews
| Method | AUC | Sens. | Spec. | |
|---|---|---|---|---|
| IC-LSTMs | ||||
| Global LSTM | ||||
| k-means Cluster LSTMs | ||||
| LDA Cluster LSTMs | ||||
| \hdashlinekNN with Mink. dist.333Labels have been inverted. | ||||
| HDBSCAN on BoW | ||||
| HDBSCAN on SP | ||||
| HDBSCAN on BoW+SP | ||||
| OC-SVM on BoW | ||||
| OC-SVM on SP | ||||
| OC-SVM on BoW+SP | ||||
| IsoForests on BoW | ||||
| IsoForests on SP | ||||
| IsoForests on BoW+SP |
The second task is identifying fake reviews. The dataset we use is collected from Yelp (Mukherjee et al., 2013). The data includes reviews of hotels and restaurants in the Chicago area. Reviews include meta-information, as well as the text of the review itself, but for our experiments we use only the text. The labels are produced by a filtering algorithm that is used by Yelp. The labels are not perfect, but are proven to be sufficiently accurate (Weise, 2011). There are reviews evaluated as fake in this dataset. The texts were preprocessed using spacy (https://spacy.io/), i.e., lemmatized and having pronouns, punctuation and numbers replaced with uniform tokens. The overall vocabulary was cut to the frequency threshold , meaning that all words that appear less than times are treated as unknown words. The amount of data was reduced for experiments in order to save preprocessing time, i.e., we use of the restaurant reviews.
The results in Table 2 show an advantage of our approach, but not as pronounced as in the other tasks. It nevertheless outperforms all baselines, except for LDA Cluster LSTMs. Since the informed clustering uses LDA topics as well and LDA clustering is very successful in natural language processing, this is not surprising. The k-means clustering LSTMs performs worse—even worse than the global LSTM—which is a further evidence that the clustering has to be chosen carefully. Note that we have used the same one layered LSTM architecture with embeddings learned together with the task as in the other experiments. Thus, the results of the LSTM-based methods could be further improved by tuning the architecture. Also note that the kNN applied on this data has a best AUC score lower than , so the labels have been inverted (i.e., we treat the model as an oracle that is always mistaken). The per cluster evaluation in Figure 6 (right) shows that the proposed approach substantially outperforms the global LSTM on all clusters. This supports the idea that especially in vast and various data, a global model will become too general to notice the subtle deviations of novelties.
5.3 Time Series
The third task is detecting novelties in real-valued time series. Since our approach is designed for discrete sequences, we need to discretize the time series by binning, and then cut them into non-overlapping windows. Each window that contains a time point marked as an anomaly is labeled as a novelty. All others are considered to be normal. As an example of univariate real-valued time series we select data from the Numenta Anomaly Benchmark (NAB) (Lavin & Ahmad, 2015). NAB is a benchmark for evaluating algorithms for anomaly detection in streaming, real-time applications. It is composed of over labeled real-world and artificial time series data files plus a novel scoring mechanism designed for real-time applications. We considered the dataset of the AWS server metrics as collected by the AmazonCloudwatch service, in particular CPU Utilization numbers. Since the range of values in the sequences was from to we binned them uniformly into bins from to with step . The length of the window was chosen to be in order to have enough sequences in the training set.
The results are displayed in Table 3. Note that taking into account the simplicity of the task (because of the rather short sequences) all the LSTM based methods perform similarly. Also, due to having only anomalies to test on, the scores are very erratic—differing in example can change the AUC a lot. However, due to the small size, this dataset was the only one for which we can run kNN with the longest common sub-sequence (LCS) metric. The results obtained with it are AUC, sensitivity and specificity is , but the hyper-parameter tuning alone took almost hours. As with all non-LSTM baselines, tuning was performed with test data, so it is optimistic. Again, the proposed IC-LSTM substantially outperforms all baselines; in general, LSTM-based approaches outperform the other baselines. Only kNN with Minkowski distance achieve competitive results. Note that the per-cluster comparison here is restricted to two clusters–the AUC of the last cluster could not be calculated, since it does not contain any novelties. These two clusters of size and have AUC and with our approach and and for the global LSTM model, indicating that the proposed approach is applicable to real-valued time series as well.
| Method | AUC | Sens. | Spec. | |
|---|---|---|---|---|
| IC-LSTMs | ||||
| Global LSTM | ||||
| k-means Cluster LSTMs | ||||
| LDA Cluster LSTMs | ||||
| \hdashlinekNN with Mink. dist. | ||||
| HDBSCAN on BoW | ||||
| HDBSCAN on SP | ||||
| HDBSCAN on BoW+SP | ||||
| OC-SVM on BoW | ||||
| OC-SVM on SP | ||||
| OC-SVM on BoW+SP | ||||
| IsoForests on BoW | ||||
| IsoForests on SP | ||||
| IsoForests on BoW+SP |
6 Conclusion
The paper proposes a framework for novelty detection in discrete sequences combining decomposition and modeling. The empirical evaluation shows that decomposition improves the novelty detection accuracy substantially and that an informed clustering outperforms automatic ones on three different real-world datasets. Surprisingly, the models performed well even on smaller clusters where only little training data is available. A reason could be that slight overfitting due to a lack of training data is actually beneficial for novelty detection. Further studying the trade-off between decomposition and training set size is an interesting future task. In our experiments, domain experts were involved for the analysis of cybersecurity data, the reviews and server usage data was clustered by data scientists from our group. This is possible, since the visual interface is intuitive enough to perform meaningful clustering even without substantial domain knowledge. The strong performance of IC-LSTMs on the cybersecurity dataset indicates that using actual domain experts for clustering is still preferable.
The proposed framework is designed for novelty detection in discrete sequences. The flexible framework allows us to use a wide range of clustering and modelling techniques. In this paper, we restricted ourselves to LSTMs with the same architecture and parameters on all clusters, since they are well-suited for sequential data. An interesting future direction is to choose models for each cluster individually by tuning the models for an optimal bias-variance trade-off.
In this paper we assign a new sequence strictly to the closest cluster and use only the corresponding model for novelty detection. This approach could be improved by combining the predictions of multiple models. For most clustering techniques, including the informed clustering proposed in this paper, it is possible to infer a score for a new sequence that indicates the similarity to each cluster. This similarity score could be used to weigh the predictions of cluster models which might further improve the novelty detection accuracy. (Sharkey, 1999a) shows that the combination of models trained on decomposed subtasks can be beneficial, but the way to combine predictions has to be selected carefully: opposed to ensemble techniques, the models might perform very poorly on other clusters and thus a simple averaging of predictions can be detrimental. Developing such combinations for our tasks is left for future work. Overall, we conjecture, that decomposition before modeling is beneficial for novelty detection in discrete sequences, on the condition that the clustering is of high quality and that often this can best be achieved with a knowledgeable human in the loop.
References
- Baxt (1990) Baxt, W. G. Use of an artificial neural network for data analysis in clinical decision-making: the diagnosis of acute coronary occlusion. Neural computation, 2(4):480–489, 1990.
- Bergman & Hoshen (2019) Bergman, L. and Hoshen, Y. Classification-based anomaly detection for general data. In International Conference on Learning Representations, 2019.
- Blei et al. (2003) Blei, D. M., Ng, A. Y., and Jordan, M. I. Latent dirichlet allocation. Journal of machine Learning research, 3(Jan):993–1022, 2003.
- Budalakoti et al. (2006) Budalakoti, S., Srivastava, A. N., Akella, R., and Turkov, E. Anomaly detection in large sets of high-dimensional symbol sequences. Technical report, NASA TM-2006-214553, NASA Ames Research Center, 2006.
- Buntine (1996) Buntine, W. Graphical models for discovering knowledge. In Advances in knowledge discovery and data mining, pp. 59–82. AAAI/MIT Press, 1996.
- Cadez et al. (2000) Cadez, I. et al. Visualization of navigation patterns on a web site using model-based clustering. In Proceedings of the sixth ACM SIGKDD international conference on Knowledge discovery and data mining, pp. 280–284, 2000.
- Campello et al. (2013) Campello, R. J., Moulavi, D., and Sander, J. Density-based clustering based on hierarchical density estimates. In Pacific-Asia conference on knowledge discovery and data mining, pp. 160–172. Springer, 2013.
- Chalapathy & Chawla (2019) Chalapathy, R. and Chawla, S. Deep learning for anomaly detection: A survey. arXiv preprint arXiv:1901.03407, 2019.
- Chandola et al. (2008) Chandola, V., Mithal, V., and Kumar, V. Comparative evaluation of anomaly detection techniques for sequence data. In 2008 Eighth IEEE international conference on data mining, pp. 743–748. IEEE, 2008.
- Chandola et al. (2009) Chandola, V., Banerjee, A., and Kumar, V. Anomaly detection: A survey. ACM computing surveys (CSUR), 41(3):1–58, 2009.
- Chandola et al. (2010) Chandola, V., Banerjee, A., and Kumar, V. Anomaly detection for discrete sequences: A survey. IEEE Transactions on Knowledge and Data Engineering, 24(5):823–839, 2010.
- Chen et al. (2019) Chen, S., Andrienko, N., Andrienko, G., Adilova, L., Barlet, J., Kindermann, J., Nguyen, P. H., Thonnard, O., and Turkay, C. Lda ensembles for interactive exploration and categorization of behaviors. IEEE transactions on visualization and computer graphics, 2019.
- Corizzo et al. (2020) Corizzo, R., Ceci, M., Zdravevski, E., and Japkowicz, N. Scalable auto-encoders for gravitational waves detection from time series data. Expert Systems with Applications, pp. 113378, 2020.
- Creech & Hu (2013) Creech, G. and Hu, J. Generation of a new ids test dataset: Time to retire the kdd collection. In 2013 IEEE Wireless Communications and Networking Conference (WCNC), pp. 4487–4492. IEEE, 2013.
- Domingues et al. (2019) Domingues, R., Michiardi, P., Barlet, J., and Filippone, M. A comparative evaluation of novelty detection algorithms for discrete sequences. Artificial Intelligence Review, pp. 1–26, 2019.
- Dong & Pei (2007) Dong, G. and Pei, J. Sequence data mining, volume 33. Springer Science & Business Media, 2007.
- Draper & Smith (1981) Draper, N. R. and Smith, H. Applied regression analysis, john wiley and sons. New York, 407, 1981.
- Faraoun & Boukelif (2006) Faraoun, K. and Boukelif, A. Neural networks learning improvement using the k-means clustering algorithm to detect network intrusions. INFOCOMP, 5(3):28–36, 2006.
- Feremans et al. (2019) Feremans, L., Vercruyssen, V., Cule, B., Meert, W., and Goethals, B. Pattern-based anomaly detection in mixed-type time series. Lecture Notes in Artificial Intelligence, 2019.
- Florez-Larrahondo et al. (2005) Florez-Larrahondo, G. et al. Efficient modeling of discrete events for anomaly detection using hidden markov models. In International Conference on Information Security, pp. 506–514. Springer, 2005.
- Han et al. (2001) Han, J., Pei, J., Mortazavi-Asl, B., Pinto, H., Chen, Q., Dayal, U., and Hsu, M. Prefixspan: Mining sequential patterns efficiently by prefix-projected pattern growth. In proceedings of the 17th international conference on data engineering, pp. 215–224. Citeseer, 2001.
- Hochreiter & Schmidhuber (1997) Hochreiter, S. and Schmidhuber, J. Long short-term memory. Neural Comput., 9(8):1735–1780, November 1997. ISSN 0899-7667.
- Janetzko et al. (2014) Janetzko, H., Stoffel, F., Mittelstädt, S., and Keim, D. A. Anomaly detection for visual analytics of power consumption data. Computers & Graphics, 38:27–37, 2014.
- Joshi et al. (2012) Joshi, M., Cohen, W. W., Dredze, M., and Rosé, C. P. Multi-domain learning: when do domains matter? In Joint Conference on Empirical Methods in Natural Language Processing and Computational Natural Language Learning, pp. 1302–1312. Association for Computational Linguistics, 2012.
- Jurafsky (2000) Jurafsky, D. Speech & language processing. Pearson Education India, 2000.
- Kim et al. (2016) Kim, G. et al. Lstm-based system-call language modeling and robust ensemble method for designing host-based intrusion detection systems. arXiv preprint arXiv:1611.01726, 2016.
- Lavin & Ahmad (2015) Lavin, A. and Ahmad, S. Evaluating real-time anomaly detection algorithms–the numenta anomaly benchmark. In 2015 IEEE 14th International Conference on Machine Learning and Applications, pp. 38–44. IEEE, 2015.
- Leite et al. (2018) Leite, R. A., Gschwandtner, T., Miksch, S., Gstrein, E., and Kuntner, J. Visual analytics for event detection: Focusing on fraud. Visual Informatics, 2(4):198–212, 2018.
- Liu et al. (2008) Liu, F. T., Ting, K. M., and Zhou, Z.-H. Isolation forest. In 2008 Eighth IEEE International Conference on Data Mining, pp. 413–422. IEEE, 2008.
- Liu et al. (2017) Liu, S. et al. Towards better analysis of machine learning models: A visual analytics perspective. Visual Informatics, 1(1):48–56, 2017.
- Maaten & Hinton (2008) Maaten, L. v. d. and Hinton, G. Visualizing data using t-sne. Journal of Machine Learning Research, 9:2579–2605, 2008.
- Maimon & Rokach (2005) Maimon, O. and Rokach, L. Decomposition methodology for knowledge discovery and data mining. In Data mining and knowledge discovery handbook, pp. 981–1003. Springer, 2005.
- Marchi et al. (2015) Marchi, E., Vesperini, F., Eyben, F., Squartini, S., and Schuller, B. A novel approach for automatic acoustic novelty detection using a denoising autoencoder with bidirectional lstm neural networks. In 2015 IEEE international conference on acoustics, speech and signal processing (ICASSP), pp. 1996–2000. IEEE, 2015.
- McInnes et al. (2017) McInnes, L., Healy, J., and Astels, S. hdbscan: Hierarchical density based clustering. The Journal of Open Source Software, 2(11):205, 2017.
- Mukherjee et al. (2013) Mukherjee, A., Venkataraman, V., Liu, B., and Glance, N. What yelp fake review filter might be doing? In Seventh international AAAI conference on weblogs and social media, 2013.
- Nowlan & Hinton (1991) Nowlan, S. and Hinton, G. Evaluation of adaptive mixtures of competing experts. In Advances in neural information processing systems, pp. 774–780, 1991.
- Pannell & Ashman (2010) Pannell, G. and Ashman, H. User modelling for exclusion and anomaly detection: a behavioural intrusion detection system. In International Conference on User Modeling, Adaptation, and Personalization, pp. 207–218. Springer, 2010.
- Pavlov (2003) Pavlov, D. Sequence modeling with mixtures of conditional maximum entropy distributions. In International Conference on Data Mining, pp. 251–258. IEEE, 2003.
- Ramamurti & Ghosh (1999) Ramamurti, V. and Ghosh, J. Structurally adaptive modular networks for nonstationary environments. IEEE Transactions on Neural Networks, 10(1):152–160, 1999.
- Ren et al. (2019) Ren, H. et al. Time-series anomaly detection service at microsoft. In Proceedings of the 25th ACM SIGKDD international conference on knowledge discovery & data mining, pp. 3009–3017, 2019.
- Rousseeuw (1987) Rousseeuw, P. J. Silhouettes: a graphical aid to the interpretation and validation of cluster analysis. Journal of computational and applied mathematics, 20:53–65, 1987.
- Schölkopf et al. (2001) Schölkopf, B., Platt, J. C., Shawe-Taylor, J., Smola, A. J., and Williamson, R. C. Estimating the support of a high-dimensional distribution. Neural computation, 13(7):1443–1471, 2001.
- Sharkey (1999a) Sharkey, A. J. Linear and order statistics combiners for pattern classification. In Combining artificial neural nets, pp. 127–161. Springer, 1999a.
- Sharkey (1999b) Sharkey, A. J. Multi-net systems. In Combining artificial neural nets, pp. 1–30. Springer, 1999b.
- Shi et al. (2020) Shi, Y., Liu, Y., Tong, H., He, J., Yan, G., and Cao, N. Visual analytics of anomalous user behaviors: A survey. IEEE Transactions on Big Data, 2020.
- Sommer & Paxson (2010) Sommer, R. and Paxson, V. Outside the closed world: On using machine learning for network intrusion detection. In 2010 IEEE symposium on security and privacy, pp. 305–316. IEEE, 2010.
- Su et al. (2019) Su, Y., Zhao, Y., Niu, C., Liu, R., Sun, W., and Pei, D. Robust anomaly detection for multivariate time series through stochastic recurrent neural network. In Proceedings of the 25th ACM SIGKDD international conference on knowledge discovery & data mining, pp. 2828–2837, 2019.
- Tuor et al. (2018) Tuor, A. R., Baerwolf, R., Knowles, N., Hutchinson, B., Nichols, N., and Jasper, R. Recurrent neural network language models for open vocabulary event-level cyber anomaly detection. In Workshops at the Thirty-Second AAAI Conference on Artificial Intelligence, 2018.
- Ussath et al. (2017) Ussath, M., Jaeger, D., Cheng, F., and Meinel, C. Identifying suspicious user behavior with neural networks. In 2017 IEEE 4th International Conference on Cyber Security and Cloud Computing, pp. 255–263. IEEE, 2017.
- Warrender et al. (1999) Warrender, C., Forrest, S., and Pearlmutter, B. Detecting intrusions using system calls: Alternative data models. In Proceedings of the 1999 IEEE symposium on security and privacy, pp. 133–145. IEEE, 1999.
- Weise (2011) Weise, K. A lie detector test for online reviewers. Bloomberg Business Week, 2011.
- Yuan et al. (2017) Yuan, G., Li, B., Yao, Y., and Zhang, S. A deep learning enabled subspace spectral ensemble clustering approach for web anomaly detection. In 2017 International Joint Conference on Neural Networks (IJCNN), pp. 3896–3903. IEEE, 2017.
- Zhang et al. (2019) Zhang, C. et al. A deep neural network for unsupervised anomaly detection and diagnosis in multivariate time series data. In Proceedings of the AAAI conference on artificial intelligence, volume 33, pp. 1409–1416, 2019.