The Post-impact Evolution of the X-ray Emitting Gas in SNR 1987A Viewed by XMM-Newton

Lei Sun Department of Astronomy, Nanjing University, Nanjing 210023, China Anton Pannekoek Institute, GRAPPA, University of Amsterdam, PO Box 94249, 1090 GE Amsterdam, The Netherlands Jacco Vink Anton Pannekoek Institute, GRAPPA, University of Amsterdam, PO Box 94249, 1090 GE Amsterdam, The Netherlands SRON, Netherlands Institute for Space Research, Sorbonnelaan 2, 3584 CA Utrecht, The Netherlands Yang Chen Department of Astronomy, Nanjing University, Nanjing 210023, China Key Laboratory of Modern Astronomy and Astrophysics, Nanjing University, Ministry of Education, China Ping Zhou Department of Astronomy, Nanjing University, Nanjing 210023, China Anton Pannekoek Institute, GRAPPA, University of Amsterdam, PO Box 94249, 1090 GE Amsterdam, The Netherlands Dmitry Prokhorov Anton Pannekoek Institute, GRAPPA, University of Amsterdam, PO Box 94249, 1090 GE Amsterdam, The Netherlands School of Physics, University of the Witwatersrand, 1 Jan Smuts Avenue, Braamfontein, Johannesburg, 2050 South Africa Gerd Pühlhofer Institut für Astronomie und Astrophysik, Eberhard Karls Universität Tübingen, Sand 1, D-72076 Tübingen, Germany Denys Malyshev Institut für Astronomie und Astrophysik, Eberhard Karls Universität Tübingen, Sand 1, D-72076 Tübingen, Germany
Abstract

Since 1996 the blast wave driven by SN 1987A has been interacting with the dense circumstellar material, which provides us with a unique opportunity to study the early evolution of a newborn supernova remnant (SNR). Based on the XMM-Newton RGS and EPIC-pn X-ray observations from 2007 to 2019, we investigated the post-impact evolution of the X-ray emitting gas in SNR 1987A. The hot plasma is represented by two non-equilibrium ionization components with temperature of 0.6similar-toabsent0.6\sim 0.6 keV and 2.5similar-toabsent2.5\sim 2.5 keV. The low-temperature plasma has a density 2400similar-toabsent2400\sim 2400 cm-3, which is likely dominated by the lower density gas inside the equatorial ring (ER). The high-temperature plasma with a density 550similar-toabsent550\sim 550 cm-3 could be dominated by the H II region and the high-latitude material beyond the ring. In the last few years, the emission measure of the low-temperature plasma has been decreasing, indicating that the blast wave has left the main ER. But the blast wave is still propagating into the high-latitude gas, resulting in the steadily increase of the high-temperature emission measure. In the meantime, the average abundances of N, O, Ne, and Mg are found to be declining, which may reflect the different chemical compositions between two plasma components. We also detected the Fe K lines in most of the observations, showing increasing flux and centroid energy. We interpret the Fe K lines as from a third hot component, which may come from the reflected shock-heated gas or originate from Fe-rich ejecta clumps, shocked by the reverse shock.

ISM: supernova remnants — supernovae: general — X rays: individual (SN 1987A) — X-rays: ISM
journal: ApJsoftware: XSPEC

1 Introduction

As the nearest supernova (SN) observed since Kepler’s SN of 1604, SN 1987A provides us with a unique opportunity to observe in detail the onset of supernova remnant (SNR) formation and subsequent evolution for an SN whose observational properties are known in detail. SN1987A is located in the Large Magellanic Cloud (LMC) and detected on February 23, 1987. The progenitor star was identified as a blue supergiant (Sanduleak 69202superscript69202-69^{\circ}~{}202). SN 1987A is surrounded by a peculiar circumstellar material (CSM) system represented by three coaxial rings, the origin of which may be explained by the merging of a binary system at about 20,000 yr before the explosion (Podsiadlowski et al., 1992; Morris & Podsiadlowski, 2007) or by collisions of a fast wind colliding with material from an earlier slow wind, during the progenitor’s post main sequence evolution (Chita et al., 2008). Today, over 30 years after the SN outburst, the blast wave has encountered and heavily interacted with the CSM structures, especially the dense equatorial ring (ER). The impact of the blast wave on the ER resulted in a complex shock system, which compressed and heated the gas, giving rise to radiation in different energy bands. As a result, SN 1987A has made its transition to the remnant phase (see McCray & Fransson, 2016, for a recent review).

As a newborn remnant, SNR 1987A has during its short life already gone through several dynamics phases, as monitored regularly across the electromagnetic spectrum. Observations in the X-ray band are in particular crucial for understanding the underlying physics of the shock interaction processes, as it contains most of the emitting energy. The X-ray emission of SNR 1987A was first detected by ROSAT 1500similar-toabsent1500\sim 1500 days after the explosion and it steadily brightened until 3000similar-toabsent3000\sim 3000 days, as the blast wave began interacting with the H II region interior to the ER (Hasinger et al., 1996). Starting from 4000similar-toabsent4000\sim 4000 days, the blast wave encountered the dense clumps protruding from the inner edge of the ER, as evidenced by the appearance of several “hot spots” in the optical band (e.g., Sonneborn et al., 1998; Lawrence et al., 2000). Corresponding to this —as first observed by Chandra since 4600similar-toabsent4600\sim 4600 days— the soft X-ray flux of SNR 1987A was found to exceed the linear extrapolation of the ROSAT light curve and brighten more rapidly than observed by ROSAT (Burrows et al., 2000; Park et al., 2002). At 6000similar-toabsent6000\sim 6000 days the blast wave impacted the main body of the ER, as indicated by a dramatic increase in the soft X-ray flux (e.g., Park et al., 2005) and a sudden decrease in the shock velocity (e.g., Racusin et al., 2009). Thereafter, the soft X-ray flux continued increasing —first exponentially and then linearly (Helder et al., 2013)— until day 9500similar-toabsent9500\sim 9500, when the light curve started to level off (Frank et al., 2016). Together with the optical/infrared light curves, this indicates that the blast wave had traversed through the entire dense ring (Fransson et al., 2015; Arendt et al., 2016).

Recently, the overall X-ray light curve has been well reproduced by three-dimensional hydrodynamic/magnetohydrodynamic simulations (e.g., Orlando et al., 2015, 2019, 2020). These simulations indicate that the X-ray emission is dominated first by the shocked H II region, then by the shocked dense ring, and that SNR 1987A will enter a third phase around 32–34 years after the explosion, which will be dominated by the SN ejecta heated by the reverse shock. According to these simulations, we are expecting to find the X-ray features from the shocked ejecta in the most recent observations, or in the near future. On the other hand, recent optical observations revealed new features of spot-like and diffuse emission outside the ER (since 9500similar-toabsent9500\sim 9500 days), which may be related to high-latitude material that extends from the ER toward the outer rings (Larsson et al., 2019). Therefore, we are also expecting to observe the associated X-ray emission from this material. In addition, a recent (2016–2018) enhancement of the GeV emission from the SNR 1987A region has been reported based on Fermi/LAT observations (Malyshev et al., 2019). The X-ray observations could be crucial to clarify the nature of the GeV signal (a detection of the non-thermal emission in the 10–20 keV energy band has been recently reported by Greco et al., 2021, which may be indicative of a pulsar wind nebula).

In this work, we report our analysis of XMM-Newton observations of SNR 1987A taken during the last decade, aiming at the post-impact evolution of the X-ray emitting gas. We performed detailed spectral modeling and constrained multiple physical parameters to unveil the plasma properties. The recent changes in the plasma properties clearly show that the blast wave has left the ER and is propagating into the high-latitude gas. This paper is organized as follows: Section 2 describes the observations and data reduction procedure, Section 3 presents the spectral modeling and the main results, Section 4 discusses the further implications of the results, and Section 5 gives a brief summary.

2 Observations and Data Reduction

SNR 1987A has been regularly monitored by XMM-Newton from 2007 to 2017 (PI: F. Haberl). Recently, we obtained a new observation in November 2019 (PI: Malyshev, for the H.E.S.S. collaboration), aiming at its latest evolution. Thereby, we got a set of data containing 12 observations in total, covering a time interval over 12 years, which is summarized in Table 1. In this work, we utilized these data to analyze the X-ray spectra of SNR 1987A taken in the last decade. The high-resolution RGS spectra provide tight constraints to the plasma properties. We also included the EPIC-pn spectra for a complete energy coverage to 10 keV following Sturm et al. (2010).

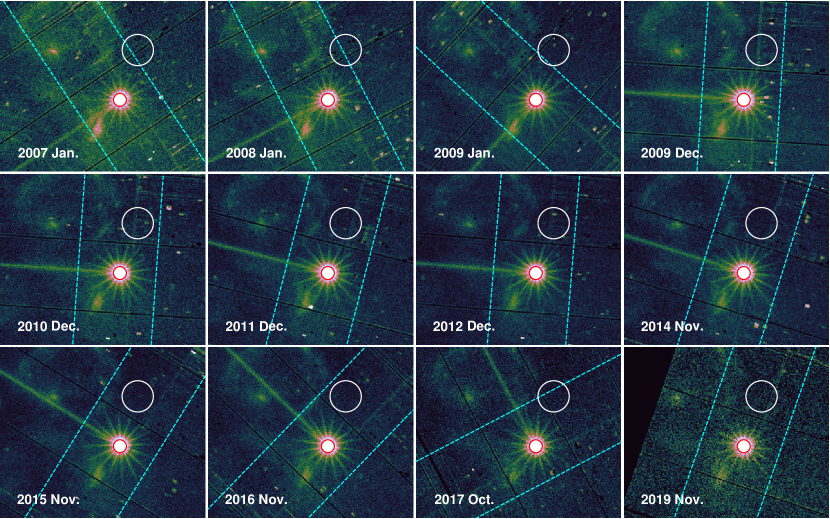
We used XMM-Newton Science Analysis Software (SAS, version 16.1.0)111https://www.cosmos.esa.int/web/xmm-newton/sas to process the data. For EPIC-pn data, the task epchain was used to produce calibrated photon event files, and then pn-filter was used to filter out soft proton (SP) flares and to remove affected time intervals. The EPIC-pn spectra of SNR 1987A were extracted from a circular region centered on the source with a radius of 25′′superscript25′′25^{\prime\prime} 222SNR 1987A is a point-like source as viewed by EPIC-pn. However, in view of the PSF (FWHM12.5′′similar-to𝐹𝑊𝐻𝑀superscript12.5′′FWHM\sim 12.5^{\prime\prime}), a circular region with a radius of 25′′superscript25′′25^{\prime\prime} can get most of the source photons involved while avoid large background contamination., while the background spectra were extracted from a source-free region nearby (shown in Figure 1). We note that the background contributes only 1%similar-toabsentpercent1\sim 1\% to the EPIC-pn spectrum of SNR 1987A, so the background subtraction is only minor contribution to the systematic error budget. We selected only the single events (𝙿𝙰𝚃𝚃𝙴𝚁𝙽=0𝙿𝙰𝚃𝚃𝙴𝚁𝙽0{\tt PATTERN}=0) for the source spectra in order to get rid of the photon pile-up effect. The RGS data were processed using rgsproc, and then the spectra were extracted within the low-background time intervals (𝚁𝙰𝚃𝙴<0.2𝚁𝙰𝚃𝙴0.2{\tt RATE}<0.2). For a reliable application of the χ2superscript𝜒2\chi^{2} statistics, both of the EPIC-pn and RGS spectra were rebinned using FTOOL333https://heasarc.gsfc.nasa.gov/ftools/ task grppha to obtain at least 25 counts per bin.

3 Spectral analysis

In order to better trace the evolution of the X-ray properties of the remnant, we used a consistent method to analyze all the observations. We used XSPEC (version 12.10.1)444https://heasarc.gsfc.nasa.gov/xanadu/xspec/ with AtomDB 3.0.9555http://www.atomdb.org/ for spectral analysis. Unless otherwise specified, in this paper we present metal abundances with respect to their solar values (Wilms et al., 2000, hereafter W00).

3.1 Individual emission lines and their fluxes

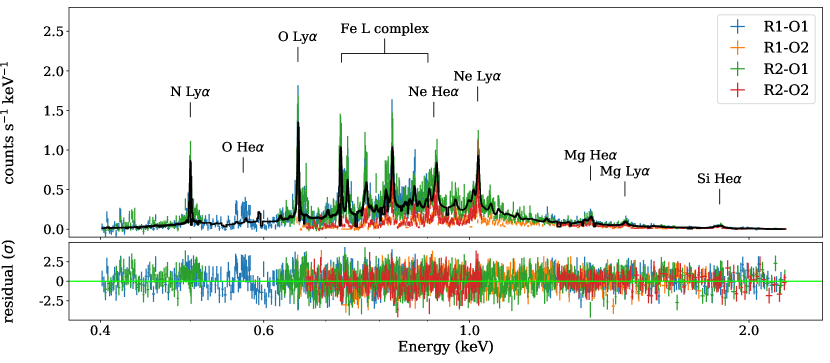
Taking advantage of the high spectral resolution of RGS, we are able to identify the individual emission lines and to constrain their fluxes. The 0.350.350.352.52.52.5 keV RGS spectra of SNR 1987A are dominated by the emission lines, which mainly come from the α𝛼\alpha-elements such as O, Ne, Mg and Si, and from the Fe-L transitions around 0.70.70.70.90.90.9 keV (Figure 2). In order to identify these lines, we constructed an heuristic model and fit it to the first-order and the second-order RGS1/RGS2 spectra simultaneously.

The spectral model consists of a thermal continuum component (described by the nlapec model in XSPEC, including thermal bremsstrahlung, radiative recombination continua and two photon emission), and several Gaussian line profiles (gauss). Both the continuum and the emission lines were subjected to foreground absorption (tbabs), for which the Galactic absorption was fixed at NH,Gal=6×10²⁰subscript𝑁HGal6superscript1020N_{\rm H,\,Gal}=6\times 10^{20} cm-2 with abundances set to be solar, and the LMC absorption was fixed at NH,LMC=2.2×10²¹subscript𝑁HLMC2.2superscript1021N_{\rm H,\,LMC}=2.2\times 10^{21} cm-2 with abundances set to be the average LMC abundances given by Russell & Dopita (1992). Previous studies have revealed line broadening features in the dispersed X-ray spectra of SNR 1987A (e.g., Zhekov et al., 2005; Miceli et al., 2019). Despite its complex origins, the line broadening can be approximately described with a power-law function of energy (e.g., Sturm et al., 2010; Dewey et al., 2012). Therefore, we simply adopted a Gaussian smoothing component (gsmooth) for the broadening effect. The gsmooth function convolves the spectrum with a Gaussian function, of which the Gaussian sigma is energy dependent: σ=σ6(E/6keV)α𝜎subscript𝜎6superscript𝐸6keV𝛼\sigma=\sigma_{6}(E/6\,{\rm keV})^{\alpha}, where σ6subscript𝜎6\sigma_{6} is the width at 6 keV. We also introduced a redshift component (vashift) to account for the line shift which may result from the systemic motion of the remnant.

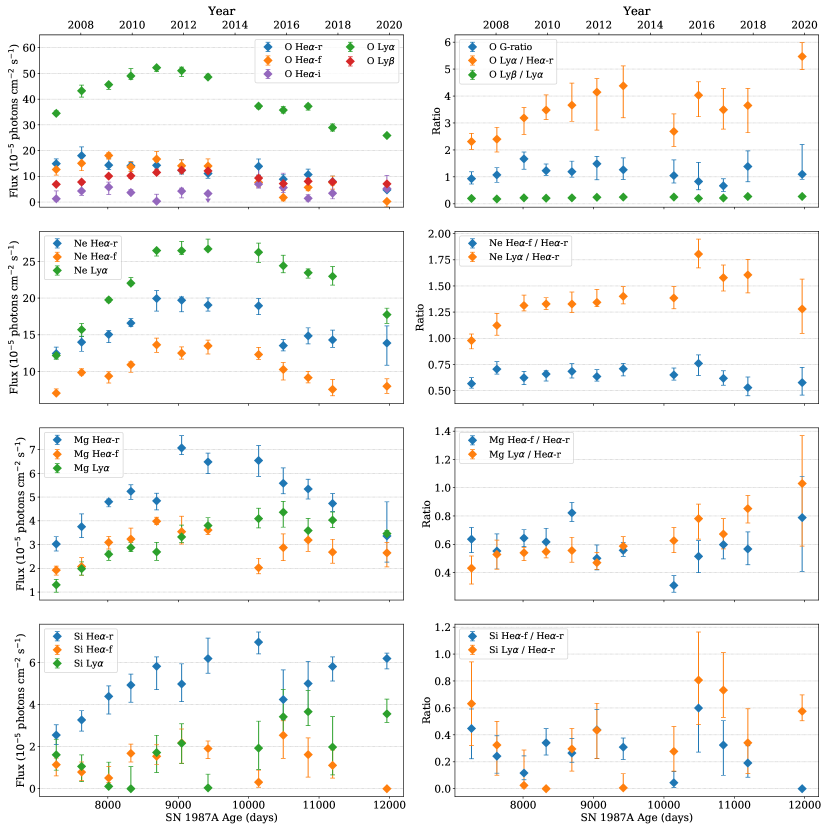
With this heuristic spectral model described above, we identified 36 emission lines in the RGS spectra of SNR 1987A. The emission lines, together with their rest frame centroids and (absorption-corrected) fluxes, are listed in Table 2. Among these emission lines, the He-like triplets and the H-like Ly lines are especially useful for thermal X-ray plasma diagnostics. In Figure 3, we plotted the light curves of various emission lines from the He- and H-like ions of O, Ne, Mg, and Si. Most of the emission lines follow a similar flux-evolution pattern, showing initially a brightening, reaching a peak value at around 2011-2015, and after that a drop-off in flux. This is consistent with the overall soft X-ray light curve of SNR 1987A (e.g., Frank et al., 2016, see also Section 3.3 below for our updates with the new data). For the oxygen lines, we calculated the G-ratios (defined as (f+i)/r𝑓𝑖𝑟(f+i)/r, where f𝑓f, i𝑖i, and r𝑟r stand for the fluxes of the forbidden line, the intercombination lines and the resonance line, respectively), the Lyα𝛼\alpha/Heα𝛼\alpha-r flux ratios, and the Lyβ𝛽\beta/Lyα𝛼\alpha flux ratios. For Ne, Mg, and Si, we calculated the Heα𝛼\alpha-f/Heα𝛼\alpha-r flux ratios and the Lyα𝛼\alpha/Heα𝛼\alpha-r flux ratios. As shown in Figure 3, we find that while the G-ratios (or Heα𝛼\alpha-f/Heα𝛼\alpha-r) show no significant variation during this 12-year interval, the Lyα𝛼\alpha/Heα𝛼\alpha flux ratios have been continuously increasing. This could result from the increase in the average plasma temperature, but may also be affected by non-equilibrium ionization (NEI) effects.

Our spectral analysis also provides measurements of the line broadening and the systemic velocity, see σ6subscript𝜎6\sigma_{6} and v87Asubscript𝑣87Av_{\rm 87A} in Table 2. Except for an obviously divergent value from the 2019 observation (which has the shortest effective exposure and thus the lowest photon statistics), the line shift indicates a systemic velocity of SNR 1987A around 250 km s-1, consistent with the value derived from optical observations (286.74±0.05plus-or-minus286.740.05286.74\pm 0.05 km s-1, e.g., Gröningsson et al., 2008). We note that the systematic error could be significantly greater than the statistical error in this case for systemic velocity measurement. The RGS wavelength scale accuracy is 5 mÅ and 4 mÅ in the first and second order, respectively. Since most of the bright emission lines lie in the range of 10–20 Å, a 5similar-toabsent5\sim 5 mÅ uncertainty in the line position will transfer to 70similar-toabsent70\sim 70150150150 km s-1 uncertainty in the systemic velocity. Taking this systematic error into consideration, we estimated the overall uncertainty in systemic velocity as 100similar-toabsent100\sim 100 km s-1, which may explain the rather large dispersion of the measured v87Asubscript𝑣87Av_{\rm 87A} values. On the other hand, the line shift could also be affected by the asymmetric distribution and expansion of the X-ray emitting gas. As revealed by Chandra observations (Frank et al., 2016, Figure 5 therein), the surface brightness distribution of the ER has been dynamically changing since the impact, which may also lead to the large dispersion of the values we obtained here for v87Asubscript𝑣87Av_{\rm 87A}. The line broadening effect is characterized by a Gaussian smooth function, by which we found the power-law index α2similar-to𝛼2\alpha\sim 2, similar to the value obtained by Sturm et al. (2010), and consistent with the Chandra LETG results (Zhekov et al., 2009). The power-law index provides us further information about the origin of the line broadening (see also the discussion in Dewey et al., 2012). The source extent will result in a broadening which is constant in wavelength and thus gives α=2𝛼2\alpha=2 in energy. This is nearly the case for LETG/HETG, but not for RGS since SNR 1987A is spatially unresolved by XMM-Newton. On the other hand, the Doppler broadening (including the bulk Doppler broadening and the thermal broadening) gives α=1𝛼1\alpha=1 assuming a constant velocity over all the spectral lines. Our result of α2similar-to𝛼2\alpha\sim 2 (>1absent1>1) indicates that the spectral lines at higher energy (which are from the heavier elements) have larger velocities. This is consistent with the results obtained by Miceli et al. (2019), in the sense of a proportional relation between the post-shock ion temperature and the ion mass.

3.2 Global spectral fitting

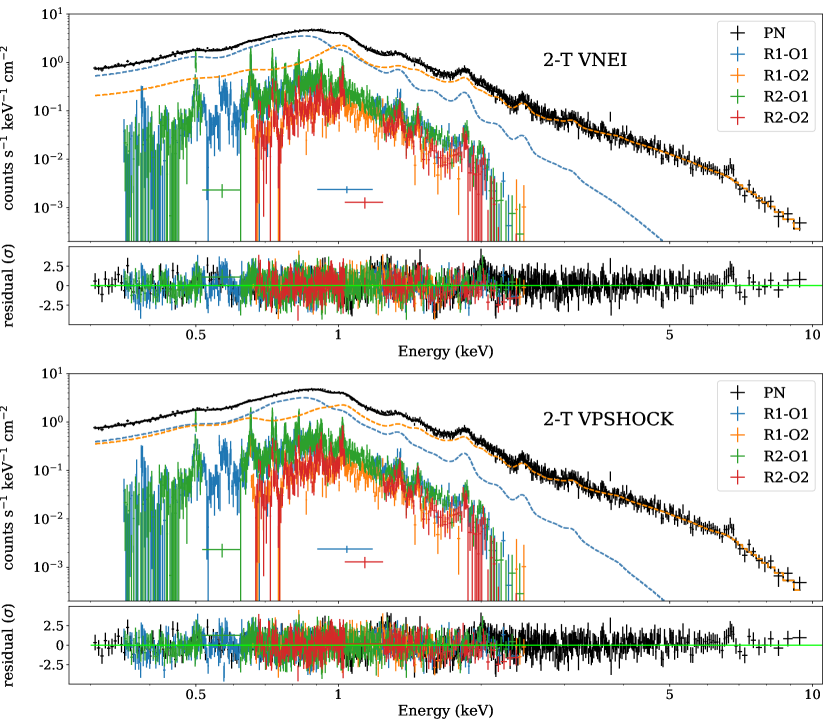
In order to better characterize the physical properties of the X-ray emitting gas in SNR 1987A, we fitted the RGS (0.35–2.5 keV) and EPIC-pn (0.3–10.0 keV) spectra simultaneously with detailed NEI plasma emission models.

3.2.1 two-temperature vnei model

While the actual distribution of temperatures, densities and other plasma properties can be quite complex, previous studies (e.g., Sturm et al., 2010; Frank et al., 2016) have shown that the X-ray emission of SNR 1987A can be well approximated by a spectral model containing two plasma components: a low-temperature component associated with the dense ring material, and a high-temperature component associated with the lower density gas. Therefore, we first fit the RGS and pn spectra with a two-temperature NEI plasma model, described by two vnei models in XSPEC. The vnei model characterizes the average thermal and ionization state of the plasma by a single electron temperature kTe𝑘subscript𝑇ekT_{\rm e} and a single ionization parameter τ=net𝜏subscript𝑛e𝑡\tau=n_{\rm e}t, respectively, where nesubscript𝑛en_{\rm e} is the electron density and t𝑡t is the elapsed time since the gas was shocked. Following Sturm et al. (2010, and the references therein, with abundances converted to W00), the abundances of N, O, Ne, Mg, Si, S, and Fe were set as free parameters, while those of He (set to 2.57), C (0.14), Ar (0.76), Ca (0.49), and Ni (0.98) were fixed, since they produce no significant features in our data. The abundances of the two components were assumed to be the same. The Galactic absorption and the LMC absorption were fixed at NH,Gal=6×10²⁰subscript𝑁HGal6superscript1020N_{\rm H,\,Gal}=6\times 10^{20} cm-2 and NH,LMC=2.2×10²¹subscript𝑁HLMC2.2superscript1021N_{\rm H,\,LMC}=2.2\times 10^{21} cm-2, respectively666As previously pointed out by Dewey et al. (2012), there could be a measurable absorption component local to SNR 1987A: a density of 1×1041superscript1041\times 10^{4} H cm-3 and a path length of 0.01 pc would result in a local absorption NH,local0.3×1021similar-tosubscript𝑁Hlocal0.3superscript1021N_{\rm H,\,local}\sim 0.3\times 10^{21} cm-2. This local absorption is also affected by clumping, the ionization state, and the geometry of the remnant, and thus may change as the system evolves. By setting the LMC absorption as a free parameter among different epochs, we obtain NH,LMCsubscript𝑁HLMCN_{\rm H,\,LMC} varying in the range of 1.71.71.72.5×10212.5superscript10212.5\times 10^{21} cm-2, with a rather monotonic increasing trend. This may reflect the local absorption, but will introduce additional parameter degeneracy, especially between NHsubscript𝑁HN_{\rm H}, kTe𝑘subscript𝑇ekT_{\rm e}, and the normalization. On the other hand, the changes and the calibration uncertainties in the RGS effective area may also affect the measure of NHsubscript𝑁HN_{\rm H}. As a result, we decide to keep NH,LMCsubscript𝑁HLMCN_{\rm H,\,LMC} fixed to its average value (2.2×10212.2superscript10212.2\times 10^{21} cm-2) in our spectral fitting, and actually this will not significantly affect our conclusions.. Similar to the model described in Section 3.1, the spectra were convolved with gsmooth function and shifted by vashift to account for the line broadening and systemic velocity, respectively. The parameters of gsmooth and vashift were fixed at the values obtained above by the RGS spectral fitting (Table 2) for each observation.

This two-temperature vnei model gives acceptable fits to the spectra for all the observation, with reduced chi-square values of χr21.21similar-tosubscriptsuperscript𝜒2r1.21\chi^{2}_{\rm r}\sim 1.211.411.411.41 (dof 1234similar-toabsent1234\sim 1234243324332433). The low-temperature component is characterised by kTe,LT0.6similar-to𝑘subscript𝑇eLT0.6kT_{\rm e,LT}\sim 0.6 keV and the high-temperature component has kTe,HT2.5similar-to𝑘subscript𝑇eHT2.5kT_{\rm e,HT}\sim 2.5 keV, which show no significant variations during the last decade. The detailed fitting results are summarized in Table 3.

3.2.2 Two-temperature vpshock model

In addition to the vnei model presented above, we also modeled the global spectra of SNR 1987A spectra with a plane-parallel shock model (Borkowski et al., 2001, described by the vpshock model in XSPEC). This model describes the X-ray emission from the hot gas heated by a plane-parallel shock with a constant post-shock temperature. It differs from the vnei model in its linear distribution of the ionization parameter τ𝜏\tau versus emission measure, instead of assuming a single ionisation parameter. The NEI plasma in the vpshock model is characterized by a lower limit τl=netlsubscript𝜏lsubscript𝑛esubscript𝑡l\tau_{\rm l}=n_{\rm e}t_{\rm l} at the shock front and an upper limit τu=netusubscript𝜏usubscript𝑛esubscript𝑡u\tau_{\rm u}=n_{\rm e}t_{\rm u} for the earliest shocked gas. We fixed τlsubscript𝜏l\tau_{\rm l} at zero and let τusubscript𝜏u\tau_{\rm u} vary freely. Other parameters were set in the same way as those in the vnei model.

We find that the two-temperature vpshock model fits the data better, which is indicated by an average drop of the reduced chi-square Δχr20.07similar-toΔsubscriptsuperscript𝜒2r0.07\Delta\chi^{2}_{\rm r}\sim 0.07. This suggested that the single ionization state scenario in vnei model is over-simplified, while the plane-parallel shock model better represents the actual conditions. However, the best-fit values of the parameters show no significant discrepancy from those in the vnei fitting, except for the values of τusubscript𝜏u\tau_{\rm u}, which are typically one order of magnitude higher than the average τ𝜏\tau given by the vnei fitting (Table 4). We further discuss the physical implications of the difference between τ𝜏\tau and τusubscript𝜏u\tau_{\rm u} in Section 4.2

3.3 X-ray light curve

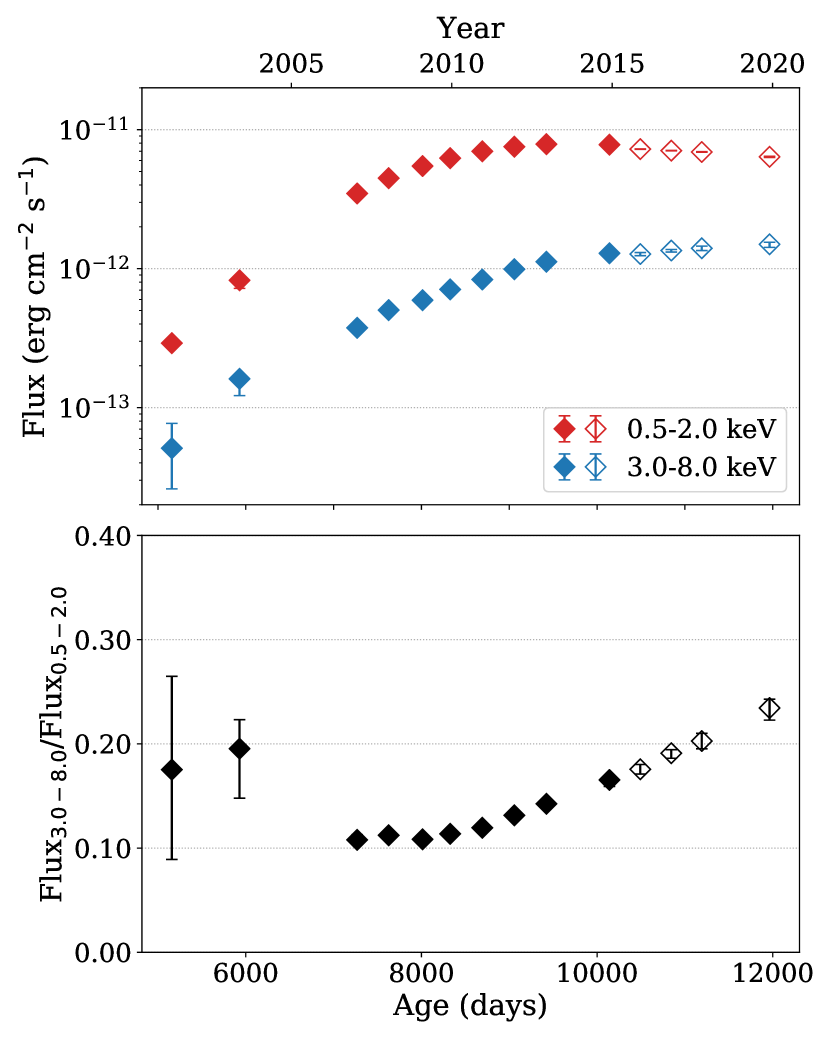
The X-ray light curves of SNR 1987A up to 2015 have been reported by Frank et al. (2016) based on both Chandra and XMM-Newton observations. Here we update the recent changes in X-ray fluxes with the new XMM-Newton data.

Based on our two-temperature vpshock fitting described above, we measured the 0.5–2.0 keV and 3.0–8.0 keV fluxes of the remnant from 2015 to 2019, and show them in Figure 5 together with the earlier results. As noticed by Frank et al. (2016), the soft band flux of SNR 1987A reached a plateau at around 9000 days, and has remained approximately constant since then. The new observations show that after around 10500 days, the soft band flux started to decline. In the latest observation (11964 days), the soft band flux was 6.4×10¹²similar-toabsent6.4superscript1012\sim 6.4\times 10^{-12} erg cm-2 s-1, a drop of 18%similar-toabsentpercent18\sim 18\% from its peak value (7.8×10¹²similar-toabsent7.8superscript1012\sim 7.8\times 10^{-12} erg cm-2 s-1). In the meantime, the hard band flux kept increasing over the last few years, with a latest value of 1.5×10¹²similar-toabsent1.5superscript1012\sim 1.5\times 10^{-12} erg cm-2 s-1. As a result, the hard to soft flux ratio continued climbing up as before (see Figure 5).

3.4 Fe K lines

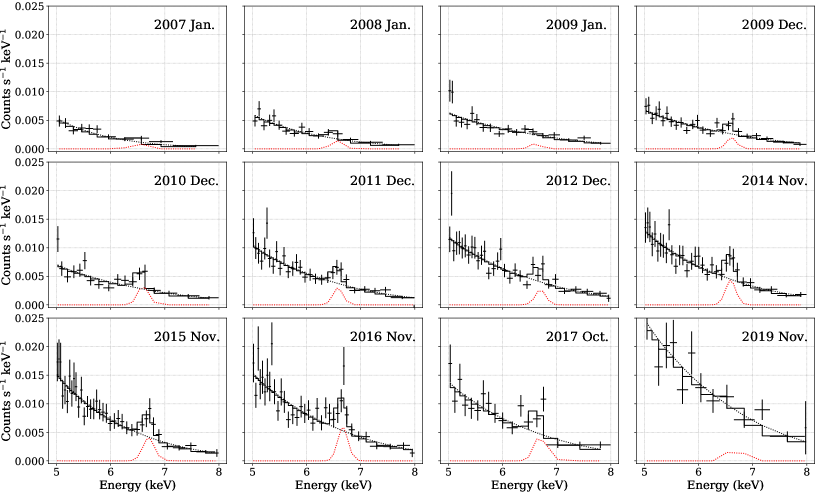
We note that although the global spectra of SNR 1987A can be approximately characterized with a two-temperature vnei or vpshock model, both of these two models leave some residuals around 6.6similar-toabsent6.6\sim 6.6 keV for the EPIC-pn spectra, corresponding to Fe K line emission (see Figure 4). The detection of the Fe K lines has been reported by several studies (e.g., Sturm et al., 2010; Maggi et al., 2012), but its origin remains unclear. Here, we present a comprehensive investigation of the Fe K lines based on the XMM-Newton observations.
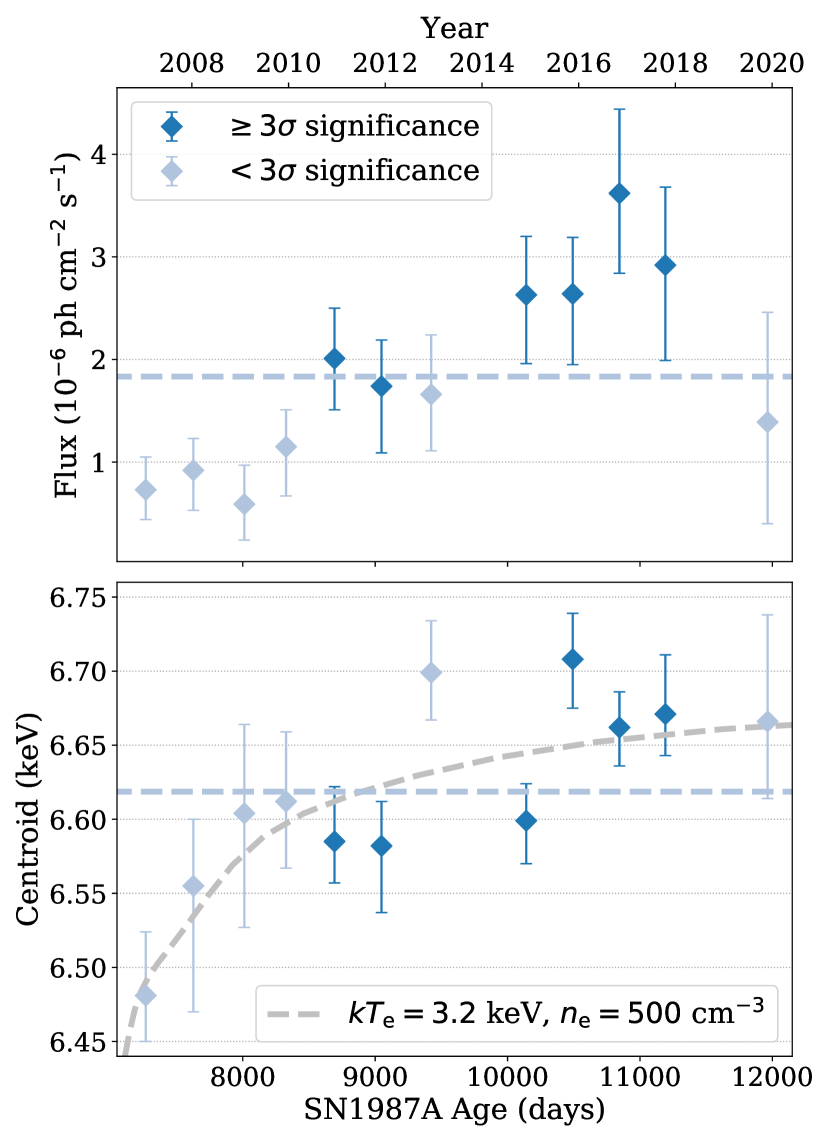
We extracted the 5.05.05.08.08.08.0 keV EPIC-pn spectra, and fitted them with a combination of a thermal bremsstrahlung continuum (bremss) and a Gaussian profile (gauss). As shown in Figure 6, the Fe K line gradually emerged out from the underlying continuum. With the Gaussian component, we constrained the line fluxes and the centroids of the Fe K lines (listed in Table 5). There are several approaches to evaluate the significance of the lines. As listed in Table 5, we first provided the measured line fluxes and their 1-σ𝜎\sigma uncertainties as estimates. Following Maggi et al. (2012), we also performed F-tests and calculated the p-values. At last, we introduced the Akaike information criterion (AIC, Akaike, 1974) as a third approach. We derived the AIC value as:

AIC=nln[iωi(yimi)2/n]+2p=nln(χ2/n)+2p,𝐴𝐼𝐶𝑛subscript𝑖subscript𝜔𝑖superscriptsubscript𝑦𝑖subscript𝑚𝑖2𝑛2𝑝𝑛superscript𝜒2𝑛2𝑝AIC=n\ln\left[\sum_{i}\omega_{i}\left(y_{i}-m_{i}\right)^{2}/n\right]+2p=n\ln\left(\chi^{2}/n\right)+2p, (1)

where n𝑛n is the number of measurements, p𝑝p the number of free parameters, yisubscript𝑦𝑖y_{i} the observations, misubscript𝑚𝑖m_{i} the model predicted values, and ωisubscript𝜔𝑖\omega_{i} the weight factors. The more appropriate model is the one with the smaller AIC value. Thereby, we calculated the differences in AIC values between the models with and without the Gaussian component, and listed them in Table 5 as ΔAICΔ𝐴𝐼𝐶\Delta AIC. Based on the significance analysis, we found that the first few observations taken in 2007–2009 show only modest (1–2σ𝜎\sigma) detections. But since 2010, we have continuously detected the Fe K lines with 3σgreater-than-or-equivalent-toabsent3𝜎\gtrsim 3\sigma significance —the less significant detection in 2019 is likely caused by the rather short effective exposure time of 11similar-toabsent11\sim 11 ks. Despite of a few less significant detections, we find that both the flux and the centroid energy of the Fe K lines have been increasing during the last decade, as shown in Figure 7. Assuming that the flux and the centroid energy are constant leads to reduced chi-square values χr24.05superscriptsubscript𝜒r24.05\chi_{\rm r}^{2}\approx 4.05 and χr23.36superscriptsubscript𝜒r23.36\chi_{\rm r}^{2}\approx 3.36, respectively. Both values of χr2superscriptsubscript𝜒r2\chi_{\rm r}^{2} are clearly inconsistent with a constant flux and centroid energy. This indicates that there is an increase in the emission measure and the average ionization state of the Fe-K emitting plasma as function of time. However, the equivalent width of the line, which is more indicative of the Fe abundance, shows no significant variation during the period.

4 Discussion

4.1 Temporal evolution of the plasma

Since the SN blast wave impacted on the main body of the ER, the X-ray emission from SNR 1987A has been dominated by the shocked gas inside the ring. The XMM-Newton observations presented in this work started after the main impact and covered a time interval over 12 years, which helps us to follow the post impact evolution and provide further insights into the composition and structure of the ER.

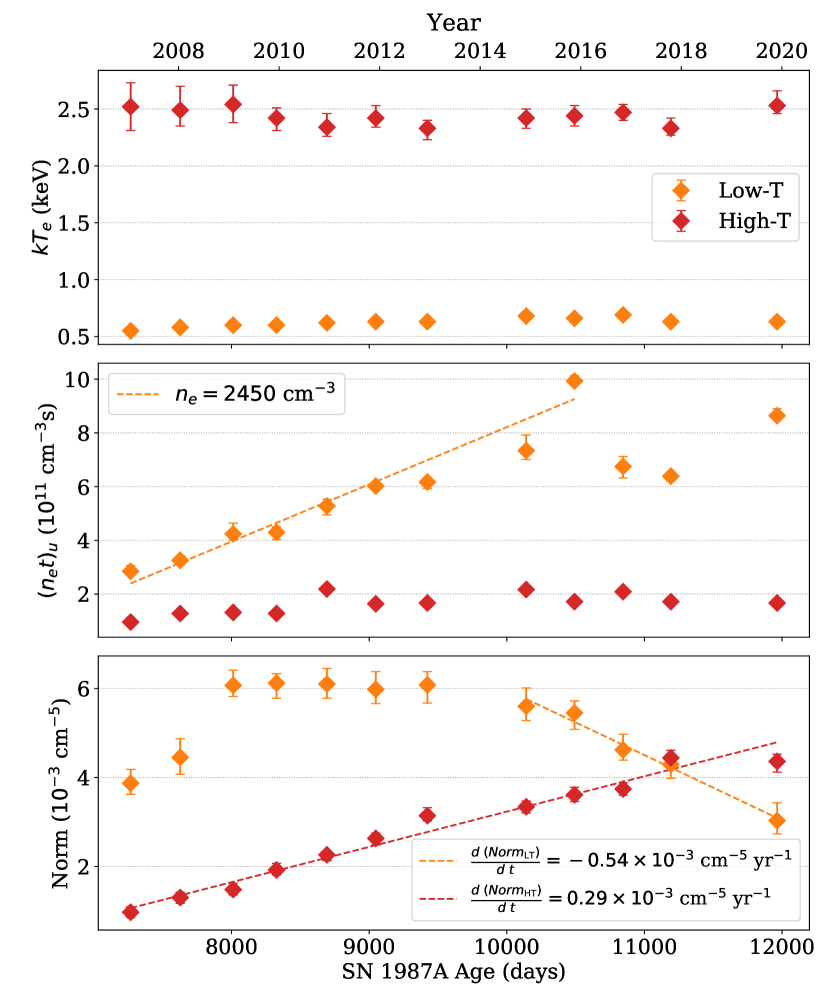
With the vpshock fitting (Section 3.2.2), we have constrained the electron temperatures, the upper limits of the ionization parameters, and the normalizations of the gas, as shown in Figure 8.

The electron temperatures of the two plasma components show no significant variation during the last decade (kTe,LT0.6similar-to𝑘subscript𝑇eLT0.6kT_{\rm e,LT}\sim 0.6 keV and kTe,HT2.5similar-to𝑘subscript𝑇eHT2.5kT_{\rm e,HT}\sim 2.5 keV), indicating basically constant shock velocities. Given the classic relation between the shock velocity and the average post shock temperature as Vs2=(16/3)(kT¯)/(μmp)superscriptsubscript𝑉s2163¯𝑘𝑇𝜇subscript𝑚pV_{\rm s}^{2}=(16/3)(\overline{kT})/(\mu m_{\rm p}) (where μ𝜇\mu is the average particle mass in units of the proton mass, μ0.72similar-to𝜇0.72\mu\sim 0.72 for SNR 1987A abundance), we obtained Vs,LT650similar-tosubscript𝑉sLT650V_{\rm s,LT}\sim 650 km s-1 and Vs,HT1330similar-tosubscript𝑉sHT1330V_{\rm s,HT}\sim 1330 km s-1 for the low- and high-temperature plasma, respectively. On the other hand, Frank et al. (2016) constrained the expansion velocities of the ER as 1850similar-toabsent1850\sim 1850 km s-1 for the soft band (0.5–2 keV) and 3070similar-toabsent3070\sim 3070 km s-1 for the hard band (2.0–10 keV) by fitting spatial models to Chandra ACIS images, which also provided estimates of the typical shock velocities and are generally higher than what we found here. This difference might further reflect the non-equilibrium of the temperatures between different particle species behind the collisionless shock front. In that case, the electron temperature could be much lower than the proton/ion temperatures or the average temperature of the plasma (e.g., Vink, 2020), and thus cause an underestimate of the shock velocities in the calculations above. Evidence for this temperature non-equilibrium effect have been found by both simulations and observations (e.g., Cargill & Papadopoulos, 1988; Shimada & Hoshino, 2000; Vink et al., 2003; Ghavamian et al., 2007). Recently, Miceli et al. (2019) measured the post-shock temperatures of protons and ions in SNR 1987A, and found that the ratio of ion temperature to proton temperature is significantly higher than one, providing observational clues to the temperature non-equilibrium in this young remnant.

We found that the upper limit on the ionization parameter of the low-temperature plasma (τu,LTsubscript𝜏uLT\tau_{\rm u,LT}) has been increasing linearly from 7300 to 10500 days. A linear fit to τu,LTsubscript𝜏uLT\tau_{\rm u,LT} suggests an average density of ne,LT=2450±150subscript𝑛eLTplus-or-minus2450150n_{\rm e,LT}=2450\pm 150 cm-3. By using a similar method, Sturm et al. (2010) fitted a linear function to τu,LTsubscript𝜏uLT\tau_{\rm u,LT} from 2007 to 2009 (7300 to 8000 days, based on the first three XMM-Newton observations listed in Table 1), which yielded a density of 3240±640plus-or-minus32406403240\pm 640 cm-3. They also found that for the high-temperature plasma, τu,HTsubscript𝜏uHT\tau_{\rm u,HT} has been increasing steadily from 2003 to 2009 (6000 to 8000 days). However, our results indicate that after 2009, τu,HTsubscript𝜏uHT\tau_{\rm u,HT} stayed constant at around 2×10112superscript10112\times 10^{11} cm-3 s, and show no further evolution. Our fit to τu,LTsubscript𝜏uLT\tau_{\rm u,LT} also indicates that most of the low-temperature gas was first shocked at around 6000 days after the explosion, which gives us an estimate of the date of impact on the main ER. This is consistent with the previous results based on X-ray light curve analysis and expansion velocity studies (e.g., Racusin et al., 2009; Helder et al., 2013; Frank et al., 2016).

The normalization parameters of the two plasma components show different variations during the last decade. For the low-temperature plasma, the normalization NormLTsubscriptNormLT{\rm Norm_{LT}} increased at the first few years, leveled off at around 9000 days, and then started to decrease steadily since 10500similar-toabsent10500\sim 10500 days. On the other hand, NormHTsubscriptNormHT{\rm Norm_{HT}} kept increasing during the whole interval, with an approximately constant rate. Linear fits to the data gave a decreasing rate of NormLTsubscriptNormLT{\rm Norm_{LT}} (after 10500 days) as (0.54±0.03)×103plus-or-minus0.540.03superscript103(0.54\pm 0.03)\times 10^{-3} cm-5 yr-1, and an increasing rate of NormHTsubscriptNormHT{\rm Norm_{HT}} as (0.29±0.01)×103plus-or-minus0.290.01superscript103(0.29\pm 0.01)\times 10^{-3} cm-5 yr-1.

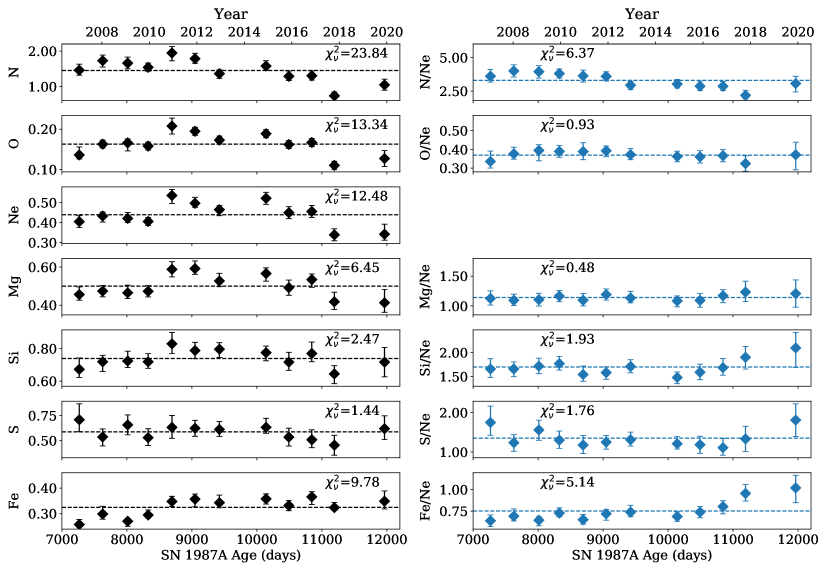
With the spectral analysis, we have also constrained the abundances of various metal species, including N, O, Ne, Mg, Si, S, and Fe, as shown in the left panels of Figure 9. We note that the metal abundances, which are tied between two plasma components in our spectral fitting, should be taken as the (weighted) average values. We also calculated the abundance ratios with respect to Ne (Ne abundances are best constrained among all species), as shown in the right panels of Figure 9. In order to investigate their variations during the period, we derived the mean abundances and abundance ratios, and performed χ2superscript𝜒2\chi^{2} analysis based on these mean values (shown in Figure 9). We note that for a p-value of 0.002 (3σsimilar-toabsent3𝜎\sim 3\sigma level), the critical reduced chi-square is given as χν,c22.67subscriptsuperscript𝜒2𝜈c2.67\chi^{2}_{\rm\nu,c}\approx 2.67 for 11 degrees of freedom. Thus the χ2superscript𝜒2\chi^{2} analysis indicates that the abundances of N, O, Ne, Mg, and Fe, as well as the N/Ne and Fe/Ne ratio, have significantly changed in the last decade. The variations of N, O, Ne, and Mg abundances follow a similar track, which stayed at their mean values till around 10500 days, and then started to decrease recently. This is well fitted with the recent decline of the low-temperature plasma normalization after 10500similar-toabsent10500\sim 10500 days. The increasing Fe abundance conforms to the increasing high-temperature plasma normalization. As for the abundance ratios, N/Ne has been decreasing while Fe/Ne been increasing during the time, consistent with the variation of single abundances. Therefore, the overall changes of the single metal abundances and their ratios could be naturally explained with the different chemical compositions for two plasma components. In our spectral fitting, the abundances of N, O, Ne, and Mg are determined mainly by their emission lines lying in 0.5–2 keV energy band, which were dominated by the low-temperature component at the beginning. Since the recent decline of NormLTsubscriptNormLT{\rm Norm_{LT}}, the high-temperature plasma started to contribute a significant part of the emission even in the soft band, and thus the abundances became more representative of the high-temperature plasma. In that case, our results indicate that the low-temperature plasma has enhanced metal abundances as compared to the high-temperature plasma, especially for N, O, Ne, and Mg, while the high-temperature plasma may be more abundant in Fe. We will further discuss the possible origin of metal differences in Section 4.3. It is also possible that the increasing Fe abundance and the Fe/Ne ratio result from the recent emergence of Fe-rich ejecta. However, this needs to be further examined, and we leave the discussions in Section 4.4. At last, we note that in a recent paper, Bray et al. (2020) studied the metal abundances of SNR 1987A based on Chandra HETG data (taken in 2011–2018) and found no significant variations during the period. However, the spectra they adopted were limited in 0.5–3 keV, thus the hot component might not be well constrained. Specifically, they obtained a temperature of 1.2-1.6 keV for the hot plasma, while our results and many other works suggested 2.5similar-toabsent2.5\sim 2.5 keV.

4.2 Electron density, ionization age, and filling factor

In this section, we estimate the electron density, the ionization age, and the filling factor of the X-ray emitting gas based on spectral fitting results.

Assuming that the shocked ER has a toroidal geometry, its volume can be derived as VER=2π2Rr2d3subscript𝑉ER2superscript𝜋2𝑅superscript𝑟2superscript𝑑3V_{\rm ER}=2\pi^{2}Rr^{2}d^{3}, where R𝑅R and r𝑟r are the angular radius and the half-width of the torus, respectively, and d𝑑d is the distance to SNR 1987A. We then took the total X-ray emitting volume as V=ftotVER𝑉subscript𝑓totsubscript𝑉ERV=f_{\rm tot}V_{\rm ER}, where ftotsubscript𝑓totf_{\rm tot} is the total filling factor. With this volume given, the electron density can be derived from the normalization parameter Norm=1014/(4πd2)nenHVNormsuperscript10144𝜋superscript𝑑2subscript𝑛esubscript𝑛H𝑉{\rm Norm}=10^{-14}/(4\pi d^{2})n_{\rm e}n_{\rm H}V, where nHne/1.2subscript𝑛Hsubscript𝑛e1.2n_{\rm H}\approx n_{\rm e}/1.2 for a fully ionized plasma with near solar abundance. The ionization age t𝑡t can then be obtained from τ=net𝜏subscript𝑛e𝑡\tau=n_{\rm e}t. By further assuming that the two plasma components are in pressure balance (i.e., ne,LTkTe,LT=ne,HTkTe,HTsubscript𝑛eLT𝑘subscript𝑇eLTsubscript𝑛eHT𝑘subscript𝑇eHTn_{\rm e,LT}kT_{\rm e,LT}=n_{\rm e,HT}kT_{\rm e,HT}) and share the whole X-ray emitting volume (i.e. ftot=fLT+fHTsubscript𝑓totsubscript𝑓LTsubscript𝑓HTf_{\rm tot}=f_{\rm LT}+f_{\rm HT}), we were able to constrain these parameters separately for each component.

The geometry parameters R𝑅R and r𝑟r of the shocked ER in different epochs have been constrained by fitting a “torus ++ lobes” spatial model to the deconvolved Chandra images (e.g., Racusin et al., 2009; Frank et al., 2016). Here, we adopt a half-width r=0.22′′𝑟superscript0.22′′r=0.22^{\prime\prime} for all the observations according to Racusin et al. (2009), who found a nearly constant ring width after 6000similar-toabsent6000\sim 6000 days. On the other hand, the average radius R𝑅R is increasing due to the expansion of the blast wave. For each observation, we set R𝑅R to be the value obtained by Frank et al. (2016) using the Chandra data taken in a similar epoch (for the observations taken after 2015, R𝑅R were estimated by an extrapolation based on the expansion velocity). We adopt a distance to SNR 1987A of d=51.4𝑑51.4d=51.4 kpc based on Panagia (2005). We use the vpshock fitting results for calculations. As for ionization ages, we estimated both the average t𝑡t from the average τ𝜏\tau obtained in the vnei fit, and the upper limit tusubscript𝑡ut_{\rm u} from τusubscript𝜏u\tau_{\rm u} obtained in the vpshock fit. The derived electron densities, average/maximum ionization ages, and filling factors are listed in Table 6.

The electron densities of the two plasma components are derived to be ne,LT(1600n_{\rm e,LT}\sim(16002700)f0.5tot2700)f^{-0.5}_{\rm tot} cm-3 (with an average value 2180ftot0.5similar-toabsent2180subscriptsuperscript𝑓0.5tot\sim 2180f^{-0.5}_{\rm tot} cm-3) and ne,HT(360n_{\rm e,HT}\sim(360700)f0.5tot700)f^{-0.5}_{\rm tot} cm-3 (with an average value 550ftot0.5similar-toabsent550subscriptsuperscript𝑓0.5tot\sim 550f^{-0.5}_{\rm tot} cm-3). The unknown filling factor ftotsubscript𝑓totf_{\rm tot} led to some uncertainties in our results. Ideally, it should be around 1 if the total X-ray emitting volume is comparable to the shocked ER volume. However, it will be significantly lower than 1 if the X-ray emitting gas is clumpy and concentrates in a small part of the shocked ring. It could also go beyond 1 if the hot, lower-density, gas extends to a larger region outside the ring. We find that the derived gas densities appear to be increasing during the period, which may be indicative of a density gradient throughout the ring. But this is still debatable due to uncertainties in the time-variable filling factor and the assumed geometry. As mentioned above in Section 4.1, we got a density of ne,LT=2450±150subscript𝑛eLTplus-or-minus2450150n_{\rm e,LT}=2450\pm 150 cm-3 for the low-temperature plasma by fitting a linear function to τu,LTsubscript𝜏uLT\tau_{\rm u,LT}. As a comparison, Sturm et al. (2010) obtained the average densities as ne,LT=3240±640subscript𝑛eLTplus-or-minus3240640n_{\rm e,LT}=3240\pm 640 cm-3 and ne,HT=480±140subscript𝑛eHTplus-or-minus480140n_{\rm e,HT}=480\pm 140 cm-3 for the two components from a similar analysis of the 2003–2009 XMM-Newton observations. On the other hand, expansion-velocity studies suggest a shock velocity of 6800similar-toabsent6800\sim 6800 km s-1 before the impact, while it dropped to 1850similar-toabsent1850\sim 1850 km s-1 as viewed in 0.5–2 keV band and 3070similar-toabsent3070\sim 3070 km s-1 in 2–10 keV band after 6000 days (e.g., Frank et al., 2016). This requires that the density increased by a factor of 13similar-toabsent13\sim 13 and 5similar-toabsent5\sim 5 (given the relation between the shock velocity and the gas density as vsne0.5proportional-tosubscript𝑣ssuperscriptsubscript𝑛e0.5v_{\rm s}\propto n_{\rm e}^{0.5}). Given that the H II region has a density 102similar-toabsentsuperscript102\sim 10^{2} cm-3, this indicates an average density 103greater-than-or-equivalent-toabsentsuperscript103\gtrsim 10^{3} cm-3 for the soft band emitting gas and 500similar-toabsent500\sim 500 cm-3 for the hard band emitting gas. Taking all these results together, we suggest ne,LT2400similar-tosubscript𝑛eLT2400n_{\rm e,LT}\sim 2400 cm-3 and ne,HT550similar-tosubscript𝑛eHT550n_{\rm e,HT}\sim 550 cm-3 as reasonable estimations of the low- and high-temperature plasma densities.

The ionization age characterizes the elapsed time since the gas was shocked. The average ionization age t𝑡t and its upper limit tusubscript𝑡ut_{\rm u} were constrained based on the vnei and vpshock spectral fitting results, respectively. For the low-temperature plasma, we found tu,LTsubscript𝑡uLTt_{\rm u,LT} gradually increased from 2000ftot0.5similar-toabsent2000subscriptsuperscript𝑓0.5tot\sim 2000f^{0.5}_{\rm tot} days to 4800ftot0.5similar-toabsent4800subscriptsuperscript𝑓0.5tot\sim 4800f^{0.5}_{\rm tot} days during the period of 7300–10500 days after explosion, consistent with the physical picture that the ER started to be shocked by the blast wave at 6000similar-toabsent6000\sim 6000 days and dominated the soft band X-ray emission since then. Under the plane-parallel shock assumption, we would expect the average ionization age tLT=tu,LT/2(1000t_{\rm LT}=t_{\rm u,LT}/2\sim(10002400)f0.5tot2400)f^{0.5}_{\rm tot} days. However, it is found to be significantly lower, as indicated by the vnei fitting, with tLT(300t_{\rm LT}\sim(300500)f0.5tot500)f^{0.5}_{\rm tot} days, and does not show evidence for a similar increase as tu,LTsubscript𝑡uLTt_{\rm u,LT}. This may suggest that the low-temperature component has always been dominated by the “youngest” hot gas, which has just been shock heated within the most recent 1–2 yr. This very dynamic shock-heating process is also indicated by Chandra imaging observations. As shown by Frank et al. (2016, Figure 5 therein), the surface X-ray brightness distribution of the ER can significantly change within a few hundred days, which means the brightening and the fading of the gas take place on a rather short timescale. This short average ionization age may be related to the shock transmission timescale and/or the destruction timescale of the shocked high-density clumps. However, it should be remembered that the vnei model fitting optimizes for the line emission, and the line emissivity has a non-linear relation with the ionization state. As a result, the line emission is suppressed when the gas is close to equilibrium at these temperatures, so the vnei parameters can be skewed to lower τ𝜏\tau values. We have also considered whether the short timescale could reflect the radiative cooling timescale, which can be estimated as τcool5.7kT/(neΛ(T))subscript𝜏cool5.7𝑘𝑇subscript𝑛eΛ𝑇\tau_{\rm cool}\approx 5.7kT/(n_{\rm e}\Lambda(T)), where ΛΛ\Lambda is the volumetric cooling rate (e.g., Vink, 2020). For the low-temperature plasma, taking kTe,LT0.6similar-to𝑘subscript𝑇eLT0.6kT_{\rm e,LT}\sim 0.6 keV, ne,LT2400similar-tosubscript𝑛eLT2400n_{\rm e,LT}\sim 2400 cm-3 and Λ(T)1022similar-toΛ𝑇superscript1022\Lambda(T)\sim 10^{-22} erg s-1 cm-3 (e.g., Schure et al., 2009), we obtained a cooling timescale of τcool,LT720similar-tosubscript𝜏coolLT720\tau_{\rm cool,LT}\sim 720 yr, which makes radiation cooling unlikely to be the cause of the short average ionization age. The optical emission is likely to come from even denser clumps (104much-greater-thanabsentsuperscript104\gg 10^{4} cm-3), for which the post-shock temperature is in a regime for which τcoolsubscript𝜏cool\tau_{\rm cool} is an order of magnitude smaller, with time scales of months to years.

For the high-temperature plasma, we obtained tu,HT(2800t_{\rm u,HT}\sim(28004600)f0.5tot4600)f^{0.5}_{\rm tot} days (with an average value 3400ftot0.5similar-toabsent3400subscriptsuperscript𝑓0.5tot\sim 3400f^{0.5}_{\rm tot} days), which shows no significant variation during this period. The average ionization age is derived to be tHT(1000t_{\rm HT}\sim(10001500)f0.5tot1500)f^{0.5}_{\rm tot} days —with an average value 1300ftot0.5similar-toabsent1300subscriptsuperscript𝑓0.5tot\sim 1300f^{0.5}_{\rm tot} days— consistent with the expected value under the plane-parallel shock assumption.

The filling factors have also been constrained for the two plasma components, respectively. The ratio fLT/fHTsubscript𝑓LTsubscript𝑓HTf_{\rm LT}/f_{\rm HT}, which is no longer depending on the uncertain total filling factor ftotsubscript𝑓totf_{\rm tot}, is found to have been 0.2similar-toabsent0.2\sim 0.2 during 7300–9000 days, and it has been continuously decreasing since then. By the latest observation at 12000similar-toabsent12000\sim 12000 days, it has dropped to 0.04similar-toabsent0.04\sim 0.04.

With the derived electron densities and filling factors, we also estimated the gas masses for each of the components, as listed in Table 6.

4.3 Origin of the X-ray emitting plasma

Similar to many previous studies, our work reveals that the X-ray spectra of SNR 1987A can be approximately described by the thermal emission from a combination of two major plasma components, one with a low temperature 0.6similar-toabsent0.6\sim 0.6 keV, and the other one with a high temperature 2.5similar-toabsent2.5\sim 2.5 keV. However, the physical origins of these plasmas could be rather complicated due to the complex CSM structure and the shock system. The main structure of the shocked CSM includes the ER, an ionized H II region surrounding the ring, and the high-latitude material beyond the ring. The ER consists of several dense clumps (“fingers”) distributed mainly in its inner portion and the smooth inter-clump gas. It has been suggested that the low-temperature plasma (or the soft X-ray emission) comes from the slow transmitted shock into the dense clumps, while the high-temperature plasma (or the hard X-ray emission) mainly comes from the less-decelerated shocks (which may also include reflected shocks) moving through the lower density ring material. This physical picture was first indicated by the observations taken in the early stage of the shock-ring interaction (e.g., Park et al., 2006; Zhekov et al., 2010), and later supported by the 1D to 3D hydrodynamic simulations (e.g., Dewey et al., 2012; Orlando et al., 2015). However, our analysis is based on the more recent observations (after 7500similar-toabsent7500\sim 7500 days), thus represents the later stage evolution. Keeping this in mind, we revisit here the origin of the X-ray emitting plasma.

Based on the early optical analysis of the ionized gas in the ER, the dense clumps have a density similar-to\sim(1–3)×104absentsuperscript104\times 10^{4} cm-3, and the inter-clump gas has a density similar-to\sim(1–6)×103absentsuperscript103\times 10^{3} cm-3 (e.g., Lundqvist & Fransson, 1996; Mattila et al., 2010). Similar densities are also indicated by hydrodynamic simulations (e.g., Dewey et al., 2012; Orlando et al., 2015). We find that the low-temperature plasma has a density of ne,LT2400similar-tosubscript𝑛eLT2400n_{\rm e,LT}\sim 2400 cm-3, and thus it is more indicative of the lower density gas inside the ring. It may consist of both the shocked inter-clump gas and the evaporated clump material (or the fragments with lower density). On the other hand, the high-temperature plasma has a density of ne,HT550similar-tosubscript𝑛eHT550n_{\rm e,HT}\sim 550 cm-3, which is lower than the expected density of the ring material. However, taking into account a shock-compression ratio of 4similar-toabsent4\sim 4, it is consistent with the interpreted density of the H II region (102similar-toabsentsuperscript102\sim 10^{2} cm-3, e.g., Lundqvist & Fransson, 1996; Mattila et al., 2010; Orlando et al., 2015).

The shocked dense clumps, which have a typical density of 104greater-than-or-equivalent-toabsentsuperscript104\gtrsim 10^{4} cm-3, are expected to contribute a rather low temperature (0.1less-than-or-similar-toabsent0.1\lesssim 0.1 keV, given the density ratio between the dense clump and the inter-clump material) plasma component. However, we have not found solid evidence for such a component in our spectral analysis. We note that at the early stage of the shock-ring interaction, the soft (low-temperature) component was found to be close to collisional ionization equilibrium with a much lower electron temperature 0.22similar-toabsent0.22\sim 0.22 keV, the density of which was estimated as 7500similar-toabsent7500\sim 7500 cm-3 (Park et al., 2004). As the blast wave penetrated further into the ER, the temperature of this soft component gradually increased to 0.5greater-than-or-equivalent-toabsent0.5\gtrsim 0.5 keV (e.g., Park et al., 2006; Sturm et al., 2010). This indicates that the soft emission was dominated by the shocked dense clumps at the beginning, but was later overtaken by the lower density gas inside the ring. The dense clumps themselves could either have faded out due to evaporation/destruction, or they contribute little to the overall emission, which can hardly be detected.

The total mass of the ER was estimated to be 0.06similar-toabsent0.06\sim 0.06Msubscript𝑀direct-productM_{\odot} from optical observations and hydrodynamic simulations (e.g., Mattila et al., 2010; Orlando et al., 2015), and most of the mass is distributed in the lower density component (similar-to\sim60%–80%). Despite the large uncertainty of our mass estimate, it provides hints to the plasma origin. We found a peak mass value for the low-temperature plasma 0.08ftot0.5similar-toabsent0.08superscriptsubscript𝑓tot0.5\sim 0.08f_{\rm tot}^{0.5}Msubscript𝑀direct-productM_{\odot}, which is similar to the total mass of the ER. On the other hand, the mass of the high-temperature plasma has been continuously increasing, and was found to be 0.15ftot0.5greater-than-or-equivalent-toabsent0.15superscriptsubscript𝑓tot0.5\gtrsim 0.15f_{\rm tot}^{0.5}Msubscript𝑀direct-productM_{\odot} in latest observations, which exceeds the expected ER mass by a factor of 2. Thereby, the low-temperature plasma could be dominated by the shocked ring material, while the high-temperature plasma should also contain the material around/beyond the ring, which may extend to a larger radius and has been continuously shocked by the blast wave.

As described in Section 4.1, the metal abundances of N, O, Ne, and Mg have significantly declined in the recent few years, which may result from the different chemical compositions between two plasma components. In that case, it is more reasonable to interpret the two plasma components as representing the different parts of the CSM structure. The ER was found to have enhanced He and N abundances according to the optical observations (e.g., Lundqvist & Fransson, 1996; Mattila et al., 2010). As the enhancement in He and N implies a processing of hydrogen, it affects the abundances of alpha- and Fe-group elements with respects to hydrogen. The H II region, as indicated by the early X-ray observations taken before the impact, has relatively lower abundances of N, O, Ne, and Mg (Park et al., 2002). In the hydrodynamics-based analysis of the X-ray spectra, Dewey et al. (2012) found different metal abundances in the ER and the H II region, where the ER had generally higher abundances for most of the species. Our results suggested that the low-temperature plasma dominated the soft band emission until 10500similar-toabsent10500\sim 10500 days, and resulted in enhanced average abundances of N, O, Ne, and Mg during this period. As the decline of the low-temperature emission measure, the average abundances of N, O, Ne, and Mg started to decrease in the last few years, which in turn indicated the lower metal abundances of the high-temperature plasma. Therefore, the low-temperature plasma could be more representative of the ER, while the high-temperature plasma could be more representative of the H II region and the high-latitude material with low metal abundances.

Given all the discussions above, our results indicate that the low-temperature plasma is dominated by the lower density gas inside the ER, which may include the smooth inter-clump gas and the evaporated/destructed clump material, while the high-temperature plasma is dominated by the H II region and the low density gas around/beyond the ring. The recent decrease in the low-temperature emission measure indicates that the blast wave has left the main ER, while it is still propagating into the high-latitude material, resulting in the continuously increasing high-temperature emission measure. Such a physical picture is also reflected by the drop of the filling factor ratio fLT/fHTsubscript𝑓LTsubscript𝑓HTf_{\rm LT}/f_{\rm HT}. However, the real CSM structure must be rather complicated, and the actual density and temperature distributions cannot be fully represented by a simple two-component model (below we discuss the need for at least one additional component to fit the Fe K line emission). Alternative approaches could be the differential emission measure analysis based on the high resolution spectra (e.g., Zhekov et al., 2006, 2009), and detailed full-scale HD/MHD simulations (e.g., Orlando et al., 2015, 2019, 2020).

4.4 Possible origins of the Fe K lines

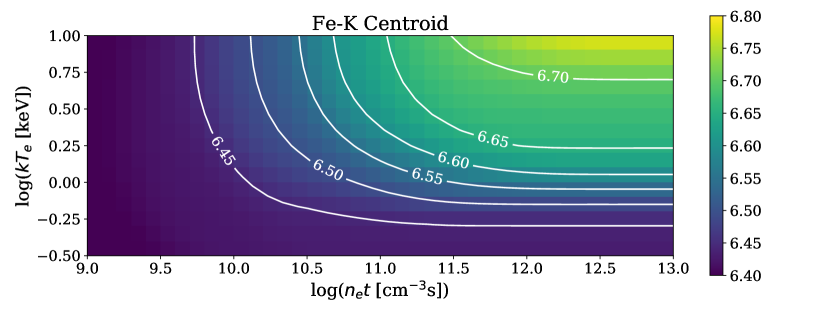
The EPIC-pn camera reveals Fe K features in SNR 1987A’s spectra, the origin of which remains unclear. Recent observations indicate a Fe K centroid energy 6.65greater-than-or-equivalent-toabsent6.65\gtrsim 6.65 keV. By comparing with the theoretically predicted line centroid shown in Figure 10 (based on SPEX code777https://www.sron.nl/astrophysics-spex, Kaastra et al., 1996), the high centroid energy requires either a high plasma temperature 2.0greater-than-or-equivalent-toabsent2.0\gtrsim 2.0 keV or a large ionization parameter 1011greater-than-or-equivalent-toabsentsuperscript1011\gtrsim 10^{11} cm-3 s. Since the Fe K line emission is not well reproduced with the standard two-temperature component scenario, we invoked a third, hot plasma component as the origin of the Fe K lines. Taking the 2015 observation as an example, we refit the RGS and pn spectra with a three-temperature vnei model. It provides an overall improved fit (χr21.19similar-tosuperscriptsubscript𝜒r21.19\chi_{\rm r}^{2}\sim 1.19, versus χr21.33similar-tosuperscriptsubscript𝜒r21.33\chi_{\rm r}^{2}\sim 1.33 for a two component fit, or Δχ2=320Δsuperscript𝜒2320\Delta\chi^{2}=320 for three additional degrees of freedom) to the data and reproduces Fe K lines successfully. The Fe K features are characterized by a high-temperature plasma component with kTe=2.90.1+0.2𝑘subscript𝑇esubscriptsuperscript2.90.20.1kT_{\rm e}=2.9^{+0.2}_{-0.1} keV and τ=(1.4±0.1)×1011𝜏plus-or-minus1.40.1superscript1011\tau=(1.4\pm 0.1)\times 10^{11} cm-3 s. The other two components have lower temperatures and similar ionization parameters: kTe=0.350.01+0.04𝑘subscript𝑇esubscriptsuperscript0.350.040.01kT_{\rm e}=0.35^{+0.04}_{-0.01} keV, τ=(3.2±0.1)×1011𝜏plus-or-minus3.20.1superscript1011\tau=(3.2\pm 0.1)\times 10^{11} cm-3 s for the low-temperature one, and kTe=0.870.02+0.03𝑘subscript𝑇esubscriptsuperscript0.870.030.02kT_{\rm e}=0.87^{+0.03}_{-0.02} keV, τ=1.90.2+0.3×10¹¹𝜏subscriptsuperscript1.90.30.2superscript1011\tau=1.9^{+0.3}_{-0.2}\times 10^{11} cm-3 s for the mid-temperature one. On the other hand, the temporal variation of the Fe K centroid energy provided further information about the plasma properties. Given a certain temperature and density of the plasma, the relation shown in Figure 10 results in a modeled curve of Fe K centroid as a function of time, which can be compared with observations. As shown in Figure 7, the observed Fe K centroid energies basically match with the predicted evolution of a plasma with kTe3.2similar-to𝑘subscript𝑇e3.2kT_{\rm e}\sim 3.2 keV and ne500similar-tosubscript𝑛e500n_{\rm e}\sim 500 cm-3, shocked at 7000 days after the explosion. This Fe-K emitting component may thereby also come from the low density gas around/beyond the ER, albeit with an even higher temperature. It may be related to the reflected shock which further compresses and heats the already shocked gas (e.g., Zhekov et al., 2009, 2010). It is also possible that the Fe K emission comes from one or several reverse shocked Fe-rich ejecta clumps, as the reverse shock with high ejecta-frame velocity could result in high post-shock temperature. Although most of the Fe-rich ejecta may concentrate in the inner part of the ejecta material, there could still be some high-speed debris which has already been approached by the reverse shock. We note that the gamma-ray data taken a few months after the SN explosion provided surprising evidence for fast core-ejecta material mixing into the outer envelopes (see Leising & Share, 1990, and references therein).

5 Conclusion

Since entering the remnant phase, SNR 1987A has been dynamically evolving on timescales of months to years. In this work, we utilized the XMM-Newton observations of SNR 1987A from 2007 to 2019 to investigate its post-impact evolution. The high energy resolution of RGS helped us identify and measure individual emission lines, as well as the EPIC-pn camera provided us with an overall energy coverage from 0.3 to 10 keV and thus a better constraint of the hard band emission. We performed detailed modeling to the spectra, constrained the electron temperatures, the ionization parameters, and the emission measures of the plasma, and tracked their recent evolution. We summarize the main results and conclusions below.

  1. 1.

    The post-impact X-ray emission of SNR 1987A can be approximately described with a model containing two NEI plasma components with different electron temperatures (kTe,LT0.6similar-to𝑘subscript𝑇eLT0.6kT_{\rm e,LT}\sim 0.6 keV and kTe,HT2.5similar-to𝑘subscript𝑇eHT2.5kT_{\rm e,HT}\sim 2.5 keV). The plasma temperatures showed no significant variations during the last decade.

  2. 2.

    The emission measure of the low-temperature plasma started to decrease since around 10500 days after the explosion, resulting in the recent decline of the soft band (0.5–2.0 keV) flux. On the other hand, the high-temperature emission measure, as well as the hard band (3.0–8.0 keV) flux, kept increasing with a steady rate.

  3. 3.

    The average abundances of N, O, Ne, and Mg have decreased in the last few years, which could result from the different chemical compositions between two plasma components.

  4. 4.

    The densities of the X-ray emitting gases were estimated as ne,LT2400similar-tosubscript𝑛eLT2400n_{\rm e,LT}\sim 2400 cm-3 and ne,HT550similar-tosubscript𝑛eHT550n_{\rm e,HT}\sim 550 cm-3 for the low-temperature and the high-temperature components, respectively.

  5. 5.

    The low-temperature plasma is indicated to be dominated by the lower density gas inside the ER, which may include the inter-clump gas and the evaporated/destructed clump material. The high-temperature plasma could be dominated by the H II region and the low density gas around/beyond the ring. The blast wave has now left the main ER, but is still propagating into the high-latitude material.

  6. 6.

    Fe K line emission has been detected in most of the observations. Its centroid energy has been increasing during the last decade, with a latest value of 6.65greater-than-or-equivalent-toabsent6.65\gtrsim 6.65 keV. The Fe K lines may originate from a third, high-temperature component, which could be the reflected shock heated CSM, or be related to the reverse shocked Fe-rich ejecta.

SNR 1987A has now entered a new evolutionary stage, in which the blast wave is starting to shock the high-latitude material beyond the ER. On the other hand, as the reverse shock penetrating deeper into the inner ejecta, the shocked ejecta will start to contribute to the X-ray emission as well. Further observations of the remnant in the next few years will be crucial to monitor these new changes and unveil the underlying physics.

note added in proof

During the refereeing process of the present paper, two new analyses regarding the X-ray emission from SN 1987A were presented (Greco et al., 2021; Alp et al., 2021), incorporating NuSTAR hard X-ray spectra. Both papers agree that there is a need for a third hard X-ray component, but the Alp et al. (2021) paper (based on XMM-Newton RGS + NuSTAR data) attributes this third component to thermal emission, and the Greco et al. (2021) paper (based on Chandra + NuSTAR data) attributes it to non-thermal emission from a heavily absorbed emerging pulsar wind nebula. The results presented by us are indicative of a third, high-temperature thermal component, and thus qualitatively agree with Alp et al. (2021). However, they found a temperature as high as 4similar-toabsent4\sim 4 keV is needed in order to fit the NuSTAR data, which is significantly higher than what we got in Section 4.4. In fact, the temperature and ionization parameter we got for the third component are closer to those obtained by Greco et al. (2021) (see also the analysis by Tsuji et al., 2021) for their high-temperature thermal component. We note that our decision to include a third thermal component was based exclusively on the soft X-ray data (below 10 keV), specifically the detection of Fe K emission, which could not be reproduced by the conventional two-component model. On the other hand, our analysis, based solely on XMM-Newton observations, cannot rule-out, or confirm the presence of a highly absorbed non-thermal component. We verified that adding an absorbed power-law component as described in Greco et al. (2021) does not affect much the soft X-ray spectrum (producing no significant X-ray emission below 7 keV), and thus makes no significant improvement to the fit. It remains then to be investigated, whether a fourth component representing the non-thermal emission, is still required if we would augment our analysis by incorporating hard X-ray data. But it is beyond the scope of this paper to make strong conclusions regarding this point.

This work is partly supported by National Key R&D Program of China No. 2017YFA0402600 and the NSFC under grants 11773014, 11633007, and 11851305. This project has also received funding from the European Union’s Horizon 2020 research and innovation programme under grant agreement No 101004131. L. S. acknowledges the financial support of the China Scholar Council (No. 201906190108). (Arnaud, 1996), SPEX (Kaastra et al., 1996), SAS (Gabriel et al., 2004), DS9888http://ds9.si.edu/site/Home.html (Joye & Mandel, 2003)

References

  • Akaike (1974) Akaike, H. 1974, IEEE Transactions on Automatic Control, 19, 716
  • Alp et al. (2021) Alp, D., Larsson, J., & Fransson, C. 2021, arXiv:2103.02612
  • Arendt et al. (2016) Arendt, R. G., Dwek, E., Bouchet, P., et al. 2016, AJ, 151, 62
  • Arnaud (1996) Arnaud, K. A. 1996, in ASP Conf. Ser. 101, Astronomical Data Analysis Software and Systems V, ed. G. H. Jacoby & J. Barnes (San Francisco, CA: ASP), 17
  • Borkowski et al. (2001) Borkowski, K. J., Lyerly, W. J., & Reynolds, S. P. 2001, ApJ, 548, 820
  • Bray et al. (2020) Bray, E., Burrows, D. N., Park, S., et al. 2020, ApJ, 899, 21
  • Burrows et al. (2000) Burrows, D. N., Michael, E., Hwang, U., et al. 2000, ApJ, 543, L149
  • Cargill & Papadopoulos (1988) Cargill, P. J. & Papadopoulos, K. 1988, ApJ, 329, L29
  • Chita et al. (2008) Chita, S. M., Langer, N., van Marle, A. J., et al. 2008, A&A, 488, L37
  • Dewey et al. (2012) Dewey, D., Dwarkadas, V. V., Haberl, F., et al. 2012, ApJ, 752, 103
  • Frank et al. (2016) Frank, K. A., Zhekov, S. A., Park, S., et al. 2016, ApJ, 829, 40
  • Fransson et al. (2015) Fransson, C., Larsson, J., Migotto, K., et al. 2015, ApJ, 806, L19
  • Gabriel et al. (2004) Gabriel, C., Denby, M., Fyfe, D. J., et al. 2004, Astronomical Data Analysis Software and Systems (ADASS) XIII, 314, 759
  • Ghavamian et al. (2007) Ghavamian, P., Laming, J. M., & Rakowski, C. E. 2007, ApJ, 654, L69
  • Greco et al. (2021) Greco, E., Miceli, M., Orlando, S., et al. 2021, arXiv:2101.09029
  • Gröningsson et al. (2008) Gröningsson, P., Fransson, C., Leibundgut, B., et al. 2008, A&A, 492, 481
  • Hasinger et al. (1996) Hasinger, G., Aschenbach, B., & Truemper, J. 1996, A&A, 312, L9
  • Helder et al. (2013) Helder, E. A., Broos, P. S., Dewey, D., et al. 2013, ApJ, 764, 11
  • Joye & Mandel (2003) Joye, W. A. & Mandel, E. 2003, Astronomical Data Analysis Software and Systems XII, 295, 489
  • Kaastra et al. (1996) Kaastra, J. S., Mewe, R., & Nieuwenhuijzen, H. 1996, in 11th Coll. on UV and X-ray Spectroscopy of Astrophysical and Laboratory Plasmas, ed. K. Yamashita & T. Watanabe (Tokyo: Universal Academy Press), 411
  • Larsson et al. (2019) Larsson, J., Fransson, C., Alp, D., et al. 2019, ApJ, 886, 147
  • Lawrence et al. (2000) Lawrence, S. S., Sugerman, B. E., Bouchet, P., et al. 2000, ApJ, 537, L123
  • Leising & Share (1990) Leising, M. D. & Share, G. H. 1990, ApJ, 357, 638.
  • Lundqvist & Fransson (1996) Lundqvist, P. & Fransson, C. 1996, ApJ, 464, 924
  • Maggi et al. (2012) Maggi, P., Haberl, F., Sturm, R., et al. 2012, A&A, 548, L3
  • Maggi et al. (2016) Maggi, P., Haberl, F., Kavanagh, P. J., et al. 2016, A&A, 585, A162
  • Malyshev et al. (2019) Malyshev, D., Pühlhofer, G., Santangelo, A., et al. 2019, arXiv:1903.03045
  • Mattila et al. (2010) Mattila, S., Lundqvist, P., Gröningsson, P., et al. 2010, ApJ, 717, 1140
  • McCray & Fransson (2016) McCray, R. & Fransson, C. 2016, ARA&A, 54, 19
  • Miceli et al. (2019) Miceli, M., Orlando, S., Burrows, D. N., et al. 2019, Nature Astronomy, 3, 236
  • Morris & Podsiadlowski (2007) Morris, T. & Podsiadlowski, P. 2007, Science, 315, 1103
  • Orlando et al. (2015) Orlando, S., Miceli, M., Pumo, M. L., et al. 2015, ApJ, 810, 168
  • Orlando et al. (2019) Orlando, S., Miceli, M., Petruk, O., et al. 2019, A&A, 622, A73
  • Orlando et al. (2020) Orlando, S., Ono, M., Nagataki, S., et al. 2020, A&A, 636, A22
  • Panagia (2005) Panagia, N. 2005, IAU Colloq. 192: Cosmic Explosions, on the 10th Anniversary of SN1993J, 585
  • Park et al. (2002) Park, S., Burrows, D. N., Garmire, G. P., et al. 2002, ApJ, 567, 314
  • Park et al. (2004) Park, S., Zhekov, S. A., Burrows, D. N., et al. 2004, ApJ, 610, 275
  • Park et al. (2005) Park, S., Zhekov, S. A., Burrows, D. N., et al. 2005, ApJ, 634, L73
  • Park et al. (2006) Park, S., Zhekov, S. A., Burrows, D. N., et al. 2006, ApJ, 646, 1001
  • Podsiadlowski et al. (1992) Podsiadlowski, P., Joss, P. C., & Hsu, J. J. L. 1992, ApJ, 391, 246
  • Racusin et al. (2009) Racusin, J. L., Park, S., Zhekov, S., et al. 2009, ApJ, 703, 1752
  • Russell & Dopita (1992) Russell, S. C., & Dopita, M. A. 1992, ApJ, 384, 508
  • Schure et al. (2009) Schure, K. M., Kosenko, D., Kaastra, J. S., et al. 2009, A&A, 508, 751
  • Shimada & Hoshino (2000) Shimada, N. & Hoshino, M. 2000, ApJ, 543, L67
  • Sonneborn et al. (1998) Sonneborn, G., Pun, C. S. J., Kimble, R. A., et al. 1998, ApJ, 492, L139
  • Sturm et al. (2010) Sturm, R., Haberl, F., Aschenbach, B., et al. 2010, A&A, 515, A5
  • Tsuji et al. (2021) Tsuji, N., Uchiyama, Y., Khangulyan, D., et al. 2021, ApJ, 907, 117
  • Vink et al. (2003) Vink, J., Laming, J. M., Gu, M. F., et al. 2003, ApJ, 587, L31
  • Vink (2020) Vink, J. 2020, Physics and Evolution of Supernova Remnants (Springer International Publishing AG)
  • Wilms et al. (2000) Wilms, J., Allen, A., & McCray, R. 2000, ApJ, 542, 914
  • Zhekov et al. (2005) Zhekov, S. A., McCray, R., Borkowski, K. J., et al. 2005, ApJ, 628, L127
  • Zhekov et al. (2006) Zhekov, S. A., McCray, R., Borkowski, K. J., et al. 2006, ApJ, 645, 293
  • Zhekov et al. (2009) Zhekov, S. A., McCray, R., Dewey, D., et al. 2009, ApJ, 692, 1190
  • Zhekov et al. (2010) Zhekov, S. A., Park, S., McCray, R., et al. 2010, MNRAS, 407, 1157
Table 1: Observations
texpsubscript𝑡expt_{\rm exp} (ks)aaTotal exposure times. \sumGTI (ks)bbTotal good time intervals after background flare removal.
ObsID Date Age (days) EPIC-pn RGS EPIC-pn RGS
0406840301 2007 Jan 17 7267 106.9 111.3 61.1 109.8
0506220101 2008 Jan 11 7627 110.1 114.3 70.7 102.4
0556350101 2009 Jan 30 8012 100.0 101.9 66.4 101.8
0601200101 2009 Dec 11 8327 89.9 91.8 82.4 91.7
0650420101 2010 Dec 12 8693 64.0 65.9 52.7 65.9
0671080101 2011 Dec 2 9048 80.6 82.5 64.2 80.6
0690510101 2012 Dec 11 9423 68.0 69.9 59.4 69.8
0743790101 2014 Nov 29 10141 78.0 79.6 56.4 79.4
0763620101 2015 Nov 15 10492 64.0 65.9 58.0 65.8
0783250201 2016 Nov 2 10845 72.4 74.3 50.3 74.2
0804980201 2017 Oct 15 11192 77.5 79.4 27.8 79.3
0831810101 2019 Nov. 27 11964 32.4 34.9 11.1 34.8
Table 2: Identified lines in RGS spectra
Line Centroid (keV) Flux (10-5 photons cm-2 s-1)
2007 Jan. 2008 Jan. 2009 Jan. 2009 Dec. 2010 Dec. 2011 Dec. 2012 Dec. 2014 Nov. 2015 Nov. 2016 Nov. 2017 Oct. 2019 Nov.
N Heα𝛼\alpha r 0.43070.43070.4307 22.343.53+3.65subscriptsuperscript22.343.653.5322.34^{+3.65}_{-3.53} 29.793.98+5.28subscriptsuperscript29.795.283.9829.79^{+5.28}_{-3.98} 17.634.44+3.26subscriptsuperscript17.633.264.4417.63^{+3.26}_{-4.44} 16.032.24+3.04subscriptsuperscript16.033.042.2416.03^{+3.04}_{-2.24} 21.097.37+6.59subscriptsuperscript21.096.597.3721.09^{+6.59}_{-7.37} 22.979.41+4.67subscriptsuperscript22.974.679.4122.97^{+4.67}_{-9.41} 13.619.93+3.21subscriptsuperscript13.613.219.9313.61^{+3.21}_{-9.93} 13.674.91+4.53subscriptsuperscript13.674.534.9113.67^{+4.53}_{-4.91} 5.193.20+2.85subscriptsuperscript5.192.853.205.19^{+2.85}_{-3.20} 8.775.06+5.27subscriptsuperscript8.775.275.068.77^{+5.27}_{-5.06} 15.218.01+6.93subscriptsuperscript15.216.938.0115.21^{+6.93}_{-8.01} 7.290.19+0.86subscriptsuperscript7.290.860.197.29^{+0.86}_{-0.19}
N Lyα𝛼\alpha 0.50020.50020.5002 51.912.24+2.42subscriptsuperscript51.912.422.2451.91^{+2.42}_{-2.24} 57.092.30+2.22subscriptsuperscript57.092.222.3057.09^{+2.22}_{-2.30} 60.211.94+2.15subscriptsuperscript60.212.151.9460.21^{+2.15}_{-1.94} 61.412.27+3.07subscriptsuperscript61.413.072.2761.41^{+3.07}_{-2.27} 59.431.20+1.38subscriptsuperscript59.431.381.2059.43^{+1.38}_{-1.20} 61.614.09+1.68subscriptsuperscript61.611.684.0961.61^{+1.68}_{-4.09} 51.572.89+2.00subscriptsuperscript51.572.002.8951.57^{+2.00}_{-2.89} 48.672.10+1.54subscriptsuperscript48.671.542.1048.67^{+1.54}_{-2.10} 41.393.50+1.47subscriptsuperscript41.391.473.5041.39^{+1.47}_{-3.50} 38.801.76+2.27subscriptsuperscript38.802.271.7638.80^{+2.27}_{-1.76} 29.832.23+2.66subscriptsuperscript29.832.662.2329.83^{+2.66}_{-2.23} 39.451.03+1.33subscriptsuperscript39.451.331.0339.45^{+1.33}_{-1.03}
O Heα𝛼\alpha f 0.56110.56110.5611 12.642.18+1.51subscriptsuperscript12.641.512.1812.64^{+1.51}_{-2.18} 15.062.89+2.35subscriptsuperscript15.062.352.8915.06^{+2.35}_{-2.89} 18.071.41+1.08subscriptsuperscript18.071.081.4118.07^{+1.08}_{-1.41} 13.651.73+2.08subscriptsuperscript13.652.081.7313.65^{+2.08}_{-1.73} 16.690.99+3.02subscriptsuperscript16.693.020.9916.69^{+3.02}_{-0.99} 14.082.92+2.31subscriptsuperscript14.082.312.9214.08^{+2.31}_{-2.92} 14.001.22+2.79subscriptsuperscript14.002.791.2214.00^{+2.79}_{-1.22} 7.611.81+2.02subscriptsuperscript7.612.021.817.61^{+2.02}_{-1.81} 1.751.31+2.70subscriptsuperscript1.752.701.311.75^{+2.70}_{-1.31} 5.691.32+1.83subscriptsuperscript5.691.831.325.69^{+1.83}_{-1.32} 7.572.56+2.50subscriptsuperscript7.572.502.567.57^{+2.50}_{-2.56} <0.22absent0.22<0.22
O Heα𝛼\alpha i 0.56860.56860.5686 1.260.93+3.05subscriptsuperscript1.263.050.931.26^{+3.05}_{-0.93} 4.281.68+2.45subscriptsuperscript4.282.451.684.28^{+2.45}_{-1.68} 5.812.89+1.94subscriptsuperscript5.811.942.895.81^{+1.94}_{-2.89} 3.660.59+1.14subscriptsuperscript3.661.140.593.66^{+1.14}_{-0.59} 0.320.24+2.69subscriptsuperscript0.322.690.240.32^{+2.69}_{-0.24} 4.232.62+1.15subscriptsuperscript4.231.152.624.23^{+1.15}_{-2.62} <3.28absent3.28<3.28 6.951.55+2.48subscriptsuperscript6.952.481.556.95^{+2.48}_{-1.55} 5.601.90+2.85subscriptsuperscript5.602.851.905.60^{+2.85}_{-1.90} 1.421.07+1.50subscriptsuperscript1.421.501.071.42^{+1.50}_{-1.07} 3.412.16+1.60subscriptsuperscript3.411.602.163.41^{+1.60}_{-2.16} 5.190.76+1.66subscriptsuperscript5.191.660.765.19^{+1.66}_{-0.76}
O Heα𝛼\alpha r 0.57400.57400.5740 14.911.89+1.87subscriptsuperscript14.911.871.8914.91^{+1.87}_{-1.89} 18.033.19+3.41subscriptsuperscript18.033.413.1918.03^{+3.41}_{-3.19} 14.321.72+2.69subscriptsuperscript14.322.691.7214.32^{+2.69}_{-1.72} 14.092.13+1.36subscriptsuperscript14.091.362.1314.09^{+1.36}_{-2.13} 14.263.18+2.30subscriptsuperscript14.262.303.1814.26^{+2.30}_{-3.18} 12.321.47+4.16subscriptsuperscript12.324.161.4712.32^{+4.16}_{-1.47} 11.091.86+3.00subscriptsuperscript11.093.001.8611.09^{+3.00}_{-1.86} 13.883.37+2.86subscriptsuperscript13.882.863.3713.88^{+2.86}_{-3.37} 8.871.05+1.73subscriptsuperscript8.871.731.058.87^{+1.73}_{-1.05} 10.662.39+2.15subscriptsuperscript10.662.152.3910.66^{+2.15}_{-2.39} 7.931.32+2.16subscriptsuperscript7.932.161.327.93^{+2.16}_{-1.32} 4.730.44+0.42subscriptsuperscript4.730.420.444.73^{+0.42}_{-0.44}
O Lyα𝛼\alpha 0.65370.65370.6537 34.470.80+1.03subscriptsuperscript34.471.030.8034.47^{+1.03}_{-0.80} 43.242.47+2.20subscriptsuperscript43.242.202.4743.24^{+2.20}_{-2.47} 45.631.85+0.81subscriptsuperscript45.630.811.8545.63^{+0.81}_{-1.85} 49.011.37+2.90subscriptsuperscript49.012.901.3749.01^{+2.90}_{-1.37} 52.221.48+0.50subscriptsuperscript52.220.501.4852.22^{+0.50}_{-1.48} 51.072.27+1.37subscriptsuperscript51.071.372.2751.07^{+1.37}_{-2.27} 48.570.41+1.15subscriptsuperscript48.571.150.4148.57^{+1.15}_{-0.41} 37.281.02+0.78subscriptsuperscript37.280.781.0237.28^{+0.78}_{-1.02} 35.751.18+1.35subscriptsuperscript35.751.351.1835.75^{+1.35}_{-1.18} 37.221.47+0.92subscriptsuperscript37.220.921.4737.22^{+0.92}_{-1.47} 28.931.39+1.47subscriptsuperscript28.931.471.3928.93^{+1.47}_{-1.39} 25.870.24+0.30subscriptsuperscript25.870.300.2425.87^{+0.30}_{-0.24}
O Heβ𝛽\beta 0.66560.66560.6656 3.100.86+0.58subscriptsuperscript3.100.580.863.10^{+0.58}_{-0.86} 2.130.35+0.61subscriptsuperscript2.130.610.352.13^{+0.61}_{-0.35} 3.510.90+0.63subscriptsuperscript3.510.630.903.51^{+0.63}_{-0.90} 2.350.92+0.80subscriptsuperscript2.350.800.922.35^{+0.80}_{-0.92} 0.150.13+0.88subscriptsuperscript0.150.880.130.15^{+0.88}_{-0.13} 3.931.13+1.10subscriptsuperscript3.931.101.133.93^{+1.10}_{-1.13} 1.660.72+0.33subscriptsuperscript1.660.330.721.66^{+0.33}_{-0.72} 3.150.73+0.71subscriptsuperscript3.150.710.733.15^{+0.71}_{-0.73} 3.631.00+1.17subscriptsuperscript3.631.171.003.63^{+1.17}_{-1.00} 3.550.82+1.21subscriptsuperscript3.551.210.823.55^{+1.21}_{-0.82} 2.660.65+0.52subscriptsuperscript2.660.520.652.66^{+0.52}_{-0.65} 3.240.22+0.01subscriptsuperscript3.240.010.223.24^{+0.01}_{-0.22}
Fe XVII 0.72520.72520.7252 4.691.16+0.84subscriptsuperscript4.690.841.164.69^{+0.84}_{-1.16} 8.731.50+1.61subscriptsuperscript8.731.611.508.73^{+1.61}_{-1.50} 8.761.58+2.07subscriptsuperscript8.762.071.588.76^{+2.07}_{-1.58} 11.191.31+0.99subscriptsuperscript11.190.991.3111.19^{+0.99}_{-1.31} 13.371.76+0.89subscriptsuperscript13.370.891.7613.37^{+0.89}_{-1.76} 13.211.50+2.05subscriptsuperscript13.212.051.5013.21^{+2.05}_{-1.50} 13.151.64+1.02subscriptsuperscript13.151.021.6413.15^{+1.02}_{-1.64} 7.581.71+1.00subscriptsuperscript7.581.001.717.58^{+1.00}_{-1.71} 9.542.10+1.50subscriptsuperscript9.541.502.109.54^{+1.50}_{-2.10} 4.051.66+1.80subscriptsuperscript4.051.801.664.05^{+1.80}_{-1.66} 9.581.52+1.37subscriptsuperscript9.581.371.529.58^{+1.37}_{-1.52} 5.890.11+0.28subscriptsuperscript5.890.280.115.89^{+0.28}_{-0.11}
Fe XVII 0.72710.72710.7271 12.800.92+0.81subscriptsuperscript12.800.810.9212.80^{+0.81}_{-0.92} 17.121.36+1.06subscriptsuperscript17.121.061.3617.12^{+1.06}_{-1.36} 20.031.82+2.48subscriptsuperscript20.032.481.8220.03^{+2.48}_{-1.82} 20.531.76+0.65subscriptsuperscript20.530.651.7620.53^{+0.65}_{-1.76} 21.432.12+2.19subscriptsuperscript21.432.192.1221.43^{+2.19}_{-2.12} 21.871.61+1.72subscriptsuperscript21.871.721.6121.87^{+1.72}_{-1.61} 25.812.25+1.70subscriptsuperscript25.811.702.2525.81^{+1.70}_{-2.25} 22.071.37+1.55subscriptsuperscript22.071.551.3722.07^{+1.55}_{-1.37} 19.06±2.09plus-or-minus19.062.0919.06\pm 2.09 19.161.97+1.75subscriptsuperscript19.161.751.9719.16^{+1.75}_{-1.97} 13.401.36+1.86subscriptsuperscript13.401.861.3613.40^{+1.86}_{-1.36} 11.082.11+2.85subscriptsuperscript11.082.852.1111.08^{+2.85}_{-2.11}
Fe XVII 0.73890.73890.7389 7.310.83+0.64subscriptsuperscript7.310.640.837.31^{+0.64}_{-0.83} 7.810.70+0.55subscriptsuperscript7.810.550.707.81^{+0.55}_{-0.70} 10.651.20+0.45subscriptsuperscript10.650.451.2010.65^{+0.45}_{-1.20} 10.760.50+0.88subscriptsuperscript10.760.880.5010.76^{+0.88}_{-0.50} 14.091.07+1.03subscriptsuperscript14.091.031.0714.09^{+1.03}_{-1.07} 13.510.72+1.13subscriptsuperscript13.511.130.7213.51^{+1.13}_{-0.72} 11.490.56+1.15subscriptsuperscript11.491.150.5611.49^{+1.15}_{-0.56} 10.321.04+0.80subscriptsuperscript10.320.801.0410.32^{+0.80}_{-1.04} 11.300.56+0.33subscriptsuperscript11.300.330.5611.30^{+0.33}_{-0.56} 10.811.13+0.89subscriptsuperscript10.810.891.1310.81^{+0.89}_{-1.13} 10.250.95+0.56subscriptsuperscript10.250.560.9510.25^{+0.56}_{-0.95} 5.371.30+0.97subscriptsuperscript5.370.971.305.37^{+0.97}_{-1.30}
Fe XVIII 0.77150.77150.7715 2.750.82+0.49subscriptsuperscript2.750.490.822.75^{+0.49}_{-0.82} 5.080.44+0.55subscriptsuperscript5.080.550.445.08^{+0.55}_{-0.44} 4.76±0.49plus-or-minus4.760.494.76\pm 0.49 5.631.31+0.91subscriptsuperscript5.630.911.315.63^{+0.91}_{-1.31} 8.731.26+0.60subscriptsuperscript8.730.601.268.73^{+0.60}_{-1.26} 7.080.92+0.38subscriptsuperscript7.080.380.927.08^{+0.38}_{-0.92} 5.900.71+0.48subscriptsuperscript5.900.480.715.90^{+0.48}_{-0.71} 9.491.19+0.72subscriptsuperscript9.490.721.199.49^{+0.72}_{-1.19} 8.430.71+0.61subscriptsuperscript8.430.610.718.43^{+0.61}_{-0.71} 6.720.75+0.74subscriptsuperscript6.720.740.756.72^{+0.74}_{-0.75} 7.840.67+0.87subscriptsuperscript7.840.870.677.84^{+0.87}_{-0.67} 4.120.16+0.09subscriptsuperscript4.120.090.164.12^{+0.09}_{-0.16}
O Lyβ𝛽\beta 0.77460.77460.7746aaCould also be Fe XVIII line at 0.7747 keV 6.880.42+0.68subscriptsuperscript6.880.680.426.88^{+0.68}_{-0.42} 7.760.43+0.37subscriptsuperscript7.760.370.437.76^{+0.37}_{-0.43} 10.070.56+0.63subscriptsuperscript10.070.630.5610.07^{+0.63}_{-0.56} 10.201.07+0.42subscriptsuperscript10.200.421.0710.20^{+0.42}_{-1.07} 11.490.76+1.28subscriptsuperscript11.491.280.7611.49^{+1.28}_{-0.76} 12.370.57+0.78subscriptsuperscript12.370.780.5712.37^{+0.78}_{-0.57} 12.090.69+0.58subscriptsuperscript12.090.580.6912.09^{+0.58}_{-0.69} 9.310.83+0.92subscriptsuperscript9.310.920.839.31^{+0.92}_{-0.83} 7.141.07+0.78subscriptsuperscript7.140.781.077.14^{+0.78}_{-1.07} 8.030.66+1.14subscriptsuperscript8.031.140.668.03^{+1.14}_{-0.66} 7.840.78+0.52subscriptsuperscript7.840.520.787.84^{+0.52}_{-0.78} 7.050.94+0.73subscriptsuperscript7.050.730.947.05^{+0.73}_{-0.94}
Fe XVII 0.81240.81240.8124 5.900.55+0.74subscriptsuperscript5.900.740.555.90^{+0.74}_{-0.55} 9.100.55+0.54subscriptsuperscript9.100.540.559.10^{+0.54}_{-0.55} 8.560.78+0.83subscriptsuperscript8.560.830.788.56^{+0.83}_{-0.78} 10.950.39+1.13subscriptsuperscript10.951.130.3910.95^{+1.13}_{-0.39} 11.561.03+0.24subscriptsuperscript11.560.241.0311.56^{+0.24}_{-1.03} 13.491.02+1.29subscriptsuperscript13.491.291.0213.49^{+1.29}_{-1.02} 10.800.82+0.71subscriptsuperscript10.800.710.8210.80^{+0.71}_{-0.82} 9.300.87+0.37subscriptsuperscript9.300.370.879.30^{+0.37}_{-0.87} 8.440.97+1.11subscriptsuperscript8.441.110.978.44^{+1.11}_{-0.97} 10.190.98+0.88subscriptsuperscript10.190.880.9810.19^{+0.88}_{-0.98} 6.580.62+0.59subscriptsuperscript6.580.590.626.58^{+0.59}_{-0.62} 7.280.03+0.20subscriptsuperscript7.280.200.037.28^{+0.20}_{-0.03}
O Lyγ𝛾\gamma 0.81700.81700.8170 2.080.75+0.38subscriptsuperscript2.080.380.752.08^{+0.38}_{-0.75} 3.440.49+0.45subscriptsuperscript3.440.450.493.44^{+0.45}_{-0.49} 4.190.42+0.48subscriptsuperscript4.190.480.424.19^{+0.48}_{-0.42} 5.921.29+0.16subscriptsuperscript5.920.161.295.92^{+0.16}_{-1.29} 5.421.13+1.10subscriptsuperscript5.421.101.135.42^{+1.10}_{-1.13} 5.371.11+0.43subscriptsuperscript5.370.431.115.37^{+0.43}_{-1.11} 5.301.06+0.45subscriptsuperscript5.300.451.065.30^{+0.45}_{-1.06} 4.700.50+0.79subscriptsuperscript4.700.790.504.70^{+0.79}_{-0.50} 4.460.59+0.48subscriptsuperscript4.460.480.594.46^{+0.48}_{-0.59} 2.991.16+0.91subscriptsuperscript2.990.911.162.99^{+0.91}_{-1.16} 4.250.87+1.16subscriptsuperscript4.251.160.874.25^{+1.16}_{-0.87} 1.140.15+0.14subscriptsuperscript1.140.140.151.14^{+0.14}_{-0.15}
Fe XVII 0.82580.82580.8258 15.050.61+0.38subscriptsuperscript15.050.380.6115.05^{+0.38}_{-0.61} 17.860.53+0.48subscriptsuperscript17.860.480.5317.86^{+0.48}_{-0.53} 22.980.61+0.86subscriptsuperscript22.980.860.6122.98^{+0.86}_{-0.61} 26.150.82+0.58subscriptsuperscript26.150.580.8226.15^{+0.58}_{-0.82} 30.000.60+0.83subscriptsuperscript30.000.830.6030.00^{+0.83}_{-0.60} 30.010.95+0.61subscriptsuperscript30.010.610.9530.01^{+0.61}_{-0.95} 29.760.66+1.30subscriptsuperscript29.761.300.6629.76^{+1.30}_{-0.66} 25.820.90+0.62subscriptsuperscript25.820.620.9025.82^{+0.62}_{-0.90} 26.420.64+0.51subscriptsuperscript26.420.510.6426.42^{+0.51}_{-0.64} 23.950.80+1.42subscriptsuperscript23.951.420.8023.95^{+1.42}_{-0.80} 20.901.07+1.18subscriptsuperscript20.901.181.0720.90^{+1.18}_{-1.07} 17.790.29+0.21subscriptsuperscript17.790.210.2917.79^{+0.21}_{-0.29}
Fe XVIII 0.85310.85310.8531 2.120.44+0.46subscriptsuperscript2.120.460.442.12^{+0.46}_{-0.44} 3.470.40+0.27subscriptsuperscript3.470.270.403.47^{+0.27}_{-0.40} 3.660.43+0.38subscriptsuperscript3.660.380.433.66^{+0.38}_{-0.43} 3.430.61+0.36subscriptsuperscript3.430.360.613.43^{+0.36}_{-0.61} 4.650.67+0.68subscriptsuperscript4.650.680.674.65^{+0.68}_{-0.67} 4.690.56+0.65subscriptsuperscript4.690.650.564.69^{+0.65}_{-0.56} 4.620.44+0.64subscriptsuperscript4.620.640.444.62^{+0.64}_{-0.44} 4.860.46+0.44subscriptsuperscript4.860.440.464.86^{+0.44}_{-0.46} 5.600.44+0.85subscriptsuperscript5.600.850.445.60^{+0.85}_{-0.44} 6.600.69+0.86subscriptsuperscript6.600.860.696.60^{+0.86}_{-0.69} 3.520.54+0.64subscriptsuperscript3.520.640.543.52^{+0.64}_{-0.54} 3.190.07+0.15subscriptsuperscript3.190.150.073.19^{+0.15}_{-0.07}
Fe XVIII 0.86260.86260.8626 1.930.27+0.42subscriptsuperscript1.930.420.271.93^{+0.42}_{-0.27} 3.440.47+0.63subscriptsuperscript3.440.630.473.44^{+0.63}_{-0.47} 3.140.29+0.30subscriptsuperscript3.140.300.293.14^{+0.30}_{-0.29} 5.360.51+0.30subscriptsuperscript5.360.300.515.36^{+0.30}_{-0.51} 5.870.74+0.72subscriptsuperscript5.870.720.745.87^{+0.72}_{-0.74} 5.620.43+1.10subscriptsuperscript5.621.100.435.62^{+1.10}_{-0.43} 6.470.75+0.52subscriptsuperscript6.470.520.756.47^{+0.52}_{-0.75} 5.860.71+0.70subscriptsuperscript5.860.700.715.86^{+0.70}_{-0.71} 4.960.45+0.75subscriptsuperscript4.960.750.454.96^{+0.75}_{-0.45} 6.010.77+0.74subscriptsuperscript6.010.740.776.01^{+0.74}_{-0.77} 3.850.60+0.80subscriptsuperscript3.850.800.603.85^{+0.80}_{-0.60} 3.940.11+0.13subscriptsuperscript3.940.130.113.94^{+0.13}_{-0.11}
Fe XVIII 0.87260.87260.8726 4.560.36+0.35subscriptsuperscript4.560.350.364.56^{+0.35}_{-0.36} 6.060.78+0.57subscriptsuperscript6.060.570.786.06^{+0.57}_{-0.78} 8.270.59+0.20subscriptsuperscript8.270.200.598.27^{+0.20}_{-0.59} 9.540.15+0.37subscriptsuperscript9.540.370.159.54^{+0.37}_{-0.15} 11.720.41+0.50subscriptsuperscript11.720.500.4111.72^{+0.50}_{-0.41} 13.890.72+1.08subscriptsuperscript13.891.080.7213.89^{+1.08}_{-0.72} 12.970.81+0.71subscriptsuperscript12.970.710.8112.97^{+0.71}_{-0.81} 13.120.98+0.65subscriptsuperscript13.120.650.9813.12^{+0.65}_{-0.98} 11.920.85+0.63subscriptsuperscript11.920.630.8511.92^{+0.63}_{-0.85} 9.650.69+0.54subscriptsuperscript9.650.540.699.65^{+0.54}_{-0.69} 10.110.49+0.58subscriptsuperscript10.110.580.4910.11^{+0.58}_{-0.49} 8.140.08+0.10subscriptsuperscript8.140.100.088.14^{+0.10}_{-0.08}
Fe XVII 0.89680.89680.8968 1.950.60+0.22subscriptsuperscript1.950.220.601.95^{+0.22}_{-0.60} 2.180.44+0.30subscriptsuperscript2.180.300.442.18^{+0.30}_{-0.44} 2.380.17+0.28subscriptsuperscript2.380.280.172.38^{+0.28}_{-0.17} 3.960.28+0.21subscriptsuperscript3.960.210.283.96^{+0.21}_{-0.28} 4.120.39+0.88subscriptsuperscript4.120.880.394.12^{+0.88}_{-0.39} 5.800.52+0.93subscriptsuperscript5.800.930.525.80^{+0.93}_{-0.52} 4.440.25+0.66subscriptsuperscript4.440.660.254.44^{+0.66}_{-0.25} 5.170.54+0.64subscriptsuperscript5.170.640.545.17^{+0.64}_{-0.54} 4.900.71+0.72subscriptsuperscript4.900.720.714.90^{+0.72}_{-0.71} 4.970.65+0.96subscriptsuperscript4.970.960.654.97^{+0.96}_{-0.65} 5.620.43+0.31subscriptsuperscript5.620.310.435.62^{+0.31}_{-0.43} 3.790.24+0.44subscriptsuperscript3.790.440.243.79^{+0.44}_{-0.24}
Ne Heα𝛼\alpha f 0.90510.90510.9051 7.050.24+0.58subscriptsuperscript7.050.580.247.05^{+0.58}_{-0.24} 9.860.35+0.51subscriptsuperscript9.860.510.359.86^{+0.51}_{-0.35} 9.360.93+0.60subscriptsuperscript9.360.600.939.36^{+0.60}_{-0.93} 10.921.03+0.41subscriptsuperscript10.920.411.0310.92^{+0.41}_{-1.03} 13.631.02+0.91subscriptsuperscript13.630.911.0213.63^{+0.91}_{-1.02} 12.500.82+0.85subscriptsuperscript12.500.850.8212.50^{+0.85}_{-0.82} 13.491.10+0.79subscriptsuperscript13.490.791.1013.49^{+0.79}_{-1.10} 12.310.67+0.98subscriptsuperscript12.310.980.6712.31^{+0.98}_{-0.67} 10.271.43+0.96subscriptsuperscript10.270.961.4310.27^{+0.96}_{-1.43} 9.160.71+0.85subscriptsuperscript9.160.850.719.16^{+0.85}_{-0.71} 7.560.87+1.35subscriptsuperscript7.561.350.877.56^{+1.35}_{-0.87} 7.990.98+1.02subscriptsuperscript7.991.020.987.99^{+1.02}_{-0.98}
Fe XIX 0.91720.91720.9172bbCould also be Fe XXI line at 0.9179 keV 5.150.49+0.70subscriptsuperscript5.150.700.495.15^{+0.70}_{-0.49} 5.610.60+1.03subscriptsuperscript5.611.030.605.61^{+1.03}_{-0.60} 9.220.63+0.82subscriptsuperscript9.220.820.639.22^{+0.82}_{-0.63} 7.420.99+1.06subscriptsuperscript7.421.060.997.42^{+1.06}_{-0.99} 8.280.22+0.92subscriptsuperscript8.280.920.228.28^{+0.92}_{-0.22} 9.660.45+1.02subscriptsuperscript9.661.020.459.66^{+1.02}_{-0.45} 11.090.76+0.34subscriptsuperscript11.090.340.7611.09^{+0.34}_{-0.76} 10.650.69+0.86subscriptsuperscript10.650.860.6910.65^{+0.86}_{-0.69} 11.260.88+0.83subscriptsuperscript11.260.830.8811.26^{+0.83}_{-0.88} 10.520.78+0.86subscriptsuperscript10.520.860.7810.52^{+0.86}_{-0.78} 8.441.19+0.78subscriptsuperscript8.440.781.198.44^{+0.78}_{-1.19} 7.200.35+0.27subscriptsuperscript7.200.270.357.20^{+0.27}_{-0.35}
Ne Heα𝛼\alpha r 0.92200.92200.9220 12.450.75+0.86subscriptsuperscript12.450.860.7512.45^{+0.86}_{-0.75} 13.991.24+0.81subscriptsuperscript13.990.811.2413.99^{+0.81}_{-1.24} 15.041.11+0.53subscriptsuperscript15.040.531.1115.04^{+0.53}_{-1.11} 16.590.47+0.62subscriptsuperscript16.590.620.4716.59^{+0.62}_{-0.47} 19.941.71+1.09subscriptsuperscript19.941.091.7119.94^{+1.09}_{-1.71} 19.701.56+0.46subscriptsuperscript19.700.461.5619.70^{+0.46}_{-1.56} 19.050.82+0.97subscriptsuperscript19.050.970.8219.05^{+0.97}_{-0.82} 18.951.20+1.00subscriptsuperscript18.951.001.2018.95^{+1.00}_{-1.20} 13.520.72+0.84subscriptsuperscript13.520.840.7213.52^{+0.84}_{-0.72} 14.851.09+1.10subscriptsuperscript14.851.101.0914.85^{+1.10}_{-1.09} 14.301.02+1.34subscriptsuperscript14.301.341.0214.30^{+1.34}_{-1.02} 13.873.02+2.34subscriptsuperscript13.872.343.0213.87^{+2.34}_{-3.02}
Fe XX 0.96520.96520.9652 1.810.50+0.36subscriptsuperscript1.810.360.501.81^{+0.36}_{-0.50} 3.390.34+0.45subscriptsuperscript3.390.450.343.39^{+0.45}_{-0.34} 3.480.43+0.16subscriptsuperscript3.480.160.433.48^{+0.16}_{-0.43} 5.480.61+0.50subscriptsuperscript5.480.500.615.48^{+0.50}_{-0.61} 6.190.72+0.64subscriptsuperscript6.190.640.726.19^{+0.64}_{-0.72} 7.610.78+0.58subscriptsuperscript7.610.580.787.61^{+0.58}_{-0.78} 8.590.87+0.74subscriptsuperscript8.590.740.878.59^{+0.74}_{-0.87} 7.850.69+0.71subscriptsuperscript7.850.710.697.85^{+0.71}_{-0.69} 9.490.60+0.77subscriptsuperscript9.490.770.609.49^{+0.77}_{-0.60} 9.120.43+0.47subscriptsuperscript9.120.470.439.12^{+0.47}_{-0.43} 8.010.55+0.78subscriptsuperscript8.010.780.558.01^{+0.78}_{-0.55} 7.370.89+0.58subscriptsuperscript7.370.580.897.37^{+0.58}_{-0.89}
Fe XXI 1.00041.00041.0004 1.17±0.30plus-or-minus1.170.301.17\pm 0.30 1.790.49+0.42subscriptsuperscript1.790.420.491.79^{+0.42}_{-0.49} 0.920.15+0.30subscriptsuperscript0.920.300.150.92^{+0.30}_{-0.15} 1.490.57+0.44subscriptsuperscript1.490.440.571.49^{+0.44}_{-0.57} 3.480.38+0.66subscriptsuperscript3.480.660.383.48^{+0.66}_{-0.38} 2.750.56+0.70subscriptsuperscript2.750.700.562.75^{+0.70}_{-0.56} 2.611.35+0.15subscriptsuperscript2.610.151.352.61^{+0.15}_{-1.35} 3.620.44+0.62subscriptsuperscript3.620.620.443.62^{+0.62}_{-0.44} 3.540.80+0.59subscriptsuperscript3.540.590.803.54^{+0.59}_{-0.80} 3.100.38+0.60subscriptsuperscript3.100.600.383.10^{+0.60}_{-0.38} 4.140.82+0.70subscriptsuperscript4.140.700.824.14^{+0.70}_{-0.82} 2.780.44+0.45subscriptsuperscript2.780.450.442.78^{+0.45}_{-0.44}
Fe XXI 1.00931.00931.0093ccCould also be Fe XVII line at 1.0108 keV 2.350.47+0.40subscriptsuperscript2.350.400.472.35^{+0.40}_{-0.47} 2.680.36+0.31subscriptsuperscript2.680.310.362.68^{+0.31}_{-0.36} 3.550.30+0.38subscriptsuperscript3.550.380.303.55^{+0.38}_{-0.30} 5.480.58+0.70subscriptsuperscript5.480.700.585.48^{+0.70}_{-0.58} 4.661.17+0.55subscriptsuperscript4.660.551.174.66^{+0.55}_{-1.17} 7.351.18+0.36subscriptsuperscript7.350.361.187.35^{+0.36}_{-1.18} 7.440.30+0.44subscriptsuperscript7.440.440.307.44^{+0.44}_{-0.30} 8.400.67+0.55subscriptsuperscript8.400.550.678.40^{+0.55}_{-0.67} 7.630.67+0.99subscriptsuperscript7.630.990.677.63^{+0.99}_{-0.67} 5.510.72+0.65subscriptsuperscript5.510.650.725.51^{+0.65}_{-0.72} 5.801.03+0.89subscriptsuperscript5.800.891.035.80^{+0.89}_{-1.03} 7.220.21+0.39subscriptsuperscript7.220.390.217.22^{+0.39}_{-0.21}
Ne Lyα𝛼\alpha 1.02201.02201.0220 12.180.51+0.24subscriptsuperscript12.180.240.5112.18^{+0.24}_{-0.51} 15.700.94+0.84subscriptsuperscript15.700.840.9415.70^{+0.84}_{-0.94} 19.750.33+0.31subscriptsuperscript19.750.310.3319.75^{+0.31}_{-0.33} 22.030.31+0.77subscriptsuperscript22.030.770.3122.03^{+0.77}_{-0.31} 26.470.74+0.20subscriptsuperscript26.470.200.7426.47^{+0.20}_{-0.74} 26.460.52+1.26subscriptsuperscript26.461.260.5226.46^{+1.26}_{-0.52} 26.690.27+1.34subscriptsuperscript26.691.340.2726.69^{+1.34}_{-0.27} 26.241.37+1.25subscriptsuperscript26.241.251.3726.24^{+1.25}_{-1.37} 24.400.95+1.43subscriptsuperscript24.401.430.9524.40^{+1.43}_{-0.95} 23.450.74+0.52subscriptsuperscript23.450.520.7423.45^{+0.52}_{-0.74} 22.961.19+1.34subscriptsuperscript22.961.341.1922.96^{+1.34}_{-1.19} 17.751.20+0.87subscriptsuperscript17.750.871.2017.75^{+0.87}_{-1.20}
Ne Heβ𝛽\beta 1.07401.07401.0740 2.610.34+0.30subscriptsuperscript2.610.300.342.61^{+0.30}_{-0.34} 2.750.20+0.32subscriptsuperscript2.750.320.202.75^{+0.32}_{-0.20} 2.990.21+0.46subscriptsuperscript2.990.460.212.99^{+0.46}_{-0.21} 2.950.43+0.58subscriptsuperscript2.950.580.432.95^{+0.58}_{-0.43} 3.650.57+0.43subscriptsuperscript3.650.430.573.65^{+0.43}_{-0.57} 4.740.12+0.58subscriptsuperscript4.740.580.124.74^{+0.58}_{-0.12} 5.170.07+0.77subscriptsuperscript5.170.770.075.17^{+0.77}_{-0.07} 4.940.33+0.51subscriptsuperscript4.940.510.334.94^{+0.51}_{-0.33} 5.930.35+0.82subscriptsuperscript5.930.820.355.93^{+0.82}_{-0.35} 4.580.41+0.97subscriptsuperscript4.580.970.414.58^{+0.97}_{-0.41} 3.600.70+0.59subscriptsuperscript3.600.590.703.60^{+0.59}_{-0.70} 4.620.15+0.23subscriptsuperscript4.620.230.154.62^{+0.23}_{-0.15}
Fe XXII 1.05341.05341.0534ddCould also be Fe XXIII line at 1.0565 keV 0.590.19+0.32subscriptsuperscript0.590.320.190.59^{+0.32}_{-0.19} 1.600.31+0.37subscriptsuperscript1.600.370.311.60^{+0.37}_{-0.31} 1.910.36+0.53subscriptsuperscript1.910.530.361.91^{+0.53}_{-0.36} 3.260.51+0.46subscriptsuperscript3.260.460.513.26^{+0.46}_{-0.51} 3.260.37+0.26subscriptsuperscript3.260.260.373.26^{+0.26}_{-0.37} 4.570.57+0.33subscriptsuperscript4.570.330.574.57^{+0.33}_{-0.57} 5.531.10+0.05subscriptsuperscript5.530.051.105.53^{+0.05}_{-1.10} 7.160.67+0.65subscriptsuperscript7.160.650.677.16^{+0.65}_{-0.67} 5.130.48+0.71subscriptsuperscript5.130.710.485.13^{+0.71}_{-0.48} 6.120.72+0.44subscriptsuperscript6.120.440.726.12^{+0.44}_{-0.72} 7.080.58+0.84subscriptsuperscript7.080.840.587.08^{+0.84}_{-0.58} 7.230.76+0.72subscriptsuperscript7.230.720.767.23^{+0.72}_{-0.76}
Fe XXIII 1.12911.12911.1291eeCould also be Ne Heγ𝛾\gamma line at 1.1270 keV 1.39±0.18plus-or-minus1.390.181.39\pm 0.18 1.750.31+0.26subscriptsuperscript1.750.260.311.75^{+0.26}_{-0.31} 1.890.28+0.40subscriptsuperscript1.890.400.281.89^{+0.40}_{-0.28} 1.850.44+0.23subscriptsuperscript1.850.230.441.85^{+0.23}_{-0.44} 2.830.54+0.34subscriptsuperscript2.830.340.542.83^{+0.34}_{-0.54} 2.820.67+0.28subscriptsuperscript2.820.280.672.82^{+0.28}_{-0.67} 4.180.69+0.12subscriptsuperscript4.180.120.694.18^{+0.12}_{-0.69} 4.110.47+0.46subscriptsuperscript4.110.460.474.11^{+0.46}_{-0.47} 5.440.37+0.67subscriptsuperscript5.440.670.375.44^{+0.67}_{-0.37} 3.660.46+0.58subscriptsuperscript3.660.580.463.66^{+0.58}_{-0.46} 3.370.55+0.62subscriptsuperscript3.370.620.553.37^{+0.62}_{-0.55} 3.820.49+0.27subscriptsuperscript3.820.270.493.82^{+0.27}_{-0.49}
Ne Lyβ𝛽\beta 1.21101.21101.2110 1.480.30+0.23subscriptsuperscript1.480.230.301.48^{+0.23}_{-0.30} 1.880.19+0.22subscriptsuperscript1.880.220.191.88^{+0.22}_{-0.19} 2.160.32+0.37subscriptsuperscript2.160.370.322.16^{+0.37}_{-0.32} 2.510.35+0.18subscriptsuperscript2.510.180.352.51^{+0.18}_{-0.35} 3.070.52+0.37subscriptsuperscript3.070.370.523.07^{+0.37}_{-0.52} 3.180.25+0.48subscriptsuperscript3.180.480.253.18^{+0.48}_{-0.25} 3.070.37+0.61subscriptsuperscript3.070.610.373.07^{+0.61}_{-0.37} 2.880.39+0.43subscriptsuperscript2.880.430.392.88^{+0.43}_{-0.39} 2.620.24+0.43subscriptsuperscript2.620.430.242.62^{+0.43}_{-0.24} 2.940.55+0.39subscriptsuperscript2.940.390.552.94^{+0.39}_{-0.55} 2.340.35+0.41subscriptsuperscript2.340.410.352.34^{+0.41}_{-0.35} 1.330.11+0.08subscriptsuperscript1.330.080.111.33^{+0.08}_{-0.11}
Mg Heα𝛼\alpha f 1.33111.33111.3311 1.920.21+0.17subscriptsuperscript1.920.170.211.92^{+0.17}_{-0.21} 2.070.37+0.38subscriptsuperscript2.070.380.372.07^{+0.38}_{-0.37} 3.090.28+0.25subscriptsuperscript3.090.250.283.09^{+0.25}_{-0.28} 3.230.34+0.46subscriptsuperscript3.230.460.343.23^{+0.46}_{-0.34} 3.980.14+0.17subscriptsuperscript3.980.170.143.98^{+0.17}_{-0.14} 3.540.52+0.65subscriptsuperscript3.540.650.523.54^{+0.65}_{-0.52} 3.610.19+0.23subscriptsuperscript3.610.230.193.61^{+0.23}_{-0.19} 2.020.25+0.40subscriptsuperscript2.020.400.252.02^{+0.40}_{-0.25} 2.870.55+0.58subscriptsuperscript2.870.580.552.87^{+0.58}_{-0.55} 3.190.48+0.33subscriptsuperscript3.190.330.483.19^{+0.33}_{-0.48} 2.680.47+0.54subscriptsuperscript2.680.540.472.68^{+0.54}_{-0.47} 2.650.59+0.44subscriptsuperscript2.650.440.592.65^{+0.44}_{-0.59}
Mg Heα𝛼\alpha r 1.35231.35231.3523 3.020.29+0.31subscriptsuperscript3.020.310.293.02^{+0.31}_{-0.29} 3.750.46+0.54subscriptsuperscript3.750.540.463.75^{+0.54}_{-0.46} 4.800.21+0.12subscriptsuperscript4.800.120.214.80^{+0.12}_{-0.21} 5.240.34+0.28subscriptsuperscript5.240.280.345.24^{+0.28}_{-0.34} 4.840.38+0.32subscriptsuperscript4.840.320.384.84^{+0.32}_{-0.38} 7.070.28+0.52subscriptsuperscript7.070.520.287.07^{+0.52}_{-0.28} 6.480.49+0.37subscriptsuperscript6.480.370.496.48^{+0.37}_{-0.49} 6.540.67+0.63subscriptsuperscript6.540.630.676.54^{+0.63}_{-0.67} 5.580.44+0.65subscriptsuperscript5.580.650.445.58^{+0.65}_{-0.44} 5.340.42+0.41subscriptsuperscript5.340.410.425.34^{+0.41}_{-0.42} 4.730.33+0.42subscriptsuperscript4.730.420.334.73^{+0.42}_{-0.33} 3.361.10+1.44subscriptsuperscript3.361.441.103.36^{+1.44}_{-1.10}
Mg Lyα𝛼\alpha 1.47261.47261.4726 1.300.31+0.23subscriptsuperscript1.300.230.311.30^{+0.23}_{-0.31} 1.980.27+0.29subscriptsuperscript1.980.290.271.98^{+0.29}_{-0.27} 2.590.26+0.14subscriptsuperscript2.590.140.262.59^{+0.14}_{-0.26} 2.870.17+0.22subscriptsuperscript2.870.220.172.87^{+0.22}_{-0.17} 2.690.36+0.40subscriptsuperscript2.690.400.362.69^{+0.40}_{-0.36} 3.320.23+0.50subscriptsuperscript3.320.500.233.32^{+0.50}_{-0.23} 3.800.22+0.33subscriptsuperscript3.800.330.223.80^{+0.33}_{-0.22} 4.090.39+0.44subscriptsuperscript4.090.440.394.09^{+0.44}_{-0.39} 4.360.63+0.46subscriptsuperscript4.360.460.634.36^{+0.46}_{-0.63} 3.590.49+0.51subscriptsuperscript3.590.510.493.59^{+0.51}_{-0.49} 4.030.32+0.34subscriptsuperscript4.030.340.324.03^{+0.34}_{-0.32} 3.460.14+0.13subscriptsuperscript3.460.130.143.46^{+0.13}_{-0.14}
Si Heα𝛼\alpha f 1.83951.83951.8395 1.140.53+0.31subscriptsuperscript1.140.310.531.14^{+0.31}_{-0.53} 0.790.40+0.48subscriptsuperscript0.790.480.400.79^{+0.48}_{-0.40} 0.510.21+0.55subscriptsuperscript0.510.550.210.51^{+0.55}_{-0.21} 1.680.41+0.44subscriptsuperscript1.680.440.411.68^{+0.44}_{-0.41} 1.540.38+0.55subscriptsuperscript1.540.550.381.54^{+0.55}_{-0.38} 2.180.97+0.66subscriptsuperscript2.180.660.972.18^{+0.66}_{-0.97} 1.910.48+0.36subscriptsuperscript1.910.360.481.91^{+0.36}_{-0.48} 0.310.24+0.57subscriptsuperscript0.310.570.240.31^{+0.57}_{-0.24} 2.541.10+0.69subscriptsuperscript2.540.691.102.54^{+0.69}_{-1.10} 1.621.07+0.80subscriptsuperscript1.620.801.071.62^{+0.80}_{-1.07} 1.110.61+0.73subscriptsuperscript1.110.730.611.11^{+0.73}_{-0.61} <0.06absent0.06<0.06
Si Heα𝛼\alpha r 1.86501.86501.8650 2.550.45+0.49subscriptsuperscript2.550.490.452.55^{+0.49}_{-0.45} 3.270.53+0.44subscriptsuperscript3.270.440.533.27^{+0.44}_{-0.53} 4.390.84+0.50subscriptsuperscript4.390.500.844.39^{+0.50}_{-0.84} 4.930.82+0.52subscriptsuperscript4.930.520.824.93^{+0.52}_{-0.82} 5.821.11+0.45subscriptsuperscript5.820.451.115.82^{+0.45}_{-1.11} 4.980.84+0.96subscriptsuperscript4.980.960.844.98^{+0.96}_{-0.84} 6.190.70+0.97subscriptsuperscript6.190.970.706.19^{+0.97}_{-0.70} 6.970.56+0.48subscriptsuperscript6.970.480.566.97^{+0.48}_{-0.56} 4.240.96+1.41subscriptsuperscript4.241.410.964.24^{+1.41}_{-0.96} 5.001.31+1.05subscriptsuperscript5.001.051.315.00^{+1.05}_{-1.31} 5.810.69+0.46subscriptsuperscript5.810.460.695.81^{+0.46}_{-0.69} 6.190.49+0.26subscriptsuperscript6.190.260.496.19^{+0.26}_{-0.49}
Si Lyα𝛼\alpha 2.00612.00612.0061 1.610.73+0.74subscriptsuperscript1.610.740.731.61^{+0.74}_{-0.73} 1.060.72+0.55subscriptsuperscript1.060.550.721.06^{+0.55}_{-0.72} 0.110.09+1.15subscriptsuperscript0.111.150.090.11^{+1.15}_{0.09} <1.05absent1.05<1.05 1.720.95+0.82subscriptsuperscript1.720.820.951.72^{+0.82}_{-0.95} 2.160.96+0.93subscriptsuperscript2.160.930.962.16^{+0.93}_{-0.96} 0.040.02+0.65subscriptsuperscript0.040.650.020.04^{+0.65}_{-0.02} 1.931.01+1.28subscriptsuperscript1.931.281.011.93^{+1.28}_{-1.01} 3.420.81+1.30subscriptsuperscript3.421.300.813.42^{+1.30}_{-0.81} 3.660.66+1.01subscriptsuperscript3.661.010.663.66^{+1.01}_{-0.66} 1.981.32+1.45subscriptsuperscript1.981.451.321.98^{+1.45}_{-1.32} 3.560.41+0.70subscriptsuperscript3.560.700.413.56^{+0.70}_{-0.41}
v87Asubscript𝑣87Av_{\rm 87A} (km s-1) 24613+10subscriptsuperscript2461013246^{+10}_{-13} 2839+6subscriptsuperscript28369283^{+6}_{-9} 2267+20subscriptsuperscript226207226^{+20}_{-7} 2009+8subscriptsuperscript20089200^{+8}_{-9} 2307+21subscriptsuperscript230217230^{+21}_{-7} 22019+7subscriptsuperscript220719220^{+7}_{-19} 2549+13subscriptsuperscript254139254^{+13}_{-9} 2838+13subscriptsuperscript283138283^{+13}_{-8} 36018+14subscriptsuperscript3601418360^{+14}_{-18} 25531+28subscriptsuperscript2552831255^{+28}_{-31} 13420+27subscriptsuperscript1342720134^{+27}_{-20} 5914+12subscriptsuperscript59121459^{+12}_{-14}
σ6subscript𝜎6\sigma_{6} (eV) 9226+53subscriptsuperscript92532692^{+53}_{-26} 6625+35subscriptsuperscript66352566^{+35}_{-25} 10725+68subscriptsuperscript1076825107^{+68}_{-25} 4316+22subscriptsuperscript43221643^{+22}_{-16} 84±19plus-or-minus841984\pm 19 13431+58subscriptsuperscript1345831134^{+58}_{-31} 9516+23subscriptsuperscript95231695^{+23}_{-16} 15534+77subscriptsuperscript1557734155^{+77}_{-34} 13734+67subscriptsuperscript1376734137^{+67}_{-34} 10129+36subscriptsuperscript1013629101^{+36}_{-29} 8519+22subscriptsuperscript85221985^{+22}_{-19} 5±1plus-or-minus515\pm 1
α𝛼\alpha 2.250.14+0.27subscriptsuperscript2.250.270.142.25^{+0.27}_{-0.14} 2.090.20+0.27subscriptsuperscript2.090.270.202.09^{+0.27}_{-0.20} 2.370.13+0.33subscriptsuperscript2.370.330.132.37^{+0.33}_{-0.13} 1.900.22+0.24subscriptsuperscript1.900.240.221.90^{+0.24}_{-0.22} 2.15±0.12plus-or-minus2.150.122.15\pm 0.12 2.010.12+0.22subscriptsuperscript2.010.220.122.01^{+0.22}_{-0.12} 2.220.07+0.16subscriptsuperscript2.220.160.072.22^{+0.16}_{-0.07} 2.470.11+0.24subscriptsuperscript2.470.240.112.47^{+0.24}_{-0.11} 2.010.13+0.23subscriptsuperscript2.010.230.132.01^{+0.23}_{-0.13} 2.040.15+0.17subscriptsuperscript2.040.170.152.04^{+0.17}_{-0.15} 2.030.13+0.12subscriptsuperscript2.030.120.132.03^{+0.12}_{-0.13} 0.480.01+0.04subscriptsuperscript0.480.040.010.48^{+0.04}_{-0.01}

Note. — Errors are for 1-σ𝜎\sigma confidence range.

Table 3: Spectral Fitting Results of the Two-temperature vnei Model
2007 Jan. 2008 Jan. 2009 Jan. 2009 Dec. 2010 Dec. 2011 Dec. 2012 Dec. 2014 Nov. 2015 Nov. 2016 Nov. 2017 Oct. 2019 Nov.
Low-Temperature Plasma
kTLT𝑘subscript𝑇LTkT_{\rm LT} (keV) 0.56±0.01plus-or-minus0.560.010.56\pm 0.01 0.590.01+0.02subscriptsuperscript0.590.020.010.59^{+0.02}_{-0.01} 0.55±0.01plus-or-minus0.550.010.55\pm 0.01 0.57±0.01plus-or-minus0.570.010.57\pm 0.01 0.60±0.01plus-or-minus0.600.010.60\pm 0.01 0.61±0.01plus-or-minus0.610.010.61\pm 0.01 0.62±0.01plus-or-minus0.620.010.62\pm 0.01 0.67±0.01plus-or-minus0.670.010.67\pm 0.01 0.650.01+0.02subscriptsuperscript0.650.020.010.65^{+0.02}_{-0.01} 0.69±0.01plus-or-minus0.690.010.69\pm 0.01 0.660.01+0.02subscriptsuperscript0.660.020.010.66^{+0.02}_{-0.01} 0.71±0.03plus-or-minus0.710.030.71\pm 0.03
τLTsubscript𝜏LT\tau_{\rm LT} (1010superscript101010^{10} cm-3 s) 3.930.09+0.14subscriptsuperscript3.930.140.093.93^{+0.14}_{-0.09} 3.980.04+0.05subscriptsuperscript3.980.050.043.98^{+0.05}_{-0.04} 8.510.17+0.23subscriptsuperscript8.510.230.178.51^{+0.23}_{-0.17} 6.750.18+0.20subscriptsuperscript6.750.200.186.75^{+0.20}_{-0.18} 8.180.17+0.27subscriptsuperscript8.180.270.178.18^{+0.27}_{-0.17} 7.960.18+0.32subscriptsuperscript7.960.320.187.96^{+0.32}_{-0.18} 6.980.11+0.12subscriptsuperscript6.980.120.116.98^{+0.12}_{-0.11} 8.180.23+0.25subscriptsuperscript8.180.250.238.18^{+0.25}_{-0.23} 8.030.39+0.71subscriptsuperscript8.030.710.398.03^{+0.71}_{-0.39} 7.740.27+0.30subscriptsuperscript7.740.300.277.74^{+0.30}_{-0.27} 7.310.13+0.16subscriptsuperscript7.310.160.137.31^{+0.16}_{-0.13} 4.730.18+0.28subscriptsuperscript4.730.280.184.73^{+0.28}_{-0.18}
NormLT (103superscript10310^{-3} cm-5) 3.480.14+0.23subscriptsuperscript3.480.230.143.48^{+0.23}_{-0.14} 4.140.16+0.10subscriptsuperscript4.140.100.164.14^{+0.10}_{-0.16} 6.960.21+0.29subscriptsuperscript6.960.290.216.96^{+0.29}_{-0.21} 6.66±0.27plus-or-minus6.660.276.66\pm 0.27 7.200.30+0.19subscriptsuperscript7.200.190.307.20^{+0.19}_{-0.30} 7.100.25+0.18subscriptsuperscript7.100.180.257.10^{+0.18}_{-0.25} 6.980.19+0.20subscriptsuperscript6.980.200.196.98^{+0.20}_{-0.19} 6.810.22+0.19subscriptsuperscript6.810.190.226.81^{+0.19}_{-0.22} 6.570.26+0.31subscriptsuperscript6.570.310.266.57^{+0.31}_{-0.26} 6.030.24+0.21subscriptsuperscript6.030.210.246.03^{+0.21}_{-0.24} 5.720.25+0.19subscriptsuperscript5.720.190.255.72^{+0.19}_{-0.25} 4.050.22+0.26subscriptsuperscript4.050.260.224.05^{+0.26}_{-0.22}
High-Temperature Plasma
kTHT𝑘subscript𝑇HTkT_{\rm HT} (keV) 2.270.12+0.14subscriptsuperscript2.270.140.122.27^{+0.14}_{-0.12} 2.280.09+0.11subscriptsuperscript2.280.110.092.28^{+0.11}_{-0.09} 2.330.09+0.14subscriptsuperscript2.330.140.092.33^{+0.14}_{-0.09} 2.250.07+0.08subscriptsuperscript2.250.080.072.25^{+0.08}_{-0.07} 2.35±0.10plus-or-minus2.350.102.35\pm 0.10 2.42±0.07plus-or-minus2.420.072.42\pm 0.07 2.340.07+0.08subscriptsuperscript2.340.080.072.34^{+0.08}_{-0.07} 2.530.08+0.09subscriptsuperscript2.530.090.082.53^{+0.09}_{-0.08} 2.510.06+0.10subscriptsuperscript2.510.100.062.51^{+0.10}_{-0.06} 2.660.09+0.13subscriptsuperscript2.660.130.092.66^{+0.13}_{-0.09} 2.520.09+0.13subscriptsuperscript2.520.130.092.52^{+0.13}_{-0.09} 2.750.15+0.08subscriptsuperscript2.750.080.152.75^{+0.08}_{-0.15}
τHTsubscript𝜏HT\tau_{\rm HT} (1010superscript101010^{10} cm-3 s) 4.580.31+0.46subscriptsuperscript4.580.460.314.58^{+0.46}_{-0.31} 5.160.37+0.41subscriptsuperscript5.160.410.375.16^{+0.41}_{-0.37} 5.330.29+0.40subscriptsuperscript5.330.400.295.33^{+0.40}_{-0.29} 5.210.26+0.29subscriptsuperscript5.210.290.265.21^{+0.29}_{-0.26} 6.730.48+0.78subscriptsuperscript6.730.780.486.73^{+0.78}_{-0.48} 6.110.31+0.54subscriptsuperscript6.110.540.316.11^{+0.54}_{-0.31} 6.180.38+0.40subscriptsuperscript6.180.400.386.18^{+0.40}_{-0.38} 6.880.29+0.31subscriptsuperscript6.880.310.296.88^{+0.31}_{-0.29} 5.880.27+0.48subscriptsuperscript5.880.480.275.88^{+0.48}_{-0.27} 6.690.32+0.36subscriptsuperscript6.690.360.326.69^{+0.36}_{-0.32} 6.780.40+0.50subscriptsuperscript6.780.500.406.78^{+0.50}_{-0.40} 6.260.53+0.84subscriptsuperscript6.260.840.536.26^{+0.84}_{-0.53}
NormHT (103superscript10310^{-3} cm-5) 1.120.08+0.07subscriptsuperscript1.120.070.081.12^{+0.07}_{-0.08} 1.470.08+0.07subscriptsuperscript1.470.070.081.47^{+0.07}_{-0.08} 1.730.14+0.08subscriptsuperscript1.730.080.141.73^{+0.08}_{-0.14} 2.20±0.11plus-or-minus2.200.112.20\pm 0.11 2.310.10+0.09subscriptsuperscript2.310.090.102.31^{+0.09}_{-0.10} 2.68±0.08plus-or-minus2.680.082.68\pm 0.08 3.19±0.11plus-or-minus3.190.113.19\pm 0.11 3.190.12+0.11subscriptsuperscript3.190.110.123.19^{+0.11}_{-0.12} 3.540.18+0.14subscriptsuperscript3.540.140.183.54^{+0.14}_{-0.18} 3.420.16+0.12subscriptsuperscript3.420.120.163.42^{+0.12}_{-0.16} 3.930.17+0.13subscriptsuperscript3.930.130.173.93^{+0.13}_{-0.17} 3.890.11+0.20subscriptsuperscript3.890.200.113.89^{+0.20}_{-0.11}
Abundance
N 0.690.06+0.04subscriptsuperscript0.690.040.060.69^{+0.04}_{-0.06} 0.710.04+0.07subscriptsuperscript0.710.070.040.71^{+0.07}_{-0.04} 1.310.12+0.21subscriptsuperscript1.310.210.121.31^{+0.21}_{-0.12} 0.940.08+0.12subscriptsuperscript0.940.120.080.94^{+0.12}_{-0.08} 1.500.18+0.25subscriptsuperscript1.500.250.181.50^{+0.25}_{-0.18} 1.440.12+0.21subscriptsuperscript1.440.210.121.44^{+0.21}_{-0.12} 0.880.12+0.09subscriptsuperscript0.880.090.120.88^{+0.09}_{-0.12} 1.540.19+0.23subscriptsuperscript1.540.230.191.54^{+0.23}_{-0.19} 1.100.13+0.34subscriptsuperscript1.100.340.131.10^{+0.34}_{-0.13} 1.270.16+0.20subscriptsuperscript1.270.200.161.27^{+0.20}_{-0.16} 0.730.12+0.17subscriptsuperscript0.730.170.120.73^{+0.17}_{-0.12} 0.560.11+0.13subscriptsuperscript0.560.130.110.56^{+0.13}_{-0.11}
O 0.08±0.01plus-or-minus0.080.010.08\pm 0.01 0.08±0.01plus-or-minus0.080.010.08\pm 0.01 0.08±0.01plus-or-minus0.080.010.08\pm 0.01 0.07±0.01plus-or-minus0.070.010.07\pm 0.01 0.09±0.01plus-or-minus0.090.010.09\pm 0.01 0.08±0.01plus-or-minus0.080.010.08\pm 0.01 0.07±0.01plus-or-minus0.070.010.07\pm 0.01 0.07±0.01plus-or-minus0.070.010.07\pm 0.01 0.06±0.01plus-or-minus0.060.010.06\pm 0.01 0.07±0.01plus-or-minus0.070.010.07\pm 0.01 0.06±0.01plus-or-minus0.060.010.06\pm 0.01 0.05±0.01plus-or-minus0.050.010.05\pm 0.01
Ne 0.31±0.02plus-or-minus0.310.020.31\pm 0.02 0.30±0.02plus-or-minus0.300.020.30\pm 0.02 0.29±0.01plus-or-minus0.290.010.29\pm 0.01 0.27±0.01plus-or-minus0.270.010.27\pm 0.01 0.320.02+0.03subscriptsuperscript0.320.030.020.32^{+0.03}_{-0.02} 0.300.01+0.02subscriptsuperscript0.300.020.010.30^{+0.02}_{-0.01} 0.28±0.02plus-or-minus0.280.020.28\pm 0.02 0.29±0.02plus-or-minus0.290.020.29\pm 0.02 0.240.01+0.02subscriptsuperscript0.240.020.010.24^{+0.02}_{-0.01} 0.260.01+0.02subscriptsuperscript0.260.020.010.26^{+0.02}_{-0.01} 0.24±0.02plus-or-minus0.240.020.24\pm 0.02 0.230.03+0.04subscriptsuperscript0.230.040.030.23^{+0.04}_{-0.03}
Mg 0.39±0.03plus-or-minus0.390.030.39\pm 0.03 0.380.02+0.03subscriptsuperscript0.380.030.020.38^{+0.03}_{-0.02} 0.37±0.02plus-or-minus0.370.020.37\pm 0.02 0.37±0.02plus-or-minus0.370.020.37\pm 0.02 0.410.02+0.04subscriptsuperscript0.410.040.020.41^{+0.04}_{-0.02} 0.430.02+0.03subscriptsuperscript0.430.030.020.43^{+0.03}_{-0.02} 0.390.02+0.03subscriptsuperscript0.390.030.020.39^{+0.03}_{-0.02} 0.380.02+0.03subscriptsuperscript0.380.030.020.38^{+0.03}_{-0.02} 0.33±0.03plus-or-minus0.330.030.33\pm 0.03 0.360.02+0.03subscriptsuperscript0.360.030.020.36^{+0.03}_{-0.02} 0.33±0.03plus-or-minus0.330.030.33\pm 0.03 0.30±0.04plus-or-minus0.300.040.30\pm 0.04
Si 0.590.07+0.05subscriptsuperscript0.590.050.070.59^{+0.05}_{-0.07} 0.610.05+0.06subscriptsuperscript0.610.060.050.61^{+0.06}_{-0.05} 0.630.04+0.05subscriptsuperscript0.630.050.040.63^{+0.05}_{-0.04} 0.61±0.04plus-or-minus0.610.040.61\pm 0.04 0.670.04+0.06subscriptsuperscript0.670.060.040.67^{+0.06}_{-0.04} 0.66±0.04plus-or-minus0.660.040.66\pm 0.04 0.670.04+0.05subscriptsuperscript0.670.050.040.67^{+0.05}_{-0.04} 0.630.03+0.04subscriptsuperscript0.630.040.030.63^{+0.04}_{-0.03} 0.59±0.04plus-or-minus0.590.040.59\pm 0.04 0.630.03+0.04subscriptsuperscript0.630.040.030.63^{+0.04}_{-0.03} 0.580.06+0.05subscriptsuperscript0.580.050.060.58^{+0.05}_{-0.06} 0.610.07+0.06subscriptsuperscript0.610.060.070.61^{+0.06}_{-0.07}
S 0.650.10+0.11subscriptsuperscript0.650.110.100.65^{+0.11}_{-0.10} 0.520.09+0.08subscriptsuperscript0.520.080.090.52^{+0.08}_{-0.09} 0.61±0.09plus-or-minus0.610.090.61\pm 0.09 0.480.06+0.07subscriptsuperscript0.480.070.060.48^{+0.07}_{-0.06} 0.58±0.09plus-or-minus0.580.090.58\pm 0.09 0.560.06+0.08subscriptsuperscript0.560.080.060.56^{+0.08}_{-0.06} 0.55±0.07plus-or-minus0.550.070.55\pm 0.07 0.57±0.07plus-or-minus0.570.070.57\pm 0.07 0.480.09+0.07subscriptsuperscript0.480.070.090.48^{+0.07}_{-0.09} 0.460.07+0.08subscriptsuperscript0.460.080.070.46^{+0.08}_{-0.07} 0.440.09+0.10subscriptsuperscript0.440.100.090.44^{+0.10}_{-0.09} 0.560.09+0.11subscriptsuperscript0.560.110.090.56^{+0.11}_{-0.09}
Fe 0.260.02+0.01subscriptsuperscript0.260.010.020.26^{+0.01}_{-0.02} 0.290.01+0.02subscriptsuperscript0.290.020.010.29^{+0.02}_{-0.01} 0.23±0.01plus-or-minus0.230.010.23\pm 0.01 0.26±0.01plus-or-minus0.260.010.26\pm 0.01 0.280.01+0.02subscriptsuperscript0.280.020.010.28^{+0.02}_{-0.01} 0.29±0.01plus-or-minus0.290.010.29\pm 0.01 0.29±0.01plus-or-minus0.290.010.29\pm 0.01 0.28±0.01plus-or-minus0.280.010.28\pm 0.01 0.26±0.01plus-or-minus0.260.010.26\pm 0.01 0.27±0.01plus-or-minus0.270.010.27\pm 0.01 0.260.01+0.02subscriptsuperscript0.260.020.010.26^{+0.02}_{-0.01} 0.26±0.02plus-or-minus0.260.020.26\pm 0.02
χr2subscriptsuperscript𝜒2r\chi^{2}_{\rm r} 1.35 1.33 1.34 1.41 1.34 1.35 1.31 1.32 1.33 1.36 1.21 1.21
(χ2/\chi^{2}/dof) (2737/2028) (2891/2175) (3249/2433) (3353/2371) (2650/1974) (3164/2347) (2907/2216) (3118/2363) (2872/2153) (3106/2283) (2731/2263) (1494/1234)

Note. — Errors are for 90% confidence range.

Table 4: Spectral Fitting Results of the Two-temperature vpshock Model
2007 Jan. 2008 Jan. 2009 Jan. 2009 Dec. 2010 Dec. 2011 Dec. 2012 Dec. 2014 Nov. 2015 Nov. 2016 Nov. 2017 Oct. 2019 Nov.
Low-Temperature Plasma
kTLT𝑘subscript𝑇LTkT_{\rm LT} (keV) 0.550.01+0.02subscriptsuperscript0.550.020.010.55^{+0.02}_{-0.01} 0.58±0.01plus-or-minus0.580.010.58\pm 0.01 0.600.02+0.01subscriptsuperscript0.600.010.020.60^{+0.01}_{-0.02} 0.60±0.01plus-or-minus0.600.010.60\pm 0.01 0.62±0.01plus-or-minus0.620.010.62\pm 0.01 0.63±0.01plus-or-minus0.630.010.63\pm 0.01 0.63±0.01plus-or-minus0.630.010.63\pm 0.01 0.68±0.01plus-or-minus0.680.010.68\pm 0.01 0.66±0.01plus-or-minus0.660.010.66\pm 0.01 0.69±0.01plus-or-minus0.690.010.69\pm 0.01 0.63±0.02plus-or-minus0.630.020.63\pm 0.02 0.63±0.03plus-or-minus0.630.030.63\pm 0.03
τu,LTsubscript𝜏uLT\tau_{\rm u,LT} (1011superscript101110^{11} cm-3 s) 2.850.13+0.22subscriptsuperscript2.850.220.132.85^{+0.22}_{-0.13} 3.260.17+0.15subscriptsuperscript3.260.150.173.26^{+0.15}_{-0.17} 4.240.23+0.40subscriptsuperscript4.240.400.234.24^{+0.40}_{-0.23} 4.300.27+0.20subscriptsuperscript4.300.200.274.30^{+0.20}_{-0.27} 5.280.33+0.25subscriptsuperscript5.280.250.335.28^{+0.25}_{-0.33} 6.020.12+0.08subscriptsuperscript6.020.080.126.02^{+0.08}_{-0.12} 6.170.24+0.16subscriptsuperscript6.170.160.246.17^{+0.16}_{-0.24} 7.340.33+0.58subscriptsuperscript7.340.580.337.34^{+0.58}_{-0.33} 9.930.10+0.20subscriptsuperscript9.930.200.109.93^{+0.20}_{-0.10} 6.750.43+0.37subscriptsuperscript6.750.370.436.75^{+0.37}_{-0.43} 6.390.19+0.13subscriptsuperscript6.390.130.196.39^{+0.13}_{-0.19} 8.640.12+0.26subscriptsuperscript8.640.260.128.64^{+0.26}_{-0.12}
NormLT (103superscript10310^{-3} cm-5) 3.870.25+0.31subscriptsuperscript3.870.310.253.87^{+0.31}_{-0.25} 4.450.38+0.42subscriptsuperscript4.450.420.384.45^{+0.42}_{-0.38} 6.070.25+0.34subscriptsuperscript6.070.340.256.07^{+0.34}_{-0.25} 6.120.34+0.21subscriptsuperscript6.120.210.346.12^{+0.21}_{-0.34} 6.100.32+0.35subscriptsuperscript6.100.350.326.10^{+0.35}_{-0.32} 5.980.32+0.40subscriptsuperscript5.980.400.325.98^{+0.40}_{-0.32} 6.080.41+0.30subscriptsuperscript6.080.300.416.08^{+0.30}_{-0.41} 5.600.32+0.41subscriptsuperscript5.600.410.325.60^{+0.41}_{-0.32} 5.450.37+0.27subscriptsuperscript5.450.270.375.45^{+0.27}_{-0.37} 4.620.23+0.35subscriptsuperscript4.620.350.234.62^{+0.35}_{-0.23} 4.290.31+0.20subscriptsuperscript4.290.200.314.29^{+0.20}_{-0.31} 3.030.30+0.40subscriptsuperscript3.030.400.303.03^{+0.40}_{-0.30}
High-Temperature Plasma
kTHT𝑘subscript𝑇HTkT_{\rm HT} (keV) 2.52±0.21plus-or-minus2.520.212.52\pm 0.21 2.490.14+0.21subscriptsuperscript2.490.210.142.49^{+0.21}_{-0.14} 2.540.16+0.17subscriptsuperscript2.540.170.162.54^{+0.17}_{-0.16} 2.420.11+0.09subscriptsuperscript2.420.090.112.42^{+0.09}_{-0.11} 2.340.08+0.12subscriptsuperscript2.340.120.082.34^{+0.12}_{-0.08} 2.420.08+0.11subscriptsuperscript2.420.110.082.42^{+0.11}_{-0.08} 2.330.10+0.07subscriptsuperscript2.330.070.102.33^{+0.07}_{-0.10} 2.420.09+0.08subscriptsuperscript2.420.080.092.42^{+0.08}_{-0.09} 2.44±0.09plus-or-minus2.440.092.44\pm 0.09 2.47±0.07plus-or-minus2.470.072.47\pm 0.07 2.330.06+0.09subscriptsuperscript2.330.090.062.33^{+0.09}_{-0.06} 2.530.07+0.13subscriptsuperscript2.530.130.072.53^{+0.13}_{-0.07}
τu,HTsubscript𝜏uHT\tau_{\rm u,HT} (1011superscript101110^{11} cm-3 s) 0.960.10+0.17subscriptsuperscript0.960.170.100.96^{+0.17}_{-0.10} 1.280.09+0.08subscriptsuperscript1.280.080.091.28^{+0.08}_{-0.09} 1.320.08+0.13subscriptsuperscript1.320.130.081.32^{+0.13}_{-0.08} 1.280.04+0.03subscriptsuperscript1.280.030.041.28^{+0.03}_{-0.04} 2.190.07+0.05subscriptsuperscript2.190.050.072.19^{+0.05}_{-0.07} 1.64±0.01plus-or-minus1.640.011.64\pm 0.01 1.67±0.01plus-or-minus1.670.011.67\pm 0.01 2.170.03+0.05subscriptsuperscript2.170.050.032.17^{+0.05}_{-0.03} 1.72±0.01plus-or-minus1.720.011.72\pm 0.01 2.090.04+0.03subscriptsuperscript2.090.030.042.09^{+0.03}_{-0.04} 1.72±0.01plus-or-minus1.720.011.72\pm 0.01 1.670.01+0.02subscriptsuperscript1.670.020.011.67^{+0.02}_{-0.01}
NormHT (103superscript10310^{-3} cm-5) 0.97±0.12plus-or-minus0.970.120.97\pm 0.12 1.300.13+0.12subscriptsuperscript1.300.120.131.30^{+0.12}_{-0.13} 1.480.12+0.14subscriptsuperscript1.480.140.121.48^{+0.14}_{-0.12} 1.920.11+0.15subscriptsuperscript1.920.150.111.92^{+0.15}_{-0.11} 2.260.13+0.08subscriptsuperscript2.260.080.132.26^{+0.08}_{-0.13} 2.630.15+0.12subscriptsuperscript2.630.120.152.63^{+0.12}_{-0.15} 3.140.12+0.18subscriptsuperscript3.140.180.123.14^{+0.18}_{-0.12} 3.340.14+0.13subscriptsuperscript3.340.130.143.34^{+0.13}_{-0.14} 3.610.15+0.17subscriptsuperscript3.610.170.153.61^{+0.17}_{-0.15} 3.74±0.14plus-or-minus3.740.143.74\pm 0.14 4.440.19+0.17subscriptsuperscript4.440.170.194.44^{+0.17}_{-0.19} 4.360.24+0.16subscriptsuperscript4.360.160.244.36^{+0.16}_{-0.24}
Abundance
N 1.460.14+0.17subscriptsuperscript1.460.170.141.46^{+0.17}_{-0.14} 1.730.18+0.16subscriptsuperscript1.730.160.181.73^{+0.16}_{-0.18} 1.660.16+0.17subscriptsuperscript1.660.170.161.66^{+0.17}_{-0.16} 1.540.11+0.12subscriptsuperscript1.540.120.111.54^{+0.12}_{-0.11} 1.950.22+0.18subscriptsuperscript1.950.180.221.95^{+0.18}_{-0.22} 1.790.13+0.15subscriptsuperscript1.790.150.131.79^{+0.15}_{-0.13} 1.360.13+0.11subscriptsuperscript1.360.110.131.36^{+0.11}_{-0.13} 1.580.12+0.15subscriptsuperscript1.580.150.121.58^{+0.15}_{-0.12} 1.290.12+0.15subscriptsuperscript1.290.150.121.29^{+0.15}_{-0.12} 1.300.12+0.14subscriptsuperscript1.300.140.121.30^{+0.14}_{-0.12} 0.740.06+0.11subscriptsuperscript0.740.110.060.74^{+0.11}_{-0.06} 1.050.15+0.16subscriptsuperscript1.050.160.151.05^{+0.16}_{-0.15}
O 0.140.01+0.02subscriptsuperscript0.140.020.010.14^{+0.02}_{-0.01} 0.16±0.01plus-or-minus0.160.010.16\pm 0.01 0.170.02+0.01subscriptsuperscript0.170.010.020.17^{+0.01}_{-0.02} 0.16±0.01plus-or-minus0.160.010.16\pm 0.01 0.21±0.02plus-or-minus0.210.020.21\pm 0.02 0.19±0.01plus-or-minus0.190.010.19\pm 0.01 0.17±0.01plus-or-minus0.170.010.17\pm 0.01 0.19±0.01plus-or-minus0.190.010.19\pm 0.01 0.16±0.01plus-or-minus0.160.010.16\pm 0.01 0.17±0.01plus-or-minus0.170.010.17\pm 0.01 0.11±0.01plus-or-minus0.110.010.11\pm 0.01 0.13±0.02plus-or-minus0.130.020.13\pm 0.02
Ne 0.41±0.03plus-or-minus0.410.030.41\pm 0.03 0.430.03+0.02subscriptsuperscript0.430.020.030.43^{+0.02}_{-0.03} 0.420.02+0.03subscriptsuperscript0.420.030.020.42^{+0.03}_{-0.02} 0.41±0.02plus-or-minus0.410.020.41\pm 0.02 0.540.04+0.03subscriptsuperscript0.540.030.040.54^{+0.03}_{-0.04} 0.500.02+0.03subscriptsuperscript0.500.030.020.50^{+0.03}_{-0.02} 0.470.03+0.02subscriptsuperscript0.470.020.030.47^{+0.02}_{-0.03} 0.52±0.03plus-or-minus0.520.030.52\pm 0.03 0.45±0.03plus-or-minus0.450.030.45\pm 0.03 0.46±0.03plus-or-minus0.460.030.46\pm 0.03 0.34±0.03plus-or-minus0.340.030.34\pm 0.03 0.340.03+0.05subscriptsuperscript0.340.050.030.34^{+0.05}_{-0.03}
Mg 0.460.03+0.04subscriptsuperscript0.460.040.030.46^{+0.04}_{-0.03} 0.47±0.03plus-or-minus0.470.030.47\pm 0.03 0.470.03+0.04subscriptsuperscript0.470.040.030.47^{+0.04}_{-0.03} 0.47±0.03plus-or-minus0.470.030.47\pm 0.03 0.59±0.04plus-or-minus0.590.040.59\pm 0.04 0.590.03+0.04subscriptsuperscript0.590.040.030.59^{+0.04}_{-0.03} 0.530.03+0.04subscriptsuperscript0.530.040.030.53^{+0.04}_{-0.03} 0.570.04+0.03subscriptsuperscript0.570.030.040.57^{+0.03}_{-0.04} 0.49±0.04plus-or-minus0.490.040.49\pm 0.04 0.530.04+0.03subscriptsuperscript0.530.030.040.53^{+0.03}_{-0.04} 0.420.04+0.05subscriptsuperscript0.420.050.040.42^{+0.05}_{-0.04} 0.410.05+0.07subscriptsuperscript0.410.070.050.41^{+0.07}_{-0.05}
Si 0.670.05+0.07subscriptsuperscript0.670.070.050.67^{+0.07}_{-0.05} 0.720.06+0.04subscriptsuperscript0.720.040.060.72^{+0.04}_{-0.06} 0.720.04+0.06subscriptsuperscript0.720.060.040.72^{+0.06}_{-0.04} 0.720.04+0.05subscriptsuperscript0.720.050.040.72^{+0.05}_{-0.04} 0.830.06+0.07subscriptsuperscript0.830.070.060.83^{+0.07}_{-0.06} 0.79±0.05plus-or-minus0.790.050.79\pm 0.05 0.790.05+0.04subscriptsuperscript0.790.040.050.79^{+0.04}_{-0.05} 0.770.05+0.04subscriptsuperscript0.770.040.050.77^{+0.04}_{-0.05} 0.720.05+0.06subscriptsuperscript0.720.060.050.72^{+0.06}_{-0.05} 0.770.05+0.07subscriptsuperscript0.770.070.050.77^{+0.07}_{-0.05} 0.640.06+0.05subscriptsuperscript0.640.050.060.64^{+0.05}_{-0.06} 0.72±0.09plus-or-minus0.720.090.72\pm 0.09
S 0.710.12+0.16subscriptsuperscript0.710.160.120.71^{+0.16}_{-0.12} 0.540.09+0.08subscriptsuperscript0.540.080.090.54^{+0.08}_{-0.09} 0.66±0.10plus-or-minus0.660.100.66\pm 0.10 0.530.08+0.09subscriptsuperscript0.530.090.080.53^{+0.09}_{-0.08} 0.630.11+0.12subscriptsuperscript0.630.120.110.63^{+0.12}_{-0.11} 0.62±0.08plus-or-minus0.620.080.62\pm 0.08 0.610.07+0.08subscriptsuperscript0.610.080.070.61^{+0.08}_{-0.07} 0.630.06+0.09subscriptsuperscript0.630.090.060.63^{+0.09}_{-0.06} 0.53±0.09plus-or-minus0.530.090.53\pm 0.09 0.510.08+0.10subscriptsuperscript0.510.100.080.51^{+0.10}_{-0.08} 0.45±0.10plus-or-minus0.450.100.45\pm 0.10 0.620.11+0.13subscriptsuperscript0.620.130.110.62^{+0.13}_{-0.11}
Fe 0.26±0.02plus-or-minus0.260.020.26\pm 0.02 0.300.02+0.03subscriptsuperscript0.300.030.020.30^{+0.03}_{-0.02} 0.270.02+0.01subscriptsuperscript0.270.010.020.27^{+0.01}_{-0.02} 0.300.01+0.02subscriptsuperscript0.300.020.010.30^{+0.02}_{-0.01} 0.35±0.02plus-or-minus0.350.020.35\pm 0.02 0.360.03+0.02subscriptsuperscript0.360.020.030.36^{+0.02}_{-0.03} 0.340.02+0.03subscriptsuperscript0.340.030.020.34^{+0.03}_{-0.02} 0.36±0.02plus-or-minus0.360.020.36\pm 0.02 0.33±0.02plus-or-minus0.330.020.33\pm 0.02 0.370.03+0.02subscriptsuperscript0.370.020.030.37^{+0.02}_{-0.03} 0.320.01+0.02subscriptsuperscript0.320.020.010.32^{+0.02}_{-0.01} 0.350.03+0.04subscriptsuperscript0.350.040.030.35^{+0.04}_{-0.03}
χr2subscriptsuperscript𝜒2r\chi^{2}_{\rm r} 1.27 1.22 1.24 1.33 1.26 1.26 1.26 1.24 1.28 1.30 1.17 1.18
(χ2/\chi^{2}/dof) (2582/2028) (2647/2175) (3010/2433) (3150/2371) (2483/1974) (2955/2347) (2797/2216) (2932/2363) (2746/2153) (2976/2283) (2641/2263) (1450/1234)

Note. — Errors are for 90% confidence range.

Table 5: Fitting Results of the Fe K Line
Centroid (keV) Flux (10-6 ph cm-2 s-1) EW (eV) χr2subscriptsuperscript𝜒2r\chi^{2}_{\rm r} (χ2superscript𝜒2\chi^{2}/dof) F-test p-value ΔAICΔ𝐴𝐼𝐶\Delta AIC Significance
2007 Jan. 6.4810.031+0.043subscriptsuperscript6.4810.0430.0316.481^{+0.043}_{-0.031} 0.730.29+0.32subscriptsuperscript0.730.320.290.73^{+0.32}_{-0.29} 235235235 0.97 (578/595) 3.21×1023.21superscript1023.21\times 10^{-2} 2.92.9-2.9 2σgreater-than-or-equivalent-toabsent2𝜎\gtrsim 2\sigma
2008 Jan. 6.5550.085+0.045subscriptsuperscript6.5550.0450.0856.555^{+0.045}_{-0.085} 0.920.39+0.31subscriptsuperscript0.920.310.390.92^{+0.31}_{-0.39} 207207207 1.04 (618/595) 1.59×1021.59superscript1021.59\times 10^{-2} 4.34.3-4.3 2σgreater-than-or-equivalent-toabsent2𝜎\gtrsim 2\sigma
2009 Jan. 6.6040.077+0.060subscriptsuperscript6.6040.0600.0776.604^{+0.060}_{-0.077} 0.590.35+0.38subscriptsuperscript0.590.380.350.59^{+0.38}_{-0.35} 939393 1.07 (637/595) 0.240.240.24 1.11.11.1 1σgreater-than-or-equivalent-toabsent1𝜎\gtrsim 1\sigma
2009 Dec. 6.6120.045+0.047subscriptsuperscript6.6120.0470.0456.612^{+0.047}_{-0.045} 1.150.48+0.36subscriptsuperscript1.150.360.481.15^{+0.36}_{-0.48} 169169169 1.07 (637/595) 6.10×1036.10superscript1036.10\times 10^{-3} 6.36.3-6.3 2.5σgreater-than-or-equivalent-toabsent2.5𝜎\gtrsim 2.5\sigma
2010 Dec. 6.5850.045+0.030subscriptsuperscript6.5850.0300.0456.585^{+0.030}_{-0.045} 2.010.50+0.49subscriptsuperscript2.010.490.502.01^{+0.49}_{-0.50} 278278278 1.10 (653/595) 1.63×1041.63superscript1041.63\times 10^{-4} 13.613.6-13.6 3.5σgreater-than-or-equivalent-toabsent3.5𝜎\gtrsim 3.5\sigma
2011 Dec. 6.5820.045+0.030subscriptsuperscript6.5820.0300.0456.582^{+0.030}_{-0.045} 1.740.65+0.45subscriptsuperscript1.740.450.651.74^{+0.45}_{-0.65} 180180180 1.05 (625/595) 1.27×1031.27superscript1031.27\times 10^{-3} 9.49.4-9.4 3σgreater-than-or-equivalent-toabsent3𝜎\gtrsim 3\sigma
2012 Dec. 6.6990.032+0.035subscriptsuperscript6.6990.0350.0326.699^{+0.035}_{-0.032} 1.660.55+0.58subscriptsuperscript1.660.580.551.66^{+0.58}_{-0.55} 157157157 1.19 (709/595) 8.09×1038.09superscript1038.09\times 10^{-3} 5.75.7-5.7 2.5σgreater-than-or-equivalent-toabsent2.5𝜎\gtrsim 2.5\sigma
2014 Nov. 6.5990.029+0.025subscriptsuperscript6.5990.0250.0296.599^{+0.025}_{-0.029} 2.630.67+0.57subscriptsuperscript2.630.570.672.63^{+0.57}_{-0.67} 226226226 1.09 (646/595) 2.21×1052.21superscript1052.21\times 10^{-5} 17.617.6-17.6 4σgreater-than-or-equivalent-toabsent4𝜎\gtrsim 4\sigma
2015 Nov. 6.7080.033+0.031subscriptsuperscript6.7080.0310.0336.708^{+0.031}_{-0.033} 2.640.69+0.55subscriptsuperscript2.640.550.692.64^{+0.55}_{-0.69} 231231231 1.03 (609/595) 1.11×1051.11superscript1051.11\times 10^{-5} 19.019.0-19.0 4σgreater-than-or-equivalent-toabsent4𝜎\gtrsim 4\sigma
2016 Nov. 6.6620.026+0.024subscriptsuperscript6.6620.0240.0266.662^{+0.024}_{-0.026} 3.620.78+0.82subscriptsuperscript3.620.820.783.62^{+0.82}_{-0.78} 263263263 1.11 (662/595) 1.18×1061.18superscript1061.18\times 10^{-6} 23.523.5-23.5 4.5σgreater-than-or-equivalent-toabsent4.5𝜎\gtrsim 4.5\sigma
2017 Oct. 6.6710.028+0.040subscriptsuperscript6.6710.0400.0286.671^{+0.040}_{-0.028} 2.920.93+0.76subscriptsuperscript2.920.760.932.92^{+0.76}_{-0.93} 243243243 1.04 (619/595) 1.64×1031.64superscript1031.64\times 10^{-3} 8.88.8-8.8 3σgreater-than-or-equivalent-toabsent3𝜎\gtrsim 3\sigma
2019 Nov. 6.6660.052+0.072subscriptsuperscript6.6660.0720.0526.666^{+0.072}_{-0.052} 1.390.99+1.07subscriptsuperscript1.391.070.991.39^{+1.07}_{-0.99} 999999 0.99 (587/595) 0.370.370.37 2.02.02.0 1σsimilar-toabsent1𝜎\sim 1\sigma

Note. — Errors are for 1-σ𝜎\sigma confidence range.

Table 6: Derived Parameters Based on Spectral Fitting Results
2007 Jan. 2008 Jan. 2009 Jan. 2009 Dec. 2010 Dec. 2011 Dec. 2012 Dec. 2014 Nov. 2015 Nov. 2016 Nov. 2017 Oct. 2019 Nov.
R𝑅R 0.764′′superscript0.764′′0.764^{\prime\prime} 0.772′′superscript0.772′′0.772^{\prime\prime} 0.786′′superscript0.786′′0.786^{\prime\prime} 0.787′′superscript0.787′′0.787^{\prime\prime} 0.787′′superscript0.787′′0.787^{\prime\prime} 0.802′′superscript0.802′′0.802^{\prime\prime} 0.805′′superscript0.805′′0.805^{\prime\prime} 0.830′′superscript0.830′′0.830^{\prime\prime} 0.835′′superscript0.835′′0.835^{\prime\prime} 0.842′′superscript0.842′′0.842^{\prime\prime} 0.850′′superscript0.850′′0.850^{\prime\prime} 0.866′′superscript0.866′′0.866^{\prime\prime}
Low-Temperature Plasma
ne,LTsubscript𝑛eLTn_{\rm e,LT} (ftot0.5subscriptsuperscript𝑓0.5totf^{-0.5}_{\rm tot} cm-3) 1660161+162subscriptsuperscript16601621611660^{+162}_{-161} 1789130+163subscriptsuperscript17891631301789^{+163}_{-130} 1899132+153subscriptsuperscript18991531321899^{+153}_{-132} 2031106+105subscriptsuperscript20311051062031^{+105}_{-106} 205792+109subscriptsuperscript2057109922057^{+109}_{-92} 220397+112subscriptsuperscript2203112972203^{+112}_{-97} 2301110+97subscriptsuperscript2301971102301^{+97}_{-110} 224097+90subscriptsuperscript224090972240^{+90}_{-97} 2388105+106subscriptsuperscript23881061052388^{+106}_{-105} 232983+86subscriptsuperscript232986832329^{+86}_{-83} 2579117+134subscriptsuperscript25791341172579^{+134}_{-117} 2714165+195subscriptsuperscript27141951652714^{+195}_{-165}
tLTsubscript𝑡LTt_{\rm LT} (ftot0.5subscriptsuperscript𝑓0.5totf^{0.5}_{\rm tot} days) 27327+28subscriptsuperscript2732827273^{+28}_{-27} 25723+19subscriptsuperscript2571923257^{+19}_{-23} 51843+38subscriptsuperscript5183843518^{+38}_{-43} 38422+23subscriptsuperscript3842322384^{+23}_{-22} 46026+25subscriptsuperscript4602526460^{+25}_{-26} 41823+25subscriptsuperscript4182523418^{+25}_{-23} 35115+17subscriptsuperscript3511715351^{+17}_{-15} 42220+22subscriptsuperscript4222220422^{+22}_{-20} 38925+38subscriptsuperscript3893825389^{+38}_{-25} 38419+20subscriptsuperscript3842019384^{+20}_{-19} 32818+16subscriptsuperscript3281618328^{+16}_{-18} 20116+17subscriptsuperscript2011716201^{+17}_{-16}
tu,LTsubscript𝑡uLTt_{\rm u,LT} (ftot0.5subscriptsuperscript𝑓0.5totf^{0.5}_{\rm tot} days) 1985214+246subscriptsuperscript19852462141985^{+246}_{-214} 2109222+181subscriptsuperscript21091812222109^{+181}_{-222} 2584251+303subscriptsuperscript25843032512584^{+303}_{-251} 2449199+172subscriptsuperscript24491721992449^{+172}_{-199} 2970243+193subscriptsuperscript29701932432970^{+193}_{-243} 3161173+146subscriptsuperscript31611461733161^{+146}_{-173} 3102178+169subscriptsuperscript31021691783102^{+169}_{-178} 3791229+342subscriptsuperscript37913422293791^{+342}_{-229} 4810220+232subscriptsuperscript48102322204810^{+232}_{-220} 3353247+219subscriptsuperscript33532192473353^{+219}_{-247} 2867171+143subscriptsuperscript28671431712867^{+143}_{-171} 3684270+251subscriptsuperscript36842512703684^{+251}_{-270}
fLTsubscript𝑓LTf_{\rm LT} 0.16f0.16𝑓0.16f 0.16f0.16𝑓0.16f 0.19f0.19𝑓0.19f 0.16f0.16𝑓0.16f 0.16f0.16𝑓0.16f 0.13f0.13𝑓0.13f 0.12f0.12𝑓0.12f 0.12f0.12𝑓0.12f 0.10f0.10𝑓0.10f 0.09f0.09𝑓0.09f 0.07f0.07𝑓0.07f 0.04f0.04𝑓0.04f
MLTsubscript𝑀LTM_{\rm LT} (ftot0.5Msubscriptsuperscript𝑓0.5totsubscript𝑀direct-productf^{0.5}_{\rm tot}~{}M_{\odot}) 0.0620.0620.062 0.0660.0660.066 0.0850.0850.085 0.0800.0800.080 0.0790.0790.079 0.0720.0720.072 0.0700.0700.070 0.0670.0670.067 0.0610.0610.061 0.0530.0530.053 0.0440.0440.044 0.0300.0300.030
High-Temperature Plasma
ne,HTsubscript𝑛eHTn_{\rm e,HT} (ftot0.5subscriptsuperscript𝑓0.5totf^{-0.5}_{\rm tot} cm-3) 36246+47subscriptsuperscript3624746362^{+47}_{-46} 41647+45subscriptsuperscript4164547416^{+45}_{-47} 44845+46subscriptsuperscript4484645448^{+46}_{-45} 50333+35subscriptsuperscript5033533503^{+35}_{-33} 54538+35subscriptsuperscript5453538545^{+35}_{-38} 57337+36subscriptsuperscript5733637573^{+36}_{-37} 62236+38subscriptsuperscript6223836622^{+38}_{-36} 629±35plus-or-minus62935629\pm 35 646±38plus-or-minus64638646\pm 38 650±31plus-or-minus65031650\pm 31 69747+46subscriptsuperscript6974647697^{+46}_{-47} 67562+61subscriptsuperscript6756162675^{+61}_{-62}
tHTsubscript𝑡HTt_{\rm HT} (ftot0.5subscriptsuperscript𝑓0.5totf^{0.5}_{\rm tot} days) 1462214+239subscriptsuperscript14622392141462^{+239}_{-214} 1433186+197subscriptsuperscript14331971861433^{+197}_{-186} 1375161+174subscriptsuperscript13751741611375^{+174}_{-161} 1197±103plus-or-minus11971031197\pm 103 1429138+193subscriptsuperscript14291931381429^{+193}_{-138} 123299+135subscriptsuperscript1232135991232^{+135}_{-99} 1149±100plus-or-minus11491001149\pm 100 126489+91subscriptsuperscript126491891264^{+91}_{-89} 105379+106subscriptsuperscript1053106791053^{+106}_{-79} 118981+85subscriptsuperscript118985811189^{+85}_{-81} 112599+112subscriptsuperscript1125112991125^{+112}_{-99} 1072133+175subscriptsuperscript10721751331072^{+175}_{-133}
tu,HTsubscript𝑡uHTt_{\rm u,HT} (ftot0.5subscriptsuperscript𝑓0.5totf^{0.5}_{\rm tot} days) 3065510+672subscriptsuperscript30656725103065^{+672}_{-510} 3555460+458subscriptsuperscript35554584603555^{+458}_{-460} 3405409+483subscriptsuperscript34054834093405^{+483}_{-409} 2940228+207subscriptsuperscript29402072282940^{+207}_{-228} 4650337+342subscriptsuperscript46503423374650^{+342}_{-337} 3308209+217subscriptsuperscript33082172093308^{+217}_{-209} 3105194+183subscriptsuperscript31051831943105^{+183}_{-194} 3989233+243subscriptsuperscript39892432333989^{+243}_{-233} 3080185+183subscriptsuperscript30801831853080^{+183}_{-185} 3716194+186subscriptsuperscript37161861943716^{+186}_{-194} 2854189+193subscriptsuperscript28541931892854^{+193}_{-189} 2859260+268subscriptsuperscript28592682602859^{+268}_{-260}
fHTsubscript𝑓HTf_{\rm HT} 0.84f0.84𝑓0.84f 0.84f0.84𝑓0.84f 0.81f0.81𝑓0.81f 0.84f0.84𝑓0.84f 0.84f0.84𝑓0.84f 0.87f0.87𝑓0.87f 0.88f0.88𝑓0.88f 0.88f0.88𝑓0.88f 0.90f0.90𝑓0.90f 0.91f0.91𝑓0.91f 0.93f0.93𝑓0.93f 0.96f0.96𝑓0.96f
MHTsubscript𝑀HTM_{\rm HT} (ftot0.5Msubscriptsuperscript𝑓0.5totsubscript𝑀direct-productf^{0.5}_{\rm tot}~{}M_{\odot}) 0.0710.0710.071 0.0830.0830.083 0.0880.0880.088 0.1010.1010.101 0.1110.1110.111 0.1220.1220.122 0.1340.1340.134 0.1410.1410.141 0.1490.1490.149 0.1530.1530.153 0.1700.1700.170 0.1720.1720.172
Refer to caption
Figure 1: EPIC-pn images of SNR 1987A region. The source and background extraction regions used for the spectral analysis are denoted by red and white circles, respectively. The cyan dashed lines show the RGS dispersion direction and cross-dispersion aperture.
Refer to caption
Figure 2: An example of the RGS spectra of SNR 1987A (2015), with bright emission lines labeled. Observed spectra are denoted by data points, with different colors standing for different instruments and grating orders. The best-fit model (nlapec ++ gauss) is denoted by the black line, and the residuals are showed in the bottom panel.
Refer to caption
Figure 3: The left panels show the light curves of major emission lines from O, Ne, Mg, and Si. The right panels show the line ratios. Error bars represent the 1-σ𝜎\sigma uncertainties.
Refer to caption
Figure 4: An example of the RGS and EPIC-pn spectra of SNR 1987A (2015), with different spectral models and residuals. Observed spectra are denoted by data points, with different colors standing for different instruments and grating orders. The best-fit models are denoted by black lines, and the high- and low-temperature components by orange and blue dashed lines, respectively. Top: the two-temperature vnei model fitting. Bottom: the two-temperature vpshock model fitting.
Refer to caption
Figure 5: Top: the X-ray light curve of SNR 1987A viewed by XMM-Newton. The 0.5–2.0 keV fluxes are in blue and the 3.0–8.0 keV fluxes are in red. Bottom: the hard band to soft band flux ratios. The solid points are obtained from Frank et al. (2016), while the blank ones are newly published data obtained in this work. Error bars represent the 90% uncertainties, note that for most of the data points the error bars are too small to be visible.
Refer to caption
Figure 6: The 5.05.05.08.08.08.0 keV EPIC-pn spectra of SNR 1987A, which show the evolution of the Fe K lines. The best-fit model is plotted in black, which contains the bremsstrahlung continuum (black dashed line) and the Gaussian profile (red dashed line).
Refer to caption
Figure 7: Top: the Fe K light curve. The points with 3σgreater-than-or-equivalent-toabsent3𝜎\gtrsim 3\sigma significance are shown in dark blue, while those with <3σabsent3𝜎<3\sigma significance are shown in light blue. The blue dashed line denotes the mean flux. Bottom: the Fe K line centroids. The blue dashed line denotes the mean value, and the gray dashed curve shows the modeled line centroid for a plasma with kTe=3.2𝑘subscript𝑇e3.2kT_{\rm e}=3.2 keV and ne=500subscript𝑛e500n_{\rm e}=500 cm-3, shocked at 7000 days after the explosion.
Refer to caption
Figure 8: The electron temperatures, ionization parameters and the normalization parameters obtained in the vpshock model fitting, with their 90% errors. The values for the low-temperature component are denoted in orange, while those for the high-temperature components in red. In the middle panel, the orange dashed line shows a linear fit to the ionization parameters of the low-temperature component (from 2007 to 2015), corresponding to an electron density ne2450similar-tosubscript𝑛e2450n_{\rm e}\sim 2450 cm-3. In the bottom panel, the orange dashed line shows a linear fit to the normalization of the low-temperature component (from 2014 to 2019), corresponding to an decreasing rate of 0.54×10³similar-toabsent0.54superscript103\sim 0.54\times 10^{-3} cm-5 yr-1, while the red dashed line shows a linear fit to the normalization of the high-temperature component, corresponding to an increasing rate of 0.29×10³similar-toabsent0.29superscript103\sim 0.29\times 10^{-3} cm-5 yr-1.
Refer to caption
Figure 9: The abundances of different metal species (left), and the abundance ratios with respect to Ne (right). The black/blue dashed lines indicate the mean values. Error bars represent the 90% uncertainties.
Refer to caption
Figure 10: Theoretical predicted Fe K centroid energies, as a function of ionization parameter and electron temperature.