Numerical simulation of non-Brownian suspensions: Normal viscosity and Viscous resuspension
Abstract
Normal stresses in sheared suspensions of non-Brownian particles are obtained from numerical simulations. The stresses are determined in homogeneous shear of non-buoyant particles and by analyzing shear-induced resuspension of buoyant particles in the framework of the suspension balance model (SBM). The consistency of both approaches indicates that the SBM describes the steady state properly. Though in agreement with most available experimental results, none of previous empirical expressions for the normal stress can describe the data in the whole range of volume fraction, and in particular in the semi-dilute regime (25-35%) where the normal stress is less than expected. New expressions are proposed. The results also highlight that the normal stress anisotropy depends on the volume fraction, and that lubrication interactions significantly contribute to the normal stress in the semi-dilute regime.
keywords:
Viscous resuspension, Suspension, shear induced migration, normal stress1 Introduction
Suspensions of solid particles dispersed in a liquid are ubiquitous in nature and in technology. Describing their flow properties is therefore important issue, but despite intense research efforts, the global understanding is not yet achieved, due to the complexity of the problem. For high enough Peclet numbers, Brownian motion has negligible consequences and the rheological properties of the suspensions is dominated by hydrodynamic, contact and colloidal interactions between the particles.
In the simplest situation where only Coulombian contact and hydrodynamic interactions are taken into account, and when inertia is negligible, the stress is linear with respect to the shear rate (Boyer et al., 2011a). However, even in simple shear, the normal components of the stress are non-zero (Dbouk et al., 2013) and it can cause a migration of one phase relative to the other. In addition, the normal stresses strongly depends on volume fraction(Guazzelli & Pouliquen, 2018a). One of the difficulty encountered in practical situations originates from the strong coupling between the flow field and the field of volume fraction. Indeed, particles tend to migrate towards low-shear regions of the flow, e.g. the centerline in Poiseuille flow (Karnis et al., 1966; Lyon & Leal, 1998) or the outer cyldinder in Couette geoemetry (Boyer et al., 2011b; Sarabian et al., 2019). Conversely, homogeneous shear tends to disperse particles analogously to diffusion (Leighton & Acrivos, 1986). This phenomenon, referred to as shear-induced migration in the literature, is responsible for viscous resuspension. When a non-brownian suspension of buoyant particles is sheared, migration competes with sedimentation (Leighton & Acrivos, 1986; Acrivos et al., 1993).
Shear induced migration has been first modeled using a an apparent diffusion coefficient which is proportional to the shear rate and which strongly depends on the volume fraction (Leighton & Acrivos, 1986). Refinements of this diffusive approach have taken into account the fact that it is anisotropic (Phillips et al., 1992) and that it has several origins: gradients of shear rate, of volume fraction and of viscosity. Another type of theoretical approach has emerged and is based on a momentum balance in the particle phase (Morris & Boulay, 1999). In addition to the fact that the so-called suspension balance model is tensorial and thus accounts for the anisotropy of the migration, its main interest stems from the fact that the particle stress tensor, which is responsible for particle migration can be determined independently (Zarraga et al., 2000; Boyer et al., 2011b), using measurements of the normal components of the stress. Despite its relative success to account for the experimental data available, a discrepancy exists in the literature concerning the volume fraction dependency of the particle normal stress components (Saint-Michel et al., 2019). This disagreement concerns both the dilute regime where the particle normal stress scales either as (Morris & Boulay, 1999; Boyer et al., 2011b) either as (Zarraga et al., 2000) and both the divergence exponent when approaching a maximum volume fraction . Direct measurements of particle migration in Poiseuille flow failed to resolve this discrepancy (Snook et al., 2016), as the fully developed volume fraction profile is only weakly sensitive to the exact form of the function used to model the normal stress. However, two series of experiments aimed at revisiting viscous resuspension (d’Ambrosio et al., 2021; Saint-Michel et al., 2019) have been able to test the models with a good accuracy. They took advantage of the steady state profile of volume fraction when shearing a suspension of buoyant particles in a Couette cell. Unfortunately, the two sets of results lead to different conclusions. In (Saint-Michel et al., 2019), it is found that Boyer’s correlation (Boyer et al., 2011b) was accounting for the experimental data, whereas in (d’Ambrosio et al., 2021), Zarraga’s correlation (Zarraga et al., 2000) better matches the measurements. In addition to this disagreement, a non-linear relation between the stress and the shear rate was found in both cases, suggesting that the systems under study does not correspond to the simple case of Coulombian contact. Thus, the exact form of the volume fraction dependency of the particle normal stress responsible for particle migration is still an open question, which represent a strong limitation of the use of the suspension balance model to predict the volume fraction and flow fields of a sheared suspension.
Yet, all the available descriptions of the particle stress tensor suppose that all the normal components of the particle stress tensor share the same volume fraction dependency and only differ by a numerical prefactor (Zarraga et al., 2000; Guazzelli & Pouliquen, 2018a), although there has been experimental and numerical indications (Dbouk et al., 2013; Gallier et al., 2016) that reality is not as simple. It might also be the reason why several empirical laws have been proposed. Thus, it is needed to determine accurately the particle stress in all the relevant directions. Due to its high sensitivity and its ability to cover a large range of volume fraction, viscous resuspension appears to be a relevant choice for a reference case addressing this issue. From an experimental point of view, it has been used in both cases where gravity is aligned with the vorticity direction (Couette geometry (Acrivos et al., 1993; Saint-Michel et al., 2019; d’Ambrosio et al., 2021)) and with the shear direction (Leighton & Acrivos, 1986). It has also been tested in pipe flows (Norman et al., 2005), but the complexity of the flow field in this case hinders accurate determinations of the particle stress tensor.
To finish with the several difficulties associated to the modelization of shear-induced migration, it is worth mentioning that the theoretical validity of the suspension balance model in its original form of (Nott & Brady, 1994) has been revisited about ten years ago (Lhuillier, 2009; Nott et al., 2011). According to these work, the particle stress tensor which controls the migration is not the full one but is limited to the contribution of non-hydrodynamic interactions between the particles, such as contact ones. As argued in (Lhuillier, 2009), hydrodynamics is however likely to play a role on the mean interaction force between the fluid and the particle, which should not be as simple as a drag force in the general case, and especially in the presence of gradients of shear rates. These considerations makes the picture more complex, but they are not usable in practice since it seems rather difficult to access all quantities in the model. One of the main physical questions arising from the ”suspension balance model revisited” is related to the role of hydrodynamic forces as compared to that of contact ones on shear induced migration. As stated in (Nott et al., 2011), at high concentration, when the suspension properties are dominated by contact between particles, both approach are equivalent. In contrast, at lower concentration, there might exist a difference between the particle stress (which incorporate hydrodynamic contributions) and the particle stress involved in the shear induced migration.
In the last decade important progress have been made in numerical simulations, in particular by incorporating models of contacts between the particles (Gallier et al., 2016; Chèvremont et al., 2019, 2020). A DEM approach was presented in (Chèvremont et al., 2020) which combines solid contact and lubrication in a visco-elastic model of particle interaction. Lubrication refers to the terms which, at small gap, dominates the viscous resistance to relative motion between immersed particle pairs. The model also accounts for surface roughness. Homogeneous shear simulated on this basis (Chèvremont et al., 2019), while neglecting all hydrodynamic contributions beyond lubrication, were in quantitative agreement with available experimental data down to volume fractions of about 20%.
In this work, we take advantage of this model and of its implementation to simulate viscous resuspension, with the objective of bringing some light on the above detailed discrepancies and open questions related to the suspension balance model. We investigate both the migration in the shear direction and in the vorticity direction, in homogeneous shear flows. The results are analyzed in the framework of the SBM and lead to new phenomenological expressions for the normal stress. In parallel, we also investigate the normal components of the particle stress tensor in homogeneous shear and volume fraction, in order to compare with the resuspension results.
The paper is organized as follow. We recall briefly in section 2 the numerical method used and the SBM framework. In section 3, we first detail the normal stress results determined in simple shear experiments of homogeneous suspensions of non-buoyant spheres. Second, the resuspension results are presented, analyzed and compared to the homogeneous volume fraction case and to available experiments.
2 Models and methods
2.1 Equations of motion
The motion of suspended particles is integrated in time using the Discrete element Method (DEM) implemented in Yade-DEM (Šmilauer & Chareyre, 2015). The method is based on an explicit time-integration of the Newton’s equations of motion, for each particle:
| (1) |
where is the position of the center of mass of the particle and its time derivative, is the mass, is the moment of inertia tensor, is the rotational velocity vector, denotes forces acting on the body and the moments of these forces about .
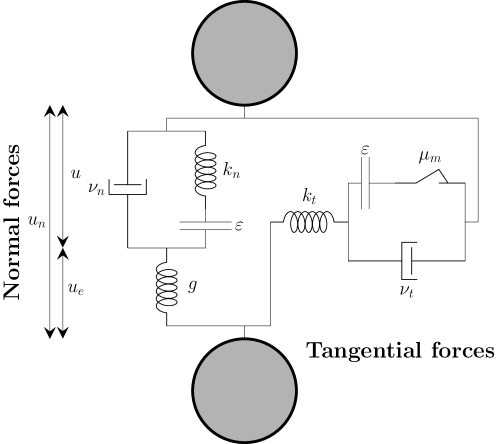
Figure 1 shows the rheological scheme of the lubricated contact model developed in Chèvremont et al. (2020). This model gives the forces resulting from the interaction of two particles. It couples solid contacts and lubrication forces in a single visco-elasto-plastic model, with a dependency on the roughness of particle surfaces. With , the average radius of particles pair, the lubrication cut-off distance is set to . For all simulations, the stiffness are high enough to stay in the rigid-rough case. Obviously, this kind of contact model is only valid for small range interactions and do not take into account any long-range effect. Then, for some simulations, it will be necessary to add extra drag to particles that are far from all others particles.
2.2 Simple shear simulations
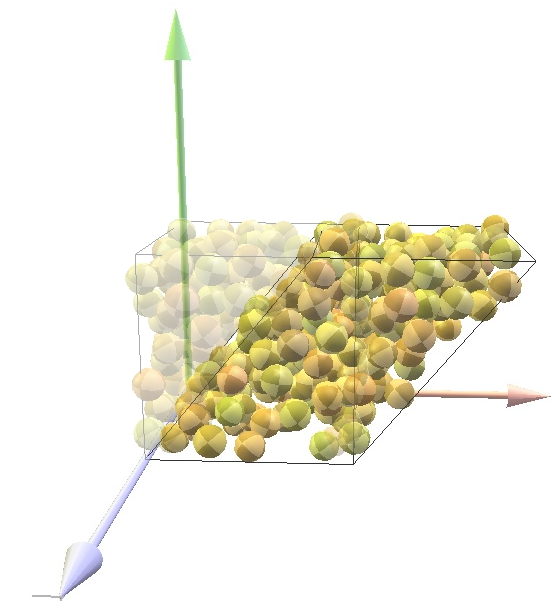
Homogeneous simple shear simulations are carried out with tri-periodic boundary conditions at imposed volume fractions from to with neutrally buoyant spheres, with the volume fraction of divergence. The sphere radii are distributed around using a Gaussian distribution with a standard deviation of . This small polydispersity prevents the system from crystallizing. The relative roughness is set to . The periodic cell is represented in figure 2a and is initially nearly cubic. Shear flow is imposed by setting the velocity gradient equal to . The initial state for the shear flow is obtained by compressing a very dilute suspension made of spheres with random initial positions. The friction coefficient is varied from to , which changes (Chèvremont et al., 2019).
The volume-averaged stress in the system is calculated based on the so-called virial stress for particulate systems: . The first term on the right-hand side is the volume-averaged outer product of the pairwise interaction forces (from both lubrication and direct contact) and the branch vector connecting reference points associated to the particles. is the velocity fluctuation, i.e. the deviation of individual particle velocity from the macroscopic average velocity field, imposed by cell deformation. The second term is also called the ”inertial stress”, and is always negligible in our simulations, as we stay in the viscous, non-inertial, regime.
2.3 Viscous resuspension simulations
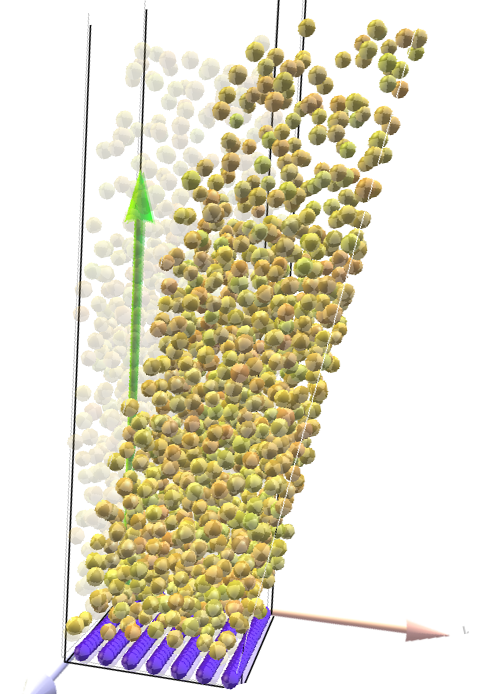
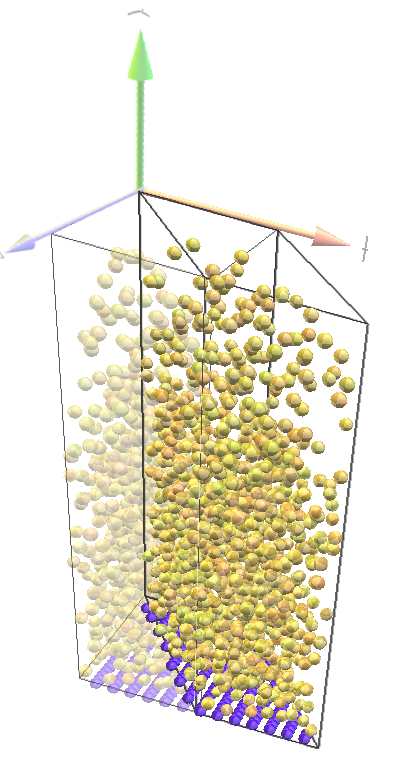
Viscous resuspension is simulated in a biperiodic cell using spheres, with the same particle size distribution. Figure 2b shows the simulation cell when resuspension occurs in the gradient direction. Figure 2c shows the simulation cell when the resuspension occurs in the vorticity direction. The relative roughness is set to . Friction coefficient is set to , so that . Gravity is oriented toward direction = (0,-g,0). In addition to weight, external drag forces are introduced to force homogeneous shear at the macroscale. The external drag on each particle is computed based on its deviation from mean field velocity, assuming Stoke’s drag with a viscosity equal to times the viscosity considered for lubrication. The exact value of viscosity used for extra drag do not change the results, as soon at it contribution is kept low. To some extent the external drag also contributes to prevent excessive agitation in the dilute regions, where the distance between particles is so large that the lubrication forces vanish, and thus, stabilize the system. It should be emphasized that this setup is not equivalent to conditions found in most gravitational flows (bedload, typically). Indeed most experimental conditions lead to homogeneous - or linear - shear stress instead of homogeneous shear rate.
The inertia effects in the simulations are negligibly small. They can be quantified by the particles Reynolds number . This number stays below for all simulations - with an exception for some series specifically dedicated to analyzing the role of inertia in section 3.3.
2.4 Suspension Balance Model
The steady-state concentration profile results from the momentum balance in the particle phase, which reads (Morris & Boulay, 1999):
| (2) |
where is the particle stress tensor, of diagonal components . We investigate two configurations in simple homogenous shear: in the first one, gravity is aligned with the shear direction, and the second one with the vorticity direction. They involves the normal viscosity coefficients and , respectively. The above momentum balance leads to the simple equations
| (3) |
where or 3, is the coordinate normalized by the particle size and where we have introduced the Shields number , defined as
| (4) |
Several tentative empirical expressions for this quantity –also called correlations in the literature (Acrivos et al., 1993; Guazzelli & Pouliquen, 2018b)– have been proposed, which generally assume the following form:
| (5) |
where is the volume fraction at which both shear and normal viscosities diverge. (Zarraga et al., 2000) choose , , , and based on previous experimental results of viscous resuspension in a Taylor-Couette geometry (Acrivos et al., 1993). (Morris & Boulay, 1999) obtain , and combining sets of data from large-gap Taylor-Couette and parallel-plate migration experiments. This scaling is very similar to the one proposed by Boyer et al. (Boyer et al., 2011b, a) who derived , and from pressure-imposed shear and rotating rod experiments.
2.5 Viscosity from concentration profiles
The volume fraction profile can be used to determine the normal viscosity directly. Equation 3 can be integrated directly from any position along the resuspended height, which leads to:
| (6) |
Integrating to the infinity or to resuspended height is the same, as the volume fraction is above the resuspended height. This expression is more robust, as it doesn’t require to determine the resuspended height first.
3 Results
3.1 Simple shear
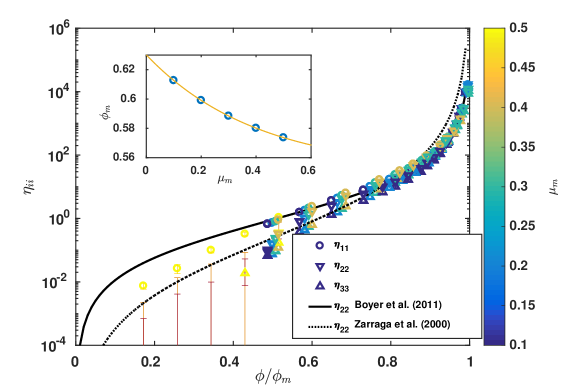
Figure 3 shows the normal viscosities in the three directions as a function of and for various microscopic friction coefficents . has a direct consequence on the maximal volume fraction (Chèvremont et al., 2019). Nevertheless, plotting versus as in Figure 3 suggests an approximate collapse on a single curve independently of . When plotted versus (not shown), such a collapse is not obtained.
For , the viscosity coefficients are ordered like with and close to each other. On the one hand, all viscosities are approximately equal close when approaching the maximum volume fraction, and are well captured by (Boyer et al., 2011b)’s expression, with a divergence. On the other hand, for more dilute suspensions, (Zarraga et al., 2000)’s expression accounts more closely for the data of and . In the more dilute regime, still follows the same trend as (Boyer et al., 2011b)’s expression, whereas and drops quickly to zero. In that case, they are represented by their standard deviation, which is much higher than the mean value. The volume fractions at which and vanish are not the same, as found by other authors (Gallier et al., 2014).
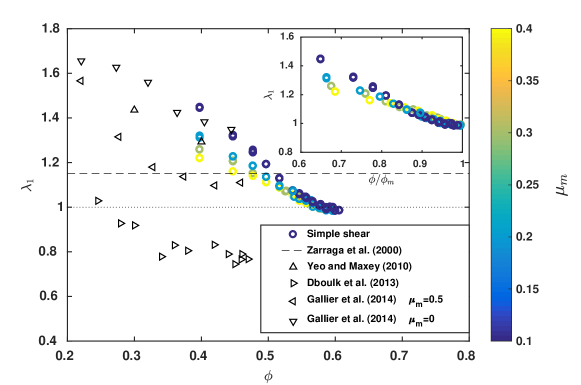
In the following, all stresses are rescaled by , which is experimentally measurable and controllable. The ratio from our results in simple shear and from the literature is plotted on figure 4. Note that rescaling by in that plot does not lead to a single master curve, as shown in the insert. Indeed, this ratio depends on the microscopic friction coefficient. Data from (Gallier et al., 2014) and (Yeo & Maxey, 2010) and relative to two different friction coefficients ( and respectively) are consistent with the present ones. The value of proposed in (Zarraga et al., 2000) is also in the range of our data. On the other hand, the points reflecting measurements by (Dbouk et al., 2013) are outliers (all other points are from numerical simulations).

Figure 5 shows , the ratio between and as a function of , based on literature data, simple shear and resuspension simulations (the latter being detailed in the next section). In contrast with , the results collapses to a single straight line. It means that is independent on the microscopic friction coefficient, and thus on . The present data are also close to the data from the literature, but much less scattered. A linear fit leads to
| (7) |
with , the random close packing volume fraction valid for . This expression vanishes at low volume fraction, as it should remain positive. For practical use in continuum mechanics, it might be more convenient to define a continuous and derivable function. The following expression is proposed to address this issue:
| (8) |
| (9) |
:
| (10) | |||||
| (11) |
It is remarkable that tends to at and that it depends only on . In contrast, as a complex dependency on contact friction through .
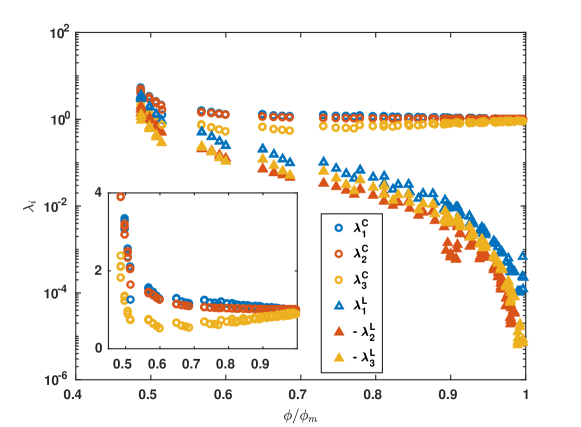
Let us eventually focus on the normal stress decomposition in terms of contact and lubrication. Figure 6 shows the contact and the lubrication forces contributions to each normal stress components. As previously, the stresses are normalized by . In this data set, contacts dominate all normal viscosity components, down to . For the contact contribution, and whereas is smaller. For the lubrication part, we find opposite signs between which is positive, and and which are negative. In the tested range of volume fraction the contribution of lubrication forces to the normal stress remains smaller than that of the contact forces but they are of the same order of magnitude on the dilute side of the range. The fact that the normal viscosities and vanishes at low volume fraction could thus be interpreted as a balance of contact and lubrication forces such that their contribution to stress cancel out.
3.2 Resuspension
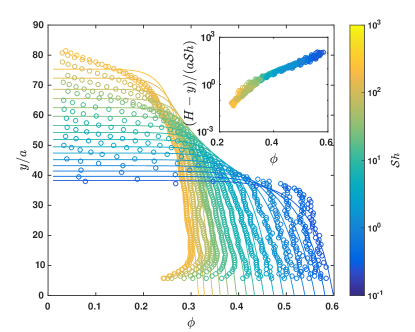
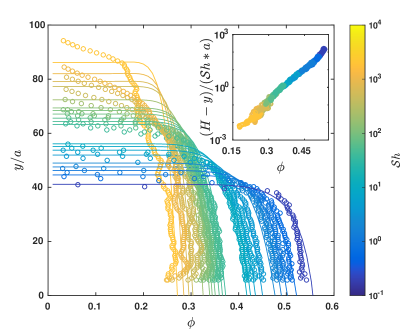
Figure 7 shows the steady state concentration profiles obtained in resuspension, in both the shear and vorticity directions. By increasing the Shield number over several orders of magnitude, the profiles smoothly evolve from a dense settled bed to more dilute layer one of volmume fraction which is typically between 20 and 30%. The layer is approximately homogeneous, but exhibit a small gradient of volume fraction. On the top of this layer, a much larger gradient is found so that the volume fraction quickly vanishes.
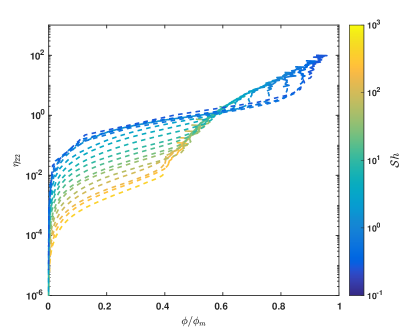
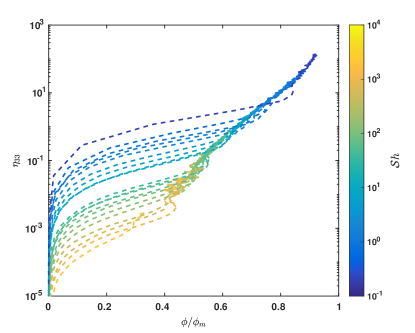
Figure 8 displays the viscosities and computed by integrating all the concentration profiles using equation 6. On this figure, we can see that part of the data (displayed in solid lines) collapse very well on a master curve, whereas another part (displayed in dotted lines) does not. The latter correspond to the top layers of the re-suspended bed, which exhibit a very strong gradient. Indeed the volume fraction abruptly drops to zero on a distance of or even less. It is unsurprising that a homogenized approach cannot explain such an abrupt change in a continuous framework. In the following, we discard for the analysis the data which which corresponds to the top layer, which is taken as 6 particles radius from the interface. By doing so, we obtain also a very collapse of the profiles, once the length is normalized by the single length scale of the problem (in addition to the particle size itself), which is . The resulting collapsed profiles are displayed in insert in figure 7.

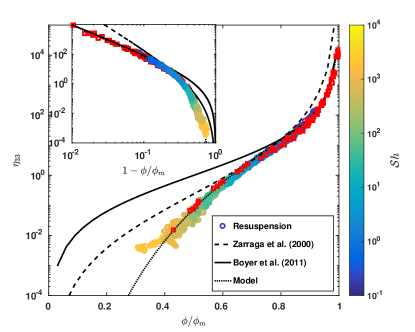
Figures 9 shows the computed viscosities as a function of , with both data from resuspension and from simple shear. The same data are plotted against in the inserts in order to highlight the divergence exponent. A very good agreement is found between the two types of simulations. This clearly shows that the normal stresses indirectly determined in the resuspension tests is the same as the one computed directly in homogeneous shear of a uniform non-buoyant suspension.
Both and exhibit a divergence as the volume fraction approaches the maximal volume fraction, which is well captured by (Boyer et al., 2011a)’s expression for the normal viscosity. For (figure 9a) the expression captures the data rather well down to , but it overestimates the coefficient below that value. The same observation can be made on , in that case however (Zarraga et al., 2000)’s expression is a much better fit for . drops significantly below both empirical expressions as soon as .
As none of the earlier proposed expressions can account for the rapid decay of and below , we propose in the following equations new expressions that fits the data on the entire range of volume fraction. They read
| (12) |
and
| (13) |
Autre suggestion pour (Bruno):
| (14) |
The rather complex form of is coming from the fact that we aimed fits for and (rather than and ) since is very sensitive to the particular expressions chosen (see Fig. 5).
From these expressions, we can check the consistency of the approach by predicting the steady state volume fraction profiles in the two resuspension geometries. For that purpose, we simply integrate equation 3, using the above expressions and imposing the volume of particles to set the integration constant. The resulting volume fraction profiles are superimposed to the numerical data in Fig. 7. The agreement is rather good, except for the highest Shields numbers. This is due to the fact that the volume fraction profiles in viscous resuspension are more sensitive to the particular form of the empiric functions chosen for . Indeed, the normal viscosity coefficients are plotted in Fig. 9 in log scale over 4 orders of magnitude.
3.3 Discussion
3.3.1 Comparison with experimental viscous resuspension data
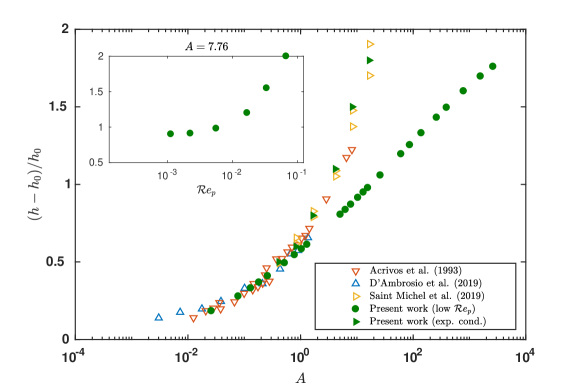
Resuspension in the shear direction with a uniform shear rate is not documented in the literature until now, and it is probably difficult to perform it experimentally. Direct comparisons with three available sets of experiments (Acrivos et al., 1993; Saint-Michel et al., 2019; d’Ambrosio et al., 2021) are possible for resuspension in the vorticity direction, and are presented in this section. We first focus on the height increment induced by resuspension.
In Figure 10 the height increment is presented as a function of the Acrivos parameter , defined by , for the sake of consistency with earlier authors. is proportional to the Shields number (). The simulation results are in excellent agreement with the available data For (). In contrast, a significant discrepancy is found for higher values of , when the mean volume fraction of the bed is less than 35% approximately.
There can be two main reasons for this discrepancy. The first one is coming from the interaction model used in the simulations. Indeed, the viscosity of the suspending fluid is accounted for in the particle interactions via the lubrication terms exclusively while other, non-diverging, hydrodynamic interactions certainly matter in sufficiently dilute regimes. However, previous results (Chèvremont et al., 2019) concluded that, in terms of bulk viscosity, the agreement between well resolved Stokes solutions and a simple lubrication model was rather good down to approximately . It is therefore unlikely that the limits of the models are the main reason for discrepancies which are appear at .
The second possible reason concerns the experimental parameters used in reference (Acrivos et al., 1993) and (Saint-Michel et al., 2019). In the simulations, we paid particular attention to avoid any inertial effects. In particular, the particles Reynolds number, is always below In the experiments, it is not always the case. In particular, we found that the few experimental points which deviate from the simulation results () correspond to particles Reynolds numbers of the order of, or greater than 0.01. We performed additional simulations in this regime (inserts of figure 10), and observed that the resuspension was significantly enhanced. Moreover, when using similar parameters as in (Saint-Michel et al., 2019), the simulation data capture very well the reported suspension height. We can thus conclude that the reason for the apparent discrepancy at high Shields number is due, mainly, to the fact the inertia was not negligible in the experiments. When both simulation and experiments are in the Stokes limit they are in very good agreement.
In the experimental works reported in (Saint-Michel et al., 2019) and (d’Ambrosio et al., 2021), not only the height increment but also the profiles of volume fraction were determined. The normal viscosity coefficient deduced in (Saint-Michel et al., 2019) from these profiles matches equation 5 with (Boyer et al., 2011b)’s parameters. Conversely, (d’Ambrosio et al., 2021) suggest a better agreement with (Zarraga et al., 2000)’s one. The present results highlight that the superior accuracy of one expression entirely depends on the range of considered. Overall, Boyer’s expression is suitable for and (Zarraga et al., 2000)’s one for . They both overestimate the viscosity if . These discrepancies deserve several comments. In both experimental works, the normal stress was found to be shear-thinning, which is not found with the present model. It is thus clear that the experimental systems are physically more complex. As for the previous discussion concerning inertial effects, it is also possible that the transition from a viscous regime (at low ) to an inertial one (at high ) depends on the volume fraction. Possibly, the fact that the low values of the normal stress that we report for were not observed in experiments may come in part from inertial effects increasing the measured stress.
Another clear difficulty encountered in this work is related to the interpretation of the results in the regions with strong gradients of solid fraction. Gradient effects can be expected in experiments too, and the only way to reproduce them numerically would be to replicate the particles in terms of both size and number - which we did not do as it would have required extremely large numbers and prohibitive computation times. Nevertheless, the numerical results give an insight into gradient effects: when the gradient of is greater than a fraction of the inverse of the particle size, it is not possible to collapse the profiles obtained at different Shields numbers.
3.3.2 Normal stress anisotropy
The data reported in this paper unambiguously shows that the so-called normal viscosities are not related by constant coefficients, consistently with a few recent results on smaller datasets (Gallier et al., 2016; Dbouk et al., 2013). In contrast with the assumptions of most SBM models, therefore, both and have to be defined as functions of . For instance varies from 0.2 at to approximately 1 close to .
Interestingly depends on but not on contact friction, whereas depends on both.
3.3.3 Contribution of hydrodynamic forces
In the revisited version of the SBM (Lhuillier, 2009; Nott et al., 2011), it was pointed out that hydrodynamic interactions do not contribute directly to the particle normal stress involved in the momentum balance in the particle phase. Hydrodynamic might however contribute to particle migration through the mean force exerted by the fluid on the particles. The latter can incorporate terms which remains non-zero at steady state, involving volume fraction and shear rate gradients. Here, let us recall that the shear rate is uniform at steady state, hence the mean interphase force results from the gradient of volume fraction alone.
In this work, the normal stresses were determined independently from both homogeneous simple shear and resuspension profiles. Regardless of the direction (vorticity and shear direction), the two approaches lead to very similar estimates. It highlights that the body forces (i.e., at steady state, the weight density) are balanced by the divergence of a stress which combines both the solid contact interactions and the lubrication forces, and none of these contributions can be neglected in general. Interestingly, lubrication and solid contacts contribute with opposite signs to the normal stress: lubrication produces traction and therefore it tends to limit resuspension. For a sharp decrease of the normal stress occurs, which can be understood as a situation where the two contributions cancel out.
4 Conclusions
We reported in this paper numerical data on viscous resuspension of buoyant particles in both the vorticity and the shear direction, together with direct determination of normal stresses in homogeneous shear flow of non-buoyant particles. The resuspension data is in good agreement with experimental results from the literature, and also with the normal stresses obtained in homogeneous conditions. It leads unambiguously to the conclusion that, at steady state, weight is balanced by the divergence of a stress to which both contacts and lubrication contributes.
The accuracy of the results and the large range of volume fraction investigated let empirical expressions be proposed for the normal stress components. These expressions differ significantly from the ones proposed earlier, both qualitatively and quantitatively. First, the normal stress ratio are not constant, they greatly depend on the volume fraction. In the semi-dilute regime the normal stress is much larger in the shear direction than in the vorticity direction. Conversely, a spherical tensor is enough to describe the normal stresses in the concentrated regimes (). Second, none of the earlier proposed expressions can account for the normal stress components in the full range of volume fraction. In particular we find that and decrease sharply below , when contacts and lubrication contributions tend to cancel out. These features were evidenced by the numerical simulations and are reflected in the new empirical relations.
It would be interesting to investigate lower volume fractions, using a more adequate model for the fluid. We only tested homogeneous shear rates configurations, and it seems important to extend this approach to non-homogeneous ones as in many situations (e.g. Poiseuille flow, sediment load), there exists gradient of shear rate which can have consequences on particle migration. Besides, as many recent experimental results report a non-linear dependency of the stress with respect to the shear rate, it seems to be important to incorporate in numerical models additional phenomena such as a variable friction coefficients, long-range interactions or non-Newtonian fluid model.
References
- Acrivos et al. (1993) Acrivos, A, Mauri, Roberto & Fan, X 1993 Shear-induced resuspension in a couette device. Int. j. multip. flow 19 (5), 797–802.
- Boyer et al. (2011a) Boyer, F., Guazzelli, Elisabeth & Pouliquen, Olivier 2011a Unifying suspension and granular rheology. Phys. Rev. Lett. 107 (1888301).
- Boyer et al. (2011b) Boyer, François, Pouliquen, Olivier & Guazzelli, Elisabeth 2011b Dense suspensions in rotating-rod flows: normal stresses and particle migration. J. Fluid Mech. 686, 5–25.
- Chèvremont et al. (2020) Chèvremont, William, Bodiguel, Hugues & Chareyre, Bruno 2020 Simulation of hard spheres suspension: a new contact model. Powder Technol. 372, 600–610.
- Chèvremont et al. (2019) Chèvremont, William, Chareyre, Bruno & Bodiguel, Hugues 2019 Quantitative study of the rheology of frictional suspensions: Influence of friction coefficient in a large range of viscous numbers. Phys. Rev. Fluids 4, 064302.
- d’Ambrosio et al. (2021) d’Ambrosio, Enzo, Blanc, Frédéric & Lemaire, Elisabeth. 2021 Viscous resuspension of non-brownian particles: determination of the concentration profiles and particle normal stresses. J. Fluid Mech. 911, A22.
- Dbouk et al. (2013) Dbouk, T., Lobry, L. & Lemaire, E. 2013 Normal stresses in concentrated non-brownian suspensions. J. Fluid Mech. 715, 239–272.
- Gallier et al. (2016) Gallier, Stany, Lemaire, Elisabeth, Lobry, Laurent & Peters, Francois 2016 Effect of confinement in wall-bounded non-colloidal suspensions. J. Fluid Mech. 799, 100–127.
- Gallier et al. (2014) Gallier, S., Lemaire, E., Peters, F. & Lobry, L. 2014 Rheology of sheared suspensions of rough frictional particles. J. Fluid Mech. 757, 514–549.
- Guazzelli & Pouliquen (2018a) Guazzelli, Elisabeth & Pouliquen, Olivier 2018a Rheology of dense granular suspensions. J. Fluid Mech. 852, P1.
- Guazzelli & Pouliquen (2018b) Guazzelli, Élisabeth & Pouliquen, Olivier 2018b Rheology of dense granular suspensions. J. Fluid Mech. 852.
- Karnis et al. (1966) Karnis, A., Goldsmith, H.L. & Mason, S.G. 1966 The kinetics of flowing dispersions: I. concentrated suspensions of rigid particles. J.of Coll. and Interface Sci. 22 (6), 531 – 553.
- Leighton & Acrivos (1986) Leighton, David & Acrivos, Andreas 1986 Viscous resuspension. Chemi. eng. sci. 41 (6), 1377–1384.
- Lhuillier (2009) Lhuillier, Daniel 2009 Migration of rigid particles in non-brownian viscous suspensions. Phys. Fluids 21 (2), 023302.
- Lyon & Leal (1998) Lyon, M. K. & Leal, L. G. 1998 An experimental study of the motion of concentrated suspensions in two-dimensional channel flow. part 1. monodisperse systems. J. Fluid Mech. 363, 25–56.
- Morris & Boulay (1999) Morris, Jeffrey F & Boulay, Fabienne 1999 Curvilinear flows of noncolloidal suspensions: The role of normal stresses. J. rheol. 43 (5), 1213–1237.
- Norman et al. (2005) Norman, Jay T., Nayak, Hebri V. & Bonnecaze, Roger T. 2005 Migration of buoyant particles in low-reynolds-number pressure-driven flows. J. of Fluid Mech. 523, 1–35.
- Nott & Brady (1994) Nott, Prabhu R & Brady, John F 1994 Pressure-driven flow of suspensions: simulation and theory. J. of Fluid Mech 275, 157–199.
- Nott et al. (2011) Nott, Prabhu R, Guazzelli, Elisabeth & Pouliquen, Olivier 2011 The suspension balance model revisited. Phys. Fluids 23 (4), 043304.
- Phillips et al. (1992) Phillips, Ronald J., Armstrong, Robert C., Brown, Robert A., Graham, Alan L. & Abbott, James R. 1992 A constitutive equation for concentrated suspensions that accounts for shear‐induced particle migration. Phys. Fluids A 4 (1), 30–40.
- Saint-Michel et al. (2019) Saint-Michel, Brice, Manneville, Sébastien, Meeker, Steven, Ovarlez, Guillaume & Bodiguel, Hugues 2019 X-ray radiography of viscous resuspension. Phys. Fluids 31 (10), 103301.
- Sarabian et al. (2019) Sarabian, Mohammad, Firouznia, Mohammadhossein, Metzger, Bloen & Hormozi, Sarah 2019 Fully developed and transient concentration profiles of particulate suspensions sheared in a cylindrical couette cell. J. of Fluid Mech. 862, 659–671.
- Snook et al. (2016) Snook, Braden, Butler, Jason E. & Guazzelli, Élisabeth 2016 Dynamics of shear-induced migration of spherical particles in oscillatory pipe flow. J. of Fluid Mech 786, 128–153.
- Šmilauer & Chareyre (2015) Šmilauer, V. & Chareyre, B. 2015 Dem formulation. In Yade Documentation 2nd ed. The Yade Project, http://yade-dem.org/doc/.
- Yeo & Maxey (2010) Yeo, Kyongmin & Maxey, Martin R. 2010 Simulation of concentrated suspensions using the force-coupling method. J. Comp. Phys. 229 (6), 2401 – 2421.
- Zarraga et al. (2000) Zarraga, Isidro E., Hill, Davide A. & Leighton, David T. 2000 The characterization of the total stress of concentrated suspensions of noncolloidal spheres in newtonian fluids. Journal of Rheology 44 (2), 185–220.