![[Uncaptioned image]](/html/2103.03317/assets/graph/Technical_Leverage.jpg)
Technical Leverage in a Software Ecosystem: Development Opportunities and Security Risks
Authors:
-
Fabio Massacci, University of Trento (IT), Vrije Universiteit Amsterdam (NL)
-
Ivan Pashchenko, University of Trento (IT)
![[Uncaptioned image]](/html/2103.03317/assets/graph/flag-europe.jpg)
This paper was written within the H2020 AssureMOSS project that received funding from the European Union’s Horizon 2020 research and innovation programme under grant agreement No 952647. This paper reflects only the author’s view and the Commission is not responsible for any use that may be made of the information contained therein.
Assurance and certification in secure Multi-party Open Software and Services (AssureMOSS) No single company does master its own national, in-house software. Software is mostly assembled from “the internet” and more than half come from Open Source Software repositories (some in Europe, most elsewhere). Security & privacy assurance, verification and certification techniques designed for large, slow and controlled updates, must now cope with small, continuous changes in weeks, happening in sub-components and decided by third party developers one did not even know they existed. AssureMOSS proposes to switch from process-based to artefact-based security evaluation by supporting all phases of the continuous software lifecycle (Design, Develop, Deploy, Evaluate and back) and their artefacts (Models, Source code, Container images, Services). The key idea is to support mechanisms for lightweigth and scalable screenings applicable automatically to the entire population of software components by Machine intelligent identification of security issues, Sound analysis and verification of changes, Business insight by risk analysis and security evaluation. This approach supports fast-paced development of better software by a new notion: continuous (re)certification. The project will generate also benchmark datasets with thousands of vulnerabilities. AssureMOSS: Open Source Software: Designed Everywhere, Secured in Europe. More information at https://assuremoss.eu.
![[Uncaptioned image]](/html/2103.03317/assets/photos/massacci.jpg)
Fabio Massacci (Phd 1997) is a professor at the University of Trento, Italy, and Vrije Universiteit Amsterdam, The Netherlands. He received the Ten Years Most Influential Paper award by the IEEE Requirements Engineering Conference in 2015. He is the the European Coordinator of the AssureMOSS project. Contact him at fabio.massacci@ieee.org.
![[Uncaptioned image]](/html/2103.03317/assets/photos/pashchenko.jpg)
Ivan Pashchenko (PhD 2019) is a Research Assistant Professor at the University of Trento, Italy. He was awarded a silver medal at the ACM/Microsoft Student Graduate Research Competition at ESEC/FSE. He is UniTrento main contact in “Continuous analysis and correction of secure code” work package for the AssureMOSS project. Contact him at ivan.pashchenko@unitn.it.
How to cite this paper:
-
•
Massacci, F. and Pashchenko, I. Technical Leverage in a Software Ecosystem: Development Opportunities and Security Risks. Proceedings of the International Conference on Software Engineering (ICSE 2021). IEEE Press.
License:
-
•
This article is made available with a perpetual, non-exclusive, non-commercial license to distribute.
-
•
The graphical abstract is an artwork by Anna Formilan.
Technical Leverage in a Software Ecosystem: Development Opportunities and Security Risks
Abstract
In finance, leverage is the ratio between assets borrowed from others and one’s own assets. A matching situation is present in software: by using free open-source software (FOSS) libraries a developer leverages on other people’s code to multiply the offered functionalities with a much smaller own codebase. In finance as in software, leverage magnifies profits when returns from borrowing exceed costs of integration, but it may also magnify losses, in particular in the presence of security vulnerabilities. We aim to understand the level of technical leverage in the FOSS ecosystem and whether it can be a potential source of security vulnerabilities. Also, we introduce two metrics change distance and change direction to capture the amount and the evolution of the dependency on third-party libraries.
The application of the proposed metrics on 8494 distinct library versions from the FOSS Maven-based Java libraries shows that small and medium libraries (less than 100KLoC) have disproportionately more leverage on FOSS dependencies in comparison to large libraries. We show that leverage pays off as leveraged libraries only add a 4% delay in the time interval between library releases while providing four times more code than their own. However, libraries with such leverage (i.e., 75% of libraries in our sample) also have 1.6 higher odds of being vulnerable in comparison to the libraries with lower leverage.
We provide an online demo for computing the proposed metrics for real-world software libraries available under the following URL: https://techleverage.eu/.
Index Terms:
software security, dependencies, vulnerabilities, leverage, technical debt, empirical analysis, maven, free open source softwareI Introduction
Finance and software have always found interesting correspondences between concepts [1]. For example, the notion of technical debt captures the short-term developers’ action (actually inaction to fix) that may lead to a later cost of maintenance [2]. Most academic studies (see a review in [3]) only consider poorly written own code of a project as a source of a technical debt for a software project. At the Dagstuhl Seminar 16162, researchers reviewed and consolidated the view on technical debt [2] to clearly limit its scope to the “internal system qualities” of a software project.
Nowadays developers often import functionality from third-party free open-source software (FOSS) libraries by including them into their projects as dependencies [4, 5, 6]. Such software engineering practice allows developers to use FOSS libraries as building blocks, and therefore, reduce development cost and time [7]. Even for proprietary software, the fraction of homegrown code decreased to 5%[8]. Industry reports show that third party code inherited through dependencies is four times larger than the size of the own code base as an industry average [9]. It can be up to four orders of magnitude in our FOSS sample.
To capture this phenomenon, we introduce the notion of technical leverage to assess the dependence on third-party functionalities. Similarly to the financial ratio between debt (other people’s money) and equity (one’s own money), leverage is the ratio between third party code and one’s own code.
Additionally, we introduce the change distance and change direction metrics to measure the qualitative changes of a library between two consecutive versions. These metrics capture the polar coordinates of the changes in the plane described by the sizes of own code and third party code. An angle of 90 degrees means that in the new version the developer is improving its own ‘capital’ (i.e., code) while keeping the same third party code on which is old version is leveraged.
Since developers have different strategies [10], we are interested to check whether the proposed metrics characterizes in some way the FOSS ecosystem. For example, developers of a small library may want to increase functionality of their library as fast as possible, while developers of a mature and large library (i.e., with more than 100KLoC) might likely focus on fixing bugs and vulnerabilities and refining functionalities.
-
RQ1:
Is there a difference in leverage, distance and direction of changes between small and large libraries?
The next two research questions focus on the trade-off between risk and opportunity that leverage may bring. For example, a large leverage means that several libraries are used and they might require integration and update costs. Indeed, developers often decide not to update the third party libraries they are using [11, 12] due to the possibility of introducing incompatible, breaking changes [10]. Thus leverage might significantly delay the releases of one’s own code. If that happened, the opportunity of leverage would turn out to be not a real opportunity but only an illusion since the time interval between library releases is linked to profitability [13] and costs [14].
-
RQ2 - Opportunity:
do leverage, distance, and direction of changes impact the time interval between library releases?
On the risk side, using many libraries increases the attack surface, and third-party libraries are known to introduce functionality bugs and security vulnerabilities into the projects that use them [15, 12]. In some cases, dependent projects keep using outdated components for a decade or more [16] thus increasing also the window of possible exploitations.
-
RQ3 - Risk:
does leverage, distance and direction of changes impact the risk of including vulnerabilities?
To answer the RQs above, we applied the proposed metrics to more than 10K distinct library instances used in the FOSS Java Maven-based ecosystem distinguishing between large libraries (over 100KLoC) and small-medium libraries.
Summary of Findings Our analysis suggests that small-medium libraries (less than 100KLoC) have a high leverage on third-party FOSS dependencies and their developers prefer to adopt new dependencies (change direction at 0 degrees). Large libraries have far smaller leverage and their developers mostly increase their own code. The proposed metrics also partly explain the time interval between library releases but even a large leverage (more than 4 times one’s own code, which is present in 75% of the small and medium libraries in our sample) yield a very minimal change to such interval (less than 4%). Leverage is thus a concrete opportunity for the developers of a library. Yet, a large leverage also increases the odds ratio of shipping code with vulnerabilities by 60%. So leverage is an equally concrete risk for the users of the library.
Such findings bring new challenges for empirical software engineering (your ‘software’ and hence its quality depends way more from your choices of third party libraries than your coding) and software security economics (code users bear the risk while code developers reap the benefits).
II Terminology
We rely on the terminology established among practitioners (e.g., the users of Apache Maven) and consolidated in [12]:
-
•
A library is a separately distributed software component, typically consisting of a logically grouped set of classes (objects) or methods (functions). To avoid ambiguity, we refer to a specific version of a library as a library instance.
-
•
A dependency is a library instance whose functionalities are used by another library instance (dependent instance).
-
•
A direct dependency is directly invoked from the dependent library instance.
-
•
A dependency tree is a representation of a library instance where each node is a library instance and edges connect dependent library instances to their direct dependencies.
-
•
A transitive dependency of a library instance at a root of a dependency tree is connected to the root library through a path with more than one edge.
-
•
A project is a set of libraries developed and/or maintained together by a group of developers. Dependencies belonging to the same project of the dependent library instance are own dependencies, while library instances maintained by other projects are third-party dependencies.
Additionally, for each library instance in our sample we identify the following dimensions that characterize a library:
-
•
Own code size () as the number of lines of own code in the files of a library.
-
•
Dependency code size () as the sum of the lines of code of third-party direct dependencies () and transitive dependencies () of a library
-
•
Total code size () as the sum of the two.
The qualifier ‘third party’ is important as noted by Pashchenko et al. [12]: for convenience, developers might have decided to structure their own code in separate libraries. They might be mistakenly counted as other people’s code while in reality is developed within the same project and by the same developers, hence, should be counted as own code. As an example one could refer to Scala libraries.
Software projects always leverage some functionality from standard libraries of the programming language, so that one should consider also the size of the the baseline of programming language libraries .
III Technical Leverage
To capture the effect of software dependencies on the dependent projects, we introduce the notion of technical leverage:
Definition.
The technical leverage of a library is the ratio between the size of code imported from third-party libraries besides the baseline of programming language libraries and the own code size of the library:
| (1) |
In our empirical analysis, the programming language/platform is the same over all libraries (Java and Maven) so . If one wanted to compare libraries across different ecosystems (e.g. Python vs C libraries) the difference can be significant. Further, standard libraries are typically more mature than a third party library and splitting leverage by type might be needed for a more fine grained analysis. This is also done in finance where one distinguishes between different type of debts.
Similarly to Allman [17], who drew parallels between technical and monetary debts, we illustrate the similarities between financial and technical leverages in Table I.
| Financial leverage | Technical leverage |
|---|---|
| Financial leverage is used to undertake some investment or project with the help of borrowed money (debt) | Software developers reuse already existing functionality from dependencies to focus only on new features in their projects |
| Financial leverage decreases the corporate income tax liability and increases its after-tax operating earning [18] | Using dependencies reduce the time (and thus, cost) to develop new projects [19, 20] and sometimes increase project performance (e.g., numpy or pandas in Python) |
| The debt implies an interest rate [18] and must be eventually paid or refinanced (an observation not present in [17]) | Dependencies have to be monitored and updated (the concept similar to refinancing one’s monetary debt) unless one introduces security vulnerabilities [12, 15] |
| Financial leverage multiplies losses as well, which might lead to a crisis [21] | If the amount of work required for the dependent project to update its dependencies become too high, the developers might decide to stop updating dependencies and experience serious technical difficulties [10] |
Additionally, the project maintenance routine requires developers to assess whether they have to update dependencies of their project, i.e., to evaluate the difference between different versions of the same library. To facilitate this process and help developers to have more meaningful comparison of changes occurred between two library versions, we propose to use change velocity vectors (Figure 1).
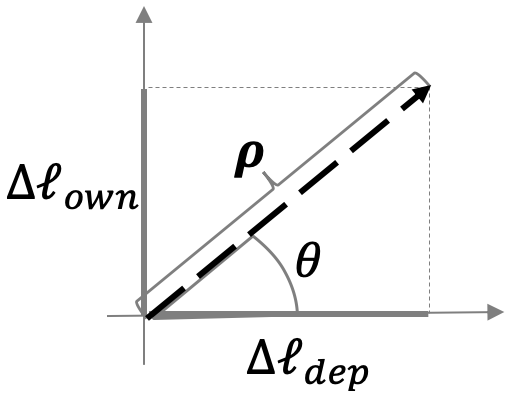
Definition.
Change Velocity Vector characterizes how a library changes between releases and with respect to the size of its dependencies and its own size:
| (2) |
In particular, the library development behavior can be qualitatively described using polar coordinates of the change velocity vector and . We use them to introduce the notions of change direction and change distance.
Definition.
The change distance characterizes the amount of change in code size between two consecutive library version.
| (3) |
Albeit still measured in KLoC, this is obviously different than the pure change in the code base captured by . Table II and Table IV, later in Section IV, show that is on average larger than the library total size .
Definition.
The change direction characterizes the type of evolution of a library between two consecutive versions.111Formally, when we assume that . Experimentally, is never zero as some changes are always present when one releases a new version.
| (4) |
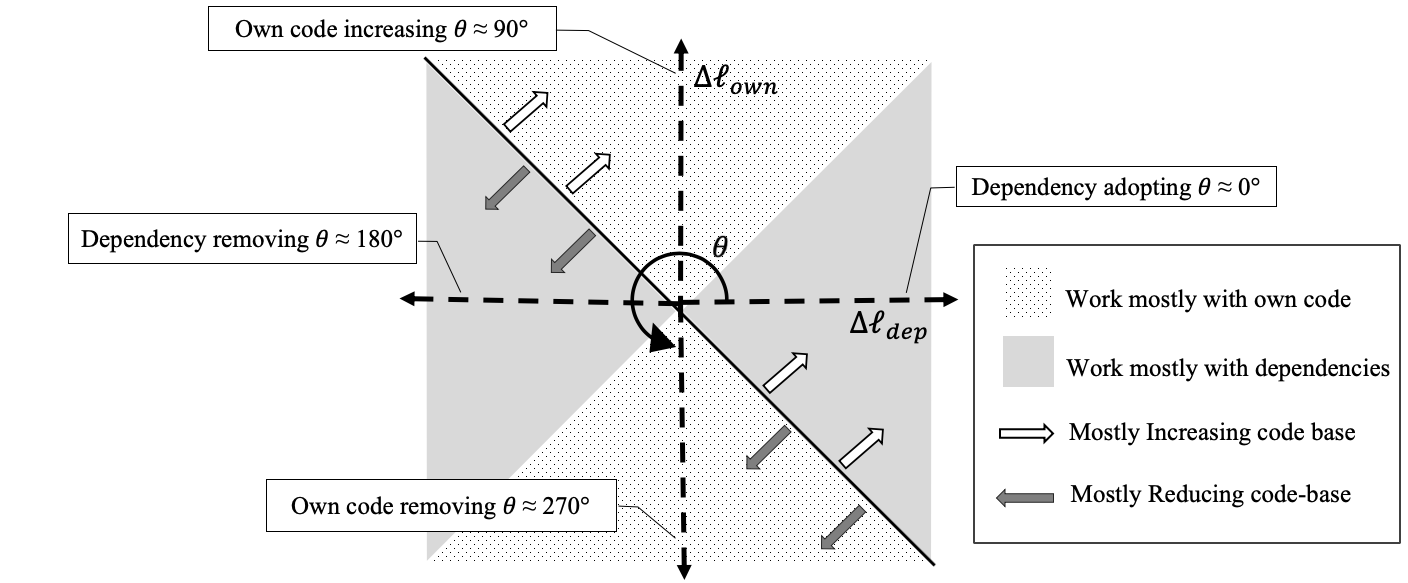
Considering different values of , we identify four main directions of a library evolution (Figure 1):
-
•
Dependency adopting () - software developers increase the size of library dependencies, while not changing its own size:
-
•
Own size increasing () - developers do not change the dependency size, while increasing its own size:
-
•
Dependency removing () - software developers decrease the dependency size, while not changing its own size:
-
•
Own code removing () - developers do not change the dependency size, while decreasing own size of their libraries:
Combination of these library evolution directions can describe every change of a library. For example, if both own and dependency sizes increase between two library releases (), one may say that its developers both adopt new dependencies and perform self-development of this library. Hence, we qualitatively classify developers’ actions as follows:
Moreover, the change velocity angle indicates whether developers increase or decrease the total size of their libraries:
-
•
– developers increase total size
-
•
– developers decrease total size
IV Data selection
For the study of the FOSS ecosystem, we have selected the Maven ecosystem. We use the information directly available from the dependency management system. The FOSS libraries distributed via Apache Maven are published on the Maven Central Software Repository222https://repo.maven.apache.org/maven2/, that keeps all the publicly released versions of its libraries, i.e., their packages (for example, jar), project object model files (pom-files), and, often, some extra information, such as source code of a library or its documentation (JavaDoc). Maven also provides a Dependency plug-in, that allows us to retrieve a list of dependencies of a particular library instance.
In this study, we use only direct dependencies, since developers have a habit of reacting to the issues connected with the own code of their libraries or their direct dependencies [22, 10]. Moreover, including the analysis of transitive dependencies increases the chance of introducing additional biases as transitive vulnerabilities are known to be overcounted [12, 23]. We do not preclude the analysis of transitive dependencies as they are known to introduce security vulnerabilities to some extent [9, 24, 15]. Proper understanding of their effects requires networks and contagion analysis [25], an interesting challenge for future work (Section X).
To identify the relevant ‘main libraries’ and compute their leverage one needs a reference point (anchor) selected from the outside of the analysed ecosystem. Indeed, just using the number of usages of within Maven itself would have been severely biased as it would not correspond to the popularity of the software in the world (which is what makes the study interesting), but only to the internal use. Hence, selecting an anchor from within an ecosystem, we would have some important libraries (e.g., Apache Tomcat) underrepresented in the library sample, while several service libraries (which nobody really uses) would have been disproportionately selected.
Hence, we follow [26] and started from the top 200 FOSS Maven-based libraries used by a large software manufacturer across over 500 Java projects (actual customers products or production-level software developed by the company for internal use). The resulting set corresponds to 10905 library instances when considering all versions and includes widely used libraries such as org.slf4j:slf4j-api and org.apache.httpcomponents:httpclient.
We consider 8464 distinct library versions (GAVs - Group, Artifact, Version coordinate in Maven Terminology) starting from the 200 most popular FOSS Java libraries (GA) used by a multinational software development company in its customers or internal production-level software and removing the library versions that have no source code in Maven Central.
| mean | st.dev | min | median | max | |||
|---|---|---|---|---|---|---|---|
| #lib versions | 55 | 49 | 1 | 15 | 35 | 87 | 248 |
| #direct deps | 4 | 7 | 0 | 0 | 2 | 6 | 51 |
| (KLoC) | 37 | 56 | 2 | 5 | 15 | 42 | 350 |
| (KLoC) | 591 | 764 | 0 | 69 | 302 | 828 | 4489 |
| rel_interval (days) | 41 | 94 | 0 | 1 | 22 | 47 | 2235 |
Algorithm 1 is used to identify the own size of a library instance. To calculate the size of library dependencies, we recursively apply the Algorithm 1 to each dependency and then sum the resulting number of lines of code (LoCs).
For some library instances (or their dependencies) there was no source code available, so we removed them from our analysis. We have also removed 555 library versions with own size lines of code as these library versions do not carry actual functionality but only serve as APIs or documentations for other libraries. The final list comprises 8464 library instances. Table II presents the descriptive statistics of the selected library sample.
Developers of some libraries maintain several versions of the library at the same time333In our sample, 570 libraries supported several versions simultaneously for a total of 15814 chains.. For example, the developers of Apache Tomcat444http://tomcat.apache.org/ project supported four versions (7.0.x, 8.0.x, 8.5.x, and 9.0.x) of org.apache.tomcat:tomcat-catalina library for the last three years (starting from March, 2016). These parallel versions might introduce errors into the analysis results if date ordering of library releases is used. Ordering versions by date we obtain: 8.5.30->9.0.7->7.0.86->8.0.51->9.0.8->8.5.31 because versions are released in groups (typically a simultaneous fix of bugs): 8.5.30 and 9.0.7 were released within 17 minutes. Hence, before the analysis we have distinguished release chains according to Algorithm 2.
To estimate security risks, we use the presence of a security vulnerability that affects the analysed library. Here, we consider only vulnerabilities that affect the own code of analysed libraries for the quality assessment and not the one coming through transitive dependencies. In other words, when claiming that a library is vulnerable we will only count the library own vulnerabilities and the vulnerabilities of the direct dependencies (which would be own vulnerabilities for each dependency). At first, this avoids double counting (as the same library may be transitively included several times). Second, the presence of vulnerabilities in the direct dependencies is a knowledge available to a developer. Thus, there is a potentially deliberate choice of selecting a new vulnerable direct dependency or keeping vulnerable dependencies outdated [10].
To identify whether the own code of a library is affected by vulnerabilities, we used the Snyk database555https://snyk.io/vuln that is constantly updated and for August 2020 contains data about more than 3900 vulnerabilities on the Maven based libraries. Each entry in the database contains the information about a security vulnerability; the library, which own code is affected by the vulnerability; and the range of affected library versions. Table III shows the descriptive statistics of vulnerabilities per individual library in the selected library sample.
| mean | st.dev | min | median | max | |||
|---|---|---|---|---|---|---|---|
| #vulns/own | 2 | 5 | 0 | 0 | 0 | 1 | 43 |
| #vulns/dep | 8 | 10 | 0 | 0 | 3 | 13 | 63 |
Finally, Table IV shows the descriptive statistics of the proposed metrics for the selected library sample.
We report the values of the introduced metrics for the 8464 library instance in our sample for which source code could be extracted and had at least 100 lines of own code (i.e. where not clearly just APIs for other libraries).
| mean | median | st.dev | min | max | |||
|---|---|---|---|---|---|---|---|
| 2489 | 22 | 21775 | 0 | 373195 | 4 | 74 | |
| (KLoC) | 98 | 8 | 284 | 0 | 3480 | 0.71 | 66 |
| (degrees) | 81 | 31 | 91 | -45 | 315 | 0 | 180 |
In the Section VII, we will use a leverage of four as a running example for the impact of direct leverage on small and medium libraries which is the reported value for industry average [9], it is the value for Q25% in our sample (Table IV), and corresponds to the log-mid point between a leverage of 1 (almost all libraries are above it) and 16 (over half of the the libraries are above it) as visible from Figure 2. The equivalent number for big libraries would be 12.5% (log mid point between the median direct leverage of 50% and the bottom line of 1%).
V RQ1: Difference in direct leverage and direction of changes between libraries
Several studies [27, 28, 29] suggested that a software project might have different development practices depending on its size. Hence, we present results separately for small-medium libraries whose code size does not exceed 100K lines of code (KLoCs) and large libraries that have more than 100 KLoCs.
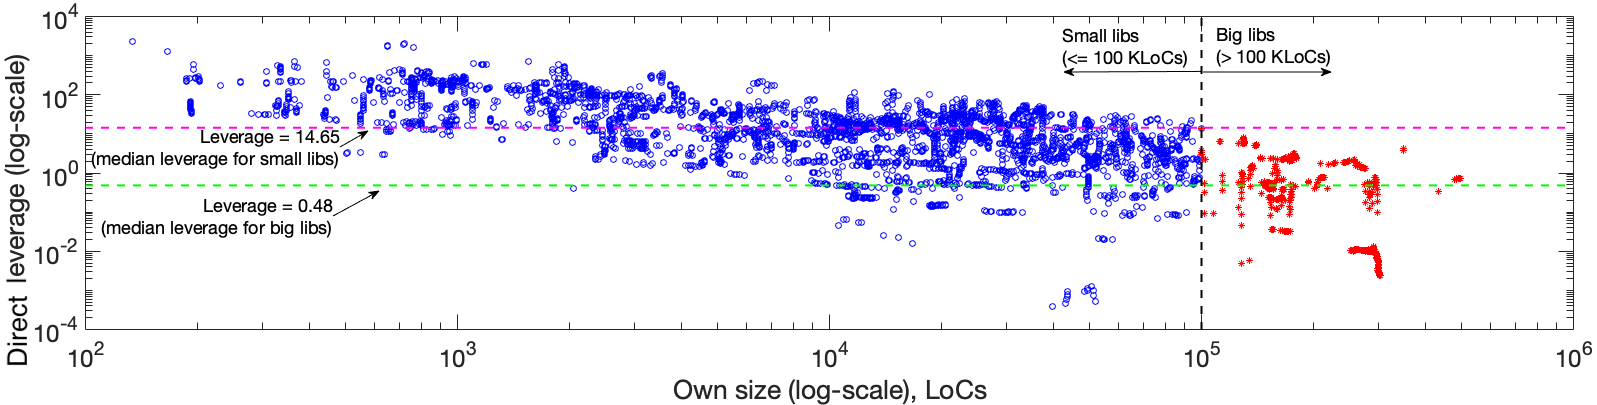
Developers of relatively small software libraries (with own size smaller than 100 KLoCs) almost always ship more code than their own direct leverage > 1). For the majority, their own code is only a small fraction of the overall codebase (less than 6%, corresponding to a median direct leverage of 15). In other words, they ship mostly somebody else code. The direct leverage of large libraries (> 100 KLoCs) is typically much smaller than the size of their own code and hardly exceed 2, corresponding to at least 33% of own code.
As we observe from Table II, FOSS developers widely adopt dependencies to reduce their development effort. This especially applies for the small-medium libraries with a code base less than 100 KLoCs (Figure 2): we observe that library instances use a large code base of direct dependencies that may 10.000 times exceed their own size and 50% of small-medium libraries rely on 14.65 times bigger code base of their direct dependencies (), which is bigger than the direct technical leverage of any library in our sample with own size exceeding 100 KLoCs.
The increase of the own size of a library obviously leads to a decrease in its leverage: the Pearson correlation test [30] suggests that there exists linear negative correlation between and (). From the selected library sample, 50% of big libraries have direct technical leverage less than half of their own size (), including several libraries that have 10.000 times smaller size of software dependencies.
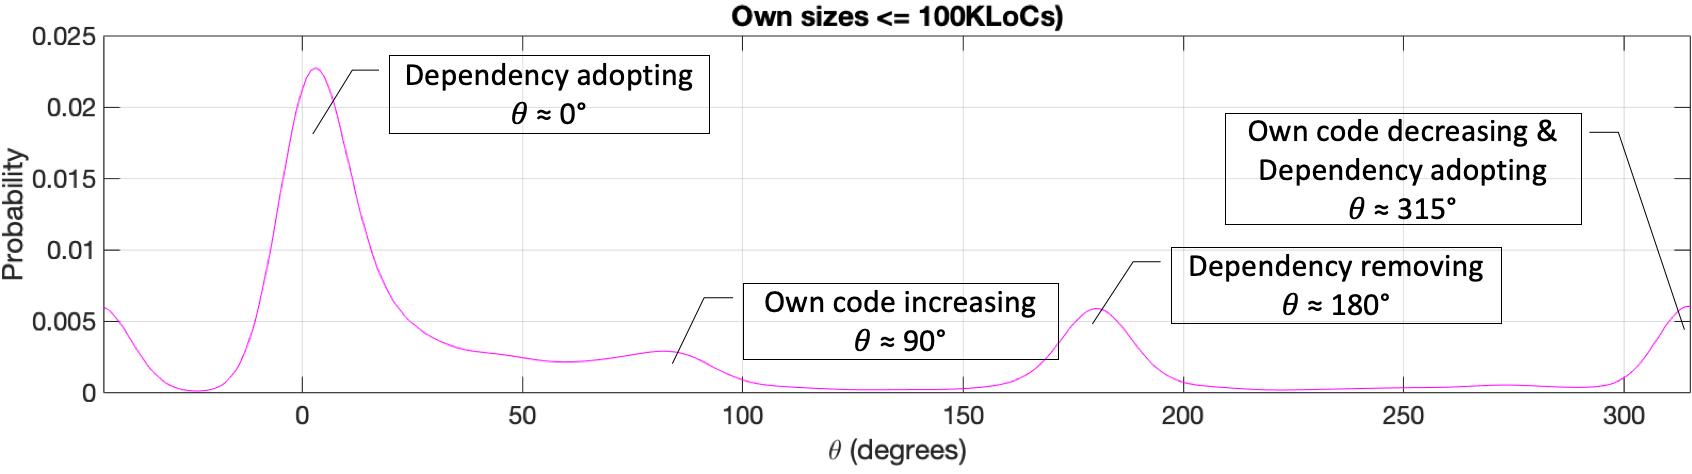
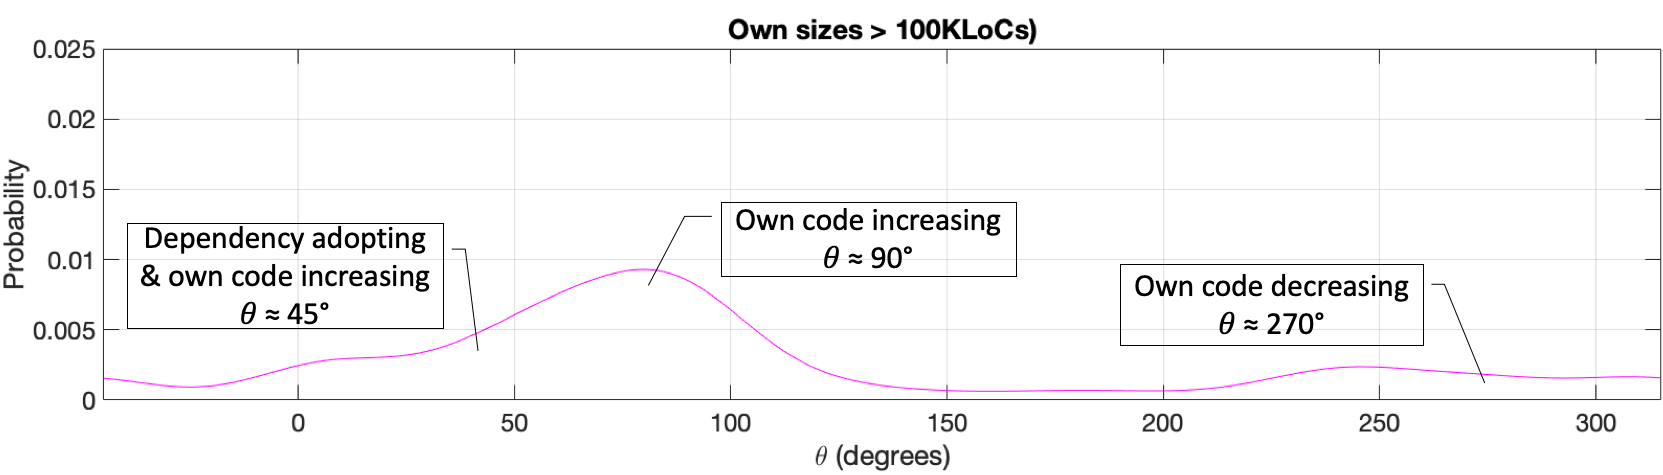
Considering the kernel density estimation (KDE) plot for the change velocity angle for the libraries in our sample (Figure 3), we observe the following:
-
•
small-medium libraries () (Figure 3a): the developers mostly prefer to adopt third-party dependencies (the pick around ), rather than focus only on increasing the code of their own libraries (the KDE for is less than 0.005). Sometimes developers also reduce the size of their dependencies and/or optimize the size of their libraries (the KDE for and for are higher 0.005).
-
•
large libraries () (Figure 3b): the developers tend to increase the size of their libraries (the KDE for is 0.010), however, the maximum KDE value for the large libraries is more than 2 times lower than the maximum KDE for the small-medium libraries. Moreover, we observe that the developers also sometimes adopt new dependencies but they simultaneously increase own code of their libraries (the KDE for is around 0.005). Sometimes developers of big libraries also optimize their libraries by reducing their own code and the code of their dependencies (a pick around ).
Discussion: Both analysis of direct leverage and change direction suggest that the developers of small and medium libraries rely on functionality of third-party FOSS dependencies. This corresponds to a general intuition since the third-party dependencies allow small libraries to grow faster. Too many dependencies might become difficult to manage, which exposes dependent libraries to bugs and security vulnerabilities introduced by library dependencies. Hence, developers of bigger (and consequently more mature) libraries tend to decrease the direct leverage of their libraries on third-party dependencies: the negative linear correlation between and (Figure 2) and a shift of development preferences from dependency adopting in small and medium libraries to mostly increasing the own code for large libraries (Figure 3).
Key Takeaway: small-medium libraries by far ship other people’s code, and at each round they add more.
VI RQ2: Does direct leverage impact time interval between library releases?
Big software projects typically involve developers working in parallel [29] to increase the speed of development. To capture this phenomena, we will use as the dependent variable for the regression. We add ‘’ to a time interval between library releases to correct for the approximate granularity in the measurement as in some cases releases happen on the same day (although at different times).
A large direct leverage means that a library mostly relies on the work of other developers. So we expect that direct leverage and library release time interval have a proportional relation rather than a linear one. Since we define as a fraction of dependency and own size of a library, we could use directly in the regression. However, this would mean that moving direct leverage by a factor of 10 would yield an exponential jump in a time interval between library releases. However, we observe that direct leverage spans eight orders of magnitude (Fig 2) while the leverage coefficient in Table V suggests that a change in magnitude in direct leverage (aka, ‘effect of scale’) does not determine a proportional change in the time interval between library releases, only a small linear change. Therefore, we use for the regression.
We expect that the change distance in own and dependency sizes will mostly require an increase of the time to test the added functionality into a new library version, i.e. a ‘returns to scale’ effect. Hence, we use ) for the regression. Notice that as a new release always implies some changes.
Change direction indicates (i) how developers change the total size of their libraries (increase or decrease) and (ii) whether they mostly change a library’s own code or its dependencies. To capture the effect of change in the total code size, we consider the following:
-
•
and correspond to change in , while and indicates max change in
-
•
increases when and decreases when .
To consider these effects into the regression, we introduce the transformation of the change direction metric.
If developers change own code of their libraries they have to both develop and test their projects. On the other hand, the change of library dependencies in most cases require only testing of dependent projects. To capture these effects into the regression, we consider the values of that indicate whether developers work with dependencies or own code of their libraries and introduce the transformation of the change direction metric666One might argue that and correlate, and therefore, could not be used as variables into a linear regression. However, Eubak and Speckman [31] proved that and can be used simultaneously in a linear regression model and can be transformed in a linear combination of and ..
Finally, we consider the time interval between the previous release and its preceding one with the corresponding transformations as for the current time interval between library releases into the regression to capture the impact of project release practices (e.g., bi-/weekly/daily releases).
We use the multivariate linear regression model [32] to check the correlation between the proposed metrics and the time interval between library releases. The previous discussion clarifies how the transformations above may help towards a linear regression model as the direct relation between the proposed metrics and the estimated parameters might not be necessarily linear (e.g., consider the example of Figure 2).
The resulted linear regression model has the following form:
| (5) | |||||
Table V shows the estimates, standard errors, t-statistics, and p-values for both small-medium and large libraries. We observe that for the libraries with own code smaller than 100 KLoCs all metrics have significant impact on the time interval between library releases (), Direct leverage, the change in total code, and previous release have positive correlation with the release time interval of a library, while the change distance and change in own code correlate negatively with such interval. For large libraries, the change distance and time interval between the previous and its preceding releases have significant impact on time interval between library releases ().
These are the result of the regressions . For small and medium libraries with own_size smaller than 100 KLoCs there is root mean squared error = 1.68; and . For large libraries with own_size greater than 100 KLoCs the root mean squared error = 1.53, , and .
| release time interval | Small-Medium Libraries | Large Libraries 100KLoC | |||||||
|---|---|---|---|---|---|---|---|---|---|
| coefficients | estimate | std.err. | tStat | p-value | estimate | std.err. | tStat | p-value | |
| intercept | 1 | 2,847 | 0,1 | 28,413 | 0 | 3,849 | 0,389 | 9,886 | 0 |
| direct leverage | 0,059 | 0,012 | 4,849 | 0 | -0,002 | 0,041 | -0,041 | 0,968 | |
| change distance | -0,072 | 0,01 | -7,022 | 0 | -0,147 | 0,036 | -4,091 | 0 | |
| change in total code | 0,492 | 0,07 | 7,011 | 0 | -0,182 | 0,219 | -0,829 | 0,408 | |
| change in own code | -0,355 | 0,075 | -4,709 | 0 | 0,237 | 0,244 | 0,97 | 0,333 | |
| previous release interval | 0,083 | 0,016 | 5,033 | 0 | -0,131 | 0,055 | -2,36 | 0,019 | |
Discussion. The increase of change distance corresponds to a slight decrease in the time interval between library releases. Such change is minor in quantity: when change distance doubles, such interval decreases only by 7%. Since the size of is mostly determined by dependencies, this observation shows that adopting dependencies speed up the evolution of a library in spite of large (implicit) changes to the code base.
What makes the difference is the type of changes. For small libraries, changing in the regression) lengthen the time interval between library releases. Most likely, we observe such an effect, since the change in total code base means the major functionality changes (e.g., addition of new functionality). In contrast, when developers focus on own code of their libraries, such interval reduces by 35% – the developers are likely fixing bugs and vulnerabilities in their libraries, which might be of a higher priority due to the necessity to ship the fixed version to the library users. A qualitative study might yield more insights into such changes.
VI-A Does direct technical leverage pay off?
To understand the practical implication of direct technical leverage, we analyze further the impact of the coefficient of direct technical leverage in (5).
Since the coefficient is positive, having a large direct leverage increases the time interval between releases of a small-medium library: having too many dependencies might require additional time for the library developers to manage them. However, the value of the coefficient is small, and therefore, a more precise estimation is needed.
Let the and the be two release time intervals of libraries that are separated by a leverage factor of , i.e. . From the regression we can reconstruct the following (approximate) relation:
which can be simplified to
| (6) |
Considering the estimates in Table V, for a library with own code and direct technical leverage of four (the size of its direct dependencies is four times bigger than its own size), the delay in the time interval between library releases in days will be less than 4%. So, leveraging on third-party libraries pays off: you add 4x more code at the price of a small delay in your release time interval (around two days on average). Even if you have many dependencies (e.g. , , slightly above the median for small libraries, and your own code is essentially 6% of the total code size), the time interval between library releases only increases by 17% (around a week considering the average time interval in Table II).
Key Takeaway: Direct leverage pays off. Shipping an overall project four times larger than your own code base will only take a couple of extra days (on average).
VII RQ3: Does direct leverage increase security risk?
In medicine, the effect of a parameter on a rare disease is described by the odds ratio of a disease [33]. We use the to have a first understanding of the impact of leverage on the security risk777As we only know reported vulnerabilities for the dependencies in our sample (as vulnerabilities might be present but might not have been found yet), we cannot use the risk ratio. However, since vulnerabilities are rare, the OR approximates the risk ratio [34]. of using a library, by mapping (i) the fact that at least one vulnerability affects a software library onto ‘Disease’ and (ii) the condition that the direct technical leverage exceeds our running example value for leverage (four for small libraries) onto the state of ‘Exposure’:
| (7) |
Table VI shows the contingency table where we use our running example for small and medium libraries (own code - median direct leverage around 16) and for large libraries (own code - median direct leverage around 50%). The corresponding library groups have the following odds ratio: , confidence interval . For big libraries the with confidence interval . Fisher Exact test [35] for both small-medium and big libraries rejects (, ).
For small and medium libraries, the larger the direct leverage the larger the risk of being vulnerable (). For large libraries (own code ), the risk is inverted, the more own code the more likely to be vulnerable ().
| Small libraries | Big libraries | ||||
|---|---|---|---|---|---|
| vuln | not vuln | vuln | not vuln | ||
| 716 | 2154 | 194 | 74 | ||
| 121 | 587 | 73 | 12 | ||
These results confirm our intuition: the more you increase your total code size, the more likely you are to step into a vulnerability. The major difference is that for small and medium libraries some of these vulnerabilities are most likely in other people’s code and therefore out of control of the developer.
Since a vulnerable library has normally more than one vulnerability (see Table III), it is interesting to understand whether the number of vulnerabilities change with leverage888From a user’s perspective the library (GA in Maven’s terminology) is the ‘same’, it is just a ‘different version‘ (GAV in Maven’s terminology).. Further, a library may have different level of leverage from version to version while the number of vulnerabilities may remain unchanged. These two facts are due to the phenomenon that some vulnerabilities are in the third party code (in dependencies) that requires developers of these dependencies to release a fixed version of a dependency. In other words, developers might have added a new library (left-most peak in Figure 3) while keeping an old version of another dependency.
Figure 4 shows the distributions of maximum direct leverage per library in time grouped by the number of vulnerabilities that affect that library (intended as a GA). Our running example threshold (leverage equal to four) provides clear visual separation of the exposed and not exposed libraries (i.e., libraries with high direct leverage are more likely to be exposed to a security vulnerability. The exception in Figure 4 are the libraries with a high number of vulnerabilities (extreme right) but a direct leverage lower than 4. They are the big libraries ( LoCs) which are anyway exposed to the big number of vulnerabilities due to the large own size. Hence, the direct leverage metric has a potential to be used as an indicator for a library to be exposed to security vulnerabilities. Further investigations are worth pursuing.
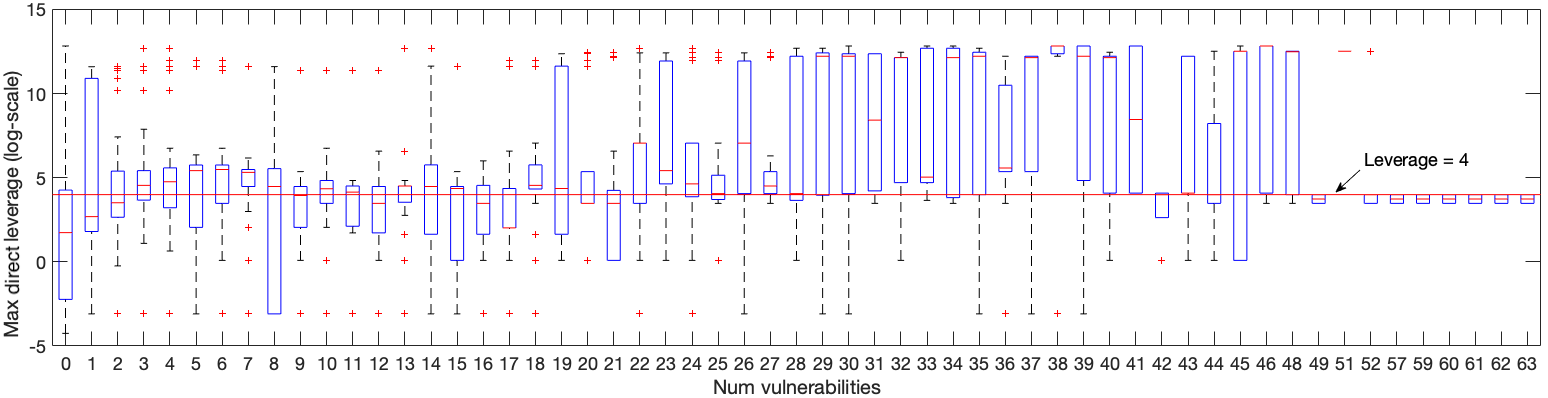
Direct leverage equal to 4 allows visual separation between the libraries exposed to high number of vulnerabilities vs libraries exposed to a small number of security vulnerabilities in our library sample. The only excpetion are the handful of libraries at the extreme right. They are libraries with large own code base LoCs which are always affected by security vulnerabilities just because of their size.
Figure 5 shows the relation between direct leverage and direction of library changes (). We observe that small-medium libraries (own code 100 KLoCs) with are more likely to be vulnerable. Such libraries either include/remove functionality from software dependencies or increase their own code base, and therefore, are likely to be under active development. In contract, there are less vulnerable small libraries with . Such libraries decrease the size of their own code, and therefore, they are likely to review the already developed functionality instead of developing new features (i.e., to be mature). Visual analysis of the direct leverage–change direction relation plots for libraries with own code suggests that in case of a big library there always exists a chance that its own code is affected by a security vulnerability.
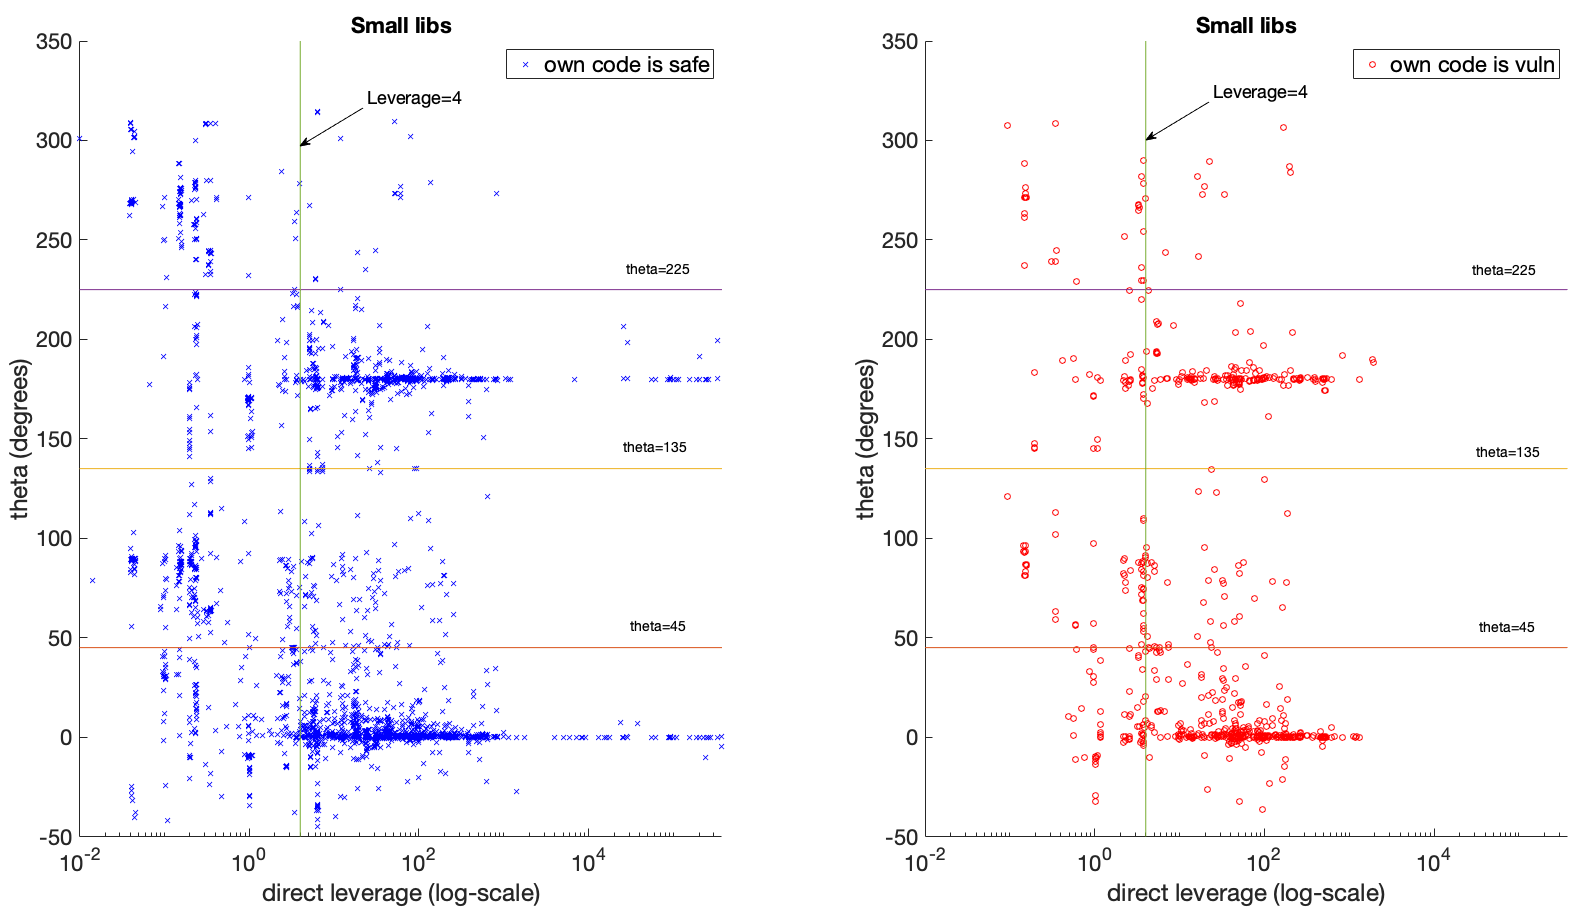
Discussion: We observe that the fact of being affected by a security vulnerability for small-medium libraries correlates with direct leverage and change distance, while for big libraries the significant effect comes from change in own and total code. Most likely, this happens due to the different strategies followed by library developers: the developers of small libraries tend to quickly increase the functionality of their libraries, and therefore, adopt new dependencies (which increase the total code size of their libraries), while the developers of big libraries focus on changes in their own code. While changes in own code may increase the attack surface, they normally also include eliminating bugs and security vulnerabilities in software libraries. In contrast, adding libraries only eliminates security vulnerabilities as a side effect if a version (or a whole library) without vulnerabilities is selected.
Key Takeaway: Direct leverage increases the security risk. Shipping four times your code base will increase the risk of shipping a vulnerable version by 60%.
VIII Related works
Several technical studies [24, 15, 11, 36, 12] showed that FOSS dependencies, although being widely used by both commercial and FOSS projects, are not often maintained properly: a large share of projects (up to 81%) have outdated dependencies. Several of them (69%) are not aware that some of those dependencies introduce serious bugs and security vulnerabilities [15]. As Allman [17] drew parallels between technical and monetary debts, one may relate dependencies in FOSS to the well-studied financial leverage instruments. However, we do not find a study that would try to quantitatively assess the technical debt introduced by software dependencies.
Manikas and Hansen [37] presented a systematic literature review of 90 papers on the studies regarding software ecosystems. Although the number of software ecosystem research papers is increasing, the majority of studies are report papers. Hence, the authors reported the lack of analytic studies of software ecosystems. This statement is supported by another extensive literature review of 213 papers on software ecosystems [38]. Similar results are found by Manikas [39] in a more recent literature review of 56 empirical studies spanning over 55 software ecosystems: there exists a lack of deeper investigation of technical and collaborative aspects.
Boucharas et al. [40] proposed a standards-setting approach to software product and software supply network modelling. Although this allows developers to anticipate upcoming changes in the software ecosystems, the approach aims at development within one company, and therefore, does not suit the purpose of modelling FOSS infrastructure.
Bonaccorsi and Rossi [41] proposed a simple model to helps software developers to decide whether to include FOSS components into their projects. Their model estimates the value of FOSS libraries based on the possibility of receiving additional support from the developers of an FOSS community.
Hence, our study fills an important gap in the state of the art by providing instruments for evaluation of the impact of technical leverage in the software ecosystems.
IX Threats to Validity
The internal validity may be influenced by the fact that we have based the FOSS library selection for this study on their popularity from within a company. We surveyed the usage data of the selected sample from MVNRepository.com999https://mvnrepository.com/ and the number of users from BlackDuck Openhub101010https://www.openhub.net/. Since both sources showed that libraries in our sample are also popular among the FOSS developers, we believe, the internal validity threat of our study is minimal.
The generalization of these results may be exposed to an external validity threat since we considered only Maven based libraries. However, since Maven has the largest share of users between the developers in the Java ecosystem111111https://zeroturnaround.com/ rebellabs/java-tools-and-technologies-landscape-2016, our results reflect the practice of the majority of Java developers. In this study, we aimed at creating awareness regarding the effects of technical leverage within software ecosystems, and therefore, proper case control studies are needed to, for example, validate the effect of odds ratio. In this respect, our study is easy to replicate for other dependency management systems.
X Conclusions and Future Work
By extending the metaphore from finance started by the notion of technical debt [1], we have introduced the new notion of technical leverage and some associated code metrics (leverage, change distance, and change direction) to capture the relative importance and evolution of one’s own code and third party code into a software library. This notion is particularly important in today’s software ecosystem where homegrown code is only a fraction of the total code base that is shipped to customers (See e.g., [42, 9, 43] and Table IV).
We have applied the proposed metrics to 8464 FOSS library instances from Java Maven stemming from an industry relevant sample of the top 200 libraries used by a large multi-national corporation for its customers. The results show that small-medium libraries have high leverage on third-party FOSS dependencies and their developers prefer to adopt new dependencies to speed up the development process. Large libraries have relatively small leverage and their developers mostly increase own code of their libraries. The proposed metrics correlate with time interval between library releases and could be used to estimate the risk of a library to be affected by a security vulnerability. Libraries whose developers perform operations with (e.g., adopt or remove) dependencies tend to be affected by vulnerabilities more often in comparison than libraries whose developers mostly change libraries’ own code.
We briefly recap the key findings of our paper as follows:
-
•
Small and medium libraries (with less than 100 KLoCs of own code) by far ship other people’s code, and at each round they typically add more. With a median direct leverage of 14.65, most libraries in our sample include less than 7% of homegrown code.
-
•
Direct leverage pays off. Shipping four times the size of your own code base (as 75% of small and medium libraries do) will only take two extra days on average.
-
•
Direct leverage increases the security risk. Shipping four times the size of your own code base will increase the odds of shipping a vulnerable version by 60%.
For sake of comparison, “if all presently unbelted drivers and right front passengers were to use the provided three point lap/shoulder belt, but not otherwise change their behavior, fatalities to this group would decline by (43 ± 3)%” [44].
These findings have also interesting implications for novel research directions in empirical software engineering and software security economics.
Within empirical software engineering, metrics of developer behavior (e.g., unfocussed contribution [45], different development priorities [46], code complexity [47], large code changes [48], etc.) are often studied to explain code quality. Yet, as we have seen, for small and medium libraries, developers ship overwhelmingly other people’s code. So their skills and behavior as coders which may be captured by the logs of software repositories only contribute in minimal part to the quality of the overall code they ship. In contrast, their decision making behavior about the choice of libraries to be used as dependencies in one’s own code has much larger impact. Unfortunately, such behavior is not equally well documented and captured by traditional software repositories. It might be captured by NLP analysis of the mailing lists or discussion blogs of the FOSS project (or company internal mechanisms).
From the perspective of security economics, our empirical data shows that technical leverage creates a decision dilemma (a moral hazard in the economics terminology). The benefit of a large leverage are reaped by the developers who can ship more code, i.e. more functionalities, with a limited delay of time interval between releases which is associated with greater profitability [13] and have been shown to have a log-linear relation with costs [14]. Yet, the risk of using a vulnerable software are borne by the users of the library which might be hit by hackers if they kept an old, vulnerable version that was however perfectly functional from their perspective (See the Equifax data breach121212https://blogs.apache.org/foundation/entry/media-alert-the-apache-software). Since updating one’s software is often not a technically feasible solution, as illustrated by a quantitative study on Android libraries in [49] (almost every second library update broke the dependent project) and qualitatively explained in [10], the presence of such dilemma may require to identify alternative solutions to software updates.
We also plan to investigate the broader impact of the proposed metrics. For example, leverage may predict a boundary for the amount of dependencies beyond which maintenance and update become unwieldy: How many are too many? This might require to correlate leverage with additional metrics such as the number of open issues, the effort of developers etc. Also, we may expect that library maintainers prefer different development strategies (captured by change direction), depending on the stage of maturity of a library and it would be interesting to determine whether there is such an effect. Another important direction for future work is the study of the impact of transitive dependencies on technical leverage albeit this should be done with care to avoid double or triple counting [12]. Above all, it will be interesting to further investigate the impact of technical leverage on other programming languages and software repositories.
More Information
For the interested readers, we provide an online demo for computing the proposed metrics for the software libraries of this study and others at the following URL: https://techleverage.eu/
Acknowledgments
We would like to thank A.Brucker, G. Kuper and P.Tonella for their insightful comments on early drafts of this work. The graphical abstract for this paper is an artwork by Anna Formilan http://annaformilan.com. This work was partly funded by the European Union under the H2020 Programme under grant n. 952647 (AssureMOSS).
References
- [1] I. Ozkaya, R. L. Nord, and P. Kruchten, “Technical debt: From metaphor to theory and practice,” IEEESoftware, vol. 29, no. 06, pp. 18–21, nov 2012.
- [2] P. Avgeriou, P. Kruchten, I. Ozkaya, and C. Seaman, “Managing technical debt in software engineering (dagstuhl seminar 16162),” in Dagstuhl Reports, vol. 6, no. 4. Schloss Dagstuhl-Leibniz-Zentrum fuer Informatik, 2016.
- [3] A. Ampatzoglou, A. Ampatzoglou, A. Chatzigeorgiou, and P. Avgeriou, “The financial aspect of managing technical debt: A systematic literature review,” Inf. and Softw. Tech. Journ., vol. 64, pp. 52–73, 2015.
- [4] C. Bird, T. Menzies, and T. Zimmermann, The art and science of analyzing software data. Elsevier, 2015.
- [5] R. E. Grinter, “Understanding dependencies: A study of the coordination challenges in software development,” Ph.D. dissertation, Citeseer, 1996.
- [6] S. A. Dilawer, Practical Guide of Software Development Project Management in Practice. Lulu.com, 2011.
- [7] P. Mohagheghi and R. Conradi, “Quality, productivity and economic benefits of software reuse: a review of industrial studies,” Emp. Soft. Eng. Journ., vol. 12, no. 5, pp. 471–516, 2007.
- [8] H. Mack and T. Schroer, “Security midlife crisis: Building security in a new world,” IEEE Security & Privacy, vol. 18, no. 04, pp. 72–74, jul 2020.
- [9] M. Pittenger, “Open source security analysis: The state of open source security in commercial applications,” Black Duck Software, Tech. Rep., 2016.
- [10] I. Pashchenko, D. Vu, and F. Massacci, “A qualitative study of dependency management and its security implications,” in Proc. of CCS’20. ACM, 2020.
- [11] J. Cox, E. Bouwers, M. van Eekelen, and J. Visser, “Measuring dependency freshness in software systems,” in Proc. of ICSE’15, ser. ICSE ’15. Piscataway, NJ, USA: IEEE Press, 2015, pp. 109–118. [Online]. Available: http://dl.acm.org/citation.cfm?id=2819009.2819027
- [12] I. Pashchenko, H. Plate, S. E. Ponta, A. Sabetta, and F. Massacci, “Vulnerable open source dependencies: counting those that matter,” in Proc. of ESEM’18. ACM, 2018, p. 42.
- [13] T. August and M. F. Niculescu, “The influence of software process maturity and customer error reporting on software release and pricing,” Management Science, vol. 59, no. 12, pp. 2702–2726, 2013.
- [14] H. Huijgens, A. van Deursen, L. Minku, and C. Lokan, “Effort and cost in software engineering: A comparison of two industrial data sets,” in Proceedings of the 21st International Conference on Evaluation and Assessment in Software Engineering. ACM, 2017, pp. 51–60.
- [15] R. G. Kula, D. M. German, A. Ouni, T. Ishio, and K. Inoue, “Do developers update their library dependencies?” Emp. Soft. Eng. Journ., May 2017. [Online]. Available: https://doi.org/10.1007/s10664-017-9521-5
- [16] S. Dashevskyi, A. D. Brucker, and F. Massacci, “On the effort for security maintenance of free and open source components,” Proc. of WEIS’18, 2018.
- [17] E. Allman, “Managing technical debt,” Commun. ACM, vol. 55, no. 5, 2012.
- [18] A. Kraus and R. H. Litzenberger, “A state-preference model of optimal financial leverage,” J Finance, vol. 28, no. 4, pp. 911–922, 1973.
- [19] M. T. Baldassarre, A. Bianchi, D. Caivano, and G. Visaggio, “An industrial case study on reuse oriented development,” in Proc. of ICSME’05. IEEE, 2005, pp. 283–292.
- [20] M. Morisio, D. Romano, and I. Stamelos, “Quality, productivity, and learning in framework-based development: An exploratory case study,” TSE, vol. 28, no. 9, pp. 876–888, 2002.
- [21] D. Greenlaw, J. Hatzius, A. K. Kashyap, and H. S. Shin, “Leveraged losses: lessons from the mortgage market meltdown,” in Proceedings of the US monetary policy forum, vol. 2008, 2008, pp. 8–59.
- [22] E. Derr, S. Bugiel, S. Fahl, Y. Acar, and M. Backes, “Keep me updated: An empirical study of third-party library updatability on android,” in Proc. of CCS’17, 2017, pp. 2187–2200.
- [23] I. Pashchenko, H. Plate, S. E. Ponta, A. Sabetta, and F. Massacci, “Vuln4real: A methodology for counting actually vulnerable dependencies,” TSE, 2020.
- [24] J. Hejderup, “In dependencies we trust: How vulnerable are dependencies in software modules?” Ph.D. dissertation, Computer Science, 2015.
- [25] P. Glasserman and H. P. Young, “Contagion in financial networks,” JEL, vol. 54, no. 3, pp. 779–831, 2016.
- [26] Anonymous, “For blind review,” To be unblinded in the final version.
- [27] W. S. Humphrey, A discipline for software engineering. Addison-Wesley Longman Publishing Co., Inc., 1995.
- [28] F. P. Brooks Jr et al., The Mythical Man-Month: Essays on Software Engineering, Anniversary Edition, 2/E. Pearson Education India, 1995.
- [29] J. Aguilar, M. Sánchez, C. Fernández, E. Rocha, D. Martínez, and J. Figueroa, “The size of software projects developed by mexican companies,” in Proc. of SERP’14. The Steering Committee of The World Congress in Computer Science, Computer …, 2014, p. 1.
- [30] J. Benesty, J. Chen, Y. Huang, and I. Cohen, “Pearson correlation coefficient,” in Noise reduction in speech processing. Springer, 2009, pp. 1–4.
- [31] R. L. Eubank and P. Speckman, “Curve fitting by polynomial-trigonometric regression,” Biometrika, vol. 77, no. 1, pp. 1–9, 1990.
- [32] T. W. Anderson, “An introduction to multivariate statistical analysis,” Wiley New York, Tech. Rep., 1962.
- [33] M. Szumilas, “Explaining odds ratios,” The JCACAP, vol. 19, no. 3, p. 227, 2010.
- [34] L. Allodi and F. Massacci, “Comparing vulnerability severity and exploits using case-control studies,” Proc. of TISSEC’14, vol. 17, no. 1, 2014.
- [35] R. A. Fisher, “The logic of inductive inference,” J. Royal Stat. Soc., vol. 98, no. 1, pp. 39–82, 1935.
- [36] T. Lauinger, A. Chaabane, S. Arshad, W. Robertson, C. Wilson, and E. Kirda, “Thou shalt not depend on me: Analysing the use of outdated javascript libraries on the web,” in Proc. of NDSS’17, 2017.
- [37] K. Manikas and K. M. Hansen, “Software ecosystems–a systematic literature review,” Journ. of Sys. and Soft., vol. 86, no. 5, pp. 1294–1306, 2013.
- [38] K. Manikas, “Revisiting software ecosystems research: A longitudinal literature study,” Journ. of Sys. and Soft., vol. 117, pp. 84–103, 2016.
- [39] ——, “Supporting the evolution of research in software ecosystems: reviewing the empirical literature,” in Proc. of ICSOB’16. Springer, 2016, pp. 63–78.
- [40] V. Boucharas, S. Jansen, and S. Brinkkemper, “Formalizing software ecosystem modeling,” in In Proc. of IWOCE’09. New York, NY, USA: ACM, 2009, pp. 41–50. [Online]. Available: http://doi.acm.org/10.1145/1595800.1595807
- [41] A. Bonaccorsi and C. Rossi, “Why open source software can succeed,” RP, vol. 32, no. 7, 2003.
- [42] H. Mack and T. Schroer, “Security midlife crisis: Building security in a new world,” IEEE Sec. and Privacy, vol. 18, no. 4, pp. 72–74, 2020.
- [43] M. J. Gallivan, “Striking a balance between trust and control in a virtual organization: a content analysis of open source software case studies,” ISJ, vol. 11, no. 4, pp. 277–304, 2001.
- [44] L. Evans, “The effectiveness of safety belts in preventing fatalities,” Accident Analysis & Prevention, vol. 18, no. 3, pp. 229 – 241, 1986. [Online]. Available: http://www.sciencedirect.com/science/article/pii/0001457586900072
- [45] A. Meneely and L. Williams, “Secure open source collaboration: an empirical study of linus’ law,” in Proceedings of the 16th ACM conference on Computer and communications security, 2009, pp. 453–462.
- [46] R. Peters and A. Zaidman, “Evaluating the lifespan of code smells using software repository mining,” in Proc. of SANER’12. IEEE, 2012, pp. 411–416.
- [47] T. Zimmermann, R. Premraj, and A. Zeller, “Predicting defects for eclipse,” in Proc. of PROMISE’07. IEEE, 2007, pp. 9–9.
- [48] Y. Jiang, B. Cuki, T. Menzies, and N. Bartlow, “Comparing design and code metrics for software quality prediction,” in Proc. of PROMISE’08, 2008, pp. 11–18.
- [49] J. Huang, N. Borges, S. Bugiel, and M. Backes, “Up-to-crash: Evaluating third-party library updatability on android,” in 2019 IEEE European Symposium on Security and Privacy (EuroS&P). IEEE, 2019, pp. 15–30.