Searching for Mg ii absorbers in and around galaxy clusters
Abstract
To study environmental effects on the circumgalactic medium (CGM), we use the samples of redMaPPer galaxy clusters, background quasars and cluster galaxies from the SDSS. With 82 000 quasar spectra, we detect 197 Mg ii absorbers in and around the clusters. The detection rate per quasar is 2.70.7 times higher inside the clusters than outside the clusters, indicating that Mg ii absorbers are relatively abundant in clusters. However, when considering the galaxy number density, the absorber-to-galaxy ratio is rather low inside the clusters. If we assume that Mg ii absorbers are mainly contributed by the CGM of massive star-forming galaxies, a typical halo size of cluster galaxies is smaller than that of field galaxies by 3010 per cent. This finding supports that galaxy haloes can be truncated by interaction with the host cluster.
keywords:
galaxies: clusters: general – galaxies: intergalactic medium – galaxies: ISM – galaxies: general – galaxies: quasars: general1 Introduction
The circumgalactic medium (CGM) is a gas reservoir surrounding galaxies within their dark matter haloes. Recent cosmological simulations and observations support that the CGM is closely connected to the evolution of galaxy via gas flows (see Tumlinson et al., 2017, for a review). In the sense that the CGM harbours metal-enriched gas ejected from the galaxy, driven by star formation feedback, and fresh gas accreted from the intergalactic medium (IGM) to fuel star formation, the CGM provides an excellent laboratory for better understanding the mechanisms that control galaxy evolution.
It is challenging to detect the emission from CGM with currently available facilities because of the low surface brightness, although there are several successful attempts from deep imaging and spectroscopic observations (e.g. Cantalupo et al., 2014; Zhang et al., 2016; Daddi et al., 2020). Therefore, Ly and metal absorption lines imprinted in background source spectra have been widely used to trace the CGM (e.g. Adelberger et al., 2005; Steidel et al., 2010; Prochaska et al., 2013). For the background source, quasars are popular because they are luminous objects with a simple spectral shape, generally characterized by a power-law continuum and broad emission lines, enabling us to detect foreground absorbers with a high signal-to-noise ratio (S/N). The Ly absorption line is very sensitive to the existence of CGM, but does not allow us to construct a large sample of Ly absorbers due to observational limitations (but see Lehner et al., 2018). Among the metal absorption lines, the Mg ii 2796, 2803 doublet is particularly useful for statistical studies because it is a prominent feature, visible from the ground, spanning a wide redshift range () in the optical wavelengths. The Mg ii absorption is known to probe gas at temperature K (Charlton et al., 2003) with the neutral hydrogen column density – cm-2 (Rao, Turnshek, & Nestor, 2006).
Since the first discovery of an intervening Mg ii absorption from quasar-galaxy pairs by Bergeron (1986), the relation between galaxies and their CGM has been investigated over the last three decades. The strength of Mg ii absorption at fixed impact parameter is found to be correlated with galaxy properties such as luminosity, mass, color and (specific) star formation rate (e.g. Bouché et al., 2006; Chen et al., 2010a; Bordoloi et al., 2011; Lan, Ménard, & Zhu, 2014; Rubin et al., 2018), indicating that massive star-forming galaxies have a relatively dense and/or extended CGM compared to low-mass passive galaxies. The CGM is also related to galaxy orientation (e.g. Steidel et al., 2002; Kacprzak, Churchill, & Nielsen, 2012), originating from that gas accretion on to galaxies is preferentially along their major axis, whereas gas outflows along the minor axis.
The CGM is expected to be affected by galaxy environment as well as galaxy properties. The H i observations in the local Universe reveal that gas around galaxies has complex structures when the galaxy interacts with neighbour galaxies or the host group/cluster (e.g. Chynoweth et al., 2008; Chung et al., 2009; Wolfe et al., 2013). The combined analysis of internal velocity dispersion of galaxies and strong lensing predicts that the halo size of cluster galaxies is significantly different from that of field galaxies (e.g. Monna et al., 2015, 2017). However, the results from previous studies with the Mg ii doublet do not seem to agree. For example, Lopez et al. (2008) and Padilla et al. (2009) found that strong Mg ii absorbers are abundant in cluster central regions, while the numbers of weak absorbers are compatible between cluster and field regions. The authors suggested that many galaxies are in clusters, but their haloes are truncated by cluster environment effects. On the other hand, Chen et al. (2010b) reported that the strengths of Mg ii absorption in group environments are similar to those in isolated environments. Bordoloi et al. (2011) pointed out that the extended Mg ii gas around group galaxies could be explained by a superposition of member galaxies (but see Nielsen et al., 2018), implying that the group environment does not have a significant impact on the CGM of individual galaxies.
To systematically study how the CGM is affected by the cluster environment, we construct a large sample of quasar-cluster pairs using data sets from the Sloan Digital Sky Survey (SDSS; York et al., 2000) and detect Mg ii absorption lines in the quasar spectra. The outline of this paper is as follows. We explain the data used, including cluster, quasar and galaxy samples, in Section 2. We describe the methods to measure the equivalent widths (EWs) of Mg ii lines and to select Mg ii absorbers in Section 3. We present and discuss our findings in Section 4. We summarize the results in Section 5. Throughout, we assume a flat CDM cosmology with = 100 km s-1 Mpc-1, = 0.7 and = 0.3. We omit the terms of ‘5 log ’ and ‘’ from absolute magnitude and cluster mass units, respectively. All magnitudes are given in the AB system and all measurement errors are 1.
2 Data
2.1 Galaxy cluster sample
We use the redMaPPer (red-sequence Matched-filter Probabilistic Percolation; Rykoff et al., 2014, 2016) catalogue to search for Mg ii absorbers associated with galaxy clusters. The redMaPPer is one of the largest and homogeneous samples of galaxy clusters. This catalogue is constructed with sophisticated algorithms by sampling red-sequence galaxies as potential cluster members based on a minimal spectroscopic training set. The redMaPPer richness parameter () is well correlated with other proxies of cluster mass and about 90 per cent of member candidates are spectroscopically confirmed to be in the host cluster even at the low richness (e.g. Rines et al., 2018; Sohn et al., 2018). Therefore, although the redMaPPer clusters are photometrically selected, most of them are expected to be genuine clusters.
In this study, we adopt the version 6.3 of redMaPPer catalogue111http://risa.stanford.edu/redmapper/ containing 26 000 galaxy clusters in the SDSS Data Release 8 (DR8; Aihara et al., 2011). The dynamical mass () and projected velocity dispersion () of redMaPPer clusters are estimated from using the scaling relations in table 4 of Rines et al. (2018):
| (1) | |||
| (2) |
Then, their virial radius () is converted from with the formula of Carlberg et al. (1997):
| (3) |
where is the redMaPPer cluster redshift from the photometric redshifts of member candidates and () is the Hubble parameter at (Peebles, 1993).
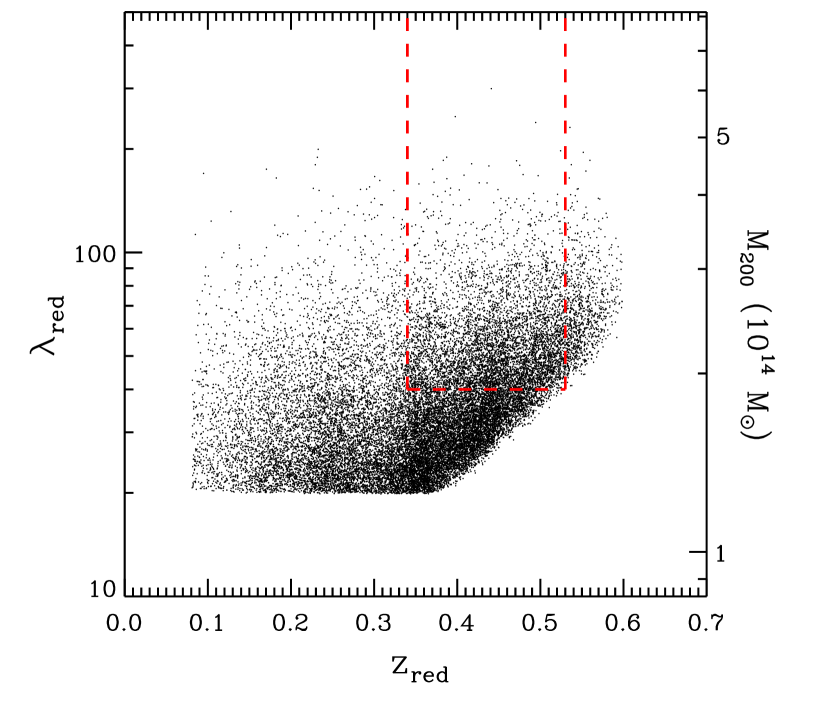
Figure 1 displays the and distributions. We focus on 6179 clusters, surrounded by red dashed lines, at = 0.34–0.53 and 40, corresponding to . The lower limit of is necessary to guarantee the scaling relations of Rines et al. (2018): their figures 9 and 11 show that the relations are not reliable at 40. The upper limit of is for making a volume-limited sample at 40. The lower limit of is determined to ensure that the Mg ii doublet is comfortably within the BOSS (Baryon Oscillation Spectroscopic Survey; Dawson et al. 2013) spectral coverage (3650–10 400 Å)222When using quasar spectra obtained with the SDSS spectrograph (3800–9200 Å), the redshift cut of 0.34 may not be enough to securely measure the Mg ii doublet. If we remove the SDSS spectrograph data or strictly narrow the redshift range to = 0.39–0.53, the number of quasar-cluster pairs is reduced by 14 or 26 per cent, respectively. This does not change the main results of this study, but makes our conclusion less significant. at 5(1+)/ 5(1+)/, where is the speed of light, which is the redshift range where we search for absorbers (/ 5; the search window hereafter).
2.2 Quasar sample
We use the quasar catalogue of Pâris et al. (2018), which is from the SDSS DR14 (Abolfathi et al., 2018) and contains 526 000 quasars. Among these, 15 and 85 per cent were observed with SDSS and BOSS spectrographs, respectively. Their optical spectra are downloadable from the SDSS Science Archive Server333http://dr16.sdss.org/sas/dr16/sdss(eboss)/spectro/redux/.
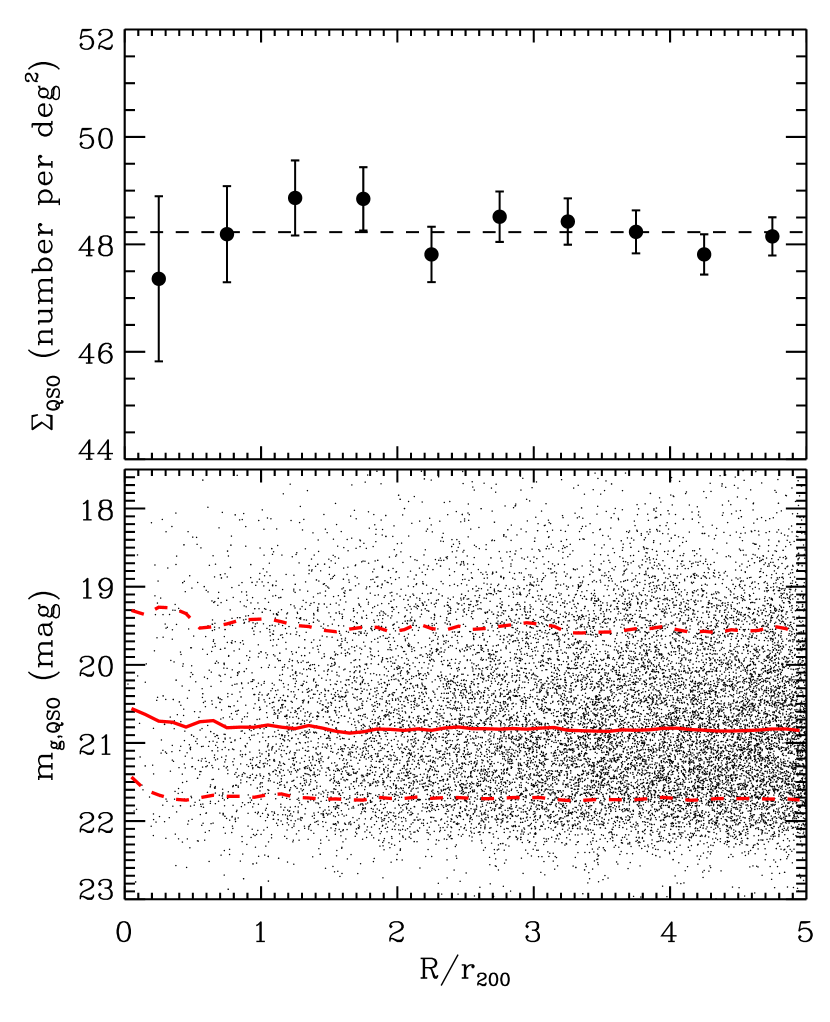
By cross-matching the quasar and cluster catalogues, we search for quasars with projected distance from the centre of each cluster centre smaller than 5. This distance is large enough to cover both cluster to field environments so that we can examine any difference between the two environments. We find 96 759 quasars (including duplicates) in and around the clusters and hereafter call them quasar-cluster pairs for convenience. There is little difference in the redshift distribution of quasars () between parent and matched samples. In Figure 2, we present the number density and -band point spread function magnitudes of the background quasars as a function of the cluster-centric radius normalized by (). The mean number density is 48.230.16 per deg2 and typical range (68 per cent enclosure) of -band magnitudes is 19.54–21.71 mag. Because the quasars and clusters are selected independently from each other, the quasar properties show no systematic variation with the cluster-centric radius.
2.3 Galaxy sample
We also compile galaxy data using a photometric sample of galaxies in the SDSS DR16 (Ahumada et al., 2020). Their redshift information is obtained from the SDSS database and is supplemented from literature (see Hwang et al., 2010, 2014, for details). At 5, the numbers of galaxies in the photometric and spectroscopic samples are about 12.26 million and 486 000, respectively. The spectroscopic completeness as a function of -band Petrosian magnitude () is shown in the left panel of Figure 3. The limiting magnitude of SDSS main galaxy survey is 17.77 (Strauss et al., 2002). However, the completeness is not small even at 17.77 because of other subprograms targeting faint extra-galaxies such as the Luminous Red Galaxy (LRG; Eisenstein et al., 2001), Emission Line Galaxy (ELG; Comparat et al., 2016), SPectroscopic IDentification of ERosita Sources (SPIDERS; Clerc et al., 2016) and Extended Baryon Oscillation Spectroscopic Survey (eBOSS; Dawson et al., 2016). We note that a significant fraction of redMaPPer clusters were not covered by the main galaxy survey, which makes the completeness for the cluster regions reaches only half even at 17.77.
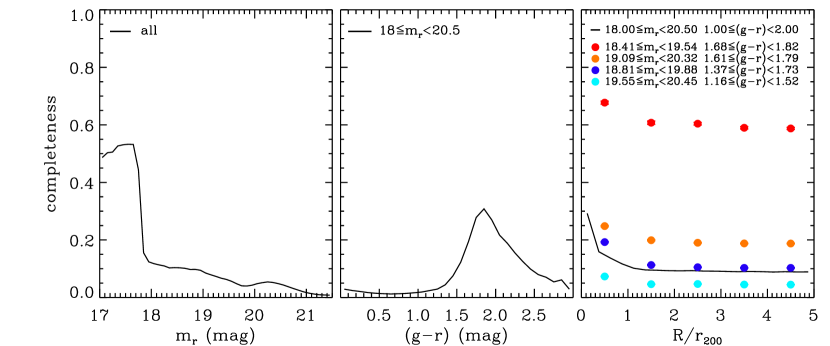
Among 486 000 galaxies with redshift, 64 716 galaxies are found to be within the search window. The primary source of them is the LRG sample (79 per cent) rather than the main galaxy sample (10 per cent) because of redshift range. Their and model colour ranges are about 18.0–20.5 and 1.0–2.0 mag, respectively. When fixing from 18.0 to 20.5 mag, we can see the colour dependence of spectroscopic completeness as shown in the middle panel of Figure 3: high completeness in the red colour range connected to the selection criteria for LRGs. At 17.77, dominated by the main galaxy sample, this colour dependence disappears because there is no colour selection for the main galaxy sample. At = 18.0–20.5 and = 1.0–2.0, we can perceive the radial dependence of completeness (the solid line in the right panel) as well. The high completeness in the cluster region may originate mainly from that the redMaPPer cluster finding technique prefers galaxies with redshift as member galaxies, especially for the central galaxy (see section 8 of Rykoff et al. 2014), and partly from that some redMaPPer cluster galaxies are targeted in the SPIDERS programs.
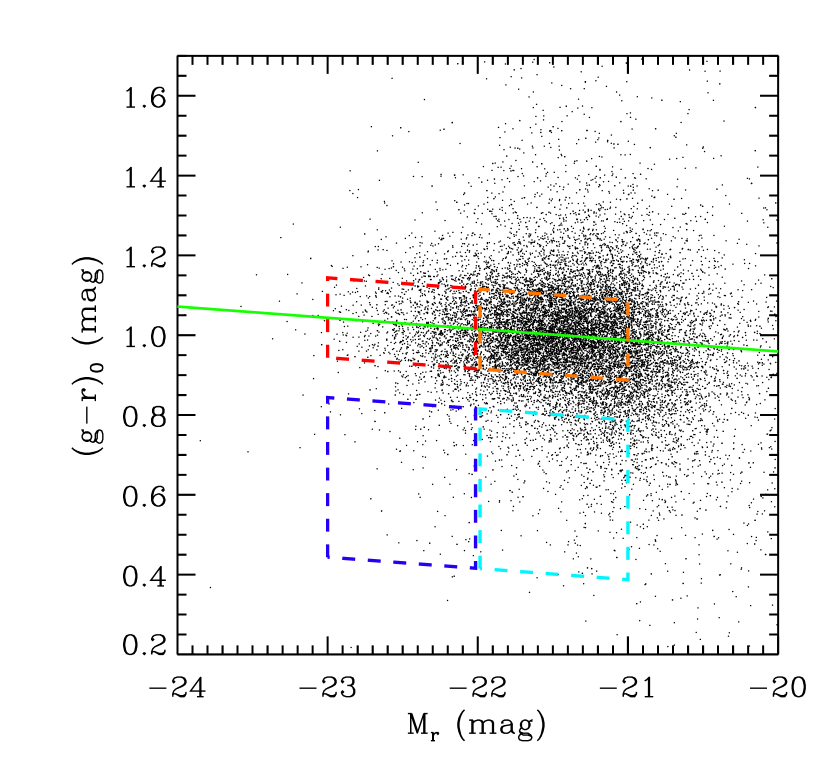
We regard 64 716 galaxies within the search window as galaxies associated with an ensemble of redMaPPer clusters (the redMaPPer cluster galaxies hereafter) and plot their colour-magnitude diagram in Figure 4. The absolute magnitude and colour are obtained after -correction (Blanton & Roweis, 2007) and evolution correction (Tegmark et al., 2004). Because most of them are LRGs, the so-called red sequence is well noticeable, whereas the blue cloud is not. Using galaxies brighter than = 21, at which the number of galaxies per mag is peaked, we fit the red sequence to a linear relation (green line):
| (4) |
We then define the four subsamples of cluster galaxies
according to their and colour deviation from the sequence
, which are
bright-red: & ,
faint-red: & ,
bright-blue: & ,
and faint-blue: & .
These subsamples include 4919, 24 615, 395 and 2523 galaxies.
The typical stellar masses444The stellar mass and star formation rate
are drawn from the MPA-JHU value-added galaxy catalogues
(Gallazzi et al., 2005; Salim et al., 2007).
of the bright and faint galaxies are 4.4–7.8 and
1.4–4.0 , respectively.
The specific star formation rates of the red and blue galaxies are
10-12.4–10-11.4 and 10-10.4–10-9.6 yr-1.
Their apparent and ranges are denoted
in the right panel of Figure 3.
The overall completeness in bins
for the bright-red, faint-red, bright-blue and faint-blue galaxies is also
presented with red, orange, purple and cyan circles, respectively.
The completeness differs between the subsamples
(high completeness in the bright/red galaxies),
but has a similar radial trend (higher completeness in the inner region).
3 Analysis
To detect Mg ii absorption features in the quasar spectrum, we first estimate the quasar continuum. After masking bad pixels flagged by the SDSS pipeline, we use a simple smoothing method with a median filter. The filter size is changed from 15 to 80 times the instrumental resolution (1.0 Å; 70 km s-1 for both SDSS and BOSS spectrographs) according to the S/N at each pixel (i.e. 15 times at S/N 100 and 80 times at S/N 5), resulting in an adaptive smoothing effect. This is determined empirically to be small enough so that the global spectral shape and broad emission lines of background quasar should be included in the continuum estimation and to be large enough so that narrow line features such as the Mg ii doublet from foreground absorbers should not be included. The left panels of Figure 5 show three examples of the quasar spectra along with the continuum fitting result.
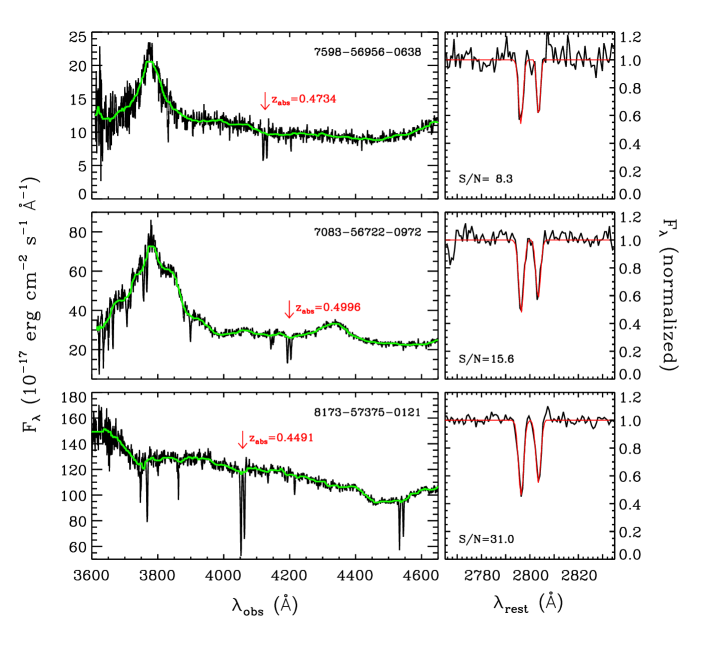
Within the search window, we attempt to measure the EWs of Mg ii doublet lines ( & ) in every step of (1/7 of instrumental resolution). The continuum-normalized observed spectrum is transformed to the rest-frame at a potential redshift, and then renormalized by the local continuum (determined from a linear fitting around the doublet at 2765–2785 and 2815–2835 Å) to remove the remaining residual. Using the MPFIT/IDL package (Markwardt, 2009), the Mg ii doublet is modelled with two Gaussians, as shown in the right panels of Figure 5. The wavelength separation of the two Gaussians (usually 7.2 Å for the Mg ii doublet) is allowed to vary with a tolerance of 2 times the (rest-frame) resolution. The Gaussians have the same linewidth, which is limited from 90 per cent of the resolution to 3.1 Å555By considering the uncertainty of instrumental resolution information provided by the pipeline, we regard the 90 per cent value as the minimum width of Mg ii lines. When adopting the 100 per cent value as the lower limit, we lose about 20 per cent of absorbers. If the full width at half maximum (FWHM) of Mg ii lines is larger than the separation, it is difficult to identify the doublet based on our scheme. We thus focus only on narrow (velocity dispersion 200 km s-1) absorption line systems in this study.. Because the line ratio of the doublet is theoretically bounded between 2 (unsaturated) and 1 (completely saturated), we keep the measurement with , where is the ratio error calculated using the uncertainties in Gaussian parameters. The S/N 3 is taken as the detection threshold for both and . There is another condition that the height of each Gaussian is three times larger than the flux fluctuation (root mean square) around the Mg ii doublet, which means that the doublet should be a major line feature at least around it, helpful for preventing false detections (see also next paragraph). More than one Mg ii absorber could be identified in a given spectrum. Therefore, as we measure EWs by increasing the redshift for each step, we keep all the redshifts that give local maxima of the S/N for total EW as the absorber redshifts (). This automated procedure results 362 possible Mg ii absorber candidates from 82 360 quasar spectra.
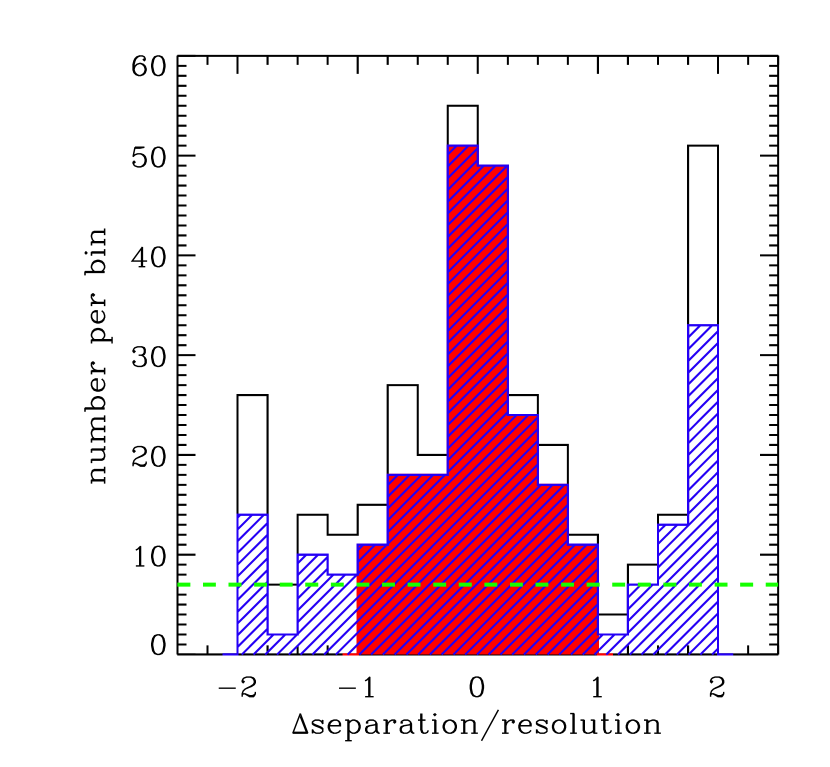
Because a substantial fraction of the 362 possible candidates can be contaminated by false detections, we visually inspect them to select more reliable ones. We exclude the measurements with the Gaussian fits not matched to the actual line profiles666It is difficult to remove them simply by using a threshold because there could be adjacent line features.. The measurements based on inaccurate continuum estimates777Our continuum estimation is not satisfactory when there are broad absorption lines or many adjacent (narrow) absorption lines. It is also incorrect near the peak (not the wing) of broad emission lines. To handle these cases properly, more detailed modelling is necessary. are also eliminated. As a result, 288 probable candidates remain. In Figure 6, we present the histogram of the values obtained by subtracting 7.2 Å from the wavelength separation between the two Gaussians and dividing by the instrumental resolution (separation/resolution). A significant fraction of our candidates are genuine in the sense that the separation/resolution distribution is concentrated around zero. If we do not adopt the criterion that the Gaussian heights are three times larger than the flux fluctuation, this concentration becomes much weaker. On the other hand, this distribution has secondary peaks at 2 because of the measurements enforced by the boundary condition. We finally select 197 Mg ii absorbers with abs(separation/resolution) 1 to further reduce contamination. The number of contaminants in the final list is estimated to be 56 by considering the number of probable candidates with abs(separation/resolution) = 1–1.75 (seven absorbers per bin). Therefore, we expect that the reliability of our identification is (156/197) 72 per cent.
We note that all the 197 Mg ii absorbers have redshifts smaller than those of quasars (i.e. ). Among them, there are four absorbers with 0.003, corresponding to the relative velocity of 600 km s-1. Although these absorbers are potentially associated with their quasars (i.e. not intervening absorbers), they are kept in the final list for consistency. On the other hand, there are five absorbers matched with two different clusters. We thus have 202 Mg II absorber-cluster pairs. In a given single spectrum of quasar, there could be multiple absorbers at different redshifts. However, we find no such case in this study due to the low detection rate (only 0.6 per cent even in cluster regions; see Section 4.2).
4 Results and Discussion
4.1 Absorber properties
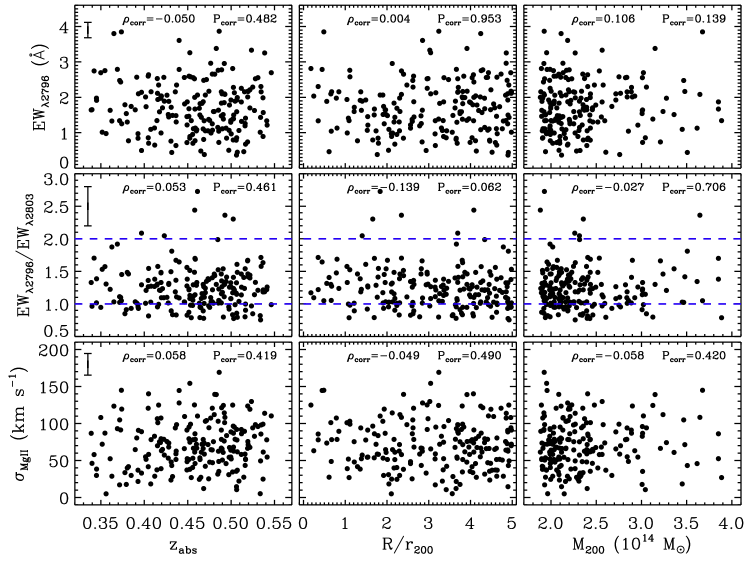
We provide the basic information of 197 Mg ii absorbers in Table 1 and plot the measured parameters as functions of , and in Figure 7. The sensitivity for detecting Mg ii absorbers gradually increases with redshift until 1.5 because the SDSS spectroscopic throughput reaches a maximum at 7000 Å. However, we find no correlation between and in the sense that the probability of obtaining the given correlation by chance in the Spearman test, shown in the top-left panel, is not small enough. This suggests that there is no significant selection bias within our redshift range. We also note that the measured parameters are correlated neither with nor ; this dependence does not change even if we add the sample of Lopez et al. (2008). There are publicly available catalogues of Mg ii absorbers, which are selected regardless of their environment (e.g. Zhu & Ménard, 2013; Raghunathan et al., 2016). The 36 absorbers are also included in the catalogue of Zhu & Ménard (2013). For these common absorbers, two measurements are consistent with each other (see Appendix A for more details).
| spectrum ID | RA | Dec | |||||
|---|---|---|---|---|---|---|---|
| deg. | deg. | Å | km s-1 | ||||
| 7830-57043-0126 | 034.956963 | 01.454112 | 1.4497 | 0.3736 | 3.85 0.63 | 1.05 0.27 | 144.9 26.8 |
| 6468-56311-0076 | 151.811924 | 31.772667 | 3.3370 | 0.3716 | 2.48 0.31 | 1.02 0.17 | 104.8 16.5 |
| 4608-55973-0567 | 133.845293 | 37.907218 | 2.3020 | 0.4074 | 1.09 0.14 | 1.03 0.18 | 018.3 11.2 |
| 4572-55622-0204 | 146.842194 | 38.014749 | 2.4010 | 0.4584 | 1.67 0.22 | 1.70 0.39 | 086.1 14.6 |
| 4572-55622-0156 | 146.997598 | 38.379074 | 2.2780 | 0.4494 | 1.87 0.25 | 1.38 0.30 | 052.4 11.9 |
The typical ranges of , and 888We obtain the intrinsic linewidth by subtracting the 90 per cent of instrumental resolution in quadrature. are 0.97–2.52 Å, 0.95–1.49 and 37–105 km s-1, respectively. The Mg ii absorbers are often classified into weak and strong systems using the division value of = 0.3 Å (e.g. Lopez et al., 2008). If we follow this classification scheme, all our absorbers are strong systems. The eight absorbers are even ultra-strong ( 3 Å). We note that, based on the completeness test result of Zhu & Ménard (2013), more than 60 per cent of Mg ii absorbers with 1.0 Å could be detected around z = 0.45 from the SDSS quasar spectra, but less than 10 per cent for 0.3 Å. The distribution is peaked at 1.2, indicating that most of the doublets are saturated. About 80 per cent of absorbers have 100 km s-1, which are compatible with gas velocity dispersion around ELGs rather than LRGs (Lan & Mo, 2018). These absorber properties are generally in agreement with those found in the large samples of Zhu & Ménard (2013) and Raghunathan et al. (2016).
4.2 Radial distribution in and around galaxy clusters
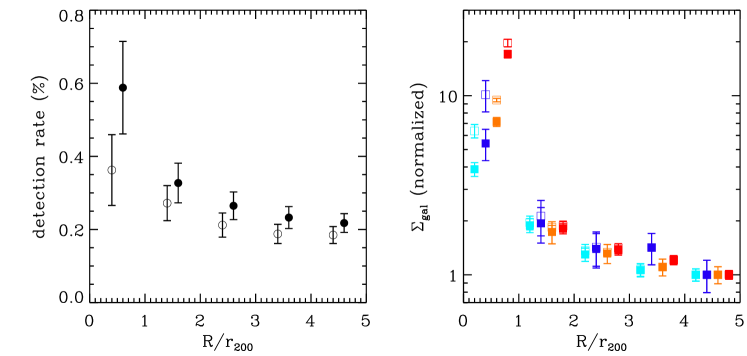
In the left panel of Figure 8, we present the Mg ii detection rate per quasar, the number ratio of Mg ii absorbers to quasars, in each bin. Because a small number of quasars are matched with distant clusters that are apparently small, the contribution from distant clusters is underestimated when calculating the detection rate. It is also underestimated in the clusters where the quasar number density is low999The SDSS quasar survey is not uniform across the sky. The number density of quasars in the redMaPPer cluster regions varies from 18.8 to 89.1 deg-2.. Therefore, we set the scaling factor for each cluster so that the adjusted number of quasars matched with a cluster is exactly proportional to the square of the cluster physical size and the total number of quasars remains the same. The raw and corrected detection rates are denoted by open and filled circles, respectively. The reason why the corrected values are slightly high is because a large number of absorbers are detected at high- due to the spectral characteristics mentioned above. We also need to consider that the absorbers are easily detected when using bright quasars. However, the negligible dependence of quasar magnitudes on , as shown in Figure 2, enables us to assume that the radial trend of the detection rate reflects well the actual distribution of Mg ii absorbers. In this plot, we find that the detection rate increases as the cluster-centric radius decreases: on average 0.590.13 per cent at 1 and 0.220.03 per cent at 4, indicating that Mg ii absorbers are 2.700.66 times more abundant in the clusters.
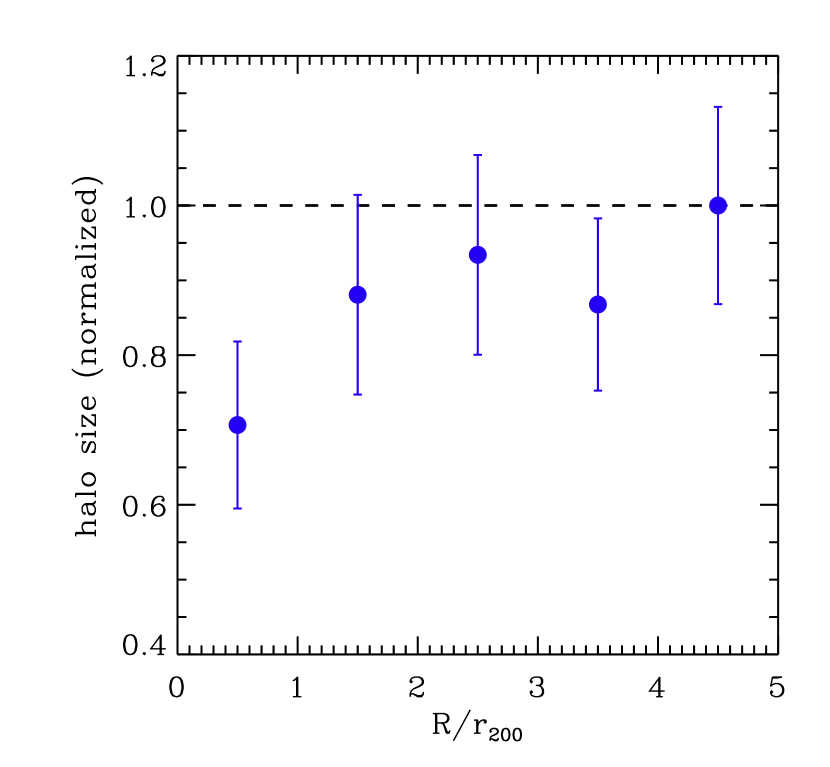
We show the normalized number density of cluster galaxies in the right panel. The bright-red, faint-red, bright-blue and faint-blue galaxies are denoted by the red, orange, blue and cyan squares, respectively. The raw and spectroscopic completeness corrected values are presented in the open and filled symbols. The radial variations of depend on galaxy magnitude and colour: 17.170.83, 7.140.41, 5.411.08 and 3.880.34 times higher at 1 than at 4 for the bright-red, faint-red, bright-blue and faint-blue galaxies, following the well-known relation that a large fraction of massive passive galaxies are in clusters (e.g. Park & Hwang, 2009). Meanwhile, these values are larger than 2.700.66 found in the Mg ii absorbers. If we assume that the majority of absorbers are connected to the CGM of cluster galaxies in particular for the bright-blue galaxies, the absorber-to-galaxy density ratio at 1 is 0.500.16 times that at 4. Because this ratio is proportional to the projected surface area of Mg ii halo (i.e. ), the value less than one means that a typical halo size of cluster galaxies is smaller than that of field galaxies. In Figure 9, we present the halo size normalized by that at 4 (the relative halo size hereafter) as a function of based on the bright-blue galaxies. The relative halo size is 0.710.11 at 1.
This result is not as dramatic as the argument of Padilla et al. (2009) that Mg ii halo radii can be changed from 50 to 10 kpc by cluster environmental effects. However, they might have overestimated the cluster effect in the sense that they did not take into account the dependency of Mg ii absorption on galaxy colour. The relative halo sizes in the clusters become 0.400.05, 0.620.08 and 0.830.11 when using the bright-red, faint-red, and faint-blue galaxies, respectively. There is a possibility that we underestimate the cluster effect because weak absorbers (sensitive to environmental effects) are not considered in this study, while Padilla et al. (2009) utilized some weak absorbers from their own observations.
The truncated Mg ii halo in cluster environment is supported by the low covering fraction of Ly absorption in the CGM of cluster galaxies compared to field galaxies (e.g. Yoon & Putman, 2013; Burchett et al., 2018). To explain this phenomenon, Padilla et al. (2009) suggested the cold gas stripping scenario by the hot intracluster gas. Because we cannot test this scenario with the current data sets, it is difficult to discuss the detailed mechanism of gas stripping: for example, is it driven by ram pressure (Gunn & Gott, 1972) or thermal evaporation (Cowie & Songaila, 1977)? It is also difficult to rule out other types of processes such as strangulation (Larson, Tinsley, & Caldwell, 1980), harassment (Moore et al., 1996), tidal interaction with the cluster potential (Merritt, 1984) and high-speed multiple encounters with early-type galaxies (Park & Hwang, 2009).
There are Ly and C iv absorbers associated with the IGM component of clusters rather than the CGM of cluster galaxies (e.g. Yoon & Putman, 2017; Manuwal et al., 2019). However, Mg ii absorbers can hardly trace the IGM because the H i column density of IGM is too low, which is less than 1016 cm-2 in most areas (see the hydrodynamic simulation result of Butsky et al. 2019). The IGM contribution is expected to be small, thus not changing our conclusion.
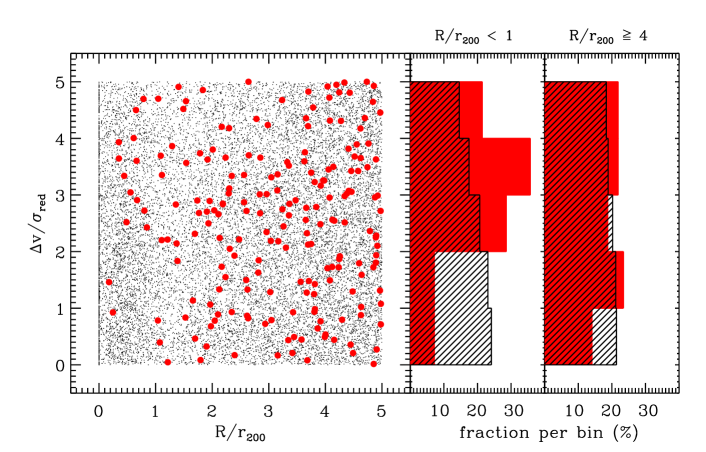
4.3 Phase-space diagram
Figure 10 displays the distribution of Mg ii absorbers and redMaPPer cluster galaxies in projected phase space. The x-axis is the projected distance from the cluster centre normalized by the cluster radius , while the y-axis is the line-of-sight velocity difference between the absorber/galaxy and the cluster normalized by the cluster velocity dispersion /. The radial variation of spectroscopic completeness for the cluster galaxies is not considered in the phase-space diagram. For a quantitative comparison, we also present the / histograms of the two populations at 1 and 4. The / distribution is less affected by galaxy magnitude and colours, so we include all the cluster galaxies in the histograms. Both histograms are nearly flat and identical (-value of the Kolmogorov–Smirnov test = 0.213) in the field environment (i.e. 4). Inside the clusters, the cluster galaxies are naturally biased towards small /, even though the number of galaxies with / 1 is only 1.66 times larger than that with / 4: this may be due to non-negligible uncertainty of (Rines et al., 2018; Sohn et al., 2018). Interestingly, the Mg ii absorbers have rather large /. As a result, the two histograms are significantly different from each other (-value = 0.010; 2.6 level) in the clusters. It emphasizes that Mg ii absorbers disfavour cluster environments.
If we recalculate the values obtained in Section 4.2 using Mg ii absorbers and cluster galaxies with / 1, the radial density variations of absorbers and bright-blue galaxies become 1.331.18 and 5.882.64, respectively, leading to the change of relative halo size in the clusters from 0.710.11 to 0.480.24. This result shows that cluster environmental effects can be evaluated more accurately within the narrower search window. However, it is quite uncertain because there is only one absorber at 1 and with / 1.
5 Summary
Using the redMaPPer galaxy clusters and SDSS DR14 quasars, we obtain 96 759 quasar-cluster pairs. We then detect intervening Mg ii absorption line features in the background quasar spectra. Our main results are as follows.
-
1.
We find 197 Mg ii absorbers with 0.3 Å. The reliability of our identification is estimated to be 72 per cent. Their line parameters are not correlated with the cluster properties.
-
2.
The Mg ii absorber detection rate per quasar is 2.700.66 times higher inside the clusters than outside the clusters. It shows that Mg ii absorbers are abundant in clusters compared to in fields.
-
3.
Because the galaxy number density is much higher inside the clusters than outside the clusters, the absorber-to-galaxy ratio is relatively low inside the clusters. We suggest that a typical halo size of (bright-blue) galaxies in clusters is 0.710.11 times that in fields.
It is not easy to study environmental effects on the CGM in detail with individual Mg ii absorbers due to small number statistics. Using stacked spectra of quasars around cluster galaxies, we plan to further investigate how the radial profile of Mg ii absorption strength depends on galaxy and cluster properties.
Acknowledgements
We thank Daeseong Park for discussions in the continuum estimation. We are grateful to an anonymous referee whose comments helped to improve the original manuscript.
Funding for the Sloan Digital Sky Survey IV has been provided by the Alfred P. Sloan Foundation, the U.S. Department of Energy Office of Science and the Participating Institutions. SDSS-IV acknowledges support and resources from the Center for High-Performance Computing at the University of Utah. The SDSS web site is www.sdss.org.
SDSS-IV is managed by the Astrophysical Research Consortium for the Participating Institutions of the SDSS Collaboration including the Brazilian Participation Group, the Carnegie Institution for Science, Carnegie Mellon University, the Chilean Participation Group, the French Participation Group, Harvard-Smithsonian Center for Astrophysics, Instituto de Astrofísica de Canarias, The Johns Hopkins University, Kavli Institute for the Physics and Mathematics of the Universe (IPMU) / University of Tokyo, Lawrence Berkeley National Laboratory, Leibniz Institut für Astrophysik Potsdam (AIP), Max-Planck-Institut für Astronomie (MPIA Heidelberg), Max-Planck-Institut für Astrophysik (MPA Garching), Max-Planck-Institut für Extraterrestrische Physik (MPE), National Astronomical Observatories of China, New Mexico State University, New York University, University of Notre Dame, Observatário Nacional / MCTI, The Ohio State University, Pennsylvania State University, Shanghai Astronomical Observatory, United Kingdom Participation Group, Universidad Nacional Autónoma de México, University of Arizona, University of Colorado Boulder, University of Oxford, University of Portsmouth, University of Utah, University of Virginia, University of Washington, University of Wisconsin, Vanderbilt University and Yale University.
Data Availability
The data underlying this article are available in the article and in its online supplementary material.
References
- Abolfathi et al. (2018) Abolfathi B. et al., 2018, ApJS, 235, 42
- Adelberger et al. (2005) Adelberger K. L., Shapley A. E., Steidel C. C., Pettini M., Erb D. K., Reddy N. A., 2005, ApJ, 629, 636
- Ahumada et al. (2020) Ahumada R. et al., 2020, ApJS, 249, 3
- Aihara et al. (2011) Aihara H. et al., 2011, ApJS, 193, 29
- Bergeron (1986) Bergeron J., 1986, A&A, 155, L8
- Blanton & Roweis (2007) Blanton M. R., Roweis S., 2007, AJ, 133, 734
- Bordoloi et al. (2011) Bordoloi R. et al., 2011, ApJ, 743, 10
- Bouché et al. (2006) Bouché N., Murphy M. T., Péroux C., Csabai I., Wild V., 2006, MNRAS, 371, 495
- Burchett et al. (2018) Burchett J. N., Tripp T. M., Wang Q. D., Willmer C. N. A., Bowen D. V., Jenkins E. B., 2018, MNRAS, 475, 2067
- Butsky et al. (2019) Butsky I. S., Burchett J. N., Nagai D., Tremmel M., Quinn T. R., Werk J. K., 2019, MNRAS, 490, 4292
- Cantalupo et al. (2014) Cantalupo S., Arrigoni-Battaia F., Prochaska J. X., Hennawi J. F., Madau P., 2014, Nature, 506, 63
- Carlberg et al. (1997) Carlberg R. G., Yee H. K. C., Ellingson E., 1997, ApJ, 478, 462
- Charlton et al. (2003) Charlton J. C., Ding J., Zonak S. G., Churchill C. W., Bond N. A., Rigby J. R., 2003, ApJ, 589, 111
- Chen et al. (2010a) Chen H.-W., Wild V., Tinker J. L., Gauthier J.-R., Helsby J. E., Shectman S. A., Thompson I. B., 2010, ApJ, 724, L176
- Chen et al. (2010b) Chen H.-W., Helsby J. E., Gauthier J.-R., Shectman S. A., Thompson I. B., Tinker J. L., 2010, ApJ, 714, 1521
- Chynoweth et al. (2008) Chynoweth K. M., Langston G. I., Yun M. S., Lockman F. J., Rubin K. H. R., Scoles S. A., 2008, AJ, 135, 1983
- Chung et al. (2009) Chung A., van Gorkom J. H., Kenney J. D. P., Crowl H., Vollmer B., 2009, AJ, 138, 1741
- Clerc et al. (2016) Clerc N. et al., 2016, MNRAS, 463, 4490
- Comparat et al. (2016) Comparat J. et al., 2016, A&A, 592, A121
- Cowie & Songaila (1977) Cowie L. L., Songaila A., 1977, Nature, 266, 501
- Daddi et al. (2020) Daddi E. et al., 2020, preprint (arXiv:2006.11089)
- Dawson et al. (2013) Dawson K. S. et al., 2013, AJ, 145, 10
- Dawson et al. (2016) Dawson K. S. et al., 2016, AJ, 151, 44
- Eisenstein et al. (2001) Eisenstein D. et al., 2001, AJ, 122, 2267
- Gallazzi et al. (2005) Gallazzi A., Charlot S., Brinchmann J., White S. D. M., Tremonti C. A., 2005, MNRAS, 362, 41
- Gunn & Gott (1972) Gunn J. E., Gott J. R., 1972, ApJ, 176, 1
- Hwang et al. (2010) Hwang H. S. et al., 2010, A&A, 522, A33
- Hwang et al. (2014) Hwang H. S., Geller M. J., Diaferio A., Rines K. J., Zahid H. J., 2014, ApJ, 797, 106
- Kacprzak, Churchill, & Nielsen (2012) Kacprzak G. G., Churchill C. W., Nielsen N. M., 2012, ApJ, 760, L7
- Lan, Ménard, & Zhu (2014) Lan T.-W., Ménard B., Zhu G., 2014, ApJ, 795, 31
- Lan & Mo (2018) Lan T.-W., Mo H., 2018, ApJ, 866, 36
- Larson, Tinsley, & Caldwell (1980) Larson R. B., Tinsley B. M., Caldwell C. N., 1980, ApJ, 237, 692
- Lehner et al. (2018) Lehner N., Wotta C. B., Howk J. C., O’Meara J. M., Oppenheimer B. D., Cooksey K. L., 2018, ApJ, 866, 33
- Lopez et al. (2008) Lopez S. et al., 2008, ApJ, 679, 1144
- Markwardt (2009) Markwardt C. B., 2009, in Bohlender D. A., Durand D., Dowler P., eds, ASP Conf. Ser. Vol. 411, Astronomical Data Analysis Software and Systems XVIII, Astron. Soc. Pac., San Francisco, p. 251
- Manuwal et al. (2019) Manuwal A., Narayanan A., Muzahid S., Charlton J. C., Khaire V., Chand H., 2019, MNRAS, 485, 30
- Merritt (1984) Merritt D., 1984, ApJ, 276, 26
- Monna et al. (2015) Monna A. et al., 2015, MNRAS, 447, 1224
- Monna et al. (2017) Monna A. et al., 2017, MNRAS, 465, 4589
- Moore et al. (1996) Moore B., Katz N., Lake G., Dressler A., Oemler A., 1996, Nature, 379, 613
- Nielsen et al. (2018) Nielsen N. M., Kacprzak G. G., Pointon S. K., Churchill C. W., Murphy M. T., 2018, ApJ, 869, 153
- Padilla et al. (2009) Padilla N., Lacerna I., Lopez S., Barrientos L. F., Lira P., Andrews H., Tejos N., 2009, MNRAS, 395, 1135
- Pâris et al. (2018) Pâris I. et al., 2018, A&A, 613, 51
- Park & Hwang (2009) Park C., Hwang H. S., 2009, ApJ, 699, 1595
- Peebles (1993) Peebles P. J. E., 1993, Princeton Series in Physics (Princeton, NJ: Princeton Univ. Press)
- Prochaska et al. (2013) Prochaska J. X. et al., 2013, ApJ, 776, 136
- Raghunathan et al. (2016) Raghunathan S., Clowes R. G., Campusano L. E., Söchting I. K., Graham M. J., Williger G. M., 2016, MNRAS, 463, 2640
- Rao, Turnshek, & Nestor (2006) Rao S. M., Turnshek D. A., Nestor D. B., 2006, ApJ, 636, 610
- Rines et al. (2018) Rines K. J., Geller M. J., Diaferio A., Hwang H. S., Sohn J., 2018, ApJ, 862, 172
- Rubin et al. (2018) Rubin K. H. R., Diamond-Stanic A. M., Coil A. L., Crighton N. H. M., Moustakas J., 2018, ApJ, 853, 95
- Rykoff et al. (2014) Rykoff E. S. et al., 2014, ApJ, 785, 104
- Rykoff et al. (2016) Rykoff E. S. et al., 2016, ApJS, 224, 1
- Salim et al. (2007) Salim S. et al., 2007, ApJS, 173, 267
- Sohn et al. (2018) Sohn J., Geller M. J., Rines K. J., Hwang H. S., Utsumi Y., Diaferio A., 2018, ApJ, 856, 172
- Steidel et al. (2002) Steidel C. C., Kollmeier J. A., Shapley A. E., Churchill C. W., Dickinson M., Pettini M., 2002, ApJ, 570, 526
- Steidel et al. (2010) Steidel C. C. et al., 2010, ApJ, 717, 289
- Strauss et al. (2002) Strauss M. A. et al., 2002, AJ, 124, 1810
- Tegmark et al. (2004) Tegmark M. et al., 2004, ApJ, 606, 702
- Tumlinson et al. (2017) Tumlinson J., Peeples M. S., Werk J. K, 2017, ARA&A, 55, 389
- Wolfe et al. (2013) Wolfe S. A., Pisano D. J., Lockman F. J., McGaugh S. S., Shaya E. J., 2013, Nature, 497, 224
- Yoon & Putman (2013) Yoon J. H., Putman M. E., 2013, ApJ, 772, L29
- Yoon & Putman (2017) Yoon J. H., Putman M. E., 2017, ApJ, 839, 117
- York et al. (2000) York D. G. et al., 2000, AJ, 120, 1579
- Zhang et al. (2016) Zhang H., Zaritsky D., Zhu G., Ménard B., Hogg D. W., 2016, ApJ, 833, 276
- Zhao et al. (2019) Zhao Y., Ge J., Yuan X., Zhao T., Wang C., Li X., 2019, MNRAS, 487, 801
- Zhu & Ménard (2013) Zhu G., Ménard B., 2013, ApJ, 770, 130
Appendix A Comparison with the JHU catalogue
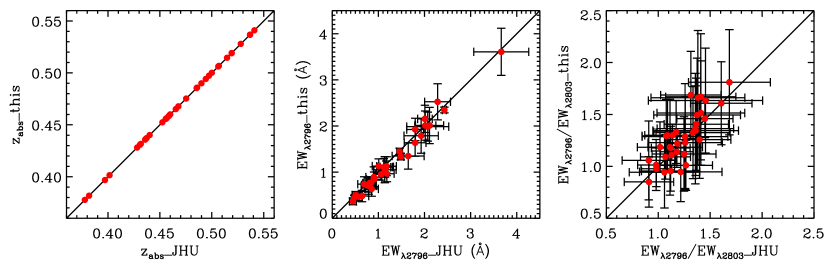
Zhu & Ménard (2013) provide a large sample of intervening Mg ii absorbers. Their data sets101010 https://www.guangtunbenzhu.com/jhu-sdss-metal-absorber-catalog are updated using the SDSS DR7 and DR12, the JHU catalogue hereafter. In the JHU catalogue, we find 124 absorbers associated with the redMaPPer clusters (i.e. 5 and / 5). Among them, 67 absorbers satisfy the criteria of S/N 3 for both and in their calculation. The 36 absorbers are also found in this study. For these common absorbers, our measurements are fully consistent with those in the JHU catalogue, as shown in Figure 11. The measurement errors are comparable with each other as well. There are 31 absorbers not selected in this study. These do not go through the automated pipeline mentioned in Section 3 mostly because the line strength is weak: the S/N of or is less than 3 in our calculation. The example spectra of the absorbers missed in this study are presented in the top panels of Figure 12. Although we choose the five cases with the highest S/N of total EW, the spectra are quite noisy.

On the other hand, among the 197 absorbers in this study, 80 absorbers are not included in the JHU catalogue due to the small sample of quasars used. The 76 absorbers are outside the search window of Zhu & Ménard (2013). They searched for Mg ii absorbers within a restrictive redshift range111111 Among the 197 absorbers in this study, only 64 absorbers are inside the search window of Zhu & Ménard (2013). Their method is effective to minimize contamination by considering that separation/resolution distribution of the 64 absorbers is strongly concentrated at zero. However, it seems to eliminate a significant fraction of real absorbers. to avoid false detections from intervening C iv and Milky Way Ca ii absorption lines. Among the remaining 41 absorbers, 36 absorbers are found in the JHU catalogue, but five ones are missed. The spectra of the absorbers missed in the JHU catalogue are shown in the bottom panels of Figure 12. We check that these absorbers are not contaminated by Fe ii lines (see section 2.2.3 of Zhu & Ménard 2013). It is beyond the scope of this study to understand why they could not find these absorbers (see also Zhao et al. 2019).