Evidence of extended emission in GRB 181123B and other high-redshift short GRBs
Abstract
We study the high-energy properties of GRB 181123B, a short gamma-ray burst (sGRB) at redshift 1.75. We show that, despite its nominal short duration with 2 s, this burst displays evidence of a temporally extended emission (EE) at high energies and that the same trend is observed in the majority of sGRBs at 1. We discuss the impact of instrumental selection effects on the GRB classification, stressing that the measured is not an unambiguous indicator of the burst physical origin. By examining their environment (e.g. stellar mass, star formation, offset distribution), we find that these high- sGRBs share many properties of long GRBs at a similar distance and are consistent with a short-lived progenitor system. If produced by compact binary mergers, these sGRBs with EE may be easier to localize at large distances and herald a larger population of sGRBs in the early universe.
Subject headings:
gamma-ray burst: general – star: neutron – nuclear reactions, nucleosynthesis, abundances – gravitational waves1. Introduction
Gamma-ray busts (GRBs) are brief flashes of gamma-ray radiation detected at a rate of 1 per day. They are grouped into two main classes based on their bimodal distribution in duration (Kouveliotou et al., 1993): long duration bursts are related to the collapse of very massive stars (e.g. Woosley & Bloom, 2006), whereas short duration GRBs (sGRBs) are traditionally connected to mergers of compact objects (e.g. Eichler et al., 1989; Narayan, Paczynski, & Piran, 1992). The first joint detection of a gravitational wave (GW) event (GW170817) and a sGRB (GRB170817A; Abbott et al. 2017) unambiguously established the link between neutron star (NS) mergers and some sGRBs. The subsequent discovery of the kilonova AT2017gfo provided the first robust evidence for production of heavy metals in the merger ejecta (e.g., Watson et al., 2019), thus confirming that NS mergers are one of the astrophysical sites of r-process nucleosynthesis. This is also supported by the detection of candidate kilonovae in some nearby sGRBs (e.g. Tanvir et al., 2013; Troja et al., 2019; Ascenzi et al., 2019; Jin et al., 2020). However, the cosmic origin of r-process elements is still far from being settled (Cowan et al., 2020). Many open questions remain, among them is whether NS mergers can account for the r-process enhancement of metal-poor stars and dwarf galaxies (Roederer et al., 2016; Beniamini et al., 2016b, c; Frebel, 2018; Skúladóttir et al., 2018).
While the gravitational wave signal from these mergers can be detected out to a few hundred Mpc (Abbott et al., 2020), sGRBs span a wider range of redshifts (from 0.1 to 2; Selsing et al., 2019), and therefore are a unique tool to pinpoint NS mergers across all cosmic times. The redshift distribution of sGRBs is a key observational input to infer the age of their stellar progenitors (McCarthy, Zheng, & Ramirez-Ruiz, 2020; Anand et al., 2018; Behroozi, Ramirez-Ruiz, & Fryer, 2014; Zheng & Ramirez-Ruiz, 2007), and thus estimate their contribution to the cosmic chemical evolution. For instance, sGRBs can be used to infer the observational delay time111The delay time is defined as the time elapsed between the last burst of star formation and the merger. distribution (DTD) of NS mergers, which can then be compared to the theoretically predicted DTDs for different formation channels. The DTD implied by sGRB observations is consistent with either a log-normal (e.g. Paterson et al., 2020) or a power-law distribution with index between -1, in agreement with population studies (Dominik et al., 2012), and -1.5 (D’Avanzo et al., 2014). The shallower slope (-1) points to a population of old mergers, which underpredicts the r-process abundances in early metal-poor stars (Hotokezaka, Beniamini, & Piran, 2018) and is inconsistent with observations of Galactic binary neutron stars (BNS) which imply typical delay times shorter than 1 Gyr (Beniamini & Piran, 2019). Such a shallow DTD may require invoking another prompt channel of r-process production, such as supernovae (e.g. Fryer et al., 2006), with similar overall yields. Instead, a steeper slope of the DTD (-1.5) implies the existence of tighter binary systems, which merge on timescales of Myr (Belczynski et al., 2006). This prompt channel of mergers would yield a better agreement with the Galactic chemical composition (Côté et al., 2019).
To date, out of 130 sGRBs detected by the Neil Gehrels Swift observatory (Gehrels et al., 2004), only 25% have a measured redshift, and less than 5% are found at 1. Any inference about the DTD of sGRB progenitors is therefore affected by large uncertainties due to the small number of events and to complex observational biases. These biases affect the galaxy’s identification, its redshift measurement, and the classification of the GRB itself. In particular, the 222The time during which the cumulative time counts increase from 5 to 95% above background, thus encompassing 90% of the total GRB counts (Kouveliotou et al., 1993)., largely used to parametrize the burst duration and discriminate between the two classes of bursts, can be significantly affected by instrumental selection effects, especially for high redshift GRBs. Several works already explored the limitations of an empirical GRB classification and proposed new methods (Dainotti et al., 2020; Dereli-Bégué et al., 2020; Jespersen et al., 2020; Li et al., 2020; Bromberg et al., 2013; Virgili et al., 2011; Bloom, Butler, & Perley, 2008; Zhang et al., 2009), yet the identification of a sGRB remains strongly connected with its reported .
Ambiguity in the classification of GRBs arise not only between the two main classes of bursts (long versus short), but also in the identification of “hybrid” events, such as short GRBs with extended emission (sGRBEE; Norris & Bonnell 2006; Gehrels et al. 2006). These bursts are characterized by a main peak with the typical features of a sGRB (short duration, hard spectrum and negligible spectral lag), followed by a lull and then a temporally extended tail, which is spectrally softer and can last several tens of seconds. These sGRBEEs are found in a heterogeneous environment and are not associated with any bright SNe (e.g. Barthelmy et al., 2005a; Covino et al., 2006; D’Avanzo et al., 2009), although constraints are available only for a few nearby events. This evidence seems to favor a physical link between sGRBEEs and sGRBs, although the long duration ( 2 s) of their high-energy emission poses a challenge to our common understanding of NS mergers. Possible explanations for their phenomenology include the formation of a long-lived highly magnetized NS (magnetar; Gompertz et al., 2013), a NS-black hole (BH) encounter (Troja et al., 2008), a core-collapse fallback SN (Valenti et al., 2009), or more simply viewing angle effects (Barkov & Pozanenko, 2011; Oganesyan et al., 2020). The latter scenario is consistent with the redshift distribution found by Anand et al. (2018) who observe no significant difference between the two classes and support an old progenitor system. Alternatively, sGRBEEs may not fit at all into the collapsar/merger dichotomy and herald a novel and rare channel of GRB production (e.g. Lyutikov & Toonen, 2017; King, Olsson, & Davies, 2007; Fryer et al., 1999). Therefore it is still an open question whether the diverse phenomenology of the high-energy emission reflects a true diversity in progenitors or central engines, and whether sGRBEEs could trace the evolution of NS mergers as sGRBs do.
The distinction between the two sub-classes of bursts (sGRBs and sGRBEEs) is generally evident at low redshifts. With typical luminosities in the range – erg/s, the EE is readily detected by Swift and drives the GRB duration to 100 s. In these cases, the main observational challenge is to discriminate between sGRBEEs and standard long duration GRBs (Gehrels et al., 2006). However, at higher redshifts ( 1) - which are critical to probe the DTD of NS mergers - instrumental effects become important and the EE more easily escapes detection, blurring the distinction between sGRBs and sGRBEEs.
In this work, we present our study of the high-energy properties of the short GRB 181123B, recently localized by Paterson et al. (2020) at redshift 1.75, and other candidate high- sGRBs. We show that, despite the canonical classification of a 2 s, the majority of these bursts show evidence of long-lived emission at high energies. The paper is organized as follows: in Section 2 we report the procedure used to analyze the Swift data of GRB 181123B and of a selected sample of short GRBs at high redshift. In Section 3 we report the results obtained from this analysis, studying the possible presence of an extended emission during the prompt phase. We used simulations to investigate how instrumental selection effects can affect the burst classification and we studied the host galaxy properties deriving information about the burst environment. In Section 4 we discuss the implications of our results, considering different scenarios for the burst classification and comparing them with the observed DTD. Conclusions are summarized in Section 5. Uncertainties are quoted at the 68% confidence level (1 ) for each parameter of interest and upper limits are given at a 3 level, unless otherwise stated. We adopt a standard CDM cosmology (Planck Collaboration et al., 2020).
2. Observations and data analysis
2.1. Swift/BAT
GRB 181123B triggered the Burst Alert Telescope (BAT; Barthelmy et al., 2005b) aboard Swift at = 05:33:03 UT on November 23, 2018. The spacecraft rapidly slewed to the burst position in order to begin observations with its narrow field instruments.
The Swift/BAT data were processed using the heasoft package (v6.25). The energy calibration was applied with bateconvert and the mask weighting was included with batmaskwtevt. We derive a s running battblock over the 16 ms mask-weighted light curve extracted in the 15-350 keV energy band. The time-averaged spectrum, extracted over the time interval of +0.032 s and +0.312 s, is described by a simple power law with photon index =0.72, in agreement with the online BAT catalog333https://swift.gsfc.nasa.gov/results/batgrbcat/ (Lien et al., 2016). According to this model, the fluence is erg cm-2 in the 15-150 keV energy band (observer frame). At a redshift 1.75, it corresponds to an isotropic-equivalent energy of erg (15-150 keV; rest frame).
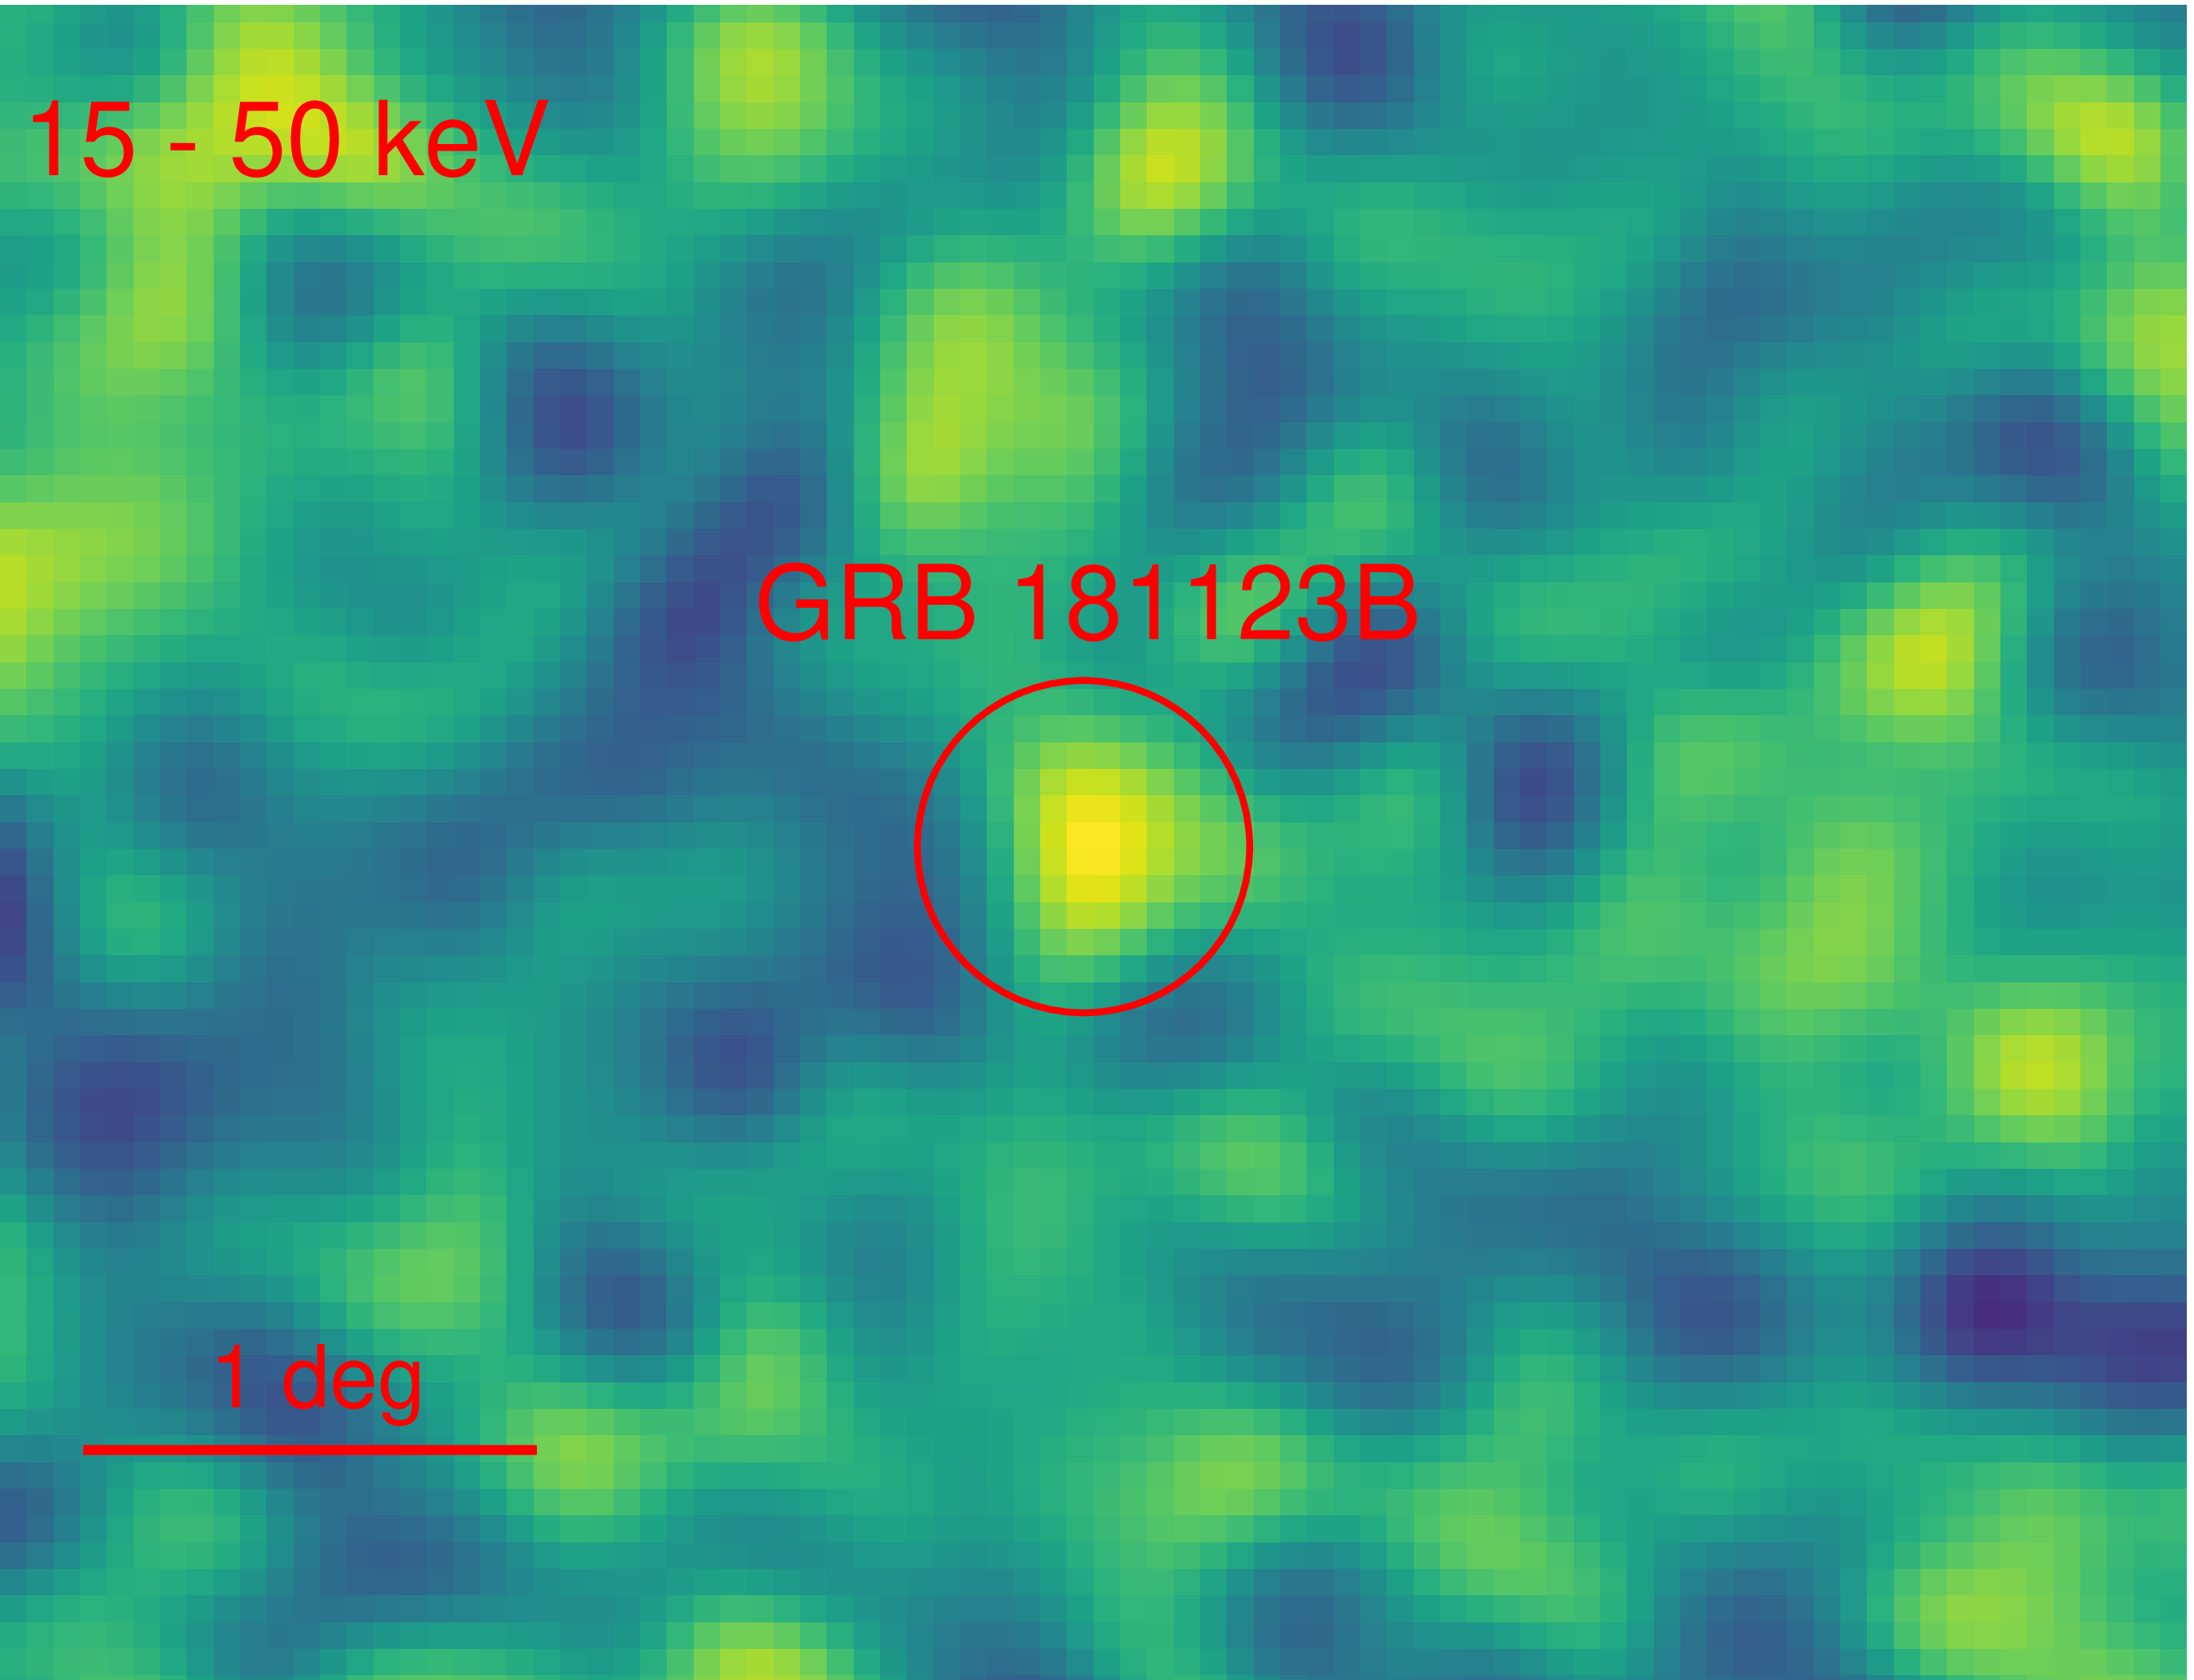
A preliminary analysis of the BAT data reported a marginal (3 ) evidence of temporally EE following the main pulse (Norris, Barthelmy, & Lien, 2018). However, standard BAT tools are optimized for pointed observations, and assume that the source remains at a fixed position on the detector plane. This is not valid for slewing intervals, occurring in this case between 16 s and 64 s post-trigger. If the movement of the source across the detector is not properly taken into account, signal from the EE might be underestimated. In order to determine the presence of EE in this burst, we follow the procedure outlined by Copete (2012) for the analysis of BAT slew data. First, we accumulate the event-mode data into a Detector Plane Image (DPI) using a fine time bin of 0.2 s, during which the source position can be considered constant. After screening for bad pixels with the task bathotpix, we use the batfftimage to create a sky image and apply standard corrections for geometrical effects and flat-fielding. At this step, we also increase the sampling of the point spread function (PSF) from the default value of 2 to 4. Images collected from +2 s to +150 s are then coadded by variance-weighted addition, and the significance of the source is determined with the task batcelldetect. We perform a targeted search at the GRB position allowing to fit for the peak position within a window of 2 pixels. We restrict our analysis to the 15-50 keV energy band, as the EE is generally more prominent at lower energies (Norris & Bonnell, 2006). The signal accumulated in this soft tail reach a significance of about 4 , and is shown in Figure 1. Previous studies of BAT images (Troja, Rosswog, & Gehrels, 2010) found that the significance calculated by batcelldetect roughly corresponds to the probability value of a Gaussian distribution. In this case the chance of a spurious detection is 10-4. Integrating this signal we found a fluence of erg cm-2 (15-50 keV), corresponding to an energy of 4 erg (15-50 keV; rest frame).
2.2. Swift/XRT
Observations with the X-Ray Telescope (XRT; Burrows et al., 2005) aboard Swift began at +80.2 s and continued until 0.7 days after the trigger, when the afterglow faded below detection threshold.
We derive the count rate X-ray light curve (0.3-10 keV) and the relevant spectra from the UK Swift Data Centre repository444https://www.swift.ac.uk/xrt_products/ (Evans et al., 2007, 2009). The X-ray temporal behavior can be described as a simple power-law, , with decay index = 1.400.08. The time average spectrum integrated between 95 s and 16 ks is well fit with a simple power law with a photon index of , a galactic absorption = 3.1 1020 cm-2 (Willingale et al., 2013) and an intrinsic absorption 9 1020 cm-2. We use these spectral parameters to convert the light curve to the unabsorbed flux (0.3-10 keV) using the conversion factor of 3.7 10-11 erg cm-2 ct-1. A basic comparison with the closure relations (Zhang & Mészáros, 2004) shows that the measured spectral and temporal parameters could be consistent with a simple forward shock model, in either slow cooling or fast cooling regime, provided that the power-law index of the accelerated electron distribution is 2.6.
| GRB name | EE | Signif. | HRc | Pop. Age | log(M/M⊙) | SFR | Offset | ||||
|---|---|---|---|---|---|---|---|---|---|---|---|
| [SNR] | [s] | [erg] | % | [Gyrs] | [M⊙/yr] | [kpc] | |||||
| 051210f | 1.4 | yes | 3.3 | 1.300.30 | 1.90.5 | ||||||
| 060121 | 1.7 | yes | 3.3 | 1.970.06 | 1.50.2 | 3.6 | - | - | - | ||
| 090426A | 2.609 | no | - | 1.240.25 | 1.10.3 | ||||||
| 111117A | 2.211 | no | - | 0.460.05 | 2.80.6 | ||||||
| 120804A | yes | 4.2 | 0.810.08 | 1.60.1 | |||||||
| 121226A | no | - | 1.010.20 | 1.40.4 | |||||||
| 160410A | 1.717 | yes | 6.9 | 9650 | 2.30.5 | - | - | - | - | ||
| 181123B | 1.754 | yes | 4.0 | 0.260.04 | 2.40.6 |
a References: GRB 051210 Berger et al. (2007), GRB 060121 de Ugarte Postigo et al. (2006), GRB 090426 Levesque et al. (2010), GRB 111117A Selsing et al. (2018), GRB 120804A Berger et al. (2013), GRB 121226A Selsing et al. (2016), GRB 181123B Paterson et al. (2020)
b values were retrieved from the Swift BAT GRB catalog
(Lien et al., 2016).
c The hardness ratio is reported only for the main short duration peak, and computed as the ratio between the fluences in the 50-100 keV and 25-50 keV energy range. For GRB 060121, the value was retrieved from de Ugarte Postigo et al. (2006) and is the fluence ratio between the 100-300 keV and 50-100 keV energy range.
d is derived in the 15-150 keV energy band (rest frame); except for the HETE-2 GRB 060121, for which it was derived in the 2-400 keV energy range (observer frame).
e Probability that the GRB belongs to the class of non-collapsar events. Derived using the equations presented in Bromberg et al. (2013).
f The enhanced XRT position does not include the putative host galaxy proposed by Berger et al. (2007), from which this redshift constraint is derived. The chance probability for this GRB/galaxy association is 15%.
2.3. Search for extended emission in other high-z sGRBs
Fostered by the detection of EE in GRB181123B, we follow the same procedure to analyze the BAT data obtained for other sGRBs (see Table 1) associated to high- ( 1) host galaxies. These include GRB 051210 (La Parola et al., 2006; Berger et al., 2007), GRB060121 (Donaghy et al., 2006; de Ugarte Postigo et al., 2006), GRB 090426 (Levesque et al., 2010; Antonelli et al., 2009), GRB111117A (Sakamoto et al., 2013; Selsing et al., 2018), GRB120804A (Berger et al., 2013) and GRB160410A (Selsing et al., 2016). To these known cases, we add GRB 121226A for which we derive 1.8 based on the analysis of its host galaxy photometry (see Sect. 3.4). We do not include GRB 150423A because the reported redshift of 1.39 (Malesani et al., 2015) is considered uncertain due to the low significance of the observed spectral features (D. Malesani, priv. comm.) and GRB 190627A at 1.9, initially classified as a short burst, but later found to have a longer duration and a soft spectrum (HR 0.7; Lien et al., 2016).
Our analysis yields a positive detection of EE in three cases: GRB 051210, GRB 160410A and GRB 120804A. In the latter case, we verified that the presence of a bright hard X-ray source (Sco X-1) within the BAT field of view does not significantly contaminate the source count rate. We do not confirm the tentative identification of EE in GRB121226A (Pandey et al., 2019), although we note that the definition of EE given in Pandey et al. (2019) differs from the one adopted in this work. As a sanity check we also tested our pipeline on two low-redshift bursts (e.g. GRB 050509B and GRB 051221A; Gehrels et al., 2005; Burrows et al., 2006) and find no evidence of EE in the BAT data.
For each high- burst we compute the (15-150 keV, rest frame) and the hardness ratio (HR), defined as the fluence ratio between the ranges 50-100 keV and 25-50 keV. We add to our sample GRB 060121, for which evidence of EE was observed in the High Energy Transient Explorer 2 (HETE-2) data (Donaghy et al., 2006). In this case, the HR reported in Table 1 refers to the ratio between the 100-300 keV and 50-100 keV fluences (de Ugarte Postigo et al., 2006). The results are summarized in Table 1.
3. Results
3.1. Evidence of extended emission in GRB181123B
In Section 2.1, we find that a long-lasting signal, compatible with EE, is seen in the BAT image below 50 keV. Here we show that the tail of this EE is also visible in the early (600 s) XRT light curve. We use the optical emission as a tracer of the standard forward shock afterglow, and examine whether the observed X-rays belong to the same emission component.
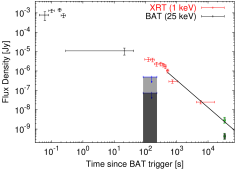
We consider the early UVOT upper limit Wh 21 AB mag at 158.5 s (Oates & Lien, 2018) and the optical detection =25.1 0.4 at 0.38 d (Paterson et al., 2020). After correcting for a Galactic extinction of =0.03 mag (Schlafly & Finkbeiner, 2011) and the expected absorption due to the Lyman beak at 1.75, we extrapolate the optical fluxes to 1 keV assuming two different spectral shapes. In the first case, we assume a simple power-law spectrum connecting the X-ray and optical data with the spectral index defined by the X-ray spectra, = -1 1.0 (Section 2.2). In the second case, we assume a cooling break between the optical and X-rays with the optical index defined by the closure relations ( =-0.5; Zhang & Mészáros, 2004). The highest X-ray flux is obtained assuming a cooling break at =0.3 keV (right below the XRT energy band).
Figure 2 shows the comparison between the observed X-ray light curve and the extrapolation of the optical data. To guide the eye we also show the power-law decay of the late X-ray afterglow (solid line in Figure 2). If the optical and X-ray emission are produced from the same forward shock, then the X-ray light curve should lie within the shaded regions of the optical data. This is observed for the i-band data point at 0.4 d (the extrapolation lies exactly on the solid line when we assume a cooling break between X-ray and optical), but it is not seen at earlier times. Figure 2 shows that the extrapolation of the UVOT limit substantially underpredicts the observed X-ray emission at 150 s. By assuming a Milky Way extinction law (Fitzpatrick, 1999), only a dust extinction as high as 2 could reconcile the X-ray afterglow with the optical extrapolation. This value is highly unusual for short GRBs and it is not consistent with the limits on intrinsic absorption placed by the X-ray spectrum. Therefore, although the X-ray dataset could be consistent with a simple forward shock model (Section 2.2), the joint analysis of the X-ray and optical data reveals an additional emission component in the X-ray band, not related to standard forward shock emission. We therefore suggest that the early X-ray light curve is consistent with the detection of continued high-energy emission in BAT, and likely shows the final tail of the EE.
3.2. Afterglow constraints
In order to derive the afterglow parameters we remove the initial 600 s of X-ray data, which according to our analysis are contaminated by the extended emission. We include the late optical detection 25.1 AB mag, additional constraints from the near-infrared ( 23.2 AB mag), and the radio observations (Anderson et al., 2018). Data from the Australian Telescope Compact Array (ATCA) were downloaded from the public archive and analyzed following Ricci et al. (2020). Observations were taken in the 4cm band in the 6B array configuration. At the GRB position, we derive upper limits of 45 Jy at 5.5 GHz and 9 GHz at a median time of 17 hrs after the trigger.
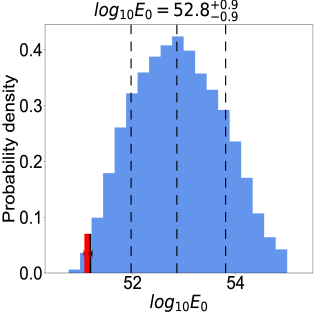
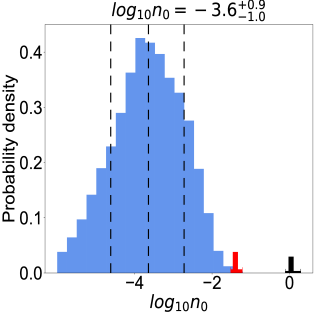
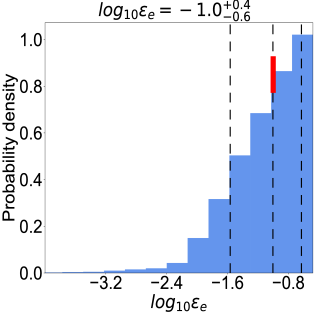
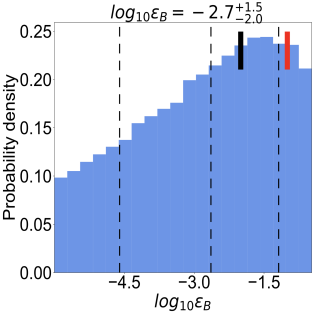
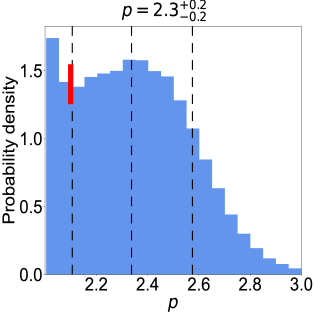
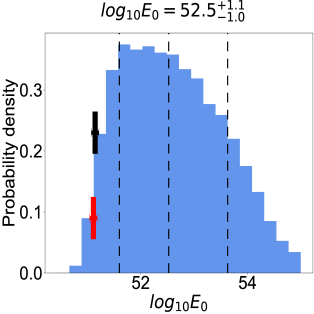
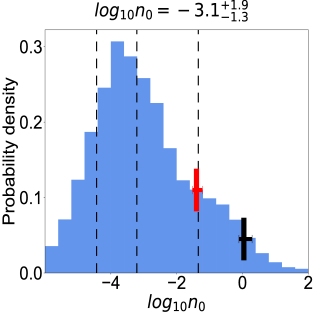
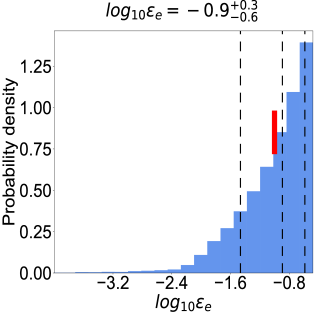
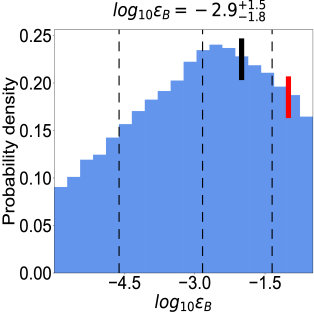
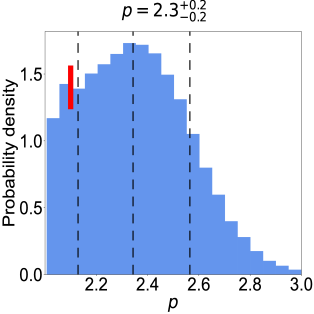
We explore the parameter space using a standard fireball model and assuming a top-hat jet. We neglect the lateral spreading effects expected for a more complex jet structure, since they are likely to be not relevant over the time span of these observations (1 d). We use afterglowpy (Ryan et al., 2020) to compute theoretical afterglow emission and fit our data using MCMC posterior sampling with EMCEE (Foreman-Mackey et al., 2013). We use 100 walkers, for 20000 steps and standard priors for the fit parameters (e.g. Troja et al., 2018, 2020; O’Connor et al., 2021). The posterior distributions of the afterglow parameters are shown in Figure 3 assuming synchrotron emission with no significant synchrotron self-Compton (SSC) cooling. As the fitted dataset is limited and does not include early X-rays, SSC cooling corrections are expected to be sub-dominant (e.g. Jacovich et al. 2020). We have verified this by performing an additional fit, allowing for SSC cooling with no Klein-Nishina (KN) corrections (Thomson SSC). The lightcurve corresponding to SSC cooling with KN corrections, necessarily lies in between Thomson SSC cooling and the opposite extreme, of pure synchrotron. The inferred parameters for the Thomson SSC fit are reported in the Appendix. decreases as expected when SSC is accounted for (Beniamini et al., 2016a). However, the decrease in this case is rather small compared to the synchrotron only case and overall the inferred parameters change very little between the two fits.
As expected, this limited dataset can only weakly constrain the parameter space. The circumburst density favors low density solutions, typical of sGRBs (O’Connor, Beniamini, & Kouveliotou, 2020), and high densities ( 10 cm-3) can be excluded at the 90% confidence level. Other parameters, such as the electron index =2.30.2, and the blastwave isotropic-equivalent energy, log(/erg) = 52.5, are consistent with typical sGRB afterglows (Fong et al., 2015). In particular, the implied efficiency of prompt -rays relative to the kinetic energy is 10%, consistent with values estimated in other GRBs (Nava et al., 2014; Beniamini et al., 2015, 2016a). The electron energy fraction appears well determined as 0.01, consistent with typical GRBs (Beniamini & van der Horst, 2017), whereas the magnetic energy fraction remains loosely defined between and 0.1 (as typically observed for other GRBs, Santana et al., 2014; Zhang et al., 2015). For comparison, the solutions proposed by Paterson et al. (2020) are marked by the vertical bars in Figure 3. By fixing several parameters (, , ) to arbitrary values, these solutions probe the low probability tail of our posterior distributions and imply an unusually high radiative efficiency (80%). A much broader range of values is instead consistent with the observations, as expected for a poorly sampled afterglow.
3.3. GRB classification
3.3.1 Duration
We find that most sGRBs located at 1 display a weak, long-lasting high-energy emission (see Table 1). However, in all but one case (GRB 160410A), this emission is not picked up by the standard pipeline and the measured is 2 s. This may be interpreted as a true physical distinction between these bursts and other sGRBEEs, whose is longer than 2 s. However, we show that instrumental selection effects are a strong determining factor.
To illustrate the role of instrumental effects in the calculation of , we consider the case of GRB 071227 with a measured of s (Lien et al., 2016). Despite its long duration, this burst is classified as a short GRB with EE based on the morphology of its gamma-ray lightcurve (a short spike followed by a weaker temporally extended tail), its environment, and the lack of SN emission to deep limits (D’Avanzo et al., 2009). According to the analysis of Norris, Gehrels, & Scargle (2011), the gamma-ray properties of GRB 071227 are representative of the general population of sGRBEEs. Below, we show that the phenomenological classification of this burst as a sGRBEE would change under different observing conditions.
We use the observed GRB light curve as input to simulate Swift/BAT observations for different observing conditions (e.g. different redshift, background level). Our code takes into account the proper instrument response matrices and trigger algorithms (Lien et al., 2014, Moss et al., in prep.), and simulates light curves at various redshifts by calculating the distance and time-dilation corrections for the input light curve. The standard Bayesian blocks tool (Scargle et al., 2013) is then ran on the simulated lightcurve to derive its .
The results are shown in Figure 4.
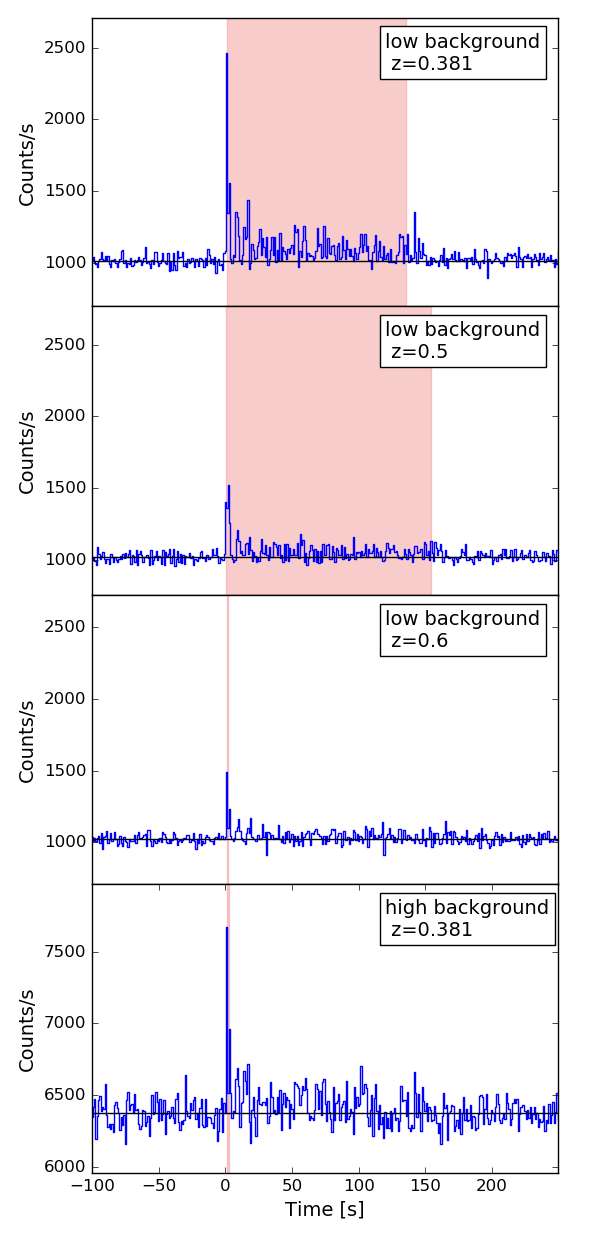
We show GRB 071227 at three different redshifts: its true value , and two higher values and . All these simulations were carried out assuming a low average background of cts/s. The shaded area shows the interval, which recovers the presence of a temporally extended emission up to =0.5. However, for 0.6 the EE becomes undetectable and the burst would be classified as a standard sGRB with 2 s. Instead, the tail of EE would remain visible in the early X-ray light curve of GRB 071227, as also seen for GRB 181123B. Similarly to GRB 181123B, the other three high- sGRB with evidence for a weak EE (GRB 051210, GRB 160410 and GRB 120804A) show a phase of rapid decay in their early X-ray afterglow (e.g. La Parola et al., 2006) consistent with the tail of the extended emission. A joint analysis of the BAT+XRT data could therefore be more effective in recovering its presence (e.g. Kisaka, Ioka, & Sakamoto, 2017).
In the bottom panel of Figure 4, we show the effect of background variations on the detectability of EE. By using a typical background value of cts/s, we find that the EE of GRB 071227 may be lost even for =0.381. The same effect applies to observations with a different number of active BAT detectors. This number has been steadily decreasing with time (cf. Figure 3 of Lien et al. 2014) and therefore the EE was more likely to be identified in the early years of the Swift mission. For example, over 24,500 detectors were active during the observations of GRB 071227, but only half of them (12,200) were on during the observations of GRB 181123B.
3.3.2 Empirical correlations
In addition to the duration and spectral hardness, other observables may aid in the GRB classification. For example, most long GRBs display a correlation between their isotropic gamma-ray energy release () and their rest-frame spectral peak energy (), known as the “Amati” relation (Amati et al., 2002).
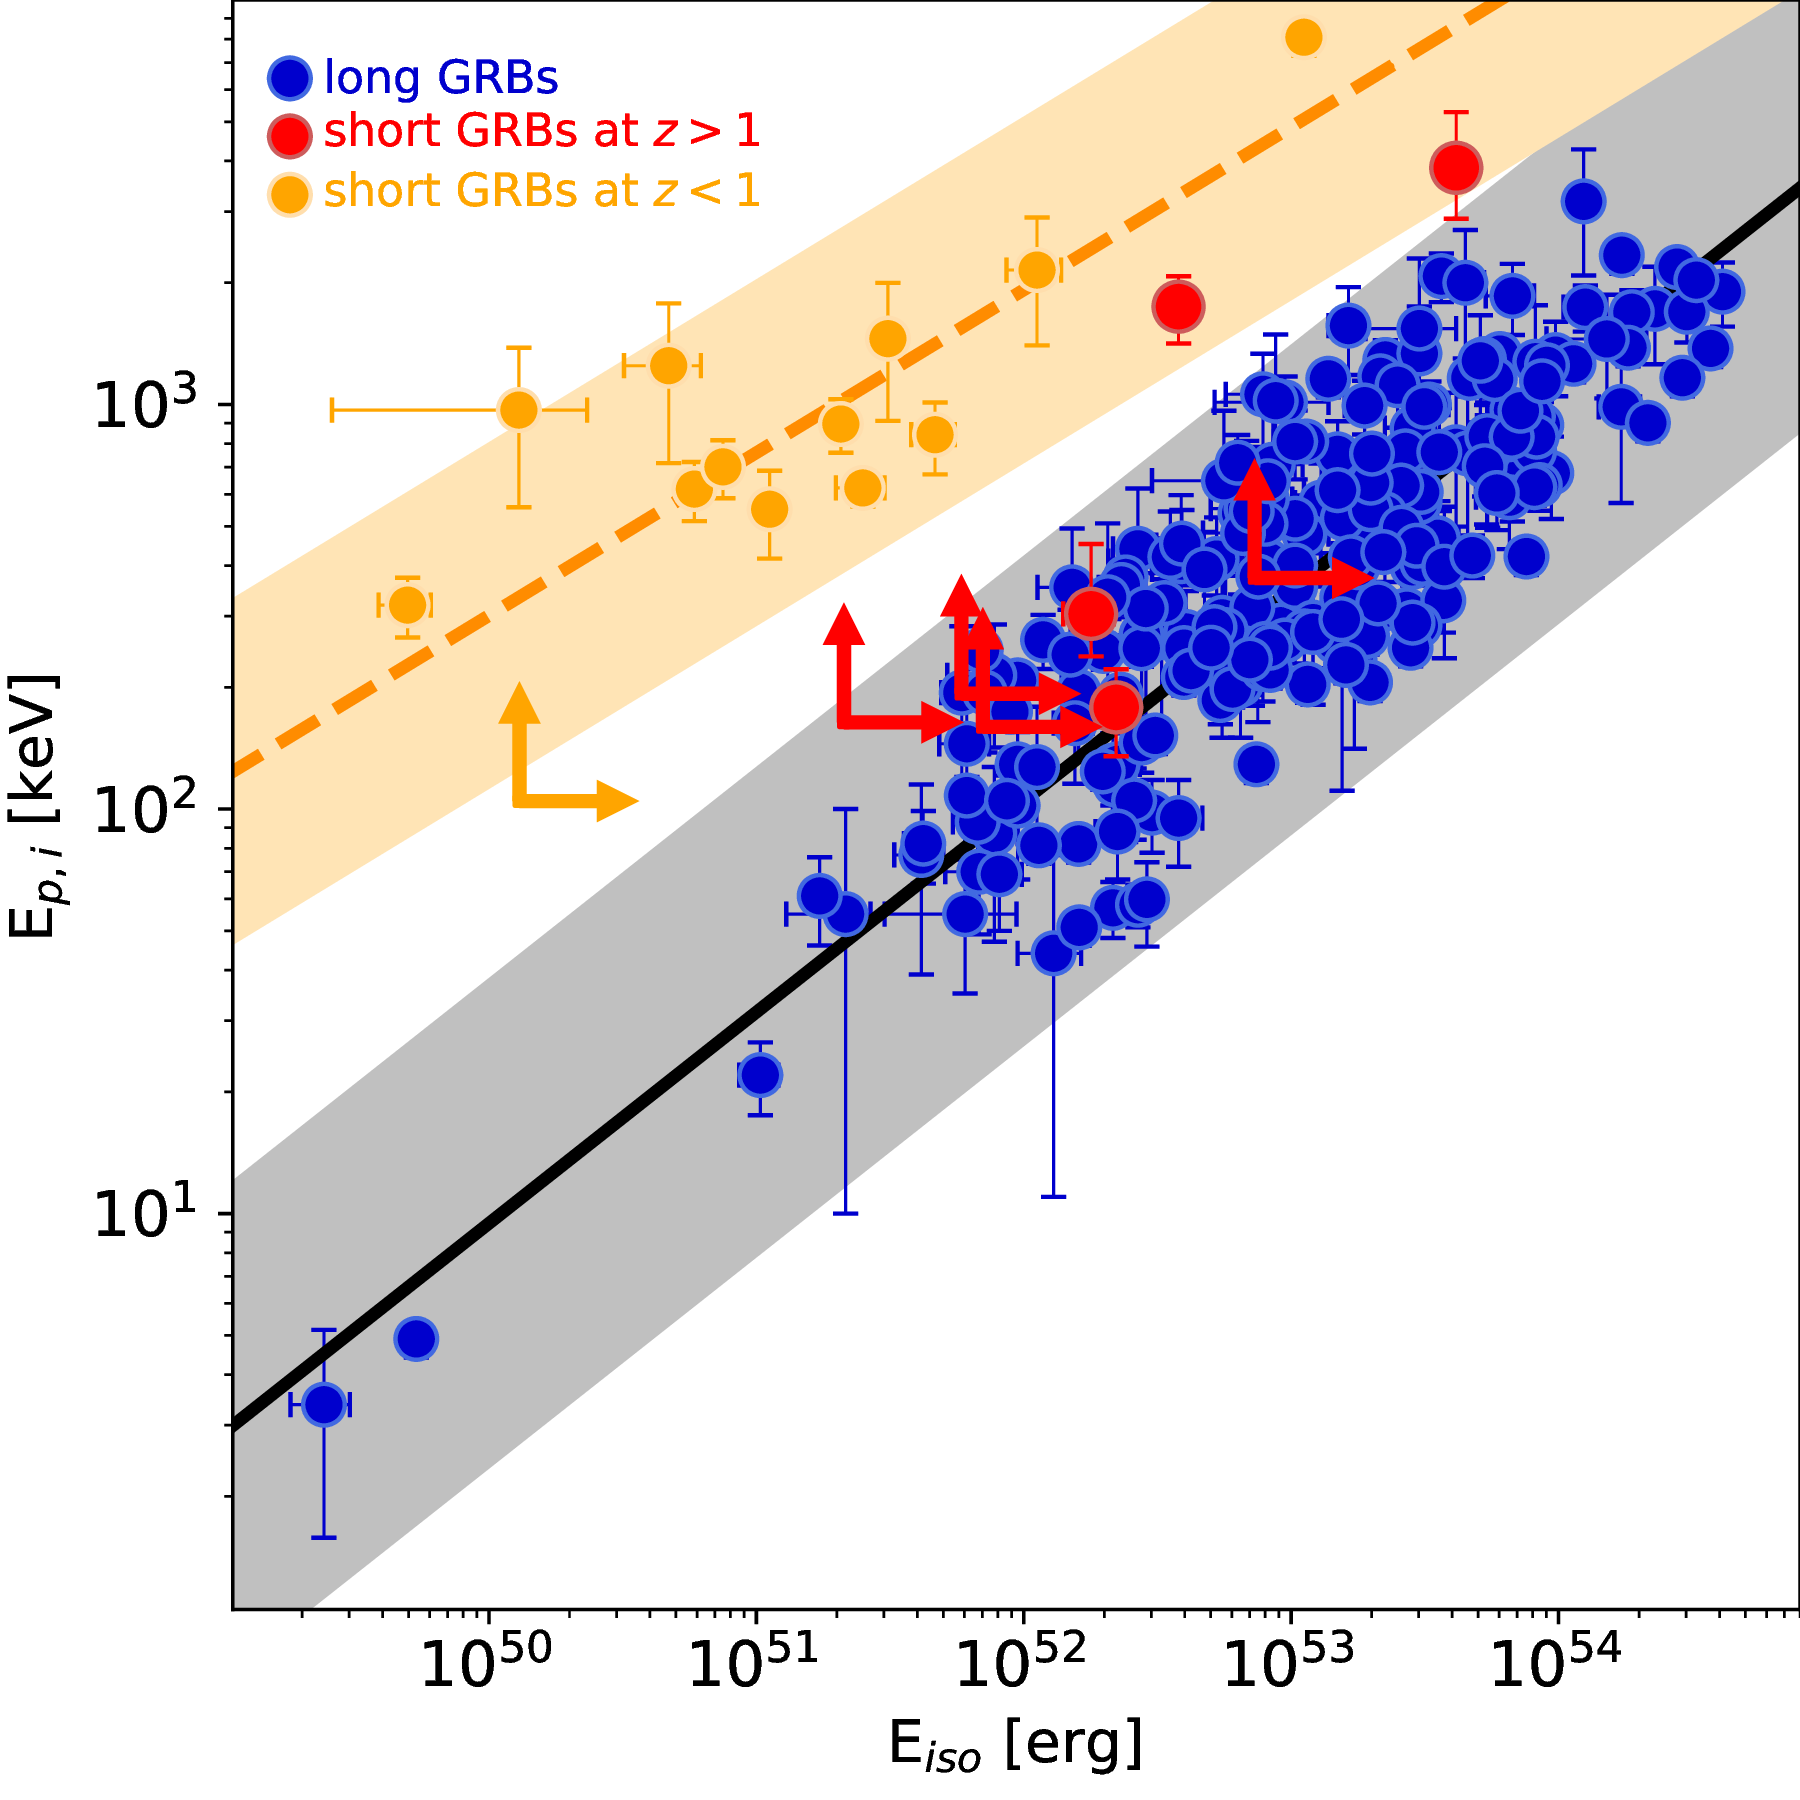
We verify whether the bursts of our sample follow the Amati relation or not, like most sGRBs. The spectral peak energies were retrieved from the literature (Donaghy et al., 2006; Sakamoto et al., 2012; Frederiks et al., 2016) and from the Fermi/GBM catalog (von Kienlin et al., 2020) when available. Otherwise, only lower limits on were derived from the analysis of the Swift BAT spectra. We find that only GRB 111117A lies outside of the 3 upper boundary (Figure 5), whereas GRB 090426A, GRB 120804A and GRB 160410A are consistent with the relation within 3 . GRB 051210, GRB 060121, GRB 181123B and GRB 121226A also fall within the correlation, but in these cases only lower limits on the peak energy and energy release are available.
A correlation between the spectral lag and the peak luminosity is also observed for many long GRBs (Norris, Marani, & Bonnell, 2000), and can be used to discriminate between the different GRB classes (e.g. Becerra et al., 2019). For the GRBs in our sample, even when the lag is small,the large uncertainty in the lag measurement combined with the high luminosity of the gamma-ray emission makes these bursts consistent (within 3 ) with the lag-luminosity relation observed for long bursts. The only exception is again GRB 111117A for which the lag is particularly well constrained (6.0 2.4 ms) and places this burst in the region populated by sGRBs.
3.4. Environment
In order to further characterize the nature of these high redshift short GRBs and their EE, we investigate their environments and compare them to the populations of long and short GRBs. Photometric observations of their host galaxies were retrieved from the literature (Leibler & Berger, 2010; Levesque et al., 2010; Sakamoto et al., 2013; Selsing et al., 2018; Berger, 2014; Paterson et al., 2020) and homogeneously modelled with Prospector (Johnson & Leja, 2017) using the same methodology described in O’Connor et al. (2021). In this work, we also present new photometric measurements for the host galaxy of GRB 121226A observed with the 8.1m Gemini South Telescope in the filters and the Very Large Telescope in the and filters. Magnitudes, calibrated to nearby PanSTARRS (Chambers et al., 2016) and 2MASS (Skrutskie et al., 2006) sources, are reported in Table 2. To model the spectral energy distribution of this specific GRB we also used the and band photometry reported by Pandey et al. (2019).
| Filter | Telescope/Instrument | AB maga |
|---|---|---|
| g | Gemini/GMOS-S | 24.3 0.4 |
| Z | Gemini/GMOS-S | 23.99 0.12 |
| Y | Gemini/GMOS-S | 23.62 0.23 |
| J | VLT/HAWK-I | 22.97 0.10 |
| K | VLT/HAWK-I | 22.43 0.09 |
a These values have been corrected for Galactic extinction due to the reddening of =0.05 (Schlafly & Finkbeiner, 2011).
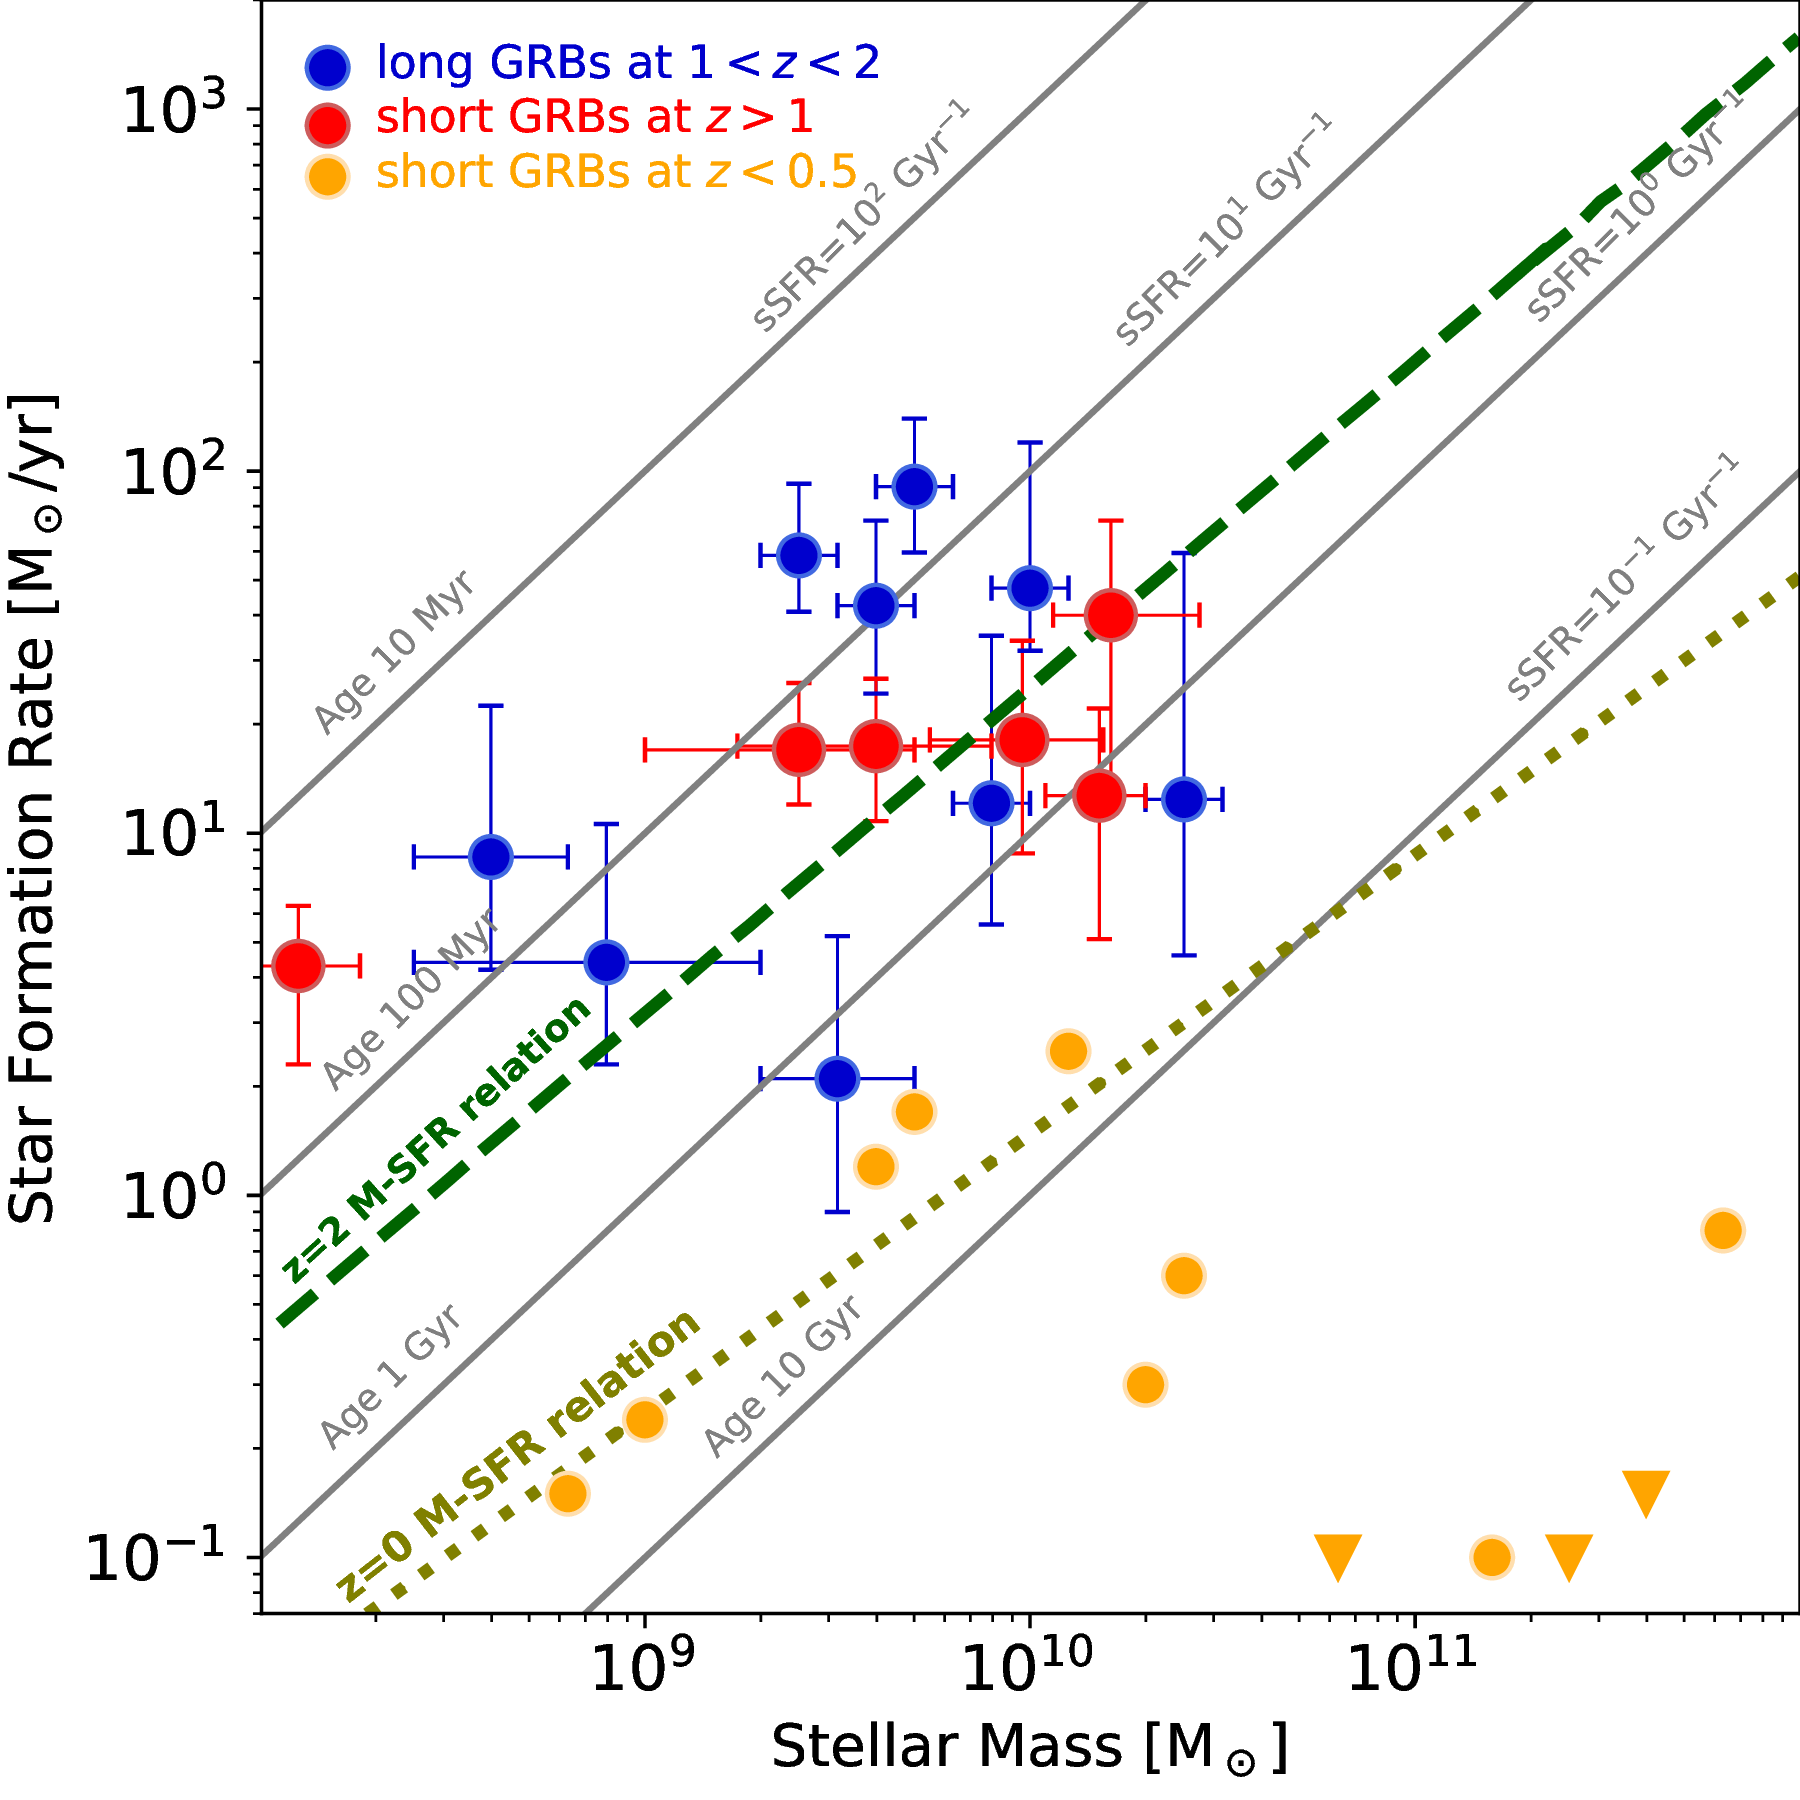
We input the redshift as a fixed value if measured through spectroscopy, and leave it as a free parameter otherwise (GRB 051210, GRB 120804A and GRB 121226A). Two events (GRB 060121, GRB 160410) were not included in the analysis due to the limited dataset available. The results are listed in Table 1 and displayed in Figure 6. We compare them with the sample of long GRBs in a similar redshift range (Palmerio et al., 2019) and find significant overlap in both stellar mass and star formation rate (SFR). Both groups of bursts are consistent with the - obtained for GOODS catalog galaxies at =2 (Daddi et al., 2007). The orange points in Figure 6 show the distribution of sGRB with 0.5 (retrieved from Berger, 2014). Some of these bursts are consistent with the - relation at 0 (dot-dashed line), whereas a large fraction resides in galaxies with larger stellar masses and lower SFRs.
In order to compare the two populations of sGRBs at low and high redshifts, we correct for the evolution of star formation across cosmic time, as described in Bochenek et al. (2021). For each galaxy, we rescale the SFR and mass so that they lie at the same distance (in units of standard deviations) from the - relation at =2 for = (the host measured mass) and at =0 for = (the mass associated with the same quantile for the distribution at 0). These scaled values are then compared with sGRB galaxies at 0.5 using the two dimensional Peacock’s test (Peacock, 1983) which compares the mass and SFR distributions of the two samples, obtaining a p-value of 0.11. A much stronger similarity (p-value0.7) is observed with the hosts of long GRBs at 1.02.0.
In Table 1 we report also the projected offsets for our sample of GRBs with respect to the host galaxy, updated from Fong & Berger (2013). Only GRB 051210, for which the host galaxy association is highly uncertain, is particularly offset from its candidate host. All the other bursts have values consistent with the typical offset distribution of long GRBs which extends from 0.1 to 10 kpc with a median value around 1 kpc (Lyman et al., 2017).
A useful tool to distinguish between the different classes could be the host metallicity. For instance, sGRBs hosts track the metallicity distribution of field galaxies (Berger, 2014), while Palmerio et al. (2019) find that long GRBs at z1 tend to avoid regions of high metallicity. Further studies on the metallicity of our sample of GRBs could clarify their classification.
4. Discussion
The results of the analysis presented in this paper suggest that a temporally extended emission can be identified in a significant fraction (60%) of sGRBs at 1. This is much larger than the equivalent fraction that has been estimated in the general sGRB population (25%, Norris, Gehrels, & Scargle, 2010). We suggest three main interpretations of this result and discuss some of their implications.
4.1. Long GRB Impostors
The first possibility is the ‘impostor’ scenario. Namely, that a large fraction of sGRBs at are not in fact the result of compact binary mergers. They may be collapsars or potentially even a different population altogether. Under this interpretation, the apparent EE like component is not equivalent to the EE seen in lower redshift sGRBs and may, for example, be the regular prompt emission of a long GRB that after s has become softer and more difficult to detect with BAT. This interpretation is supported by spectral studies of GRBs, which find that when comparing the first 1-2 seconds of long GRBs, they are consistent with being drawn from the sGRB population (Ghirlanda et al., 2009), while at later times, long GRBs are significantly softer. Negligible spectral lags are also measured in some long GRBs (Norris, Gehrels, & Scargle, 2011), including those securely associated to supernovae (e.g. GRB 091127, Troja et al., 2012). This interpretation is also consistent with the observed properties of the host galaxies (Figure 6), showing no clear difference between long GRBs and sGRBs at 1.
If the impostor scenario is correct, the true number of sGRBs at redshifts could be smaller than previously estimated. This would favor a shallower DTD, with a much larger fraction of systems with long delay times. This is no trivial requirement, given that there are sGRBs with a measured .
In our analysis we find three sGRBs with 1 that show no EE, GRB 121226A, GRB 111117A and GRB 090426A. Based on the observed gamma-ray emission, only GRB 111117A has a high probability of being a compact binary merger (see Table 1). GRB 121226A is not well constrained, whereas the nature of GRB 090426A is rather ambiguous and more likely associated to a massive star progenitor (Levesque et al., 2010). This leaves us with only one bona-fide sGRB at 1 out of the 8 identified so far. To discuss the implications of this scenario, we adopt the most conservative assumption that is consistent with this ratio (i.e. one that maximized the number of sGRBs at ). Namely, we assume that the large sample of sGRBs without redshift (100 events) is composed by high- events and that the same ratio (1 sGRB, 7 long GRB impostors) applies to the entire observed population, we expect 15 sGRBs at 1 within the Swift sample. Altogether this corresponds to 35-40% of sGRBs at . If modeled with a narrow width log-normal delay time distribution between star-formation and binary merger, this leads to very long delay times of order Gyr (Wanderman & Piran, 2015). Taken at face value, this seems to be at odds with the observed population of binary neutron stars in the Galaxy, for which at least 40% of the systems must have been born with delay times of Gyr (Beniamini & Piran, 2019). Indeed out of the eight observed Galactic binary neutron stars that will merge within a Hubble time or less, not even one has a merger time as long as this. Such a long delay time would also be inconsistent with requirements from -process evolution in the Milky Way at (Hotokezaka, Beniamini, & Piran, 2018), with the observation of -process enriched stars in ultra faint dwarf galaxies Beniamini et al. (2016b, c) and with the large scatter of -process abundances in extremely metal poor stars in the halo of the Milky Way (Argast et al., 2004; Tsujimoto & Shigeyama, 2014; Vangioni et al., 2016). We refer the reader to Beniamini & Piran (2019) to a more in depth discussion of these points.
However, we stress that this apparent discrepancy regarding the DTD may be at least in part due to a selection bias, as the detection of a sGRB and an assignment of redshift to a detected sGRBs becomes significantly more difficult at relative to lower redshifts. This naturally leads to an artificial skewing of the observed sGRB redshift distribution to lower redshifts. Approximately, the bias should be such that it is 70 times less likely to detect and assign a redshift to a sGRB than to an sGRB at lower redshift in order to regain consistency between the DTD inferred from -process / Galactic binary neutron stars and that inferred from sGRBs, assuming the majority of the EE sGRBs at are ‘impostors’. Fully modeling this selection bias is an involved work onto its own which would require knowledge of (a) the luminosity function (which is not directly determined from observations, as it is convoluted with the rate and delay time distribution), (b) the distributions of spectral parameters in the comoving frame (this again involves selection effects, when trying to infer based on the observed population) and (c) the recovery fraction (fraction of detected sGRBs for which will be determined). While the first two factors have been considered in previous studies (Wanderman & Piran, 2015; Ghirlanda et al., 2016), the latter has not yet been systematically studied. A more complete understanding of the redshift determination bias will be crucial for determining whether there is any inconsistency between the impostor scenario and independent measures of the delay time distribution.
4.2. Selection bias
A variant of the selection bias above, and perhaps the simplest explanation, could be that these are regular sGRBEEs, analogous to the population identified by Norris & Bonnell (2006), and they are more likely to be localized and assigned redshift than other sGRBs at similar distances. Indeed, sGRBEEs tend to be brighter than canonical sGRBs (Gompertz et al., 2020; Norris, Gehrels, & Scargle, 2011; Troja et al., 2008), which increases the chance of an accurate localization, and hence a galaxy association. If this interpretation is correct, the high fraction of sGRBEEs at is simply a selection bias. Selection effects could also be the culprit of the distributions of host galaxy parameters, as star-forming galaxies are more likely to be spectroscopically identified and small offsets favor the host galaxy identification. Under this interpretation, there could be many sGRBs originating from and there is no discrepancy with the delay time distributions inferred from Galactic BNSs or -process abundances. For instance, by assuming the same ratio of 25% between sGRBs and sGRBEEs (Norris, Gehrels, & Scargle, 2010) and a 50% fraction of events residing in galaxies with low star formation, the number of bursts at 1 would quickly rise to over 60, much larger than those at 1.
4.3. Redshift evolution
The third possibility for explaining the high occurrence rate of sGRBEEs at 1 is that this indicates an evolution of sGRBs with redshift.555Anand et al. (2018) found no difference in the redshift distribution of sGRBs with and without EE, however they studied an older sample of sGRBs with EE, not including the EE discussed in this work. Understanding the nature of such an evolution depends on the, yet to be resolved, underlying mechanism powering EE in sGRBs.
Various interpretations have been suggested in the literature. One intriguing possibility is that sGRBEEs arise from NS-BH mergers, and the EE is the result of -process heating on fall-back accretion (Rosswog, 2007). Desai et al. (2019) have studied this model using relativistic simulations of mergers. Their findings suggest that due to their larger merged BH masses, and smaller ejecta electron fractions, NS-BH mergers are more likely than NS-NS mergers to lead to an -process powered fallback driven EE phase. The higher incidence of sGRBEEs at may suggest that the fraction of sGRBs from NS-BH is significantly increased compared to lower redshifts. However, this interpretation, much like the impostor scenario mentioned above, increases the tension with the DTD of NS-NS mergers, by suggesting that less binary NSs lead to a detectable sGRB at . Furthermore, population synthesis studies suggest that the DTD of NS-BH should favor longer delays compared to NS-NS mergers (Mapelli et al., 2019), which would imply a smaller fraction of NS-BH at rather than vice versa.
Other studies have suggested that sGRBEEs may be the result of magnetar central engines (Bucciantini et al., 2012; Gompertz et al., 2013; Sarin et al., 2020). At the very least, this requires the product of the NS-NS merger to produce a long lived (or indefinitely stable) NS. Under this interpretation, the large ratio of EE sGRBs at would suggest that such merger products are more common at high . Estimating the cosmological evolution of BNS binary mergers is a complex task, involving various uncertain components even at , such as common envelope evolution. Nonetheless, we note that at high redshift, the metallicity of progenitor stars is lower, leading to less mass loss during stellar evolution and eventually to overall heavier NSs, and merger products (that are more likely to quickly collapse to a BH). This will cause an opposite trend to the required one, namely that magnetars should be a less common merger product at high .
5. Conclusion
Swift BAT observations of the short GRB 181123B, located at =1.754, reveal a faint temporally extended emission following the first short peak. The tail of this high-energy signal likely dominates the early (600 s) X-ray afterglow. By re-analyzing the BAT data for a sample of sGRBs at 1, we identify evidence for a weak extended emission in most events (5 out of 8 in total). We show that the detection of this extended signal depends on a combination of factors that include the instrument sensitivity and the source distance. Although GRB environment studies are important to distinguish between the two classes of bursts, the small number of events and observational biases make the classification harder at high redshifts. Indeed the study of the host galaxy properties shows similarities in offset distribution, mass and star formation with the environment of long GRBs detected at similar redshifts. Studies of the host metallicities could offer a clearer discriminant tool, but these measurements are either missing or not well constrained for the GRBs in our sample.
We consider three main hypotheses to interpret these results. First, these bursts with extended emission could be misclassified long duration bursts. However, this would cause a discrepancy between the DTD inferred from our study and the one derived from Galactic BNS systems and -process elements abundances. Second, these GRBs belong to a different population of bursts and the predominance of extended emission at high- could indicate a redshift evolution of their progenitors. However, this is not expected by most models. Last, the large fraction of sGRBs with extended emission could be the result of selection effects, making this population of sGRBs easier to detect and localize at higher redshifts. A thorough investigation of the selection bias affecting the redshift measurements of sGRBs and future investigations oriented to study the progenitors of sGRBEEs will be important to reconcile the different estimates of the DTD and determine the contribution of BNS mergers to the cosmic -process enrichment.
Given the uncertainty in the classification of these bursts, the third generation of gravitational wave detectors may play a crucial role in the secure identification of NS-NS and NS-BH mergers at high redshifts. Future gravitational wave detectors like the Cosmic Explorer (Reitze et al., 2019) or the Einstein Telescope (Punturo et al., 2010) are expected to identify BNS mergers out to redshift 2-3 with a rate of 105 events per year, and about 10% of the triggers from mergers at 1.3 (Maggiore et al., 2020).
Acknowledgements
This work was supported in part by the National Aeronautics and Space Administration through grant 80NSSC18K0429 issued through the Astrophysics Data Analysis Program. The research of PB was funded by the Gordon and Betty Moore Foundation through Grant GBMF5076. Based on observations obtained at the international Gemini Observatory (PI: Troja), a program of NOIRLab, which is managed by the Association of Universities for Research in Astronomy (AURA) under a cooperative agreement with the National Science Foundation on behalf of the Gemini Observatory partnership. This publication made use of data products supplied by the UK Swift Science Data Centre at the University of Leicester.
References
- Abbott et al. (2017) Abbott, B. P., Abbott, R., Abbott, T. D., et al. 2017, ApJ, 848, L13. doi:10.3847/2041-8213/aa920c
- Abbott et al. (2020) Abbott, B. P., Abbott, R., Abbott, T. D., et al. 2020, Living Reviews in Relativity, 23, 3. doi:10.1007/s41114-020-00026-9
- Amati et al. (2002) Amati, L., Frontera, F., Tavani, M., et al. 2002, A&A, 390, 81. doi:10.1051/0004-6361:20020722
- Amati et al. (2007) Amati, L., Della Valle, M., Frontera, F., et al. 2007, A&A, 463, 913. doi:10.1051/0004-6361:20065994
- Amati et al. (2019) Amati, L., D’Agostino, R., Luongo, O., et al. 2019, MNRAS, 486, L46. doi:10.1093/mnrasl/slz056
- Anand et al. (2018) Anand, N., Shahid, M., & Resmi, L. 2018, MNRAS, 481, 4332. doi:10.1093/mnras/sty2530
- Anderson et al. (2018) Anderson, G. E., Bell, M. E., Stevens, J., et al. 2018, GRB Coordinates Network, Circular Service, No. 23467, #1 (2018/November-0), 23467
- Anderson et al. (2021) Anderson, G. E., Bell, M. E., Stevens, J., et al. 2021, arXiv:2103.05209
- Antonelli et al. (2009) Antonelli, L. A., D’Avanzo, P., Perna, R., et al. 2009, A&A, 507, L45. doi:10.1051/0004-6361/200913062
- Argast et al. (2004) Argast, D., Samland, M., Thielemann, F.-K., et al. 2004, A&A, 416, 997. doi:10.1051/0004-6361:20034265
- Ascenzi et al. (2019) Ascenzi S., Coughlin M. W., Dietrich T., Foley R. J., Ramirez-Ruiz E., Piranomonte S., Mockler B., et al., 2019, MNRAS, 486, 672. doi:10.1093/mnras/stz891
- Barkov & Pozanenko (2011) Barkov M. V., Pozanenko A. S., 2011, MNRAS, 417, 2161. doi:10.1111/j.1365-2966.2011.19398.x
- Barthelmy et al. (2005a) Barthelmy S. D., Chincarini G., Burrows D. N., Gehrels N., Covino S., Moretti A., Romano P., et al., 2005, Natur, 438, 994. doi:10.1038/nature04392
- Barthelmy et al. (2005b) Barthelmy S. D., Barbier L. M., Cummings J. R., Fenimore E. E., Gehrels N., Hullinger D., Krimm H. A., et al., 2005, SSRv, 120, 143
- Becerra et al. (2019) Becerra R. L., Dichiara S., Watson A. M., Troja E., Fraija N., Klotz A., Butler N. R., et al., 2019, ApJ, 881, 12. doi:10.3847/1538-4357/ab275b
- Behroozi, Ramirez-Ruiz, & Fryer (2014) Behroozi P. S., Ramirez-Ruiz E., Fryer C. L., 2014, ApJ, 792, 123
- Belczynski et al. (2006) Belczynski K., Perna R., Bulik T., Kalogera V., Ivanova N., Lamb D. Q., 2006, ApJ, 648, 1110
- Belgacem et al. (2019) Belgacem E., Dirian Y., Foffa S., Howell E. J., Maggiore M., Regimbau T., 2019, JCAP, 2019, 015. doi:10.1088/1475-7516/2019/08/015
- Beniamini et al. (2015) Beniamini, P., Nava, L., Duran, R. B., et al. 2015, MNRAS, 454, 1073. doi:10.1093/mnras/stv2033
- Beniamini et al. (2016a) Beniamini, P., Nava, L., & Piran, T. 2016, MNRAS, 461, 51. doi:10.1093/mnras/stw1331
- Beniamini et al. (2016b) Beniamini, P., Hotokezaka, K., & Piran, T. 2016, ApJ, 829, L13. doi:10.3847/2041-8205/829/1/L13
- Beniamini et al. (2016c) Beniamini, P., Hotokezaka, K., & Piran, T. 2016, ApJ, 832, 149. doi:10.3847/0004-637X/832/2/149
- Beniamini & van der Horst (2017) Beniamini, P. & van der Horst, A. J. 2017, MNRAS, 472, 3161. doi:10.1093/mnras/stx2203
- Beniamini & Piran (2019) Beniamini, P. & Piran, T. 2019, MNRAS, 487, 4847. doi:10.1093/mnras/stz1589
- Berger et al. (2007) Berger E., Fox D. B., Price P. A., Nakar E., Gal-Yam A., Holz D. E., Schmidt B. P., et al., 2007, ApJ, 664, 1000
- Berger et al. (2013) Berger, E., Zauderer, B. A., Levan, A., et al. 2013, ApJ, 765, 121. doi:10.1088/0004-637X/765/2/121
- Berger (2014) Berger, E. 2014, ARA&A, 52, 43. doi:10.1146/annurev-astro-081913-035926
- Bloom, Butler, & Perley (2008) Bloom J. S., Butler N. R., Perley D. A., 2008, AIPC, 1000, 11. doi:10.1063/1.2943423
- Bochenek et al. (2021) Bochenek, C. D., Ravi, V., & Dong, D. 2021, ApJ, 907, L31. doi:10.3847/2041-8213/abd634
- Bromberg et al. (2013) Bromberg O., Nakar E., Piran T., Sari R., 2013, ApJ, 764, 179. doi:10.1088/0004-637X/764/2/179
- Bucciantini et al. (2012) Bucciantini, N., Metzger, B. D., Thompson, T. A., et al. 2012, MNRAS, 419, 1537. doi:10.1111/j.1365-2966.2011.19810.x
- Burrows et al. (2005) Burrows D. N., Hill J. E., Nousek J. A., Kennea J. A., Wells A., Osborne J. P., Abbey A. F., et al., 2005, SSRv, 120, 165. doi:10.1007/s11214-005-5097-2
- Burrows et al. (2006) Burrows D. N., Grupe D., Capalbi M., Panaitescu A., Patel S. K., Kouveliotou C., Zhang B., et al., 2006, ApJ, 653, 468
- Chambers et al. (2016) Chambers K. C., Magnier E. A., Metcalfe N., Flewelling H. A., Huber M. E., Waters C. Z., Denneau L., et al., 2016, arXiv, arXiv:1612.05560
- Copete (2012) Copete A. J., 2012, PhDT
- Côté et al. (2019) Côté B., Eichler M., Arcones A., Hansen C. J., Simonetti P., Frebel A., Fryer C. L., et al., 2019, ApJ, 875, 106
- Covino et al. (2006) Covino S., Malesani D., Israel G. L., D’Avanzo P., Antonelli L. A., Chincarini G., Fugazza D., et al., 2006, A&A, 447, L5. doi:10.1051/0004-6361:200500228
- Cowan et al. (2020) Cowan J. J., Sneden C., Roederer I. U., Lawler J. E., Hartog E. A. D., Sobeck J. S., Boesgaard A. M., 2020, ApJ, 890, 119
- Daddi et al. (2007) Daddi E., Dickinson M., Morrison G., Chary R., Cimatti A., Elbaz D., Frayer D., et al., 2007, ApJ, 670, 156. doi:10.1086/521818
- Dainotti et al. (2020) Dainotti, M. G., Lenart, A. Ł., Sarracino, G., et al. 2020, ApJ, 904, 97. doi:10.3847/1538-4357/abbe8a
- D’Avanzo et al. (2009) D’Avanzo P., Malesani D., Covino S., Piranomonte S., Grazian A., Fugazza D., Margutti R., et al., 2009, A&A, 498, 711. doi:10.1051/0004-6361/200811294
- D’Avanzo et al. (2014) D’Avanzo P., Salvaterra R., Bernardini M. G., Nava L., Campana S., Covino S., D’Elia V., et al., 2014, MNRAS, 442, 2342
- de Ugarte Postigo et al. (2006) de Ugarte Postigo A., Castro-Tirado A. J., Guziy S., Gorosabel J., Jóhannesson G., Aloy M. A., McBreen S., et al., 2006, ApJL, 648, L83
- Dereli-Bégué et al. (2020) Dereli-Bégué, H., Pe’er, A., & Ryde, F. 2020, ApJ, 897, 145. doi:10.3847/1538-4357/ab9a2d
- Desai et al. (2019) Desai, D., Metzger, B. D., & Foucart, F. 2019, MNRAS, 485, 4404. doi:10.1093/mnras/stz644
- Dominik et al. (2012) Dominik M., Belczynski K., Fryer C., Holz D. E., Berti E., Bulik T., Mandel I., et al., 2012, ApJ, 759, 52
- Donaghy et al. (2006) Donaghy T. Q., Lamb D. Q., Sakamoto T., Norris J. P., Nakagawa Y., Villasenor J., Atteia J.-L., et al., 2006, arXiv, astro-ph/0605570
- Eichler et al. (1989) Eichler D., Livio M., Piran T., Schramm D. N., 1989, Natur, 340, 126. doi:10.1038/340126a0
- Elbaz et al. (2007) Elbaz D., Daddi E., Le Borgne D., Dickinson M., Alexander D. M., Chary R.-R., Starck J.-L., et al., 2007, A&A, 468, 33. doi:10.1051/0004-6361:20077525
- Evans et al. (2007) Evans P. A., Beardmore A. P., Page K. L., Tyler L. G., Osborne J. P., Goad M. R., O’Brien P. T., et al., 2007, A&A, 469, 379
- Evans et al. (2009) Evans P. A., Beardmore A. P., Page K. L., Osborne J. P., O’Brien P. T., Willingale R., Starling R. L. C., et al., 2009, MNRAS, 397, 1177
- Fitzpatrick (1999) Fitzpatrick, E. L. 1999, PASP, 111, 63. doi:10.1086/316293
- Fong & Berger (2013) Fong W., Berger E., 2013, ApJ, 776, 18. doi:10.1088/0004-637X/776/1/18
- Fong et al. (2015) Fong, W., Berger, E., Margutti, R., et al. 2015, ApJ, 815, 102. doi:10.1088/0004-637X/815/2/102
- Foreman-Mackey et al. (2013) Foreman-Mackey D., Hogg D. W., Lang D., Goodman J., 2013, PASP, 125, 306. doi:10.1086/670067
- Frebel (2018) Frebel A., 2018, ARNPS, 68, 237
- Frederiks et al. (2016) Frederiks D., Golenetskii S., Aptekar R., Oleynik P., Ulanov M., Svinkin D., Tsvetkova A., et al., 2016, GCN, 19288
- Fryer et al. (1999) Fryer C. L., Woosley S. E., Herant M., Davies M. B., 1999, ApJ, 520, 650. doi:10.1086/307467
- Fryer et al. (2006) Fryer C. L., Herwig F., Hungerford A., Timmes F. X., 2006, ApJL, 646, L131
- Gehrels et al. (2004) Gehrels N., Chincarini G., Giommi P., Mason K. O., Nousek J. A., Wells A. A., White N. E., et al., 2004, ApJ, 611, 1005. doi:10.1086/422091
- Gehrels et al. (2005) Gehrels N., Sarazin C. L., O’Brien P. T., Zhang B., Barbier L., Barthelmy S. D., Blustin A., et al., 2005, Natur, 437, 851
- Gehrels et al. (2006) Gehrels N., Norris J. P., Barthelmy S. D., Granot J., Kaneko Y., Kouveliotou C., Markwardt C. B., et al., 2006, Natur, 444, 1044. doi:10.1038/nature05376
- Ghirlanda et al. (2009) Ghirlanda, G., Nava, L., Ghisellini, G., et al. 2009, A&A, 496, 585. doi:10.1051/0004-6361/200811209
- Ghirlanda et al. (2016) Ghirlanda, G., Salafia, O. S., Pescalli, A., et al. 2016, A&A, 594, A84. doi:10.1051/0004-6361/201628993
- Gompertz et al. (2013) Gompertz B. P., O’Brien P. T., Wynn G. A., Rowlinson A., 2013, MNRAS, 431, 1745. doi:10.1093/mnras/stt293
- Gompertz et al. (2020) Gompertz B. P., Cutter R., Steeghs D., Galloway D. K., Lyman J., Ulaczyk K., Dyer M. J., et al., 2020, MNRAS, 497, 726. doi:10.1093/mnras/staa1845
- Hotokezaka, Beniamini, & Piran (2018) Hotokezaka K., Beniamini P., Piran T., 2018, IJMPD, 27, 1842005
- Jacovich et al. (2020) Jacovich T., Beniamini P., van der Horst A., 2020, arXiv: 2007.04418
- Jespersen et al. (2020) Jespersen, C. K., Severin, J. B., Steinhardt, C. L., et al. 2020, ApJ, 896, L20. doi:10.3847/2041-8213/ab964d
- Jin et al. (2020) Jin Z.-P., Covino S., Liao N.-H., Li X., D’Avanzo P., Fan Y.-Z., Wei D.-M., 2020, NatAs, 4, 77. doi:10.1038/s41550-019-0892-y
- Johnson & Leja (2017) Johnson B., Leja J., 2017, zndo
- Kaneko et al. (2015) Kaneko Y., Bostancı Z. F., Göğü\textcommabelows E., Lin L., 2015, MNRAS, 452, 824. doi:10.1093/mnras/stv1286
- King, Olsson, & Davies (2007) King A., Olsson E., Davies M. B., 2007, MNRAS, 374, L34. doi:10.1111/j.1745-3933.2006.00259.x
- Kisaka, Ioka, & Sakamoto (2017) Kisaka S., Ioka K., Sakamoto T., 2017, ApJ, 846, 142. doi:10.3847/1538-4357/aa8775
- Kouveliotou et al. (1993) Kouveliotou C., Meegan C. A., Fishman G. J., Bhat N. P., Briggs M. S., Koshut T. M., Paciesas W. S., et al., 1993, ApJL, 413, L101
- La Parola et al. (2006) La Parola V., Mangano V., Fox D., Zhang B., Krimm H. A., Cusumano G., Mineo T., et al., 2006, A&A, 454, 753. doi:10.1051/0004-6361:20065083
- Leibler & Berger (2010) Leibler C. N., Berger E., 2010, ApJ, 725, 1202. doi:10.1088/0004-637X/725/1/1202
- Levesque et al. (2010) Levesque E. M., Bloom J. S., Butler N. R., Perley D. A., Cenko S. B., Prochaska J. X., Kewley L. J., et al., 2010, MNRAS, 401, 963. doi:10.1111/j.1365-2966.2009.15733.x
- Li et al. (2020) Li, Y., Zhang, B., & Yuan, Q. 2020, ApJ, 897, 154. doi:10.3847/1538-4357/ab96b8
- Lien et al. (2014) Lien A., Sakamoto T., Gehrels N., Palmer D. M., Barthelmy S. D., Graziani C., Cannizzo J. K., 2014, ApJ, 783, 24. doi:10.1088/0004-637X/783/1/24
- Lien et al. (2016) Lien A., Sakamoto T., Barthelmy S. D., Baumgartner W. H., Cannizzo J. K., Chen K., Collins N. R., et al., 2016, ApJ, 829, 7
- Lyman et al. (2017) Lyman J. D., Levan A. J., Tanvir N. R., Fynbo J. P. U., McGuire J. T. W., Perley D. A., Angus C. R., et al., 2017, MNRAS, 467, 1795. doi:10.1093/mnras/stx220
- Lyutikov & Toonen (2017) Lyutikov M., Toonen S., 2017, arXiv, arXiv:1709.02221
- Maggiore et al. (2020) Maggiore M., Van Den Broeck C., Bartolo N., Belgacem E., Bertacca D., Bizouard M. A., Branchesi M., et al., 2020, JCAP, 2020, 050. doi:10.1088/1475-7516/2020/03/050
- Malesani et al. (2015) Malesani D., Kruehler T., Xu D., Pugliese G., Watson D., Fynbo J. P. U., Milvang-Jensen B., et al., 2015, GCN, 17755
- Mapelli et al. (2019) Mapelli, M., Giacobbo, N., Santoliquido, F., et al. 2019, MNRAS, 487, 2. doi:10.1093/mnras/stz1150
- McCarthy, Zheng, & Ramirez-Ruiz (2020) McCarthy K. S., Zheng Z., Ramirez-Ruiz E., 2020, arXiv, arXiv:2007.15024
- Narayan, Paczynski, & Piran (1992) Narayan R., Paczynski B., Piran T., 1992, ApJL, 395, L83. doi:10.1086/186493
- Nava et al. (2014) Nava, L., Vianello, G., Omodei, N., et al. 2014, MNRAS, 443, 3578. doi:10.1093/mnras/stu1451
- Norris, Marani, & Bonnell (2000) Norris J. P., Marani G. F., Bonnell J. T., 2000, ApJ, 534, 248. doi:10.1086/308725
- Norris & Bonnell (2006) Norris J. P., Bonnell J. T., 2006, ApJ, 643, 266. doi:10.1086/502796
- Norris, Gehrels, & Scargle (2010) Norris J. P., Gehrels N., Scargle J. D., 2010, ApJ, 717, 411. doi:10.1088/0004-637X/717/1/411
- Norris, Gehrels, & Scargle (2011) Norris J. P., Gehrels N., Scargle J. D., 2011, ApJ, 735, 23. doi:10.1088/0004-637X/735/1/23
- Norris, Barthelmy, & Lien (2018) Norris J. P., Barthelmy S. D., Lien A. Y., 2018, GCN, 23443
- Nugent et al. (2020) Nugent, A. E., Fong, W., Dong, Y., et al. 2020, ApJ, 904, 52. doi:10.3847/1538-4357/abc24a
- Oates & Lien (2018) Oates S. R., Lien A. Y., 2018, GCN, 23437
- O’Connor, Beniamini, & Kouveliotou (2020) O’Connor B., Beniamini P., Kouveliotou C., 2020, MNRAS, 495, 4782. doi:10.1093/mnras/staa1433
- O’Connor et al. (2021) O’Connor B., Troja E., Dichiara S., Chase E. A., Ryan G., Cenko S. B., Fryer C. L., et al., 2021, MNRAS.tmp. doi:10.1093/mnras/stab132
- Oganesyan et al. (2020) Oganesyan G., Ascenzi S., Branchesi M., Salafia O. S., Dall’Osso S., Ghirlanda G., 2020, ApJ, 893, 88. doi:10.3847/1538-4357/ab8221
- Palmerio et al. (2019) Palmerio J. T., Vergani S. D., Salvaterra R., Sanders R. L., Japelj J., Vidal-García A., D’Avanzo P., et al., 2019, A&A, 623, A26. doi:10.1051/0004-6361/201834179
- Pandey et al. (2019) Pandey S. B., Hu Y., Castro-Tirado A. J., Pozanenko A. S., Sánchez-Ramírez R., Gorosabel J., Guziy S., et al., 2019, MNRAS, 485, 5294. doi:10.1093/mnras/stz530
- Paterson et al. (2020) Paterson K., Fong W., Nugent A., Escorial A. R., Leja J., Laskar T., Chornock R., et al., 2020, ApJL, 898, L32
- Peacock (1983) Peacock J. A., 1983, MNRAS, 202, 615. doi:10.1093/mnras/202.3.615
- Perley et al. (2009) Perley D. A., Metzger B. D., Granot J., Butler N. R., Sakamoto T., Ramirez-Ruiz E., Levan A. J., et al., 2009, ApJ, 696, 1871. doi:10.1088/0004-637X/696/2/1871
- Planck Collaboration et al. (2020) Planck Collaboration, Aghanim N., Akrami Y., Ashdown M., Aumont J., Baccigalupi C., Ballardini M., et al., 2020, A&A, 641, A6
- Punturo et al. (2010) Punturo M., Abernathy M., Acernese F., Allen B., Andersson N., Arun K., Barone F., et al., 2010, CQGra, 27, 194002. doi:10.1088/0264-9381/27/19/194002
- Regimbau et al. (2012) Regimbau T., Dent T., Del Pozzo W., Giampanis S., Li T. G. F., Robinson C., Van Den Broeck C., et al., 2012, PhRvD, 86, 122001. doi:10.1103/PhysRevD.86.122001
- Reitze et al. (2019) Reitze D., Adhikari R. X., Ballmer S., Barish B., Barsotti L., Billingsley G., Brown D. A., et al., 2019, BAAS
- Ricci et al. (2020) Ricci R., Troja E., Bruni G., Matsumoto T., Piro L., O’Connor B., Piran T., et al., 2020, MNRAS.tmp. doi:10.1093/mnras/staa3241
- Roederer et al. (2016) Roederer I. U., Mateo M., Bailey J. I., Song Y., Bell E. F., Crane J. D., Loebman S., et al., 2016, AJ, 151, 82
- Rosswog (2007) Rosswog S., 2007, MNRAS, 376, L48. doi:10.1111/j.1745-3933.2007.00284.x
- Ryan et al. (2020) Ryan G., van Eerten H., Piro L., Troja E., 2020, ApJ, 896, 166. doi:10.3847/1538-4357/ab93cf
- Sakamoto et al. (2011) Sakamoto T., Barthelmy S. D., Baumgartner W. H., Cummings J. R., Fenimore E. E., Gehrels N., Krimm H. A., et al., 2011, ApJS, 195, 2. doi:10.1088/0067-0049/195/1/2
- Sakamoto et al. (2012) Sakamoto T., Barthelmy S. D., Baumgartner W., Cummings J., Fenimore E., Gehrels N., Krimm H., et al., 2012, GCN, 13614
- Sakamoto et al. (2013) Sakamoto T., Troja E., Aoki K., Guiriec S., Im M., Leloudas G., Malesani D., et al., 2013, ApJ, 766, 41
- Santana et al. (2014) Santana, R., Barniol Duran, R., & Kumar, P. 2014, ApJ, 785, 29. doi:10.1088/0004-637X/785/1/29
- Sarin et al. (2020) Sarin, N., Lasky, P. D., & Ashton, G. 2020, Phys. Rev. D, 101, 063021. doi:10.1103/PhysRevD.101.063021
- Scargle et al. (2013) Scargle J. D., Norris J. P., Jackson B., Chiang J., 2013, ApJ, 764, 167. doi:10.1088/0004-637X/764/2/167
- Schlafly & Finkbeiner (2011) Schlafly E. F., Finkbeiner D. P., 2011, ApJ, 737, 103. doi:10.1088/0004-637X/737/2/103
- Selsing et al. (2016) Selsing J., Vreeswijk P. M., Japelj J., D’Elia V., de Ugarte Postigo A., Pugliese G., Xu D., et al., 2016, GCN, 19274
- Selsing et al. (2018) Selsing J., Krühler T., Malesani D., D’Avanzo P., Schulze S., Vergani S. D., Palmerio J., et al., 2018, A&A, 616, A48
- Selsing et al. (2019) Selsing J., Malesani D., Goldoni P., Fynbo J. P. U., Krühler T., Antonelli L. A., Arabsalmani M., et al., 2019, A&A, 623, A92
- Skrutskie et al. (2006) Skrutskie M. F., Cutri R. M., Stiening R., Weinberg M. D., Schneider S., Carpenter J. M., Beichman C., et al., 2006, AJ, 131, 1163. doi:10.1086/498708
- Skúladóttir et al. (2018) Skúladóttir Á., Salvadori S., Pettini M., Tolstoy E., Hill V., 2018, A&A, 615, A137
- Tanvir et al. (2013) Tanvir N. R., Levan A. J., Fruchter A. S., Hjorth J., Hounsell R. A., Wiersema K., Tunnicliffe R. L., 2013, Natur, 500, 547
- Troja et al. (2008) Troja E., King A. R., O’Brien P. T., Lyons N., Cusumano G., 2008, MNRAS, 385, L10. doi:10.1111/j.1745-3933.2007.00421.x
- Troja, Rosswog, & Gehrels (2010) Troja E., Rosswog S., Gehrels N., 2010, ApJ, 723, 1711. doi:10.1088/0004-637X/723/2/1711
- Troja et al. (2012) Troja E., Sakamoto T., Guidorzi C., Norris J. P., Panaitescu A., Kobayashi S., Omodei N., et al., 2012, ApJ, 761, 50. doi:10.1088/0004-637X/761/1/50
- Troja et al. (2016) Troja E., Sakamoto T., Cenko S. B., Lien A., Gehrels N., Castro-Tirado A. J., Ricci R., et al., 2016, ApJ, 827, 102
- Troja et al. (2017) Troja E., Piro L., van Eerten H., Wollaeger R. T., Im M., Fox O. D., Butler N. R., et al., 2017, Natur, 551, 71
- Troja et al. (2018) Troja E., Piro L., Ryan G., van Eerten H., Ricci R., Wieringa M. H., Lotti S., et al., 2018, MNRAS, 478, L18. doi:10.1093/mnrasl/sly061
- Troja et al. (2019) Troja E., Castro-Tirado A. J., Becerra González J., Hu Y., Ryan G. S., Cenko S. B., Ricci R., et al., 2019, MNRAS, 489, 2104
- Troja et al. (2020) Troja E., van Eerten H., Zhang B., Ryan G., Piro L., Ricci R., O’Connor B., et al., 2020, MNRAS, 498, 5643. doi:10.1093/mnras/staa2626
- Tsujimoto & Shigeyama (2014) Tsujimoto, T. & Shigeyama, T. 2014, A&A, 565, L5. doi:10.1051/0004-6361/201423751
- Valenti et al. (2009) Valenti S., Pastorello A., Cappellaro E., Benetti S., Mazzali P. A., Manteca J., Taubenberger S., et al., 2009, Natur, 459, 674. doi:10.1038/nature08023
- Vangioni et al. (2016) Vangioni, E., Goriely, S., Daigne, F., et al. 2016, MNRAS, 455, 17. doi:10.1093/mnras/stv2296
- Virgili et al. (2011) Virgili F. J., Zhang B., O’Brien P., Troja E., 2011, ApJ, 727, 109. doi:10.1088/0004-637X/727/2/109
- von Kienlin et al. (2020) von Kienlin A., Meegan C. A., Paciesas W. S., Bhat P. N., Bissaldi E., Briggs M. S., Burns E., et al., 2020, ApJ, 893, 46. doi:10.3847/1538-4357/ab7a18
- Wanderman & Piran (2015) Wanderman, D. & Piran, T. 2015, MNRAS, 448, 3026. doi:10.1093/mnras/stv123
- Watson et al. (2019) Watson D., Hansen C. J., Selsing J., Koch A., Malesani D. B., Andersen A. C., Fynbo J. P. U., et al., 2019, Natur, 574, 497
- Willingale et al. (2013) Willingale, R., Starling, R. L. C., Beardmore, A. P., et al. 2013, MNRAS, 431, 394. doi:10.1093/mnras/stt175
- Woosley & Bloom (2006) Woosley S. E., Bloom J. S., 2006, ARA&A, 44, 507. doi:10.1146/annurev.astro.43.072103.150558
- Zhang & Mészáros (2004) Zhang B., Mészáros P., 2004, IJMPA, 19, 2385
- Zhang et al. (2009) Zhang B., Zhang B.-B., Virgili F. J., Liang E.-W., Kann D. A., Wu X.-F., Proga D., et al., 2009, ApJ, 703, 1696. doi:10.1088/0004-637X/703/2/1696
- Zhang et al. (2015) Zhang, B.-B., van Eerten, H., Burrows, D. N., et al. 2015, ApJ, 806, 15. doi:10.1088/0004-637X/806/1/15
- Zheng & Ramirez-Ruiz (2007) Zheng Z., Ramirez-Ruiz E., 2007, ApJ, 665, 1220
Appendix A GRB 181123B Afterglow fit including Synchrotron Self-Compton energy losses