reception date \Acceptedacception date \Publishedpublication date
ISM: clouds — ISM: molecules — ISM: jets and outflows — stars: formation
Multiple HC3N line observations towards 19 Galactic massive star forming regions
Abstract
We performed observations of the HC3N (24-23, 17-16, 11-10, 8-7) lines towards a sample consisting of 19 Galactic massive star-forming regions with the Arizona Radio Observatory 12-m and Caltech Submillimeter Observatory 10.4-m telescopes. HC3N (24-23, 17-16, 11-10, 8-7) lines were detected in sources except for W44, where only HC3N (17-16, 11-10) were detected. Twelve of the nineteen sources showed probable line wing features. The excitation temperatures were estimated from the line ratio of HC3N (24-23) to HC3N (17-16) for 18 sources and are in the range 23-57 K. The line widths of higher- transitions are larger than lower- ones for most sources. This indicates that the inner dense warm regions have more violent turbulence or other motions (such as rotation) than outer regions in these sources. A possible cutoff tendency was found around 106 in the relation between and full width at half maximum line widths.
1 Introduction
Molecular gases, especially dense ones, play a significant role in star-formation and as a tool to investigate the cause of star formation activity. In order to understand the evolution and regulation of current star formation in galaxies, dense gas properties should be precisely characterized (Meier et al., 2011). Dense gas tracers can be used as powerful tools to study properties of molecular gas in star-forming regions, such as temperature, pressure, density and so on.
In extended parts of molecular clouds, the low- transitions of CO are excellent tracers to probe the molecular gas. CO lines are usually optically thick and are used to probe relatively low-density gas (Meier et al., 2000). HC2n+1N (n 1) (Faure et al., 2016) are major components of the carbon chain molecule series (Hassel et al., 2008). Among them, HC3N is the simplest and the most abundant of the group of cyanopolyyne molecules. The majority of radio lines of the HC3N molecule are usually optically thin and are used to probe dense gas (Morris et al., 1976). Since HC3N has a relatively high electric dipole moment ( = 3.7 D), it can only be excited in dense gas regions (Pirogov et al., 2003). HC3N is a highly linear molecule with a low rotational constant (1/13 of CO and 4.5 GHz), which supplies a lot of lines dispersed from centimeter to (sub-)millimeter wavelengths (Bergin et al., 1996). Multiple HC3N lines can be used to measure the gas temperature and barometric pressure in the interstellar medium (Faure et al., 2016).
Using information on the line widths from different transitions (7-6, 5-4 and 2-1) of the CS molecule, Wu et al. (2010) suggested that turbulence injected from outflows, inflows, and expanding HII regions is more significant at smaller scales. The mean of the line width of the high- CS lines is larger than low- ones, which is inconsistent with Larso law and indicates high- CS emissions are from more turbulent regions than that of low- ones (Larson, 1981). Kinematics, which can be obtained with line broadening, is important for studying star formation at different evolutionary stages. However, CS lines are normally optically thick, which can confuse determination of gas kinematics. Thus, multiple optically thin lines from one molecule, such as HC3N, are necessary to obtain the gas kinematics from regions under different excitation conditions.
With the information of the HC3N column density, the relation between the column density of HC3N () and the distance () from the center of a dense core of sources can be obtained in the form of (Chung et al., 1991). Dissipation of turbulence and angular momentum is important during the star-forming process. Such turbulence and angular momentum can be reflected in line widths of optically thin lines, such as transitions of H13CN, H13CO+, 13CS and HC3N. The high- transitions of HC3N can trace denser and warmer gas components compared with low- ones. Because the excitation conditions (e.g. density and temperature) of high- transitions are higher than low- ones, information on the turbulence and/or angular momentum of different regions can be derived from the line widths of multiple transitions of HC3N observations, even if no spatially resolved information was provided.
In this paper we present the survey results of HC3N =24-23, =17-16, =11-10, and =8-7 lines of 19 star-formation regions with the Caltech Submillimeter Observatory (CSO) and the Arizona Radio Observatory (ARO) 12 m telescope. We introduce the observations and data reduction in Section 2. Detailed results are provided in Section 3. In Section 4, we provide an analysis and discussion of the results. A brief summary is presented in Section 5.
2 Observations and data reduction
2.1 Observation
HC3N (17-16, 11-10, 8-7) observations were performed towards about 60 massive star-forming regions with the 12-m ARO radio telescope in 2008 January (Su et al. in preparation). The standard position-switching mode was used with an offset of 30′ in azimuth. HC3N (17-16) was observed with the 2-mm receiver. The HC3N (11-10) and HC3N (8-7) lines were observed with the 3-mm-high and 3-mm-low receivers, respectively. The sample of sources in our observation was selected from the large sample of dense clumps associated with water masers that had been surveyed with several CS transitions (Plume et al., 1992, 1997). Most of these sources had been mapped with CS (5-4) (Shirley et al., 2003) and 350 dust continuum emission (Mueller et al., 2002). Table 1 lists the source information including virial mass, infrared luminosity, angular extent of CS (5-4), excitation temperature of HC3N, outflow detection, infall signature, and the evolutionary status of the HII region.
Based on the HC3N (17-16, 11-10, 8-7) results, we selected 19 sources with HC3N (17-16) peak emission higher than 0.5 K, promising a high detection rate, to perform further observations of HC3N (24-23). HC3N (24-23) was observed with the CSO 10.4-m radio telescope 230-receiver of a double-side-band (DSB) receiver in May 2013. The observation mode was position-switching with an offset of 30′ in azimuth. Pointing and focusing were checked approximately every two hours by measuring nearby strong millimeter-emitting sources. The Wideband fast Fourier transform spectrometer was used with 269 kHz frequency spacing, which corresponds to 0.35 km s-1 at 230 GHz. The bandwidth is 4 GHz. The typical system temperature ranged from 200 K to 400 K.
2.2 Data reduction
The data were reduced with the CLASS program of the GILDAS111http://iram.fr/IRAMFR/GILDAS/ package. We first visually checked each spectrum and discarded spectra with unstable baselines. Then spectra were averaged with time weighting. A first-order fitting was used to subtract baselines of averaged spectra.
In order to increase the signal-to-noise ratio (S/N), the spectra were smoothed to a velocity resolution of 0.3 - 0.4 km s-1. Peak intensity, velocity-integrated intensity, central velocity and line width were derived from the Gaussian fit of the spectra. We converted the antenna temperature () to the main beam brightness temperature () via = /, where is the main beam efficiency (about 0.69 for the CSO telescope and 0.87 for the ARO telescope). The frequency, observational date, telescope name, beam size, root mean square (RMS) noise, and velocity resolution after smoothing of four transitions are listed in Table 2.
| Source | RA | DEC | Distancea | ()a | logc | (CS5-4, ) a | Outflowb | Infall?c | HII?a | |
|---|---|---|---|---|---|---|---|---|---|---|
| (J2000) | (J2000) | (kpc) | () | () | (K) | (K) | ||||
| (1) | (2) | (3) | (4) | (5) | (6) | (7) | (8) | (9) | (10) | (11) |
| W3(OH) | 02:27:04.69 | 61:52:25.5 | 2.4 | 5.09 | … | Y | UCHII | |||
| RCW142 | 17:50:15.13 | 28:54:31.5 | 2.0 | 4.82 | … | Y | UCHII | |||
| W28A2 | 18:00:30.42 | 24:03:58.5 | 2.6 | 5.45 | Bi | … | UCHII | |||
| M8E | 18:04:53.25 | 24:26:42.4 | 1.8 | 4.26 | Bi | … | UCHII | |||
| G8.67-0.36 | 18:06:18.87 | 21:37:37.8 | 8.5 | 5.12 | … | Y | UCHII | |||
| W31 | 18:08:38.32 | 19:51:49.7 | 12.0 | 6.22 | … | Y | UCHII | |||
| G10.6-0.4 | 18:10:28.70 | 19:55:48.6 | 6.5 | 6.05 | … | Y | CHII | |||
| W33cont | 18:14:13.67 | 17:55:25.2 | 4.1 | … | … | UCHII | ||||
| G14.33-0.64 | 18:18:54.71 | 16:47:49.7 | 2.6 | 4.33 | … | … | UCHII | |||
| W42 | 18:36:12.46 | 07:12:10.1 | 9.1 | … | … | UCHII | ||||
| S76E | 18:56:10.43 | 07:53:14.1 | 2.1 | 4.47 | … | … | HII | |||
| G35.20-0.74 | 18:58:12.73 | 01:40:36.5 | 3.3 | 4.65 | Bi | … | HII | |||
| W51M | 19:23:43.86 | 14:30:29.4 | 7.0 | 6.60 | … | Y | CHII | |||
| W75N | 20:38:36.93 | 42:37:37.4 | 3.0 | 5.29 | Bi | … | UCHII | |||
| DR21S | 20:39:00.80 | 42:19:29.7 | 3.0 | 5.70 | MB | Y | UCHII | |||
| W75(OH) | 20:39:01.00 | 42:22:49.8 | 3.0 | 4.70 | … | Y | … | |||
| CepA | 22:56:18.13 | 62:01:46.3 | 0.73 | 4.92 | Bi | Y | UCHII | |||
| NGC7538 | 23:13:44.85 | 61:26:50.6 | 2.8 | Bi | … | UCHII | ||||
| W44 | 18:53:18.5 | 61:26:50.6 | 3.7 | 5.48 | … | Y | CHII |
| Transitions | Date | Telescope | Beam size | RMS | ||
|---|---|---|---|---|---|---|
| (HC3N) | (GHz) | (UT) | (′′) | (K) | (km s-1) | |
| 24-23 | 218.324 | 2013 May | CSO | 35.2 | 0.02-0.08 | 0.34 |
| 17-16 | 154.657 | 2008 Jan | ARO | 41.0 | 0.11-0.22 | 0.38 |
| 11-10 | 100.076 | 2008 Jan | ARO | 63.3 | 0.06-0.11 | 0.30 |
| 8-7 | 72.784 | 2008 Jan | ARO | 87.1 | 0.13-0.26 | 0.40 |
3 Results
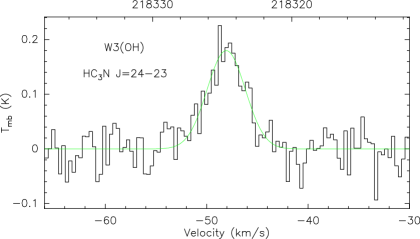
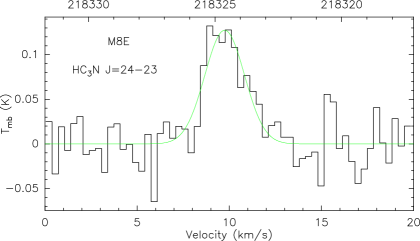
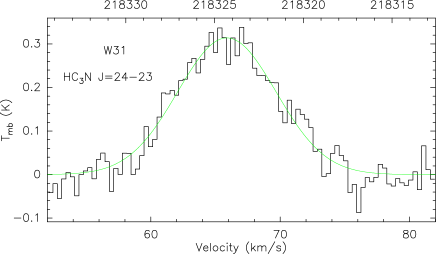
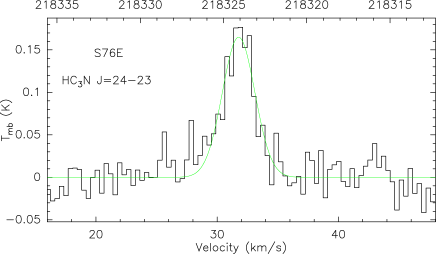
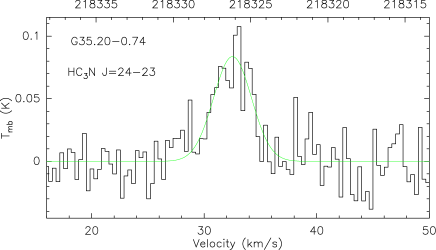
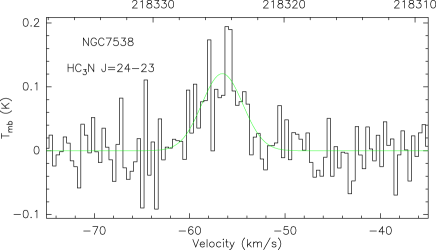
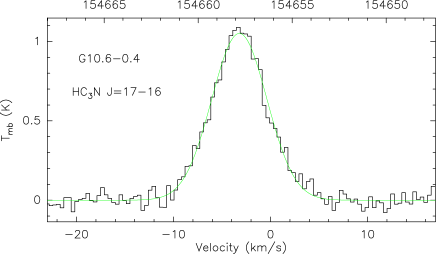
Multiple transition lines (24-23, 17-16, 11-10, 8-7) of HC3N were detected for most sources. However, only two transitions of = 17-16 and = 11-10 were detected for W44. The observational results of these lines are listed in Table 3, including peak intensity, velocity-integrated intensity, central velocity, line width, and line wing information. For most sources, the spectral lines have high S/N > 5 . Sources with line wings are plotted in Figure 6, and the Figure A1 shows the HC3N (24-23) lines without line wings. It is necessary to note that the of HC3N (24-23) observed by the CSO telescope seems to have a systematic bias of about 1 km s-1 compared with the other three transitions of HC3N (17-16, 11-10, 8-7) observed by the ARO telescope. This is probably due to a doppler tracking problem for the DSB receiver of CSO.
| Source | RA | DEC | Line | FWHM | Line wings | |||
|---|---|---|---|---|---|---|---|---|
| (J2000) | (J2000) | (HC3N) | (K) | (K km s-1) | (km s-1) | (km s-1) | ||
| (1) | (2) | (3) | (4) | (5) | (6) | (7) | (8) | (9) |
| W3(OH) | 02:27:04.69 | 61:52:25.5 | 24-23 | 0.2 | … | |||
| 17-16 | 0.8 | … | ||||||
| 11-10 | 0.9 | … | ||||||
| 8-7 | 0.7 | … | ||||||
| RCW142 | 17:50:15.13 | 28:54:31.5 | 24-23 | 0.2 | bw | |||
| 17-16 | 0.9 | ws | ||||||
| 11-10 | 1.4 | ws | ||||||
| 8-7 | 1.7 | rw | ||||||
| W28A2 | 18:00:30.42 | 24:03:58.5 | 24-23 | 1.5 | rw | |||
| 17-16 | 3.5 | rw | ||||||
| 11-10 | 3.0 | rw | ||||||
| 8-7 | 3.0 | rw | ||||||
| M8E | 18:04:53.25 | 24:26:42.4 | 24-23 | 0.1 | … | |||
| 17-16 | 0.8 | … | ||||||
| 11-10 | 1.4 | … | ||||||
| 8-7 | 1.2 | … | ||||||
| G8.67-0.36 | 18:06:18.87 | 21:37:37.8 | 24-23 | 0.3 | rw | |||
| 17-16 | 0.6 | rw | ||||||
| 11-10 | 1.2 | rw | ||||||
| 8-7 | 1.1 | rw | ||||||
| W31 | 18:08:38.32 | 19:51:49.7 | 24-23 | 0.3 | … | |||
| 17-16 | 0.5 | … | ||||||
| 11-10 | 0.6 | … | ||||||
| 8-7 | 0.7 | … | ||||||
| G10.6-0.4 | 18:10:28.70 | 19:55:48.6 | 24-23 | 0.5 | … | |||
| 17-16 | 1.1 | … | ||||||
| 11-10 | 1.4 | bw | ||||||
| 8-7 | 1.2 | bw |
| Source | RA | DEC | Line | FWHM | Line wings | |||
|---|---|---|---|---|---|---|---|---|
| (J2000) | (J2000) | (HC3N) | (K) | (K km s-1) | (km s-1) | (km s-1) | ||
| (1) | (2) | (3) | (4) | (5) | (6) | (7) | (8) | (9) |
| W33cont | 18:14:13.67 | 17:55:25.2 | 24-23 | 0.6 | ws | |||
| 17-16 | 2.1 | rw | ||||||
| 11-10 | 2.7 | rw | ||||||
| 8-7 | 2.3 | ws | ||||||
| G14.33-0.64 | 18:18:54.71 | 16:47:49.7 | 24-23 | 0.2 | … | |||
| 17-16 | 1.0 | rw | ||||||
| 11-10 | 1.7 | rw | ||||||
| 8-7 | 1.6 | … | ||||||
| W42 | 18:36:12.46 | 07:12:10.1 | 24-23 | 0.2 | … | |||
| 17-16 | 0.5 | rw | ||||||
| 11-10 | 0.7 | rw | ||||||
| 8-7 | 1.0 | … | ||||||
| S76E | 18:56:10.43 | 07:53:14.1 | 24-23 | 0.2 | … | |||
| 17-16 | 0.9 | … | ||||||
| 11-10 | 1.8 | … | ||||||
| 8-7 | 1.6 | … | ||||||
| G35.20-0.74 | 18:58:12.73 | 01:40:36.5 | 24-23 | 0.1 | … | |||
| 17-16 | 0.6 | … | ||||||
| 11-10 | 1.2 | … | ||||||
| 8-7 | 1.3 | … | ||||||
| W51M | 19:23:43.86 | 14:30:29.4 | 24-23 | 0.7 | … | |||
| 17-16 | 1.5 | ws | ||||||
| 11-10 | 1.3 | ws | ||||||
| 8-7 | 1.0 | … | ||||||
| W75N | 20:38:36.93 | 42:37:37.4 | 24-23 | 0.4 | … | |||
| 17-16 | 0.9 | rw | ||||||
| 11-10 | 1.4 | rw | ||||||
| 8-7 | 1.1 | bw |
| Source | RA | DEC | Line | FWHM | Line wings | |||
|---|---|---|---|---|---|---|---|---|
| (J2000) | (J2000) | (HC3N) | (K) | (K km s-1) | (km s-1) | (km s-1) | ||
| (1) | (2) | (3) | (4) | (5) | (6) | (7) | (8) | (9) |
| DR21S | 20:39:00.80 | 42:19:29.7 | 24-23 | 0.5 | bw | |||
| 17-16 | 2.0 | bw | ||||||
| 11-10 | 3.0 | bw | ||||||
| 8-7 | 2.1 | bw | ||||||
| W75(OH) | 20:39:01.00 | 42:22:49.8 | 24-23 | 0.3 | … | |||
| 17-16 | 0.9 | … | ||||||
| 11-10 | 2.2 | rw | ||||||
| 8-7 | 1.7 | rw | ||||||
| Cep A | 22:56:18.13 | 62:01:46.3 | 24-23 | 0.3 | … | |||
| 17-16 | 0.8 | bw | ||||||
| 11-10 | 1.3 | bw | ||||||
| 8-7 | 1.2 | … | ||||||
| NGC7538 | 23:13:44.85 | 61:26:50.6 | 24-23 | 0.1 | … | |||
| 17-16 | 0.5 | … | ||||||
| 11-10 | 1.1 | … | ||||||
| 8-7 | 1.1 | … | ||||||
| W44 | 18:53:18.5 | 61:26:50.6 | 24-23 | 0.20∗ | … | |||
| 17-16 | 1.1 | … | ||||||
| 11-10 | 1.7 | … | ||||||
| 8-7 | 0.71∗ | … |
Notes: The asterisk ∗ shows 3 upper limit, = RMS . We assume (24-23) = 6.5 and (8-7) = 5.2 for W44 using line widths of HC3N 17-16 and 11-10, respectively.
3.1 Line wings
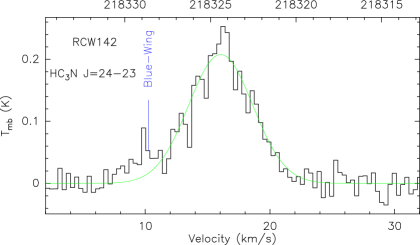
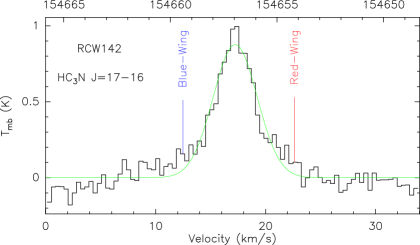
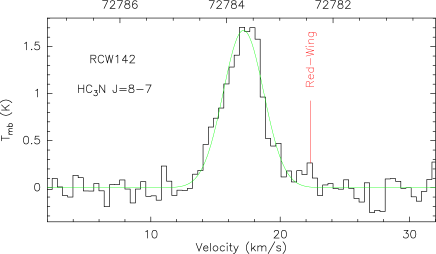
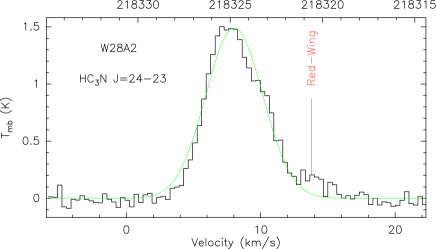
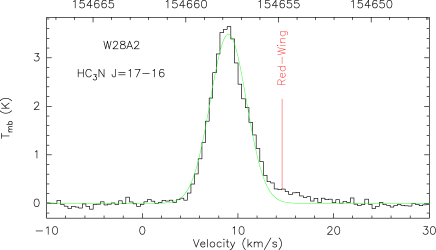
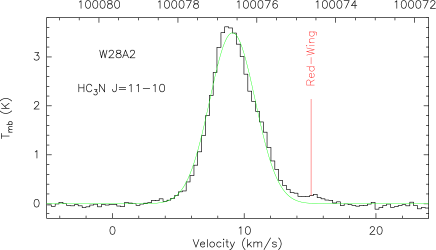
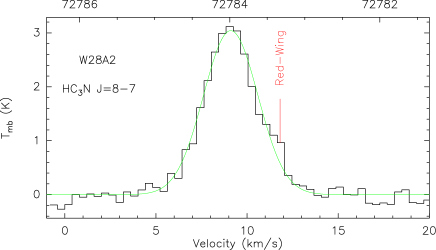
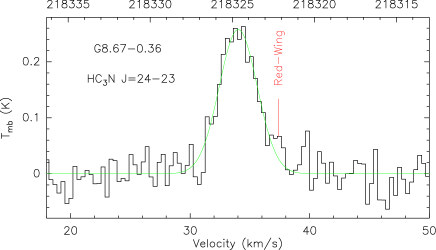
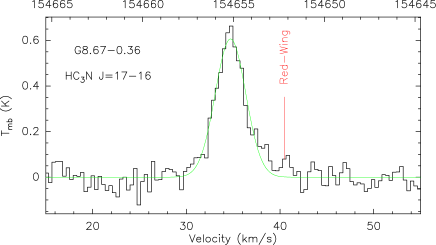
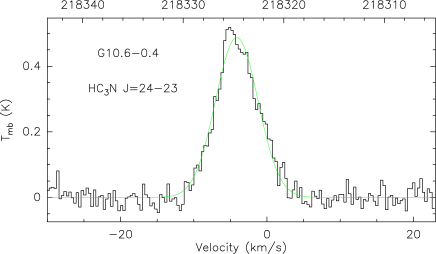
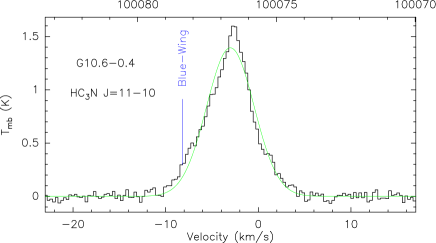
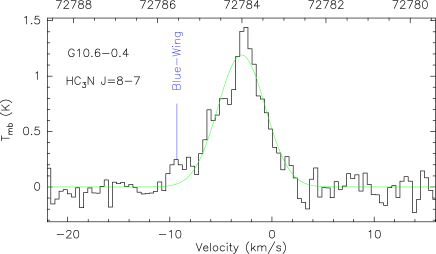
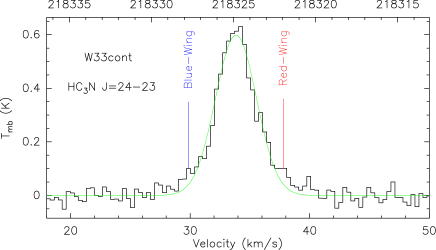
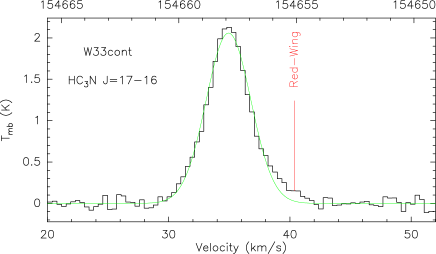
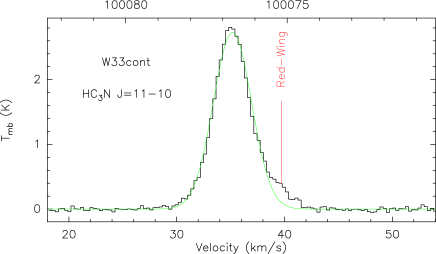
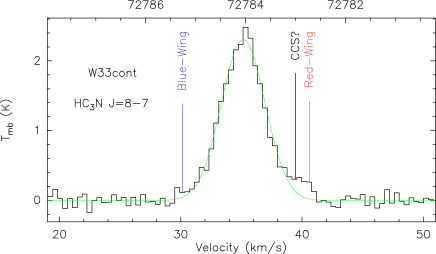
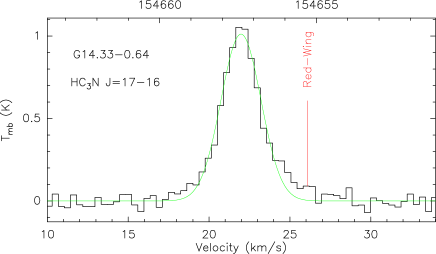
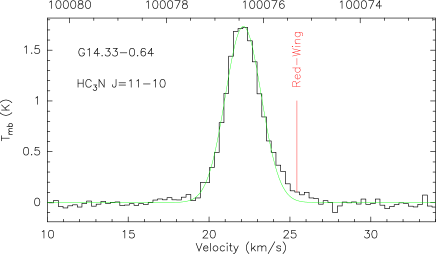
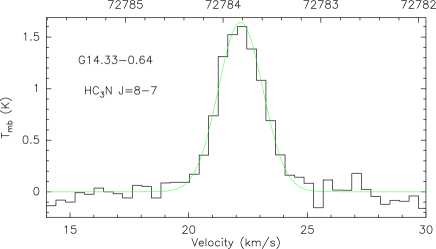
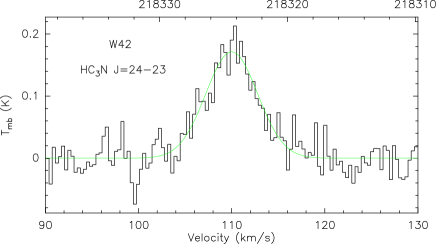
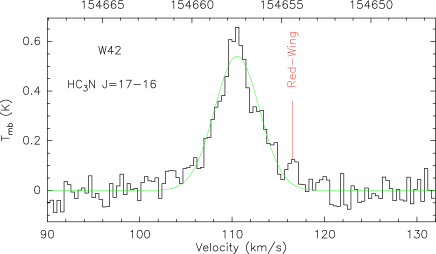
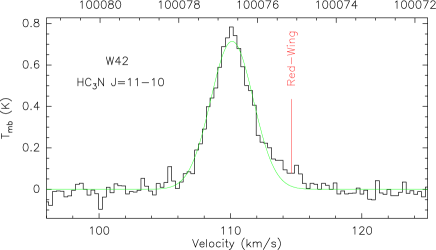
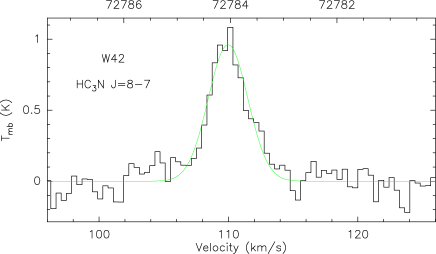
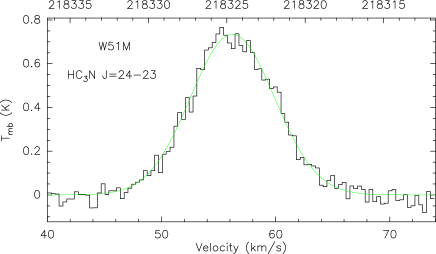
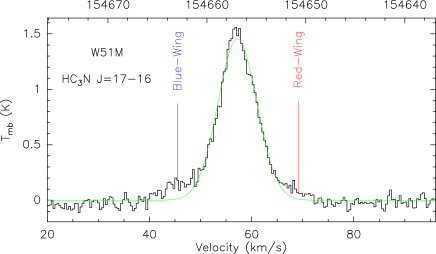
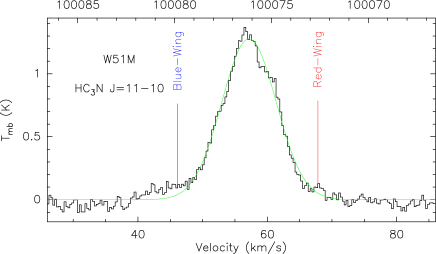
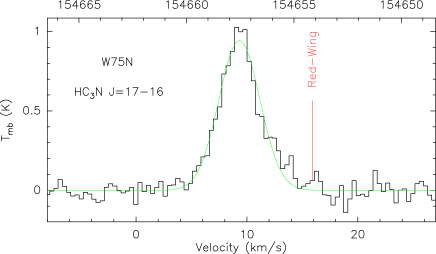
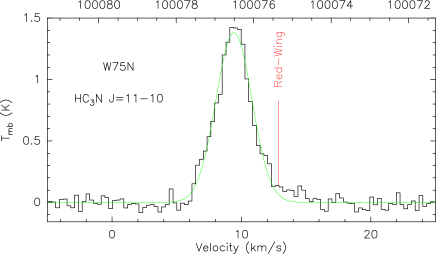
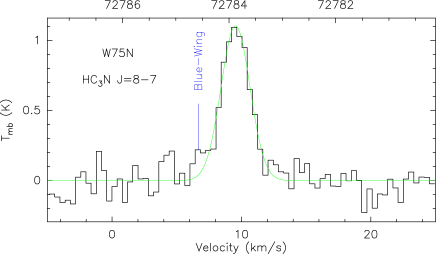
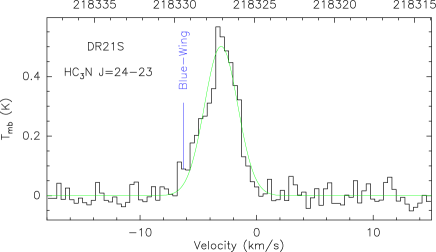
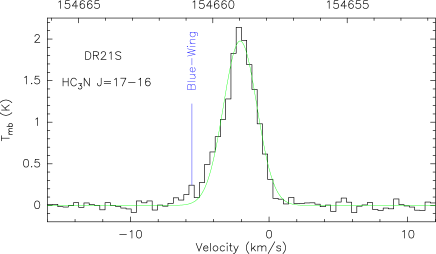
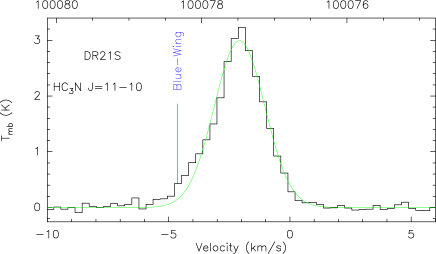
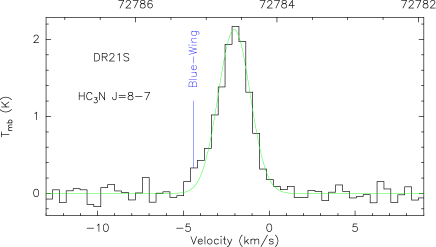
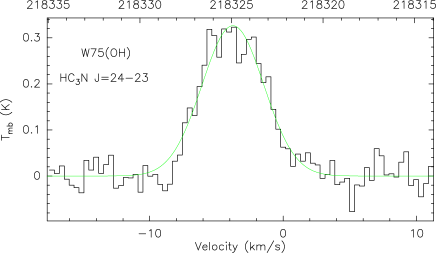
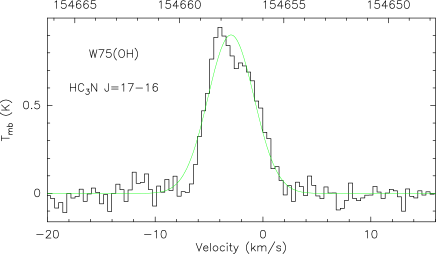
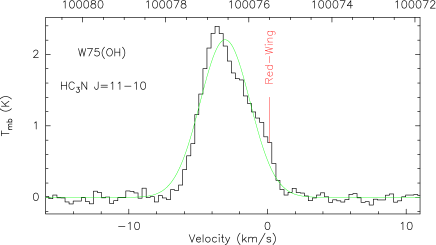
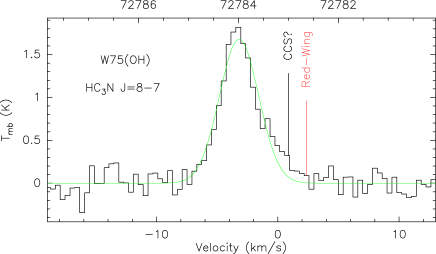
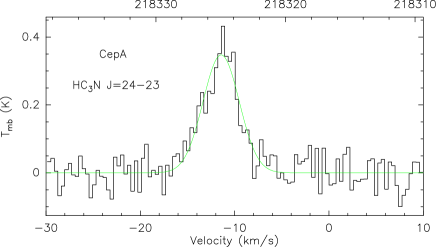
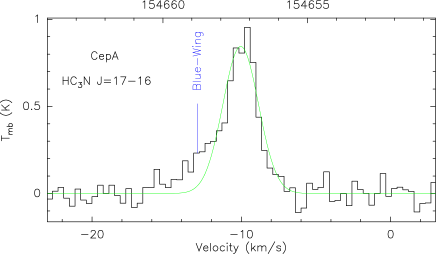
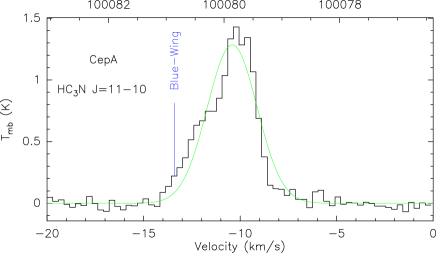
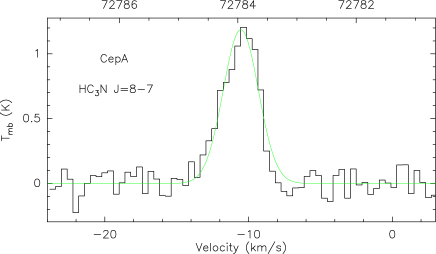
Line wings can be seen in RCW142, W28A2, G8.67-0.36, G10.6-0.4, W33cont, G14.33-0.64, W42, W51M, W75N, DR21S, W75(OH) and CepA. They are marked in Figure 6. Detailed information on them is listed in Table 3.
Among these 12 clumps, G10.6-0.4 and W51M contain CHII regions. The remaining clumps contain UCHII regions, except for W75(OH) (Shirley et al., 2003). The evolutionary status of the HII region of W75(OH) is unclear. Considering the dynamical signatures, we also marked the type of outflows based on the outflow catalog of Wu et al. (2004) and present the infall signatures from Wu et al. (2010) in Table 1. Wu et al. (2004) detected bipolar CO molecular outflows in W28A2, W75N, and CepA, and a blue monopolar CO molecular outflow in DR21S. The remaining clumps were not included in their catalog. Infall signatures were reported in RCW142, G8.67-0.36, G10.6-0.4, W51M, DR21S, W75(OH), and CepA (Wu et al., 2010).
3.2 Line widths
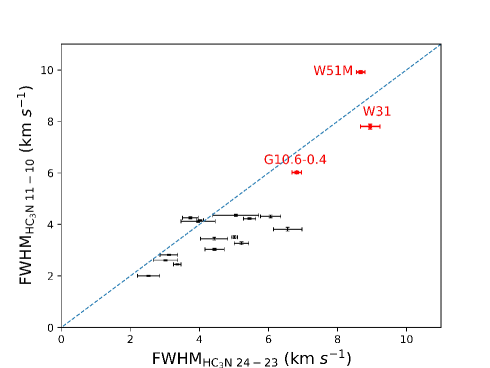
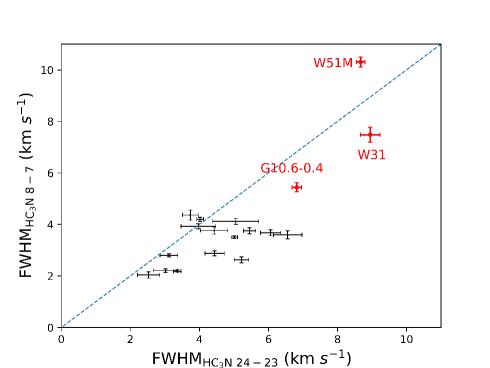
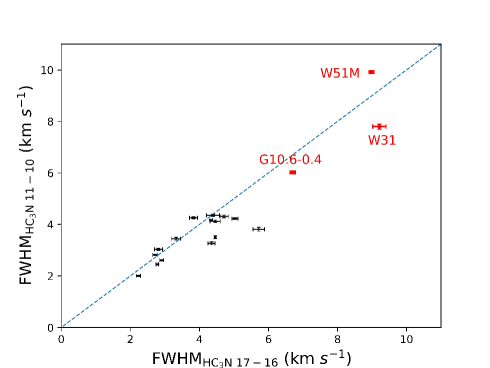
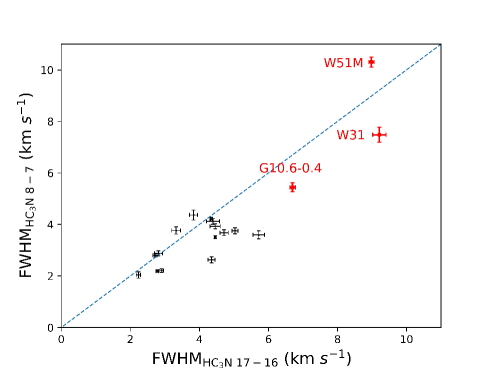
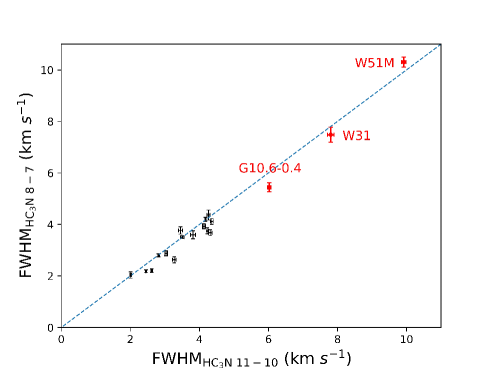
For all sources except W44, comparisons of line widths between each pair of four transitions are presented in Figure 1. For most of these sources, the line widths of high- transitions are larger than the low- ones, which can also be seen in the statistics of mean and median line widths of each transition (See Table 4). The mean and median line widths are 5.020.27, 4.710.1, 4.280.04, 4.040.12 and 4.73, 4.4, 4.13, 3.64 for HC3N 24-23, 17-16, 11-10, and 8-7, respectively. In Figure 1, W31, W51M, and G10.6-0.4 are highlighted because their line widths are noticeably wider than the others. In addition, these three sources also present infall signatures referred from Wu et al. (2010) (see Table 1).
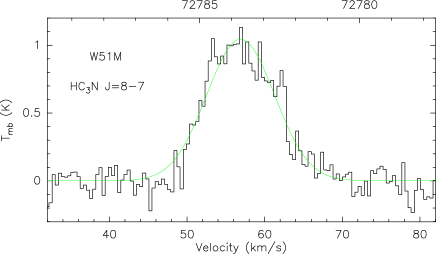
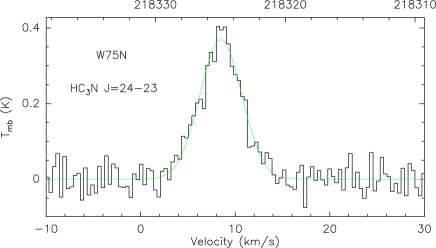
Some sources in our sample show regularity between their -levels and HC3N line widths. The line widths of HC3N for W75N (figure 2 upper panel), RCW142, W75(OH), and DR21S increase with the -levels. The line widths of HC3N for W51M increase as the -levels decrease (figure 2 lower panel). For S76E and W33cont, their HC3N line widths keep roughly constant for different -levels (table 1). For other sources, their HC3N line widths show no obvious trend with change of HC3N -levels.
| HC3N | (24-23) | (17-16) | (11-10) | (8-7) |
|---|---|---|---|---|
| (km s-1) | (km s-1) | (km s-1) | (km s-1) | |
| Mean | ||||
| Median | 4.73 | 4.40 | 4.13 | 3.64 |

3.3 Excitation temperature
We calculated the excitation temperature () of 18 sources using the velocity-integrated intensity ratio between two different transitions of the same molecule through (Zeng et al., 2006)
R_nj = (nj) exp(-ΔEnjk Tex)
| (1) |
where is the ratio of the velocity-integrated intensity in the brightness temperature of HC3N to that of HC3N (n >j). is the energy difference between = and = . and the are the Boltzmann constant and the excitation temperature, respectively. We used the velocity-integrated intensity ratio of HC3N (24-23) to (17-16) to obtain the excitation temperature of HC3N for these clumps, which are listed in Table 1. The excitation temperatures range from 22.9 to 57 K, with a median value of 35.9 K.
Because HC3N (24-23) and (17-16) have similar beam size (See Table 2), can partly avoid the effect of the filling factor. In addition, the angular extent of CS (5-4) mapping observations (See Table 1) is more extended than the beam sizes of HC3N (24-23) and (17-16) (Wu et al., 2010). If we assume HC3N (24-23) and (17-16) emissions extend to regions that are similar to those of CS (5-4), it is reasonable to expect similar filling factors of HC3N (24-23) and (17-16) lines.
4 Discussions
4.1 The origin of line wings of optically thin dense gas tracers
The line wings should be from non-Gaussian motions of the molecular gas, including outflows, infall, etc. Since the HC3N lines are normally optically thin over the entire velocity range, the relative fraction of high-speed non-Gaussian motions to the total gas is proportional to the flux ratio. Thus, gas with non-Gaussian motion is significant if line wings can be identified with such optically thin dense gas tracers. For most of our sources with line wings, the wings appear in high- levels of = 24-23 or = 17-16, which implies that non-Gaussian motions may be from denser and warmer regions for these sources. Among the 12 sources with line wings, CO molecular outflows were reported in 4 (Wu et al., 2004), while infall signatures were reported in 7 (Wu et al., 2010). Both molecular outflows and infalls may produce line wings, while molecular outflow is one type of feedback of massive star formation to the surrounding molecular cloud.
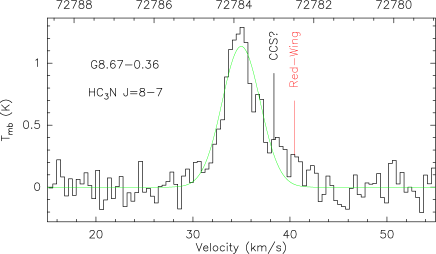
We also checked possible line blending for line wings of HC3N 8-7, 11-10, 17-16, and 24-23 from other molecules with Splatalogue222https://splatalogue.online. After ruling out lines with upper-level energy () higher than 300 K, isotopic lines, or complex molecules with extremely low expected abundance, we found only one line, CCS at a rest frequency of 72.783 GHz, which may cause line blending for HC3N (8-7). No such lines have effects on other HC3N transitions. It is possible that the red wings of G8.67-0.36, W33cont, and W75(OH) were affected by line blending from CCS , as shown in Figure 6.
4.2 Line broadening in regions with different densities
The line information about the state of turbulence and the main gas-emitting region can be inferred from the FWHM line width of Gaussian fits to the observed profiles (Beuther et al., 2002). The thermal broadening contribution to the line width of massive clumps is negligible. Assuming = 50 K and a mean molecular weight of = 51, thermal broadening accounts for only 0.16 km , whereas the smallest line width in our sample is 2 km (M8E). Thermal broadening only accounts for a small fraction of this line width. The turbulent line width of HC3N (24-23, 17-16, 11-10, 8-7) for the sources in our sample is clearly supersonic.
The HC3N lines trace “hot dense” gas. Crudely speaking, the excitation of higher- transitions requires higher temperature and higher critical density, which traces denser, warmer and inner parts of the core, than the excitation of lower- transitions. Based on the line width comparisons in Figure 1 and the statistics shown in Table 4, we can see that the line width increases with increasing -level in most of the sources, which indicates that the inner dense, warm regions have more violent turbulence, or other motions like rotation, than outer regions. Such a line broadening trend can be clearly seen in RCW142, W75N, DR21S, and W75(OH) (upper panel of Figure 2). This trend had been found with multiple CS transitions, and has been explained by star formation feedback (Wu et al., 2010). However, the line width of W51M increases with decreasing -level (bottom panel of Figure 2), while different HC3N lines have almost the same line widths in S76E and W33cont. Line broadening in different density regions in massive star-forming regions cannot be explained with one simple model. Sources with larger line widths in the inner denser, warmer regions might need more time to dissipate turbulence and/or angular momentum and initiate dynamical collapse than others.
W31, W51M and G10.6-0.4, which are highlighted in Figure 1, showed noticeably broader line widths than other sources. Such broad line widths indicate that there is more violent turbulence in these sources than in others. Infall signatures in these sources have been reported previously (Wu et al., 2010).
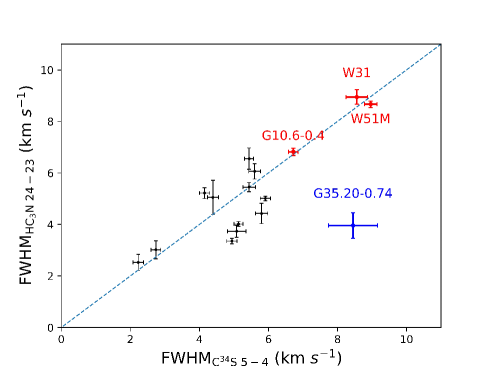
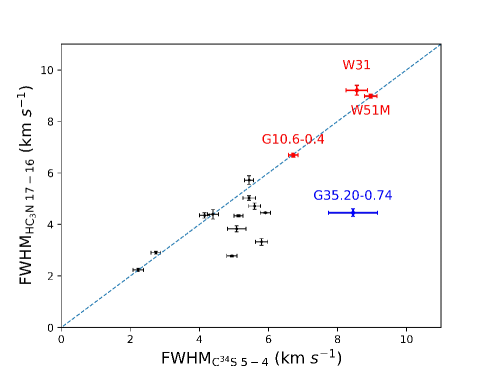
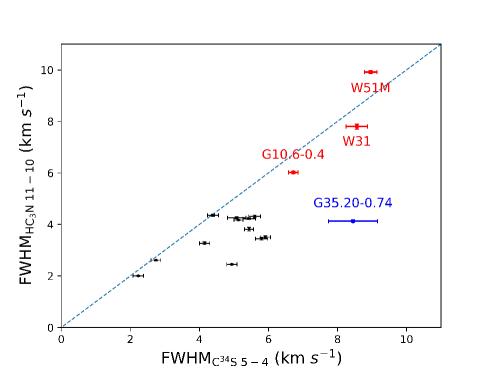
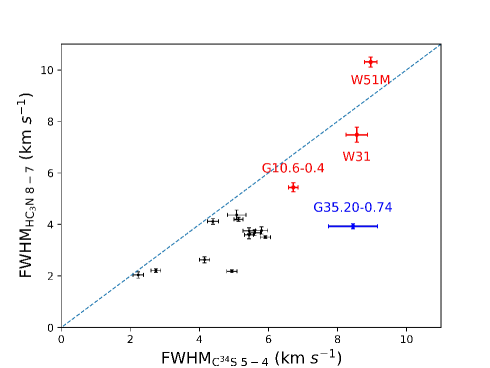
C34S (5-4) was used for deriving the virial mass of clumps in Shirley et al. (2003). The FWHM line width is one of the parameters for calculating virial mass (). In Figure 3, we compare the line widths (FWHM) of HC3N (24-23, 17-16, 11-10, 8-7) with C34S (5-4). The Line widths of the four transitions show approximately linear correlation with the line widths of C34S (5-4). However, G35.20-0.74 shows clear deviation from the nearly linear correlations. The virial mass in G35.20-0.74 may need to be recalculated with the line widths of the HC3N lines instead of C34S (5-4).
4.3 Possible cutoff between log and the line width relation
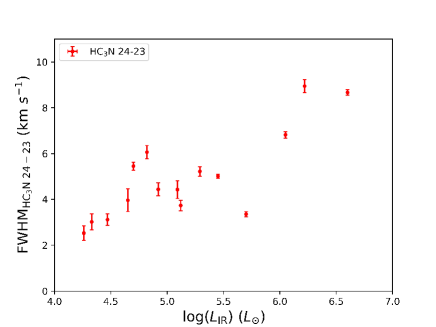
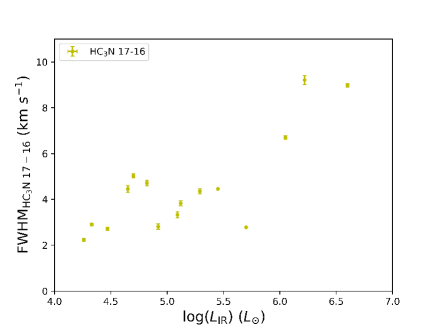
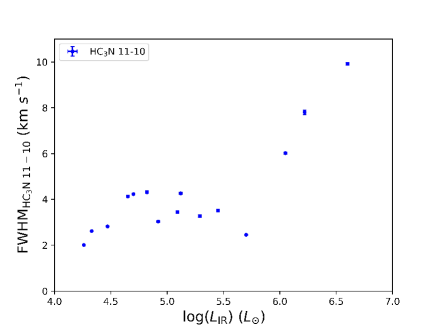
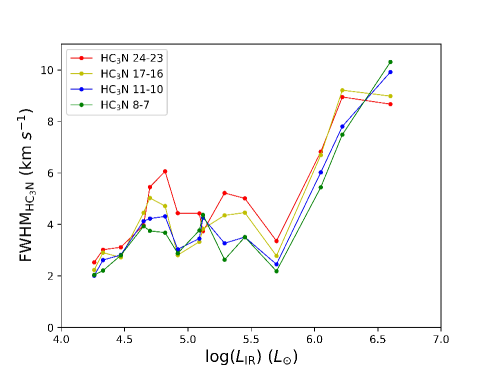
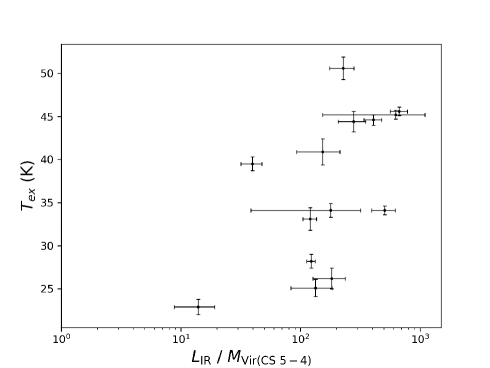
Figure 4 shows log against the line width of 15 sources. Because the line width of HC3N (24-23 and 8-7) for W44 were not obtained and W33cont, W42 and NGC7538 were not included in the infrared luminosity catalog of Wu et al. (2010), these four sources are excluded in the comparisons. As can be seen in Figure 4, we found a possible cutoff around 105.5 for all four transitions. When infrared luminosities are less than 105.5 , the FWHM line widths are roughly flat for various , while, the FWHM line widths show a deep upward trend with increasing when infrared luminosities () are greater than 105.5 . However, such an upward trend is not persuasive. Further extensive samples are necessary for more convincing confirmation of such a cutoff. The possible cutoff trend might imply star formation feedback or the initial conditions of star formation.

4.4 Excitation temperature vs other properties?
The excitation temperature () is determined by the velocity-integrated intensity ratio between HC3N (24-23) and HC3N (17-16). for massive star-formation regions was measured in the range of 30 - 50 K for CO molecule (1996ApJ...472..225S; Beuther et al., 2002; Wu et al., 2004). The median value of in our sample is 35.9 K, which is consistent with previous works. On the other hand, for low-mass sources ranges from 10 K to 15 K (Snell et al., 1980; Goldsmith et al., 1984).
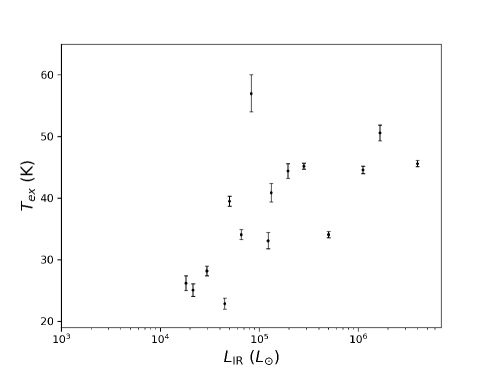
The left panel of Figure 5 shows a comparison between and . There is a roughly positive correlation between and . Wu et al. (2010) proposed that higher luminosity may lead to a greater fraction of gas being warm enough to emit higher- lines. However, there is only a weak correlation between the logarithmic line luminosity ratio of CS (7-6) to CS (5-4) and log . As shown in Figure 5, there is a strong correlation between and with a correlation coefficient of 0.76. According to equation (1), log is proportional to log . Such a correlation implies that gas in more luminous sources is warmer than in low-luminosity ones. What was proposed above by Wu et al. (2010) may be another explanation for the correlation between and .
However, taking the errors in the virial mass into consideration, no obvious trend can be found for the relation between and star-formation efficiency (/), as shown in the right panel of Figure 5. This implies that star-formation efficiency is not proportional to the excitation conditions of dense gas.
5 Summary
We used the ARO 12-m and CSO 10.5-m radio telescopes to observe HC3N (24-23, 17-16, 11-10, 8-7) lines towards a sample consisting of 19 Galactic massive star-forming regions. Our main results are summarized as follows:
1. In our 19 sources, we obtained the HC3N (17-16, 11-10) lines of W44 and HC3N (24-23, 17-16, 11-10, 8-7) lines of the remaining 18 sources. For most sources, the spectral lines have S/N > 5 .
2. Twelve of the sources, RCW142, W28A2, G8.67-0.36, G10.6-0.4, W33cont, G14.33-0.64, W42, W51M, W75N, DR21S, W75(OH) and CepA, have line wings in their lines.
3. The line widths of higher- HC3N lines are generally larger than lower- ones , which may imply more violent turbulence or other motions in the inner regions of massive star formation than the outer regions for most sources.
4. Excitation temperatures derived from the line ratio of HC3N (24-23) to HC3N (17-16) for 18 sources range from 23 K to 57 K, with a median value of 35.9 K.
5. A possible cutoff tendency was found around 105.5 in the relation between and the line widths of four lines.
Acknowledgements
This work is supported by the National Key Basic Research and Development Program of China (grant no. 2017YFA0402704), National Natural Science Foundation of China grants 11590783 and U1731237, and China Postdoctoral Science Foundation grant no. 2020M671267. We thank the staff at the CSO 10.4 m telescope and the ARO 12 m telescope for their kind help and support during our observations.
References
- Bergin et al. (1996) Bergin, E. A., Snell, R. L., & Goldsmith, P. F. 1996, ApJ, 460, 343. doi:10.1086/176974
- Beuther et al. (2002) Beuther, H., Schilke, P., Sridharan, T. K., et al. 2002, A&A, 383, 892. doi:10.1051/0004-6361:20011808
- Beuther et al. (2002) Beuther, H., Schilke, P., Menten, K. M., et al. 2002, ApJ, 566, 945. doi:10.1086/338334
- Chung et al. (1991) Chung, H. S., Osamu, K., & Masaki, M. 1991, Journal of Korean Astronomical Society, 24, 217
- Faure et al. (2016) Faure, A., Lique, F., & Wiesenfeld, L. 2016, MNRAS, 460, 2103. doi:10.1093/mnras/stw1156
- Goldsmith et al. (1984) Goldsmith, P. F., Snell, R. L., Hemeon-Heyer, M., et al. 1984, ApJ, 286, 599. doi:10.1086/162635
- Hassel et al. (2008) Hassel, G. E., Herbst, E., & Garrod, R. T. 2008, ApJ, 681, 1385. doi:10.1086/588185
- Larson (1981) Larson, R. B. 1981, MNRAS, 194, 809. doi:10.1093/mnras/194.4.809
- Meier et al. (2000) Meier, D. S., Turner, J. L., & Hurt, R. L. 2000, ApJ, 531, 200. doi:10.1086/308429
- Meier et al. (2011) Meier, D. S., Turner, J. L., & Schinnerer, E. 2011, AJ, 142, 32. doi:10.1088/0004-6256/142/1/32
- Morris et al. (1976) Morris, M., Turner, B. E., Palmer, P., et al. 1976, ApJ, 205, 82. doi:10.1086/154252
- Mueller et al. (2002) Mueller, K. E., Shirley, Y. L., Evans, N. J., et al. 2002, ApJS, 143, 469. doi:10.1086/342881
- Pirogov et al. (2003) Pirogov, L. E., Johansson, L. E. B., & Zinchenko, I. I. 2003, Astronomical and Astrophysical Transactions, 22, 33. doi:10.1080/1055679021000017448
- Plume et al. (1992) Plume, R., Jaffe, D. T., & Evans, N. J. 1992, ApJS, 78, 505. doi:10.1086/191636
- Plume et al. (1997) Plume, R., Jaffe, D. T., Evans, N. J., et al. 1997, ApJ, 476, 730. doi:10.1086/303654
- Shepherd & Churchwell (1996) Shepherd, D. S. & Churchwell, E. 1996, ApJ, 457, 267. doi:10.1086/176727
- Shirley et al. (2003) Shirley, Y. L., Evans, N. J., Young, K. E., et al. 2003, ApJS, 149, 375. doi:10.1086/379147
- Snell et al. (1980) Snell, R. L., Loren, R. B., & Plambeck, R. L. 1980, ApJ, 239, L17. doi:10.1086/183283
- Wu et al. (2010) Wu, J., Evans, N. J., Shirley, Y. L., et al. 2010, ApJS, 188, 313. doi:10.1088/0067-0049/188/2/313
- Wu et al. (2004) Wu, Y., Wei, Y., Zhao, M., et al. 2004, A&A, 426, 503. doi:10.1051/0004-6361:20035767
- Zeng et al. (2006) Zeng, Q., Mao, R. Q., & Pei, C. C. 2006, Microwave Spectrum Diagnosis in Astrophysics (Beijing: Publisher of Chinese Science and Technology) (in Chinese)


Appendix A HC3N (24-23) line of sources without line wings