Toward a Larger Sample of Radio Jets from Quiescent Black Hole X-ray Binaries
Abstract
Quiescent black hole X-ray binaries (X-ray luminosities ) are believed to be fed by hot accretion flows that launch compact, relativistic jets. However, due to their low luminosities, quiescent jets have been detected in the radio waveband from only five systems so far. Here, we present radio observations of two quiescent black hole X-ray binaries with the Australia Telescope Compact Array. One system, GS 1124-684, was not detected. The other system, BW Cir, was detected over two different epochs in 2018 and 2020, for which we also obtained quasi-simultaneous X-ray detections with Chandra and Swift. BW Cir is now the sixth quiescent X-ray binary with a confirmed radio jet. However, the distance to BW Cir is uncertain, and we find that BW Cir shows different behaviour in the radio/X-ray luminosity plane depending on the correct distance. Estimates based on its G-type subgiant donor star place BW Cir at 25 kpc, while initial optical astrometric measurements from Gaia Data Release 2 suggested likely distances of just a few kpc. Here, we use the most recent measurements from Gaia Early Data Release 3 and find a distance kpc and a potential kick velocity PKV= km s-1, with distances up to 20 kpc possible based on its parallax and proper motion. Even though there is now less tension between the parallax and donor-star based distance measurements, it remains an unresolved matter, and we conclude with suggestions on how to reconcile the two measurements.
keywords:
X-rays: binaries – stars: black holes – stars: individual: BW Cir – stars: individual: GS 1124-6841 Introduction
Transient black hole X-ray binaries (BHXBs) spend the majority of their time in a quiescent accretion state, which normally corresponds to X-ray luminosities () between (e.g., Corbel et al., 2006; Plotkin et al., 2013). Extrapolating the ‘hard’ X-ray state to quiescence (see Remillard & McClintock 2006 for state definitions), the expectation is that quiescent BHXBs are fed by some flavor of a radiatively inefficient accretion flow (RIAF; e.g., Ichimaru 1977; Narayan & Yi 1995a; Blandford & Begelman 1999; Yuan & Narayan 2014). Quiescent BHXBs are also expected to launch compact, partially self-absorbed synchrotron jets (Blandford & Königl, 1979; Fender, 2001; Corbel & Fender, 2002). However, the radiative power of quiescent jets is so low that the current number of radio-detected quiescent outflows is limited to only five systems (Gallo et al., 2005, 2006, 2014; Hynes et al., 2009; Miller-Jones et al., 2011; Dzib et al., 2015; Ribó et al., 2017; Corbel et al., 2013; Rodriguez et al., 2020; Tremou et al., 2020), out of 20 dynamically confirmed BHXBs in our Galaxy and at least three times as many candidates (Corral-Santana et al., 2016; Tetarenko et al., 2016).
Radio detections of quiescent BHXB jets are important for self-consistently modeling the higher-energy radiation outputted by quiescent systems (e.g., McClintock et al., 2003; Yuan & Cui, 2005; Malzac, 2014; Markoff et al., 2015; Plotkin et al., 2015; Connors et al., 2017; Mościbrodzka, 2019). Constraints on quiescent radio jet variability are also starting to emerge. When taken in a multiwavelength context, the radio time domain has the potential to improve our understanding of the structure and energetics of quiescent jets, and how quiescent jets couple to the underlying RIAF (e.g., Miller-Jones et al., 2008; Hynes et al., 2009; Dzib et al., 2015; Rana et al., 2016; Dinçer et al., 2018; Gallo et al., 2019; Plotkin et al., 2019). However, we still require a larger sample of radio-detected quiescent BHXBs, or more meaningful limits from non-detections. Furthermore, radio constraints should span a range of BHXB properties (e.g., orbital period, black hole/donor mass, inclination, etc.), so that we can start to tease out jet and RIAF properties that are common across the entire population vs. specific to individual sources.
In addition to advancing our physical understanding, empirical limits on more quiescent radio jets are crucial for guiding future BHXB surveys that rely on radiative signatures to discover new sources. The ‘traditional’ method of discovering BHXBs during outbursts leads to BHXB samples that are unlikely representative of the underlying population in terms of properties like orbital period, inclination, black hole mass, etc. (see, e.g., Narayan & McClintock, 2005; Jonker et al., 2014). Discovering new systems in quiescence (instead of during outburst) can alleviate some selection biases, and techniques have already been suggested/implemented in the X-ray (Agol & Kamionkowski, 2002; Jonker et al., 2014), optical (Casares, 2018), and radio wavebands (Maccarone, 2005; Strader et al., 2012). Note, these selection techniques in quiescence also have the potential to reveal isolated black holes.
Radio selection of accreting BHXBs has a unique advantage over other wavebands, in that radio emission is not affected by dust obscuration or crowding by other sources in the field. Indeed, radio surveys are already revealing new candidate BHXB populations, including black hole candidates in Galactic globular clusters (Strader et al., 2012; Chomiuk et al., 2013; Miller-Jones et al., 2015; Shishkovsky et al., 2018; Zhao et al., 2020). The most common radio diagnostic so far (at least for initial candidate identification) has been to compare the ratio of radio luminosity () to X-ray luminosity, which increases for decreasing according to the radio/X-ray luminosity correlation for hard state and quiescent BHXBs (e.g., Corbel et al., 2013; Gallo et al., 2018). To efficiently identify new quiescent systems, one still desires a larger comparison sample of dynamically-confirmed quiescent BHXBs with radio detections, so that one can confidently parameterise the multiwavelength luminosity space that is occupied by BHXBs.
The second data release (DR2) of the Gaia mission (Gaia Collaboration et al., 2016, 2018a) included trigonometric parallax measurements to 11 BHXBs (Gandhi et al. 2019, hereafter G19). The new Gaia distance constraints motivated us to reassess if any dynamically-confirmed BHXBs might be close enough to present a realistic chance of a radio detection. We stress, however, that the majority of parallaxes were at the 2–3 level. At this level, translating the parallaxes to distances is best achieved via Bayesian modeling, which requires using a prior that describes how BHXBs are distributed in our Galaxy (e.g., Grimm et al. 2002; Atri et al. 2019; G19). In turn, implied Gaia parallax-based distances can be highly dependent on the adopted prior, and most distances are less precise than distances derived from other methods. See Atri et al. (2019) and G19 for comparisons on distances inferred from Gaia parallaxes vs. other methods (Jonker & Nelemans 2004 provide a summary of other distance estimation techniques).
Despite the above caveats, we identified two dynamically confirmed BHXBs in Gaia DR2 worth radio scrutiny: BW Cir and GS 1124-684. In Section 2 we describe properties of each target. In Section 3 we present new observations of each source in quiescence, which included radio observations with the Australia Telescope Compact Array (ATCA) for both sources, and also quasi-simultaenous X-ray observations with the Chandra X-ray Observatory and the Neil Gehrels Swift Observatory for BW Cir. Results are presented in Section 4, which are then discussed in Section 5. We conclude with suggestions for future work in Section 6 and a summary in Section 7. Throughout, all errors are reported at the 68% confidence level, unless stated otherwise. Although our initial target selection was based on Gaia DR2, all astrometric information in this paper is taken from Gaia’s Early Data Release 3 (EDR3; Gaia Collaboration et al., 2020), which was released after our observations were taken.
2 Targets
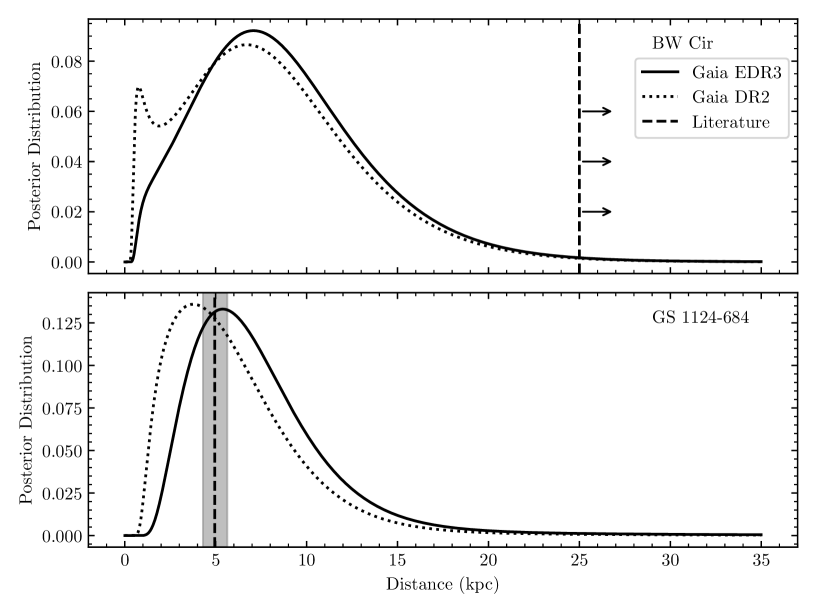
For both of our targets, we derive distance posterior distributions from the EDR3 parallax measurements by applying the Bayesian method developed by G19 and Atri et al. (2019). They adopt a prior based on the three-dimensional distribution of X-ray binaries in our Galaxy by defining their density in the disc, bulge and spheroid of the Galaxy (Grimm et al., 2002). The EDR3 posterior distributions imply distances of and kpc for BW Cir and GS 1124-684, respectively (Figure 1), where the distances and uncertainties represent the modes and 68% confidence intervals of the posterior distributions. The distance estimates in the literature for each source (i.e., prior to Gaia) are kpc for BW Cir (Casares et al. 2004; Casares et al. 2009; hereafter C04; C09), and kpc for GS 1124-684 (Wu et al., 2016). The Gaia astrometry and inferred distances are summarized in Table 1, where we also include the older DR2 measurements for comparison (since our target selection was initially based on DR2). Each target is described in more detail below.
2.1 BW Cir
BW Cir is a dynamically confirmed black hole, with an orbital period d (61 h) and a mass function (\al@casares04,casares09; \al@casares04,casares09). Since the 1960s there have been five X-ray outbursts detected from a region consistent with BW Cir (see the summary in Tetarenko et al. 2016), but only three have been reliably identified as the same X-ray source: outbursts in 1987 (Makino, 1987), in 1997 (Remillard et al., 1997), and in 2015 (Miller et al., 2015).
The optical counterpart shows a relatively large amount of stochastic variability in quiescence (a few tenths of a magnitude, depending on the filter; C09). Even with that level of variability, the optical properties of the donor star have been well constrained by C04 and C09: they classify the donor as a G0-5 III star (surface temperature 5091 – 5743 K), they detect ellipsoidal modulations (indicating that accretion is fed by Roche lobe overflow), and they constrain the donor-to-black hole mass ratio to . For an inclination (based on the lack of X-ray dips), the orbital parameters imply a black hole mass and a donor mass . Stellar evolution arguments for a G sub-giant limit the donor star to 2.4 (C04), meaning that the donor is constrained to a relatively narrow range in mass. Comparing the absolute magnitude of the donor (which they calculate via the Stefan-Boltzmann law for a 5000 K blackbody radiator filling the Roche lobe of a 1.0 star, which is ) to the optical apparent magnitude (), and accounting for 56% disk veiling and a reddening of (Kitamoto et al., 1990), C09 derive a distance 25 kpc. They also determine an upper limit 61 kpc if its outbursts were Eddington-limited.
Surprisingly, Gaia measured a parallax to this source that implies a closer distance. The latest EDR3 Gaia parallax is milli-arcsec, which corresponds to kpc when adopting a prior based on the distribution of low-mass X-ray binaries in our galaxy (Grimm et al., 2002; Atri et al., 2019). We note that the Gaia proper motion and parallax measurements all decreased by in EDR3 compared to DR2, and we suspect that some of these changes are driven by systematics (i.e., they are not caused only by statistical fluctuations related to the longer time baseline of observations in EDR3). The most obvious warning sign is that the distance posterior distribution changed from being bimodal in DR2 (peaks near 0.7 and 6.7 kpc) to unimodal in EDR3 (peak at 7.1 kpc; Figure 1). We discuss in §6.1 that an interloping source could be blended with the Gaia optical counterpart, which may explain some of these systematics and help ease tension between the Gaia and literature distance estimates.
Possible systematic issues aside, either a small distance (as implied by Gaia) or a large distance (as implied by the donor star) has unusual consequences. We refer the reader to G19 for a detailed discussion based on the DR2 data. To summarize their discussion, the large 25 kpc distance causes the quiescent X-ray luminosity to be 10 times larger than expected from its orbital period (Reynolds & Miller, 2011), and based on the DR2 proper motions it also implies a large peculiar velocity 900 km s-1 that starts to approach the escape velocity of the Milky Way (G19). This distance also implies that during its 2015 outburst, BW Cir peaked at an X-ray luminosity in the hard state that was 5-6 times higher than previously observed for any other hard state system (Koljonen et al., 2016; Tetarenko et al., 2016). However, a smaller distance introduces new problems, in that it would require a significantly smaller radius (and therefore mass) for the donor star. Note, the 25 kpc distance limit already accounts for the lowest donor mass allowed by the mass function and values (i.e., ).
The evidence and assumptions by C04 and C09 that point to 25 kpc (based on the donor star) are very robust. The biggest source of uncertainty is the level of extinction. However, tweaking the adopted reddening of within reasonable values (while remaining consistent with the level of X-ray absorption) can only move the distance down to 16 kpc (Reynolds & Miller, 2011). Requiring the donor mass to be 0.1 , and assuming the donor fills its Roche lobe, further provides a strict limit of kpc (see, e.g., G19). Compared to Gaia DR2, the smaller proper motions and parallax measurements in EDR3 now allow a more reasonable probability of the high-distance tail of the posterior distribution extending out to 20 kpc (with reasonable space velocities; see §5.2), but reconciling the Gaia and literature-based distances still remains a challenge.
2.2 GS 1124-684
GS 1124-684 (also known as Nova Muscae 1991) is an important source in terms of our understanding of black hole accretion, as it is one of the most high profile systems to which advection dominated accretion flow (ADAF; e.g., Narayan & Yi 1994, 1995b) models were initially tested against (Esin et al., 1997). GS 1124-684 was discovered during a bright outburst in 1991 (della Valle et al., 1991; Lund et al., 1991) and has been in quiescence since the end of that outburst. It contains a dynamically confirmed black hole with (Wu et al., 2016) in a d orbit (i.e., 10.4 h; Wu et al., 2015), and the system has an inclination angle of degrees (Wu et al., 2016). The EDR3 Gaia parallax ( milli-arcsec) implies a distance of kpc, which is consistent with the most recent pre-Gaia distance of kpc (which was derived from the properties of a donor star calculated to have a mass of , a radius , and a temperature K; Wu et al. 2016). Note, the Gaia distance is less precise than the distance inferred from the donor star.
3 Observations
3.1 Radio observations
ATCA observations were taken for both sources through program C3280 (PI Plotkin), and all data were obtained over 22048 MHz basebands centred at 5.5 and 9.0 GHz. Details specific to each source are described below.
3.1.1 BW Cir: 2018 and 2020 with ATCA
We initially observed BW Cir over a 12 hour ATCA run from 2018 October 8 UT 20:40 2018 October 9 UT 08:40 in the 6A configuration, yielding 600 min on source (prior to flagging). After obtaining a tentative detection (see below), we took deeper observations on 2020 March 13 UT 08:50 - 20:50 and 2020 March 14 UT 08:50 - 20:50 in the 6D configuration, obtaining an additional 1200 min integration. Data were calibrated following standard procedures in Miriad v20190411 (Sault et al., 1995). We used 1934638 as the bandpass and flux calibrator, and we cycled to the phase calibrator 135263 every 10-15 min to solve for the complex gain solutions. Weather conditions were good during all observations.
Imaging was performed within the Common Astronomy Software Applications (CASA) v5.6.2 (McMullin et al., 2007) using the task tclean. We used two Taylor terms (nterms=2) to account for the wide fractional bandwidth, and we used Briggs weighting with robust=0.5 as a compromise between reducing sidelobes from nearby sources while retaining sensitivity. For each night we produced images at 5.5 and 9.0 GHz separately, and we also stacked both frequencies to produce images at a central frequency of 7.25 GHz. For the 2020 observations, we also stacked observations from both nights. Point-like radio emission was detected in both 2018 and 2020 at a right ascension of 13h58m09.73s(0.01) and a declination (0.08), which is consistent with the optical position from Gaia.
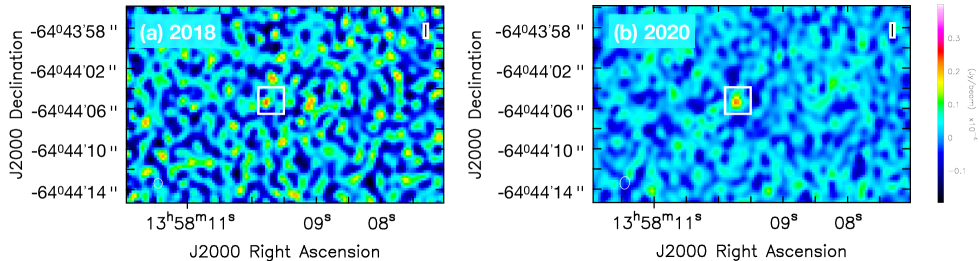
Flux densities were measured within CASA using the task imfit, using a point source to model the flux density. We detected radio emission in both 2018 (3.4) and 2020 (6.6). The radio detections were not strong enough to obtain useful spectral information between 5.5 and 9.0 GHz, so we only report flux densities after stacking the full 4 GHz bandwidth (corresponding to a central frequency of 7.25 GHz). We also do not detect any variability (within the uncertainties) between our two 2020 epochs, so we report only a single flux density from 2020 after combining both days of observations. We find Jy bm-1 in 2018 and Jy bm-1 in 2020, where the uncertainties represent the root mean square (rms) noise measured in a blank area of the sky.111In 2020, our final rms uncertainties are consistent with expectations from the ATCA online sensitivity calculator. In 2018, we reached a sensitivity that was Jy higher than expected, probably because we flagged more data in 2018 due to mildly less stable atmospheric conditions and phase solutions. Flux densities are summarized in Table 2, and radio images are presented in Figure 2.
| Radio | X-ray | |||||||
| Source | Date | a | Telescope | Date | d | |||
| (min) | (GHz) | (Jy) | (ks) | ( erg s-1 cm-2) | ||||
| BW Cir | 2018 Oct 8–9 | 600 | 7.25 | Chandra | 2018 Oct 8 | 19.7 | ||
| BW Cir | 2020 Mar 13–14 | 1200 | 7.25 | Swift | 2020 Mar 14 | 4.8 | ||
| GS 1124-684 | 2018 Oct 9–10 | 460 | 5.5 | … | … | … | … | |
a Integration time on source.
b Central frequency of radio image.
c Radio flux density at the central frequency .
d Unabsorbed X-ray flux from 1-10 keV.
e 3 upper limit.
3.1.2 GS 1124-684: 2018 with ATCA
We observed GS 1124-684 from 2018 October 9 UT 18:30 - 2018 October 10 UT 04:30, obtaining 460 min of integration on source (prior to flagging); we used 0823500 as the bandpass and flux calibrator, and 1133681 as the phase calibrator. Atmospheric stability and weather were worse for our run on GS 1124-684, such that we started the night with 10 min cycles to the phase calibrator, which we shortened to 5 min around UT 01:30 when we started observing through clouds and light rain. Our observing run was prematurely ended at UT 04:30 due to thunderstorms and a lightning stow of the antennas (and we ultimately flagged much of the data taken after UT 01:30).
Data were calibrated in the same manner as described above. However, our time-dependent phase calibrations were generally of poor quality at 9.0 GHz (worsening toward the end of the run). At 5.5 GHz the calibrations were of reasonable quality, and we only imaged the lower (2 GHz) frequency baseband for flux estimation. We did not obtain a radio detection to a limit of Jy bm-1 (). Even though the observing conditions were less than ideal, the 5.5 GHz observations were of sufficient quality that if ATCA were able to detect radio emission from GS 1124-684, then we would have expected to see (at a minimum) marginal 1-2 indications of radio emission at the known optical/X-ray position of GS 1124-684. Since no signs of radio emission were present, there was no motivation for deeper follow-up ATCA observations on GS 1124-684.
3.2 X-ray Observations
For BW Cir, we obtained quasi-simultaneous X-ray observations during both our 2018 and 2020 observing runs, using Chandra in 2018 and Swift in 2020.
3.2.1 Chandra in 2018
Chandra observations were obtained through Director’s Discretionary Time (DDT; PI Reynolds), which started on 2018 October 8 UT 06:03 and lasted for 19.7 ks (obsid 21868). The target was placed at the aimpoint of the S3 chip on the Advanced CCD Imaging Spectrometer (ACIS; Garmire et al., 2003), and data were telemetered in VFAINT mode. Data were reduced using the Chandra Interactive Analysis of Observations v4.12 (CIAO; Fruscione et al. 2006) and CALDB v4.9.1. The data were first re-processed with chandra_repro. We detected 83 counts in a circular aperture with radius 2.5 arcsec, with 1 background counts expected within that aperture (the sky background was measured within an annulus centred on the source position, with inner and outer radii of 4 and 7 arscsec respectively).
To calculate fluxes, a spectrum was extracted using the specextract tool. The spectrum was then fit using XSPEC v12.10.1f, adopting an absorbed powerlaw model (tbabs power) (Wilms et al., 2000) and W-statistics (see Cash, 1979). The best-fit column density and photon index were cm-2 and . From these spectral parameters, we calculated an unabsorbed model flux of erg s-1 cm-2.
3.2.2 Swift in 2020
In 2020, Swift DDT observations were taken with the X-ray Telescope (XRT; Burrows et al. 2005) in photon counting (PC) mode (obsID 00033811067; PI Reynolds). We observed for a total of 4.8 ks, with the observations split over multiple 1 ks snapshots. The first snapshot started on 2020 March 14 UT 00:09, and the final one started at UT 09:23.
Data were reprocessed using HEASoft v 6.25222https://heasarc.gsfc.nasa.gov/docs/software/heasoft/ and the latest version of the Swift CALDB. Data were first reprocessed through xrtpipeline. Source counts were extracted from a circular aperture with radius 10 pixels; background counts were estimated over an annulus with inner and outer radii of 60 and 90 pixels, respectively. We detected BW Cir with 12 net counts.
To calculate fluxes, we extracted a spectrum using xselect, and we created an ancilliary response file using the tool xrtmkarf (and the appropriate response matrix was taken from the CALDB). We adopted an absorbed powerlaw model in xspec, and, given the low number of counts, we fixed the column density to cm-2 (i.e., the best-fit value from our 2018 Chandra observation). Using W-statistics, we found a best-fit photon index of and an unabsorbed model flux of erg s-1 cm-2.
4 Results
4.1 BW Cir
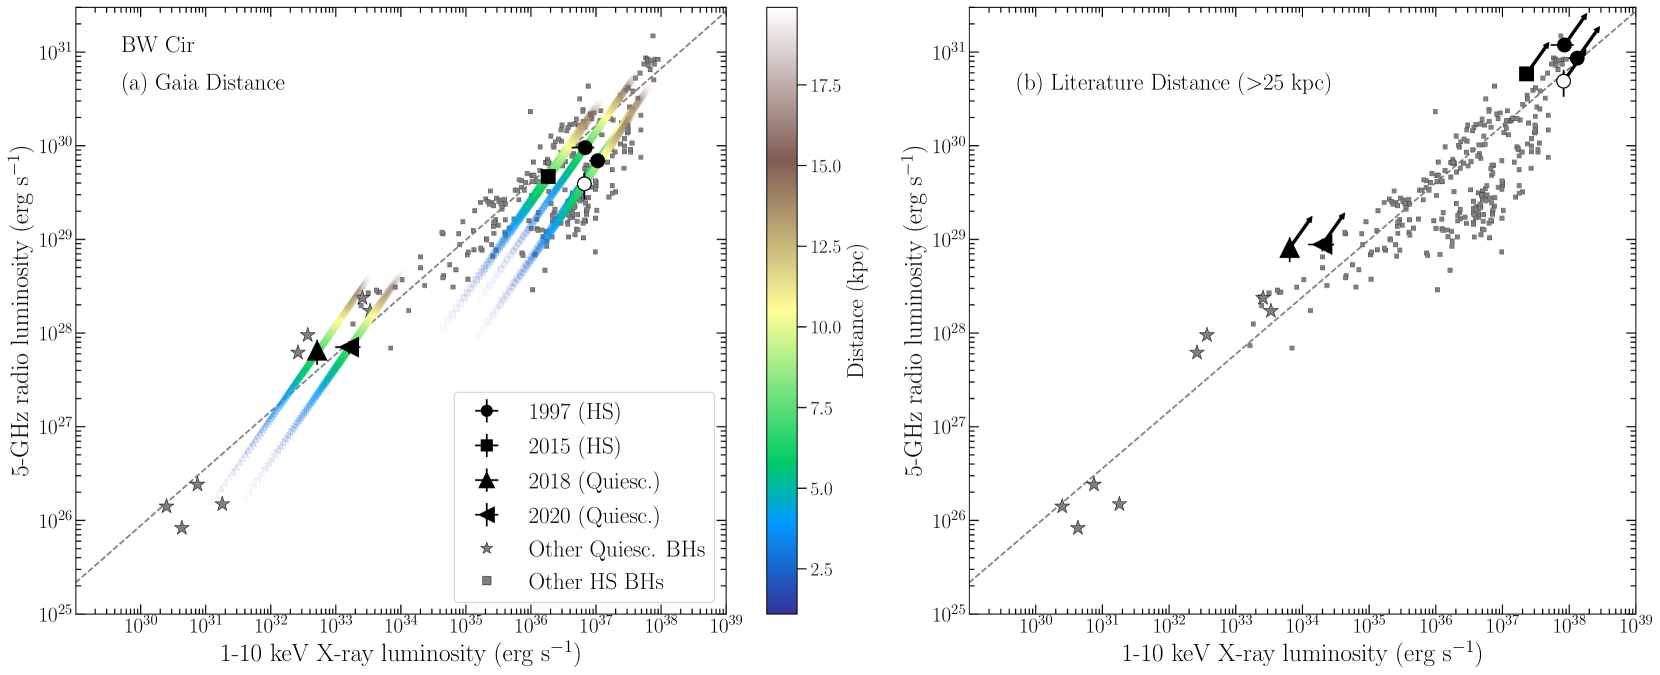
In Figure 3 we show where BW Cir would fall in the radio/X-ray luminosity plane if it is located at the distance(s) implied by the Gaia parallax (panel a) vs. the 25 kpc distance from C09 (panel b). All radio flux densities are converted from 7.25 to 5.0 GHz by assuming a flat radio spectrum (i.e., , where ). To supplement the two data points in quiescence from 2018 and 2020, we searched the literature for other quasi-simultaneous radio and X-ray observations when BW Cir was outbursting in the hard state. We found four additional data points for inclusion on the radio/X-ray plane, three from its 1997 outburst and one from its 2015 outburst.
During the 1997 outburst, during which BW Cir remained entirely in the hard state, Brocksopp et al. (2001) performed multiwavelength monitoring that included five radio observations with ATCA. Of those five ATCA observations, three were taken within 0.5 d of an X-ray constraint with the All Sky Monitor (ASM) on the Rossi X-ray Timing Explorer (RXTE). We extracted corresponding RXTE/ASM count rates from the daily average light curve online data products333http://xte.mit.edu and converted to 1-10 keV unabsorbed X-ray fluxes using the online version of the Portable, Interactive Multi-Mission Simulator444https://heasarc.gsfc.nasa.gov/cgi-bin/Tools/w3pimms/w3pimms.pl (WebPIMMS), assuming an absorbed power-law with cm-2 and . We thus include 5 GHz radio flux densities555Brocksopp et al. (2001) report radio flux densities measured in both the image plane and in the uv plane. We adopt the average of their ‘image’ and ‘uv’ flux densities at 4.8 GHz, and we convert to 5 GHz adopting radio spectral indices presented in their Table 6. and 1-10 keV X-ray fluxes on November 25, December 2, and December 19 of , , and mJy and , , and , respectively. The first epoch (November 25) was taken toward the end of the hard state rise, the second epoch (December 2) near the peak of the outburst, and the final epoch (December 19) toward the beginning of the descent back to quiescence.
During the 2015 outburst, we found one published radio observation (which was taken during the hard state rise; Coriat et al. 2015). ATCA observed on 2015 June 16 UT 06:30-09:30, from which we estimate mJy (extrapolated to 5 GHz from 5.5 and 9.0 GHz flux densities listed in Coriat et al. 2015, and their spectral index ). X-ray observations were taken by Swift on 2015 June 15 and June 17 (both taken with the XRT in window timing mode). We extracted spectra for these two observations using the online Swift/XRT data product generator (Evans et al., 2009), and we fit absorbed powerlaws to both spectra in XSPEC (using W-statistics). Unabsorbed model fluxes were calculated for each date and then averaged together to estimate on 2015 June 16.666The best-fit spectral parameters are consistent on each date. On 2015 June 15 (3600 counts) we find cm-2, , and erg s-1 cm-2. On 2015 June 17 (3000 counts) we find cm-2, , and erg s-1 cm-2.
4.2 GS 1124-684
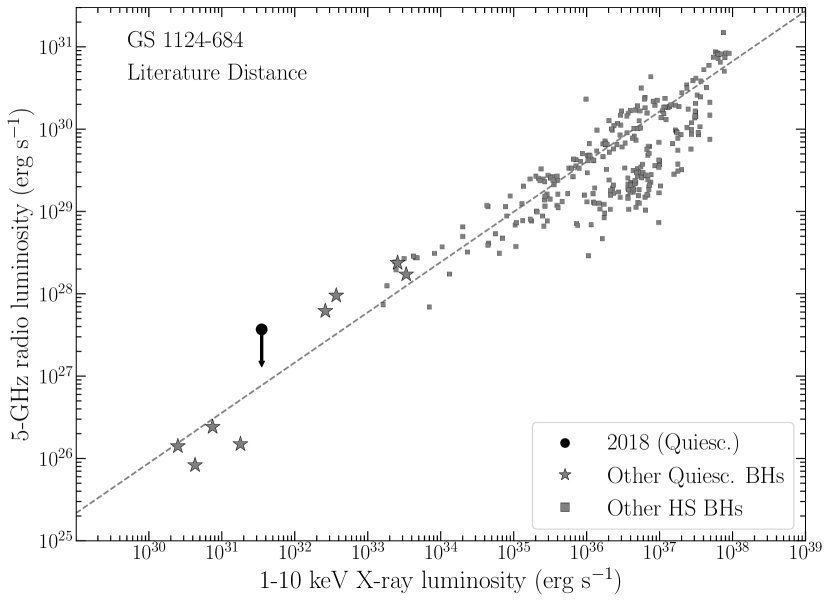
In Figure 4 we show limits for GS 1124-684 in the radio/X-ray luminosity plane. Since the radio non-detection is not meaningful at any distance implied by Gaia, we illustrate its location in Figure 4 by only using the more precise donor-star based distance from Wu et al. 2016. GS 1124-684 has only had one X-ray observation in quiescence, by XMM-Newton in 2001 (Sutaria et al., 2002). Since we did not coordinate X-ray observations with our 2018 ATCA observation, we use the 2001 X-ray information for placing GS 1124-684 on , despite the 17 year time difference. Using the best-fit spectral parameters ( cm-2; ) and absorbed X-ray flux ( from 0.3-12 keV) reported by Sutaria et al. (2002), who detect GS 1124-684 with 100 counts, we adopt an unabsorbed X-ray flux of (we ignore errors on flux measurements since uncertainties are dominated by non-simultaneity). Unfortunately, the new ATCA radio limit is not constraining in terms of the disk/jet coupling in GS 1124-684. Also, there are not any archival radio observations of GS 1124-684 in the hard state from its 1991 outburst (see §3.4 of Fender, 2001). Thus, we do not discuss GS 1124-684 further in this paper, other than to say our radio non-detection is consistent with expectations given the kpc distance from Wu et al. (2016).
5 Discussion
BW Cir now represents the sixth BHXB with a radio detection in quiescence (see the star symbols in Figure 3; note three systems appear twice in the Figure). The correct physical interpretation of BW Cir’s behaviour in depends on the correct distance, and from the radio/X-ray information alone we cannot make strong conclusions. So, in the following discussion we outline implications on the disk/jet coupling of BW Cir within different distance ranges. Although we discuss all possible distances for completeness, we stress that any distance kpc poses a severe challenge in that it would require a small donor mass (; see §2.1) since the mass decreases rapidly with distance (; assuming that the donor fills its Roche Lobe). Throughout, calculations on the ‘quiescent X-ray luminosity’ are derived from the minimum X-ray flux (1-10 keV) that we observed: erg s-1 cm-2 in 2018, which we note is similar to the flux obtained during a 2010 Chandra observation in quiescence ( from 1-10 keV; Reynolds & Miller 2011).
5.1 Scenario 1: kpc
All hard state and quiescent BHXBs were once thought to follow a correlation of the approximate form , which has colloquially been referred to as the ‘standard’ track in the radio/X-ray luminosity plane (e.g., Coriat et al., 2011; Gallo et al., 2014). However, it now appears that the majority of hard state BHXBs are in fact ‘radio-faint’, meaning that they emit less radio emission than expected in the hard state, at least when (e.g., Corbel et al., 2004; Cadolle Bel et al., 2007; Coriat et al., 2011; Meyer-Hofmeister & Meyer, 2014; Tomsick et al., 2015; Espinasse & Fender, 2018; Motta et al., 2018). All ‘radio-faint’ systems that have so far been monitored with sufficient radio sensitivities appear to start moving horizontally in the plane as decreases below . Those systems then eventually rejoin the ‘standard’ track around (Coriat et al., 2011; Plotkin et al., 2017).
If BW Cir were to reside very nearby at the smallest distances allowed by the Gaia parallax measurement ( kpc; a 4% chance from integrating the EDR3 posterior), then it would mark the only BHXB observed to continue down the ‘radio-faint’ track when . In this case though, it still does not appear that the ‘radio-faint’ track extends indefinitely into quiescence, as our quiescent radio detections lie above the extrapolation of the ‘radio-faint’ track at the lowest X-ray luminosities (unless the quiescent radio emission is dominated by the companion star; see Section 5.4). At this distance, the quiescent X-ray luminosity would be , which is lower than expected given the system’s orbital period. A small distance would then imply an accretion flow that is even more radiatively inefficient and underluminous than other quiescent systems. However, we can rule out this scenario because a distance 2 kpc would require an implausibly low-mass companion star ().
Extending the distance slightly upward to 2–5 kpc (18% chance) still requires an incredibly low-mass donor (), but it would yield X-ray luminosities consistent with expectations for the orbital period (; Reynolds & Miller 2011). In fact, this distance range provides the only scenario that would allow BW Cir to display what is currently viewed as ‘normal’ behaviour. For example, in quiescence it would fall on the ‘standard’ track to the lower-left of V404 Cygni, as expected given the 2.5 vs. 6.5 d orbital periods of BW Cir vs. V404 Cygni (Casares et al., 1992). BW Cir then affords an exciting laboratory for accretion flow and jet modeling, as it would be the first radio-detected quiescent BHXB to start filling in the (current) gap in between V404 Cygni (at ; Bernardini & Cackett 2014) and the other radio-detected quiescent BHXBs at (A062000, XTE J1118+480, and MWC 656; Gallo et al. 2006, 2014; Ribó et al. 2017; Dinçer et al. 2018).
Furthermore, at a distance between 2–5 kpc, BW Cir would be classified as a ‘radio-faint’ hard state BHXB during outburst, and it would mark the first quiescent radio detection of a (known) ‘radio-faint’ BHXB.777It is unknown if A062000 was ‘radio-faint’ during outburst. The combined quiescent radio and X-ray emission would then suggest that BW Cir transitioned back to the ‘standard’ radio/X-ray correlation as it moved from the hard state back to quiescence. Noting that all of our hard state data points in Figure 3 lie on the ‘radio-faint’ track, and two of our data points were taken during the outburst rise (one in 1997 and one in 2015), then this scenario would provide new empirical evidence that (at least some) ‘radio-faint’ BHXBs rise out of quiescence through the ‘radio-faint’ track (opposed to a ‘hysteresis’ effect where they could rise out of quiescence along the ‘standard’ track, and then fade back to quiescence along the ‘radio-faint’ track).
5.2 Scenario 2: kpc
If BW Cir were to fall at the higher end of the distance range allowed by Gaia, then it would still fall on the ‘standard’ track in quiescence. Note, the 1 Gaia distance range extends up to 12 kpc, but the posterior distribution allows distances up to 20 kpc or slightly higher (see Figure 1). There is a 76% chance that BW Cir falls between 5-20 kpc, (calculated by integrating the EDR3 posterior), and only a 2% chance the distance is 20 kpc. Portions of the 5-20 kpc distance range would place BW Cir within spiral arms of the Milky Way: the Scutum-Centaurus arm if kpc and the Sagittarius arm if kpc. Intriguingly, distances up to 15 kpc imply that the 1997 and 2015 data points during the outburst rise follow the ‘standard’ track, and the data points during the 1997 outburst peak and decay fall on the ‘radio-faint’ track. Such a scenario would imply that BHXBs can show a hysteresis between the hard state rise and the decay (e.g., Russell et al., 2007; Islam & Zdziarski, 2018).888At kpc, the switch between tracks would occur near , which is around the luminosity where the ‘standard’ and ‘radio-faint’ tracks start to join each other. A distance of 10–15 kpc would also start bringing the peak outburst luminosity in line with expectations (i.e., 10% of the Eddington luminosity, if one adopts a bolometric correction of 10); however, then the quiescent X-ray luminosity would be between and therefore above expectations from the quiescent relation.
If the distance is 15 kpc, then the source would always fall along the standard track, albeit at higher X-ray luminosities than expected given its orbital period (both in quiescence and at peak outburst). Nevertheless, there is not an obvious argument in terms of its radio/X-ray luminosity coupling to disfavour such a scenario. Note, distances between 16–20 kpc are formally consistent with both the Gaia posterior distribution and the donor mass-based distance (given uncertainties in the reddening toward BW Cir; Reynolds & Miller 2011).
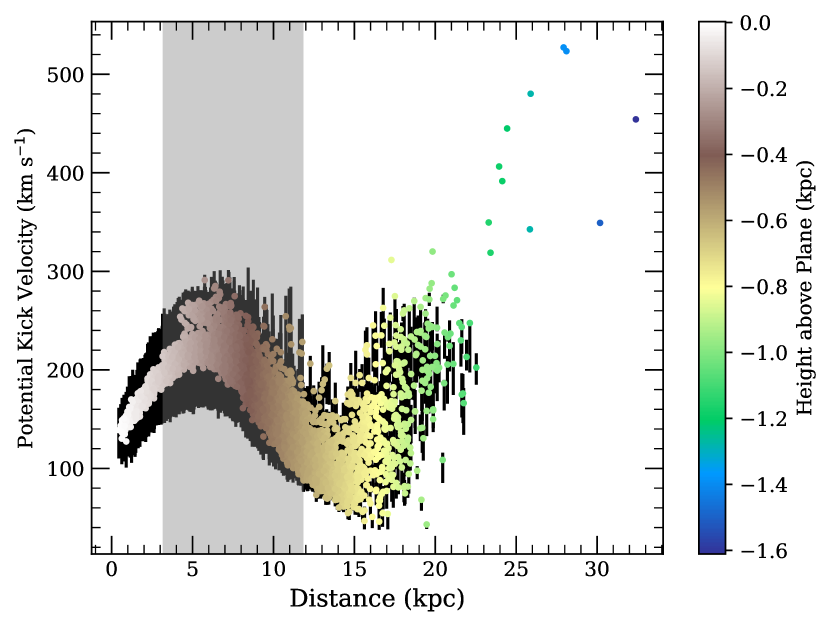
Based on the Gaia DR2 proper motion and parallax measurements, Gandhi et al. (2019) argued that distances kpc are unlikely because then BW Cir would start to have an excessively large space velocity. However, the systematically lower proper motion and parallax measurements in EDR3 (see Table 1) make distances even as large as 20 kpc more comfortable, as described below. We estimate the potential kick velocity (PKV) that the system would need for it to move with the measured proper motion and systemic radial velocity, assuming the system was born in the Galactic plane. We used the methodology developed by Atri et al. (2019) that uses Monte Carlo simulations to trace back the Galactocentric orbit of the source. We ran 5000 instances to estimate the distribution of the velocity of the system when it crosses the Galactic plane (i.e., at ). Figure 5 shows the PKV of BW Cir as a function of distance and height above the Galactic plane, where the distance is sampled from the distance posterior distribution using the EDR3 parallax, and the simulations are based on the Gaia EDR3 proper motions and a radial velocity of km s-1 (C04). Note, we adopt the PKV as a tracer of the motion of the source instead of peculiar velocity (i.e., the space velocity compared to the local standard of rest) because the local neighborhood of the source becomes poorly defined as the height from the Galactic plane increases.
The PKV distribution has a mode and 68% confidence interval of km s-1. More importantly, we note that the PKV of BW Cir stays within reasonable values of km s-1 out to 20 kpc (such velocities have been observed in other BHXBs; Atri et al. 2019). This then suggests that based on the EDR3 measurements, the PKV of BW Cir up to a distance of kpc is feasible. Excluding larger distances based on the space velocity only removes 2% of solutions formally allowed by the distance posterior from the EDR3 parallax measurement.
5.3 Scenario 3: kpc
If BW Cir is at 25 kpc (as implied by the properties of the donor star), then we reach similar conclusions as for distances 15–20 kpc in the previous subsection: BW Cir always falls along the ‘standard’ track of the radio/X-ray luminosity correlation, and it would be in an unusually luminous accretion state in quiescence (relative to its orbital period; Reynolds & Miller 2011). However, a distance 25 kpc represents only 1% of solutions allowed by the Gaia EDR3 distance posterior, and at these distances the space velocity may become unphysical if the system is bound to the Galaxy (Figure 5). Furthermore, kpc would place BW Cir at a higher elevation above the Galactic plane than expected for its orbital period (Gandhi et al., 2020). Note, if the X-ray luminosity reached by GX 3394 between outbursts is truly its lowest quiescent luminosity ( at 8 kpc; Tremou et al. 2020), then that source would also be in an elevated quiescent accretion state relative to its 42 h orbital period (Hynes et al., 2003; Heida et al., 2017), giving additional credence to the idea of an unexpectedly luminous quiescent accretion state for BW Cir.
5.4 On radio emission from the donor star
As detailed below, the only way that our quiescent BW Cir radio detection could originate from the donor star instead of a relativistic jet is if BW Cir happens to fall in the low-distance tail of the Gaia posterior distributions. Stellar coronal emission is usually gyrosynchrotron radiation, the luminosity of which is known to correlate with the X-ray luminosity of active stars (i.e., the Güdel-Benz relation; Güdel & Benz 1993; Benz & Güdel 1994). The most luminous radio/X-ray stars reach and (we converted luminosities on the Güdel-Benz relation to our 5 GHz and 1-10 keV bandpasses assuming a flat radio spectrum and an X-ray photon index of 2). These luminosity extremes are displayed by a combination of RS CVn and FK Comae systems. Some of these make decent comparisons to BW Cir, since RS CVn stars are binary systems where one of the components is a G-K giant/sub-giant. FK Comae stars are single stars, but with a similar spectral type (G-K giant/sub-giant) and rotation speed as the secondary in BW Cir: km s-1 for FK Comae stars (Bopp & Stencel, 1981) vs. km s-1 for BW Cir (C09).
Considering the above, and scaling from our 2018 observations of BW Cir (Jy and ), the most extreme stellar systems are consistent with the quiescent of BW Cir only out to 2.6 kpc.999The chance that we observed a radio flare is very low, especially since we measured similar radio flux densities on two different occasions. However, at that distance the observed radio emission from BW Cir would be 4 times larger than expected from the Güdel-Benz relation, and that is assuming that all of the X-ray emission is emitted by the donor star and not the accretion flow (which is extremely unlikely). Thus, 2.6 kpc is a generous upper limit on donor star radio emission. A more realistic estimate is obtained by considering that the average radio luminosity of radio-detected RS CVn systems (with periods similar to BW Cir) is (Drake et al., 1989), which would only be detectable out to 0.7 kpc.
6 Future work: toward reconciling the Gaia and Casares et al. distances
From the radio and X-ray properties alone, we cannot strongly favour or disfavour any particular distance. That said, given the system’s current mass function and donor spectral type (including the detection of ellipsoidal modulations implying a Roche-lobe fed system; \al@casares04, casares09; \al@casares04, casares09), it is extremely difficult to find a way to make the binary system fit at a distance 13 kpc. For a distance kpc to be correct, then the distance modulus must decrease by 1.4 to 5.5 mag (relative to the distance modulus of 17 mag calculated by C09). This requires a donor star luminosity 4–160 times smaller, and/or corrections to the optical apparent magnitude must be more extreme than currently accounted for (i.e., due to disk veiling, extinction, etc.).
While tweaks are possible to the donor star luminosity, it is difficult to imagine how the luminosity calculated by C09 could be off by upwards of two orders of magnitude. Simply requiring a lower-mass donor is not a good solution, since the mass function and value limit the donor mass to . We therefore only envision two areas of future investigation that might be worthwhile. The first would be to repeat the \al@casares04, casares09; \al@casares04, casares09 analyses in multiple filters (i.e., their distance modulus was estimated only in the Bessel filter), although we are doubtful that would provide a meaningful revision. The other area that might show more promise (but is out of the scope of this paper) would be to explore model atmospheres for G sub-giants in close binaries. Perhaps there is an additional opacity source or unusual stellar structure that could cause a lower luminosity (compared to the current estimate based on the Stefan-Boltzmann Law followed by bolometric and color corrections into the filter).
Regarding potential apparent magnitude corrections, significant adjustments to the disk veiling seem unlikely (see the discussion in G19). The largest source of uncertainty is probably in the reddening. The value adopted by C09 was based on the optical colors of BW Cir during its 1987 outburst (Kitamoto et al., 1990), and also from the equivalent widths of interstellar absorption lines (C04). As noted by Reynolds & Miller (2011), the interstellar absorption lines could imply as large as 1.4, which they discuss is also in line with expectations from the amount of X-ray absorption and would imply a distance 16 kpc. Increasing the reddening would then allow a narrow range of kpc where the Gaia EDR3 and C09 distances are consistent. Note, however, that Koljonen et al. (2016) place a more restrictive limit on . They suggest that the extinction coefficient cannot be larger then 3.5 mag (or equivalently ), or else the optical/ultraviolet spectral energy distribution would be unphysically steep. For (Schlegel et al., 1998), a reddening of 1.1 would only lower the distance modulus by 0.3 mag (i.e., kpc), which then excludes the possibility of reconciling C09 with current Gaia measurements.
Of course, an alternative solution is that the Gaia parallax is in error. Ultimately, direct verification is going to require a more precise parallax measurement, which might become available in future Gaia data releases, or, more likely, could be achieved in the radio waveband via very long baseline interferometry (VLBI). So far, four BHXBs have had parallaxes measured from radio VLBI observations (Miller-Jones et al., 2009; Reid et al., 2011, 2014; Atri et al., 2020). Unfortunately, the 20-25 Jy quiescent radio flux density of BW Cir precludes a VLBI radio parallax using current facilities in quiescence, and it is unclear if it would be in reach with future (near-term) facilities in the southern sky. Given that BW Cir reaches mJy flux levels during outbursts (Brocksopp et al., 2001; Coriat et al., 2015), a radio parallax could, however, be measured with current telescopes via appropriately timed (hard state) observations during a future outburst (e.g., Atri et al., 2019).
6.1 Source Confusion in Gaia?
In the near-term, we believe the most promising distance investigations should focus on if the Gaia astrometry is in error because of a faint interloper blending with the optical counterpart. Given that the Gaia source identification is very likely correct (G19), and quality flags for BW Cir in the Gaia database all suggest a high-quality detection of a single source, this idea is likely only plausible if the culprit source contributes 10-20% of the quiescent optical flux.101010The Gaia quality flags astrometric_gof_al = 1.8 and ruwe = 1.1 in EDR3, which should nominally be 3 and 1, respectively, for good astrometric fits using a single star model. See https://gea.esac.esa.int/archive/documentation/GEDR3/Gaia_archive/chap_datamodel/sec_dm_main_tables/ssec_dm_gaia_source.html Note, 10–20% optical flux contamination would not affect the C09 distance in any meaningful way. However, if an interloper were any brighter, then C09 would have very unlikely detected ellipsoidal modulations. For this to be a viable solution, the interloper should be closer than BW Cir to bias the astrometric motions to higher values. As described below, the probability is low but not negligible.
In EDR3, the completeness of resolved pairs of close stars drops rapidly for pair separations 0.7 arcec, and during source transits Gaia does not always resolve close pairs of stars with separations arcsec.111111https://gea.esac.esa.int/archive/documentation/GEDR3/index.html Thus, in the following we consider that an interloper could be aligned within 0.2–0.7 arcsec of the Gaia position for BW Cir, which corresponds to a solid angle of steradians. In a cone of that solid angle, the total volume is , where is the distance out to which the line of sight intercepts a scale height of the Galactic plane. For the line of sight toward BW Cir, this will be at about 2 kpc, giving a total volume of about 0.008-0.1 pc3. Taking the local space density of stars to be about 0.1 pc-3, this yields a 0.08-1% chance of the line of sight intercepting another star. While this is not particularly high, it could have happened with any of the X-ray binaries with Gaia parallax measurements, and hence there is a reasonable chance, 3–30%, that at least one X-ray binary will have an interloper.121212The 3–30% chance is according to a binomial probability distribution, assuming there are 40 neutron and black hole X-ray binaries with Gaia parallax measurements. Even just the 11 BHXBs with Gaia DR2 parallax measurements in G19 have a 1–10% chance of including at least one interloping source.
Furthermore, not included in the above estimate is that the outskirts of at least two nearby open star clusters cover the line of sight toward BW Cir: Platais 11 ( pc) and Platais 12 ( pc), also known as HIP 67330 and HIP 67740 (Platais et al., 1998). These clusters have projected radii of 1.5 and 1.0 deg, and BW Cir lies 1.7 and 1.5 deg from their centres, respectively. More generally, this area of the sky is also near the Sco OB2 association, making the probability of a foreground interloping source even higher.
It is worth reiterating our suspicions that the EDR3 astrometric measurements may be displaying systematic changes from DR2 (see §2.1). In particular, the distance posterior distribution is now unimodal instead of bimodal (Figure 1). Additionally, the DR2 proper motion ( km s-1, km s-1) was in the same range as the median proper motions of the stars in both Platais 11 ( km s-1, km s-1) and Platais 12 ( km s-1, km s-1). Such behaviour would be expected if the interloper is in one of these clusters, and if it happened to bias the astrometric solutions more in DR2 than in EDR3.
Naturally the obvious test is to continue to monitor the proper motion of BW Cir to see if it continues to decrease over time (which would allow for higher distances to BW Cir). In the meantime, evidence of an interloper might already be accessible via near-infrared (NIR) or infrared (IR) observations. If we assume that the interloper contributes 10% of the total flux measured by Gaia (), then the interloping star has . At the distance of Platais 11 and Platais 12, the interloper would have an absolute magnitude of and 15.2, respectively, making it an M or L type dwarf star or brown dwarf (see Figure 9 of Gaia Collaboration et al. 2018b). In the NIR, such a star would have an absolute magnitude in the filter from 10-12, or an apparent magnitude in Platais 11 or in Platais 12.
The NIR magnitude of the quiescent counterpart to BW Cir is unknown, except that it is not detected by the Two Micron All Sky Survey (2MASS; Skrutskie et al., 2006) such that . There is an IR counterpart in the catalog of ‘unblurred coadds of the WISE131313The Wide-field Infrared Survey Explorer (Wright et al., 2010). imaging database’ (unWISE; Lang 2014; Schlafly et al. 2019) that is 0.8 arcsec from the Gaia position. This IR source has flux densities in the W1 (effective wavelength m) and W2 (m) filters of and Jy, respectively. Upon visual inspection, the coadded unWISE images are of high quality without any obvious artifacts near the location of BW Cir. Furthermore, the WISE data were taken in 2010, when BW Cir was not in an outburst, such that 400 Jy appears to be the IR quiescent level. Thus, if we assume that the flux density is somewhere between the quiescent radio measurement (20Jy) and the quiescent IR measurement (400Jy), then BW Cir should have in quiescence (adopting a zero point of 666.8 Jy; Cohen et al., 2003). The BW Cir magnitude may then be comparable to the NIR magnitude of an interloping star if it resides in Platais 11 or Platais 12. Since one stands a better chance of spatially resolving an interloper star from BW Cir if the two sources have similar fluxes, the NIR (and possibly IR) offers a better opportunity than the optical. Such an experiment would be feasible at these magnitudes with, e.g., the Hubble Space Telescope or the James Webb Space Telescope. Or, if BW Cir and an interloper have magnitudes toward the brighter end of our estimated range, with, adaptive optics on ground-based telescopes (e.g., Gemini-South). In all cases, spatial resolutions arcsec are achievable.
7 Summary
Gaia motivated us to search for radio jets from two quiescent BHXBs with parallax measurements. One source, GS 1124-684, was not detected by ATCA. For the second source, BW Cir, a radio outflow was detected on two separate epochs. We also obtained quasi-simultaneous X-ray detections with Chandra and Swift, respectively, allowing us to place BW Cir on the radio/X-ray luminosity plane. After also considering archival radio and X-ray information during previous outbursts, we discuss implications for the disk/jet coupling of BW Cir depending on if the source is located 20 kpc away (as implied by the Gaia EDR3 parallax and proper motion measurements), or if it is 25 kpc away (based on the donor star). The phenomenological behaviour of BW Cir in the plane varies depending on the correct distance, ranging from BW Cir always being a ‘radio-faint’ BHXB in the hard state (if kpc), to BW Cir showing a hysteresis between being a ‘standard’ and ‘radio-faint’ BHXB during its hard state rise and decay (if kpc), to BW Cir always being a ‘standard’ track BHXB (if kpc).
At the moment, reconciling the low- and high-distances implied by Gaia vs. its donor star is a challenge. We find only a narrow distance range, kpc, that is (a) consistent with the Gaia measurements and the donor star (if one allows for slightly more interstellar reddening than assumed by C09), and that (b) also allows a reasonable donor mass and space velocity for the system. If BW Cir does not fall in this 16–20 kpc distance range, then potential solutions could be that BW Cir has an unusual atmospheric structure causing it to be less luminous than a typical G subgiant, or that the Gaia parallax and proper motions are in error possibly because of a faint interloper blending with the optical counterpart in Gaia. It may be possible to resolve such an interloper from BW Cir in the NIR or IR with ground-based adaptive optics and/or space-based imaging. Otherwise, given its faint radio flux density in quiescence, the best opportunity for a more precise parallax measurement will likely need to await VLBI observations during a future hard state outburst.
Acknowledgements
We thank the referee for helpful comments that improved this manuscript. We thank John Paice for collating measurements from the Gaia EDR3 archive. We are grateful to the Chandra X-ray Observatory and to the Neil Gehrels Swift Observatory for granting our requests for Director’s Discretionary Time. JCAM-J is the recipient of an Australian Research Council Future Fellowship (FT140101082), funded by the Australian government. PG thanks STFC for support. The Australia Telescope Compact Array is part of the Australia Telescope National Facility which is funded by the Australian Government for operation as a National Facility managed by CSIRO. We acknowledge the Gomeroi people as the traditional owners of the Observatory site. The scientific results reported in this article are based in part on observations made by the Chandra X-ray Observatory, and this research has made use of software provided by the Chandra X-ray Center (CXC) in the application package ciao. This work made use of data supplied by the UK Swift Science Data Centre at the University of Leicester. This research includes results provided by the ASM/RXTE teams at MIT and at the RXTE SOF and GOF at NASA’s GSFC This research has made use of data and software provided by the High Energy Astrophysics Science Archive Research Center (HEASARC), which is a service of the Astrophysics Science Division at NASA/GSFC. This work has made use of data from the European Space Agency (ESA) mission Gaia (https://www.cosmos.esa.int/gaia), processed by the Gaia Data Processing and Analysis Consortium (DPAC, https://www.cosmos.esa.int/web/gaia/dpac/consortium). Funding for the DPAC has been provided by national institutions, in particular the institutions participating in the Gaia Multilateral Agreement. This research made use of Astropy,141414http://www.astropy.org a community-developed core Python package for Astronomy (Astropy Collaboration et al., 2013, 2018).
Data availability
The data underlying this article were accessed from the Australia Telescope Online Archive (https://atoa.atnf.csiro.au), from the Chandra online archive (https://cda.harvard.edu/chaser/), and from the High Energy Astrophysics Science Archive Research Center (https://heasarc.gsfc.nasa.gov). The derived data generated in this research will be shared on reasonable request to the corresponding author.
References
- Agol & Kamionkowski (2002) Agol E., Kamionkowski M., 2002, MNRAS, 334, 553
- Astropy Collaboration et al. (2013) Astropy Collaboration et al., 2013, A&A, 558, A33
- Astropy Collaboration et al. (2018) Astropy Collaboration et al., 2018, AJ, 156, 123
- Atri et al. (2019) Atri P., et al., 2019, MNRAS, 489, 3116
- Atri et al. (2020) Atri P., et al., 2020, MNRAS, 493, L81
- Bahramian et al. (2018) Bahramian A., et al., 2018, Radio/X-ray correlation database for X-ray binaries, doi:10.5281/zenodo.1252036, https://doi.org/10.5281/zenodo.1252036
- Benz & Güdel (1994) Benz A. O., Güdel M., 1994, A&A, 285, 621
- Bernardini & Cackett (2014) Bernardini F., Cackett E. M., 2014, MNRAS, 439, 2771
- Blandford & Begelman (1999) Blandford R. D., Begelman M. C., 1999, MNRAS, 303, L1
- Blandford & Königl (1979) Blandford R. D., Königl A., 1979, ApJ, 232, 34
- Bopp & Stencel (1981) Bopp B. W., Stencel R. E., 1981, ApJ, 247, L131
- Brocksopp et al. (2001) Brocksopp C., Jonker P. G., Fender R. P., Groot P. J., van der Klis M., Tingay S. J., 2001, MNRAS, 323, 517
- Burrows et al. (2005) Burrows D. N., et al., 2005, Space Sci. Rev., 120, 165
- Cadolle Bel et al. (2007) Cadolle Bel M., et al., 2007, ApJ, 659, 549
- Casares (2018) Casares J., 2018, MNRAS, 473, 5195
- Casares et al. (1992) Casares J., Charles P. A., Naylor T., 1992, Nature, 355, 614
- Casares et al. (2004) Casares J., Zurita C., Shahbaz T., Charles P. A., Fender R. P., 2004, ApJ, 613, L133 (C04)
- Casares et al. (2009) Casares J., et al., 2009, ApJS, 181, 238 (C09)
- Cash (1979) Cash W., 1979, ApJ, 228, 939
- Chomiuk et al. (2013) Chomiuk L., Strader J., Maccarone T. J., Miller-Jones J. C. A., Heinke C., Noyola E., Seth A. C., Ransom S., 2013, ApJ, 777, 69
- Cohen et al. (2003) Cohen M., Wheaton W. A., Megeath S. T., 2003, AJ, 126, 1090
- Connors et al. (2017) Connors R. M. T., et al., 2017, MNRAS, 466, 4121
- Corbel & Fender (2002) Corbel S., Fender R. P., 2002, ApJ, 573, L35
- Corbel et al. (2004) Corbel S., Fender R. P., Tomsick J. A., Tzioumis A. K., Tingay S., 2004, ApJ, 617, 1272
- Corbel et al. (2006) Corbel S., Tomsick J. A., Kaaret P., 2006, ApJ, 636, 971
- Corbel et al. (2008) Corbel S., Koerding E., Kaaret P., 2008, MNRAS, 389, 1697
- Corbel et al. (2013) Corbel S., Coriat M., Brocksopp C., Tzioumis A. K., Fender R. P., Tomsick J. A., Buxton M. M., Bailyn C. D., 2013, MNRAS, 428, 2500
- Coriat et al. (2011) Coriat M., et al., 2011, MNRAS, 414, 677
- Coriat et al. (2015) Coriat M., Tzioumis T., Corbel S., Fender R., Miller-Jones J., 2015, The Astronomer’s Telegram, 7656, 1
- Corral-Santana et al. (2016) Corral-Santana J. M., Casares J., Muñoz-Darias T., Bauer F. E., Martínez-Pais I. G., Russell D. M., 2016, A&A, 587, A61
- Dinçer et al. (2018) Dinçer T., Bailyn C. D., Miller-Jones J. C. A., Buxton M., MacDonald R. K. D., 2018, ApJ, 852, 4
- Drake et al. (1989) Drake S. A., Simon T., Linsky J. L., 1989, ApJS, 71, 905
- Dzib et al. (2015) Dzib S. A., Massi M., Jaron F., 2015, A&A, 580, L6
- Esin et al. (1997) Esin A. A., McClintock J. E., Narayan R., 1997, ApJ, 489, 865
- Espinasse & Fender (2018) Espinasse M., Fender R., 2018, MNRAS, 473, 4122
- Evans et al. (2009) Evans P. A., et al., 2009, MNRAS, 397, 1177
- Fender (2001) Fender R. P., 2001, MNRAS, 322, 31
- Fruscione et al. (2006) Fruscione A., et al., 2006, in Society of Photo-Optical Instrumentation Engineers (SPIE) Conference Series. p. 62701V, doi:10.1117/12.671760
- Gaia Collaboration et al. (2016) Gaia Collaboration et al., 2016, A&A, 595, A1
- Gaia Collaboration et al. (2018a) Gaia Collaboration et al., 2018a, A&A, 616, A1
- Gaia Collaboration et al. (2018b) Gaia Collaboration et al., 2018b, A&A, 616, A10
- Gaia Collaboration et al. (2020) Gaia Collaboration Brown A. G. A., Vallenari A., Prusti T., de Bruijne J. H. J., Babusiaux C., Biermann M., 2020, arXiv e-prints, p. arXiv:2012.01533
- Gallo et al. (2005) Gallo E., Fender R. P., Hynes R. I., 2005, MNRAS, 356, 1017
- Gallo et al. (2006) Gallo E., Fender R. P., Miller-Jones J. C. A., Merloni A., Jonker P. G., Heinz S., Maccarone T. J., van der Klis M., 2006, MNRAS, 370, 1351
- Gallo et al. (2014) Gallo E., et al., 2014, MNRAS, 445, 290
- Gallo et al. (2018) Gallo E., Degenaar N., van den Eijnden J., 2018, MNRAS, 478, L132
- Gallo et al. (2019) Gallo E., et al., 2019, MNRAS, 488, 191
- Gandhi et al. (2019) Gandhi P., Rao A., Johnson M. A. C., Paice J. A., Maccarone T. J., 2019, MNRAS, 485, 2642 (G19)
- Gandhi et al. (2020) Gandhi P., Rao A., Charles P. A., Belczynski K., Maccarone T. J., Arur K., Corral-Santana J. M., 2020, MNRAS, 496, L22
- Garmire et al. (2003) Garmire G. P., Bautz M. W., Ford P. G., Nousek J. A., Ricker George R. J., 2003, in Truemper J. E., Tananbaum H. D., eds, Society of Photo-Optical Instrumentation Engineers (SPIE) Conference Series Vol. 4851, X-Ray and Gamma-Ray Telescopes and Instruments for Astronomy.. pp 28–44, doi:10.1117/12.461599
- Grimm et al. (2002) Grimm H. J., Gilfanov M., Sunyaev R., 2002, A&A, 391, 923
- Güdel & Benz (1993) Güdel M., Benz A. O., 1993, ApJ, 405, L63
- Heida et al. (2017) Heida M., Jonker P. G., Torres M. A. P., Chiavassa A., 2017, ApJ, 846, 132
- Hynes et al. (2003) Hynes R. I., Steeghs D., Casares J., Charles P. A., O’Brien K., 2003, ApJ, 583, L95
- Hynes et al. (2009) Hynes R. I., Bradley C. K., Rupen M., Gallo E., Fender R. P., Casares J., Zurita C., 2009, MNRAS, 399, 2239
- Ichimaru (1977) Ichimaru S., 1977, ApJ, 214, 840
- Islam & Zdziarski (2018) Islam N., Zdziarski A. A., 2018, MNRAS, 481, 4513
- Jonker & Nelemans (2004) Jonker P. G., Nelemans G., 2004, MNRAS, 354, 355
- Jonker et al. (2014) Jonker P. G., et al., 2014, ApJS, 210, 18
- Kitamoto et al. (1990) Kitamoto S., Tsunemi H., Pedersen H., Ilovaisky S. A., van der Klis M., 1990, ApJ, 361, 590
- Koljonen et al. (2016) Koljonen K. I. I., Russell D. M., Corral-Santana J. M., Armas Padilla M., Muñoz-Darias T., Lewis F., Coriat M., Bauer F. E., 2016, MNRAS, 460, 942
- Lang (2014) Lang D., 2014, AJ, 147, 108
- Lindegren et al. (2020) Lindegren L., et al., 2020, arXiv e-prints, p. arXiv:2012.01742
- Lund et al. (1991) Lund N., Brandt S., Makino F., McNaught R. H., Jones A., West R. M., 1991, IAU Circ., 5161, 1
- Luri et al. (2018) Luri X., et al., 2018, A&A, 616, A9
- Maccarone (2005) Maccarone T. J., 2005, MNRAS, 360, L30
- Makino (1987) Makino F., 1987, IAU Circ., 4342, 1
- Malzac (2014) Malzac J., 2014, MNRAS, 443, 299
- Markoff et al. (2015) Markoff S., et al., 2015, ApJ, 812, L25
- McClintock et al. (2003) McClintock J. E., Narayan R., Garcia M. R., Orosz J. A., Remillard R. A., Murray S. S., 2003, ApJ, 593, 435
- McMullin et al. (2007) McMullin J. P., Waters B., Schiebel D., Young W., Golap K., 2007, in Shaw R. A., Hill F., Bell D. J., eds, Astronomical Society of the Pacific Conference Series Vol. 376, Astronomical Data Analysis Software and Systems XVI. p. 127
- Meyer-Hofmeister & Meyer (2014) Meyer-Hofmeister E., Meyer F., 2014, A&A, 562, A142
- Miller-Jones et al. (2008) Miller-Jones J. C. A., Gallo E., Rupen M. P., Mioduszewski A. J., Brisken W., Fender R. P., Jonker P. G., Maccarone T. J., 2008, MNRAS, 388, 1751
- Miller-Jones et al. (2009) Miller-Jones J. C. A., Jonker P. G., Dhawan V., Brisken W., Rupen M. P., Nelemans G., Gallo E., 2009, ApJ, 706, L230
- Miller-Jones et al. (2011) Miller-Jones J. C. A., Jonker P. G., Maccarone T. J., Nelemans G., Calvelo D. E., 2011, ApJ, 739, L18
- Miller-Jones et al. (2015) Miller-Jones J. C. A., et al., 2015, MNRAS, 453, 3918
- Miller et al. (2015) Miller J. M., Reynolds M. T., Kennea J., 2015, The Astronomer’s Telegram, 7612, 1
- Mościbrodzka (2019) Mościbrodzka M., 2019, MNRAS, 490, 5353
- Motta et al. (2018) Motta S. E., Casella P., Fender R. P., 2018, MNRAS, 478, 5159
- Narayan & McClintock (2005) Narayan R., McClintock J. E., 2005, ApJ, 623, 1017
- Narayan & Yi (1994) Narayan R., Yi I., 1994, ApJ, 428, L13
- Narayan & Yi (1995a) Narayan R., Yi I., 1995a, ApJ, 444, 231
- Narayan & Yi (1995b) Narayan R., Yi I., 1995b, ApJ, 452, 710
- Platais et al. (1998) Platais I., Kozhurina-Platais V., van Leeuwen F., 1998, AJ, 116, 2423
- Plotkin et al. (2013) Plotkin R. M., Gallo E., Jonker P. G., 2013, ApJ, 773, 59
- Plotkin et al. (2015) Plotkin R. M., Gallo E., Markoff S., Homan J., Jonker P. G., Miller-Jones J. C. A., Russell D. M., Drappeau S., 2015, MNRAS, 446, 4098
- Plotkin et al. (2017) Plotkin R. M., et al., 2017, ApJ, 848, 92
- Plotkin et al. (2019) Plotkin R. M., Miller-Jones J. C. A., Chomiuk L., Strader J., Bruzewski S., Bundas A., Smith K. R., Ruan J. J., 2019, ApJ, 874, 13
- Rana et al. (2016) Rana V., et al., 2016, ApJ, 821, 103
- Reid et al. (2011) Reid M. J., McClintock J. E., Narayan R., Gou L., Remillard R. A., Orosz J. A., 2011, ApJ, 742, 83
- Reid et al. (2014) Reid M. J., McClintock J. E., Steiner J. F., Steeghs D., Remillard R. A., Dhawan V., Narayan R., 2014, ApJ, 796, 2
- Remillard & McClintock (2006) Remillard R. A., McClintock J. E., 2006, ARA&A, 44, 49
- Remillard et al. (1997) Remillard R., Marshall F., Takeshima T., 1997, IAU Circ., 6772, 1
- Reynolds & Miller (2011) Reynolds M. T., Miller J. M., 2011, ApJ, 734, L17
- Ribó et al. (2017) Ribó M., et al., 2017, ApJ, 835, L33
- Rodriguez et al. (2020) Rodriguez J., et al., 2020, ApJ, 889, 58
- Russell et al. (2007) Russell D. M., Maccarone T. J., Körding E. G., Homan J., 2007, MNRAS, 379, 1401
- Sault et al. (1995) Sault R. J., Teuben P. J., Wright M. C. H., 1995, in Shaw R. A., Payne H. E., Hayes J. J. E., eds, Astronomical Society of the Pacific Conference Series Vol. 77, Astronomical Data Analysis Software and Systems IV. p. 433 (arXiv:astro-ph/0612759)
- Schlafly et al. (2019) Schlafly E. F., Meisner A. M., Green G. M., 2019, ApJS, 240, 30
- Schlegel et al. (1998) Schlegel D. J., Finkbeiner D. P., Davis M., 1998, ApJ, 500, 525
- Shishkovsky et al. (2018) Shishkovsky L., et al., 2018, ApJ, 855, 55
- Skrutskie et al. (2006) Skrutskie M. F., et al., 2006, AJ, 131, 1163
- Strader et al. (2012) Strader J., Chomiuk L., Maccarone T. J., Miller-Jones J. C. A., Seth A. C., 2012, Nature, 490, 71
- Sutaria et al. (2002) Sutaria F. K., et al., 2002, A&A, 391, 993
- Tetarenko et al. (2016) Tetarenko B. E., Sivakoff G. R., Heinke C. O., Gladstone J. C., 2016, ApJS, 222, 15
- Tomsick et al. (2015) Tomsick J. A., et al., 2015, ApJ, 808, 85
- Tremou et al. (2020) Tremou E., et al., 2020, MNRAS, 493, L132
- Wilms et al. (2000) Wilms J., Allen A., McCray R., 2000, ApJ, 542, 914
- Wright et al. (2010) Wright E. L., et al., 2010, AJ, 140, 1868
- Wu et al. (2015) Wu J., et al., 2015, ApJ, 806, 92
- Wu et al. (2016) Wu J., Orosz J. A., McClintock J. E., Hasan I., Bailyn C. D., Gou L., Chen Z., 2016, ApJ, 825, 46
- Yuan & Cui (2005) Yuan F., Cui W., 2005, ApJ, 629, 408
- Yuan & Narayan (2014) Yuan F., Narayan R., 2014, ARA&A, 52, 529
- Zhao et al. (2020) Zhao Y., et al., 2020, MNRAS, 493, 6033
- della Valle et al. (1991) della Valle M., Jarvis B. J., West R. M., 1991, Nature, 353, 50