Actinide crystallization and fission reactions in cooling white dwarf stars
Abstract
The first solids that form as a cooling white dwarf (WD) starts to crystallize are expected to be greatly enriched in actinides. This is because the melting points of WD matter scale as and actinides have the largest charge . We estimate that the solids may be so enriched in actinides that they could support a fission chain reaction. This reaction could ignite carbon burning and lead to the explosion of an isolated WD in a thermonuclear supernova (SN Ia). Our mechanism could potentially explain SN Ia with sub-Chandrasekhar ejecta masses and short delay times.
Phase separation and crystallization can play important roles during the cooling of white dwarf (WD) stars. The Gaia space observatory has determined parallax distances to large numbers of galactic stars Gaia Collaboration (2018), which allow for unprecedented modeling of WD and their evolution. Core crystallization, long predicted, is now resolved van Horn (1968); Tremblay et al. (2019). Phase separation or sedimentation of the neutron rich isotope 22Ne, in a C/O WD, could release significant gravitational energy and delay cooling Bildsten and Hall (2001); Hughto et al. (2010); Blouin et al. (2020); Camisassa et al. (2020); Cheng et al. (2019); Bauer et al. (2020).
Our recent molecular dynamics (MD) simulations find that Ne has a charge that is too close to the charges of C and O for large scale phase separation upon crystallization Caplan et al. (2020). However, impurities with significantly larger charges will likely phase separate. Material at WD densities is ionized and crystallizes to form a coulomb solid where the melting temperature scales with . Pure uranium () has a melting temperature 95 times higher than the melting temperature of C, and will phase separate upon crystallization. When a WD starts to crystallize, the first solids will be very strongly enriched in actinides, because they have the highest . This should be true even if the initial actinide abundance is very low.
These first solids could be so enriched that they support a fission chain reaction. For example, very high grade uranium ore deposits in Gabon, Africa became natural fission reactors 2.0 Gy ago Gauthier-Lafaye et al. (1996). At that time, the ore had a 235U enrichment fraction of (compared to 238U, today ). This allowed the naturally deposited ore to become critical, as first suggested by Kuroda in 1956 Kuroda (1956).
A fission chain reaction in a crystallizing WD could possibly ignite carbon burning and produce a thermonuclear supernova (SN Ia). These stellar explosions are important distance indicators in cosmology Abbott et al. (2019); Howell (2011); Sullivan (2010) and the 2011 Nobel Prize in Physics was awarded for using SN Ia to discover the accelerating Universe and dark energy Perlmutter et al. (2011). The exact SN Ia explosion mechanism is poorly understood but is thought to involve a WD interacting with a binary companion that is itself either a WD or a conventional star Wang and Han (2012); Hillebrandt et al. (2013); Ruiz-Lapuente (2014). Here we propose a completely new mechanism that involves using a fission chain reaction to ignite carbon burning in an isolated WD.
A WD first crystallizes in its high density center. Here the density could be of order g/cm3. If an appropriate fuel mixture can crystallize, its critical mass may be very small. The critical mass scales with , and the neutron mean free path scales with so that . The critical mass could be as small as g at WD densities. Matter in a WD is very degenerate. Therefore a fission reaction, if started, would likely be unstable. Because of the degeneracy, a large increase in temperature need not increase the pressure very much or significantly reduce the density. Under these conditions a fission reaction could increase the temperature enough for carbon ignition.
In this paper we discuss some of the issues necessary to determine if a chain reaction is possible. We start by calculating phase separation of actinides upon crystallization. We also determine the concentration of a number of impurities that may be present. These could absorb neutrons and prevent a chain reaction. We make a simple estimate of the neutron multiplication factor and the minimum 235U enrichment that is necessary for criticality. Next, we discuss the growth of a uranium rich crystal to a critical mass and the initiation of a fission chain reaction by a neutron from spontaneous fission. Finally, we explore if this fission reaction can ignite carbon burning and possibly lead to a thermonuclear supernova. We close with a very preliminary comparison of our fission mechanism with some SN Ia observations.
Phase separation: Consider a C/O WD made of an approximately 50/50 mixture of C and O with a very small amount of U with a mass fraction of order . Although there has been some work on phase separation for high elements in neutron stars, see for example Mckinven et al. (2016), we are not aware of applications to atomic numbers as high as 92. As a first approximation, we simplify this three component C/O/U system by replacing the C/O mixture with a single component of average charge . This should be a reasonable approximation given the similar charges of the C and O and the very large difference in charge with U. Note that when a C/O mixture freezes, the solid is somewhat enriched in O Horowitz et al. (2010). However this is a small effect.
We construct an approximate phase diagram for the two component N/U system. We employ the formalism of Medin and Cumming that assumes the free energy of the system follows from linear mixing rules plus small corrections Medin and Cumming (2010). We caution that the Medin and Cumming free energy fits may have larger errors for the very large ratio of charges 92/7 that we consider. Thus our phase diagram may be somewhat preliminary.
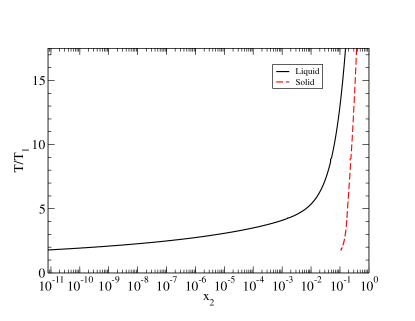
Figure 3 shows our phase diagram. The system starts in the liquid phase with a very small U number fraction of order . The melting temperature of pure U is . However, the very large entropy of mixing keeps the tiny U fraction dissolved in the liquid until much lower temperatures. Finally, at the large lattice energy overcomes the entropy of mixing and the U precipitates out to form a solid that is greatly enriched in U. The original U number fraction is somewhat uncertain. Actinide boost stars, that are relatively enriched in actinides, have now been observed Holmbeck et al. (2018). However, this may not be so important. We emphasize that the solid in Fig. 3 is greatly enriched in U even if the initial is very small.
We now consider a range of additional impurities that might absorb . The solar abundance of Pb is 100 times that of the actinides. The charge of Pb is close enough to that of U so that some Pb will likely be present in the actinide rich solid.
To explore impurity concentrations, we construct a multicomponent phase diagram. We assume a linear mixing rule for the free energies of multicomponent systems. This corresponds to the formalism of Medin and Cumming with the further approximation that the term describing corrections to linear mixing is set to zero. This approximation has minimal effect on the two component phase diagram in Fig. 3.
The abundance, by number, of species i in the liquid is related to the abundance in the solid by Medin and Cumming (2010),
| (1) |
Here is the atomic number of species , and . The difference in free energy of the liquid and solid phases of a one component plasma is . We use the expression in Eq. 9 of Medin and Cumming for Medin and Cumming (2010). However, we caution that this involves poorly known free energies for very super cooled liquids and super heated solids. The free energy difference is for a coulomb parameter that describes the ratio of coulomb to thermal energies. The coulomb parameter for species is related to of species one by and each is proportional to one over the temperature. We adjust the temperature until .
We start with the solar abundances (at early times) from ref. Lodders (2019) and assume that all of the original C, N, and O has been converted into 22Ne. We also assume all of the elements with Z=1-5 are converted into equal numbers of 12C and 16O. This gives the liquid phase abundances shown in Fig. 5 along with solid abundances from Eq. 1. These abundances are tabulated in the supplemental material sup .
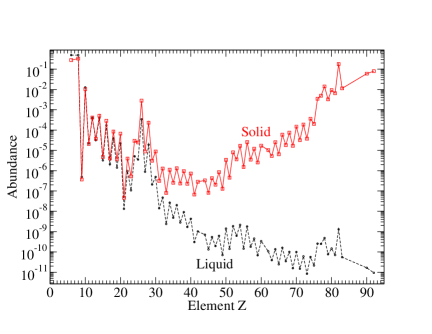
To refine these compositions and check the linear mixing approximation, we have performed molecular dynamics (MD) simulations as shown in the supplemental materials sup . These find that the abundance of C+O in the solid could be less than or of order 40%. As a result we assume the solid has the composition given in Tab. 4 which is 40% C+O and 60% Pb+Th+U where the relative concentrations of Pb, Th, and U are taken from the results of Eq. 1.
| C | O | Pb | Th | U |
| 0.20 | 0.20 | 0.32 | 0.12 | 0.16 |
Criticality: For the composition in Tab. 4, we calculate the multiplication factor which is equal to the number of fissions in one generation over the fissions in the proceeding generation,
| (2) |
Here is the fission cross section for 235U and is the sum of and for the reaction. Likewise U) and Th) are the cross sections for 238U and 232Th. Finally is the number of emitted per fission and is the number density of Th over the number density of U. We assume from Tab. 4.
We start by evaluating all cross sections at a single energy . We use the ENDF data set from Dec. 2011 that is available from the National Nuclear Data Center NND . In Tab. 5 we present the minimum 235U enrichment so that . In general this enrichment increases slightly as decreases.
| (MeV) | 1.0 | 0.5 | 0.25 | 0.125 | 0.1 | 0.05 |
|---|---|---|---|---|---|---|
| 0.12 | 0.14 | 0.14 | 0.16 | 0.18 | 0.26 |
Neutrons will lose energy scattering from C and O. After collisions the initial energy will be reduced to . Here for a nucleus of mass number and we have taken the average of C and O Lamarsh (1977). The number of collisions before a is absorbed depends on scattering and absorption cross sections and the ratio of the number densities of C+O to U. We estimate , although this number will be smaller if the crystal contains less C and O than assumed in Tab. 4. If MeV (the average energy of the initial fission spectrum is 2 MeV) than MeV and Tab. 5 suggests the system will be critical for . We emphasize that this is a first estimate, that also depends on uncertain compositions, and should be verified in future work. Note that we have neglected absorption on Pb. There are some resonances in Pb isotopes with energies below 0.5 MeV that will absorb a few . This should also be studied further.
Delay time: Before the actinides can crystallize, there will be a total delay time consisting of the main sequence lifetime of the original star plus the cooling time of the WD. During this time 235U and 238U will decay with half lives of 0.7 and 4.5 Gy respectively. For low mass WD this delay time can be very long and the remaining 235U fraction will be low. Therefore, we focus on WD with masses above . These stars have much shorter delay times. For example a WD will start to crystalize after cooling for about 1 Gy Bauer et al. (2020). According to Fig. 3, the U precipitates out at a temperature of about 1.8 times the melting temperature of the background, thus requiring much less than 1 Gy of cooling time. From the initial-final mass function, a WD formed from main sequence star of perhaps with a main sequence lifetime of less than 0.2 Gy Cummings et al. (2018). Therefore, the total delay time can be significantly less than 1 Gy for a massive WD.
We don’t know the original enrichment (isotopic fraction) of 235U, . This could depend on the time between nucleosynthesis events and star formation. As an example, we assume . This is the early solar system value, i.e. when the solar system formed so that radioactive decay leads to the present day value (4.6 Gy)=0.007 Lodders (2019). Given , Gy. Therefore, if is needed for the system to be critical, the delay time will need to be less than 0.7 Gy. We show in Tab. 3 and this can be compared to the necessary critical values in Tab. 5 to determine the maximum allowed delay time.
| (Gy) | 0 | 0.2 | 0.4 | 0.6 | 0.8 | 1.0 |
|---|---|---|---|---|---|---|
| 0.250 | 0.220 | 0.193 | 0.168 | 0.146 | 0.126 |
Critical mass assembly and fission ignition: It is natural to think that as the crystal approaches the critical mass there will be a steady increase in fission heating, which could burn off the U fuel or melt the crystal. We show below that this is not the case, and that diffusion-driven growth of the crystal proceeds very rapidly and grows well in excess of a critical mass before a initiates a chain reaction.
The solid can grow as U diffuses to a small seed crystal. Consider a spherical volume of liquid that contains (in very diluted form) one critical mass g of U. This will have a total mass g, given that the mass fraction of U is . At a density g/cm3, the sphere has a radius cm. For the crystal to grow to , U will need to diffuse over this distance which takes a time . Here is the diffusion constant for trace amounts of U in a C/O liquid. At a temperature keV we evaluate from Eqs. 8 and 11 of ref. Bauer et al. (2020) to be cm2/s giving s.
Cooper and Bildsten explore nucleation of seed crystals in the one component plasma Cooper and Bildsten (2008). Nucleation in our low heavy element concentration system should be studied further. In addition to diffuse growth of a single crystal, multiple small crystals could assemble. This may somewhat change our estimate for . However as we discuss below, is fully six orders of magnitude shorter than the time for a neutron from spontaneous fission to initiate a chain reaction. Therefore, we do not expect the assembly of multiple crystals to change our main results.
We compare to the time for emission that might start (or perhaps prematurely start) a chain reaction. The background is very likely dominated by local sources because the system is self shielding. The density is so high that can’t diffuse in from the outside. The local background is probably from spontaneous fission of 238U with a partial half-life of y. Alpha decay followed by 13C or 22Ne is not a problem because the will quickly thermalize in the ionized plasma and then the thermal rate is very low. Spontanious fission of transuranic elements could possibly contribute. However, a relatively long half-life and high initial abundance might be needed to survive the delay time. The total spontaneous fission rate of 238U in g is only per year. Thus the time for a single emitted is of order a year. We emphasize that this time y is dramatically longer than the time s for the crystal to grow to a critical mass. We conclude that the crystal will very likely grow much larger than a critical mass before any fissions occur.
We assume that the crystal will continue to grow until the diffusion time is equal to the time for one spontaneous fission to occur in the crystal. This yields a crystal mass of mg after a time of h. This mass is highly supercritical, .
When a chain reaction is finally initiated, the reaction will progress extremely rapidly and release a total energy,
| (3) |
Here is the number of U ions in and is the fraction of the ions that fission. We expect to be high because the system is highly supercritical (and thus will remain critical even if partially disassembled by the explosion). Furthermore the system is degenerate so the temperature can rise significantly before the pressure greatly increases. This will delay the disassembly of the system.
The large energy release will greatly increase the temperature. As long as the electrons are degenerate, the heat capacity will be dominated by the ions . Here is the number density of Pb over the number density of U etc. Using the composition from Tab. 4 yields and a final temperature MeV. In reality the electron Fermi energy is only MeV. We conclude the final temperature will be larger than, or of order, the electron Fermi energy k. Note that some heat will be lost via conduction because the thermal conductivity of the degenerate electrons is large, see for example Shternin and Yakovlev (2006). However the fission chain reaction will proceed very rapidly with an exponentially rising energy production rate. This large rate could limit the time for heat conduction.
Carbon ignition: Timmes and Woosley have explored the conditions necessary to ignite C burning via a deflagration Timmes and Woosley (1992). According to their Fig. 6, a trigger mass of mg needs to be heated above K for carbon ignition. Our temperature K meets this condition. After carbon ignition, the deflagration could possibly turn into a detonation Poludnenko et al. (2019). We conclude, it is plausible that a fission chain reaction could ignite a thermonuclear supernova (SN).
We emphasize that this conclusion needs to be verified with detailed astrophysical simulations. These simulations can explore many open issues including the important role of heat conduction losses. In addition, future molecular dynamics simulations can improve our knowledge of the phase diagram and the amount of C and O in the crystal (which is presently uncertain). This is important for the neutron spectrum which also impacts the fission reaction time scale and the time for heat conduction losses.
SN Ia: A fission chain reaction initiating a SN provides a new mechanism that could explain a subset of the observed SN Ia. Our mechanism could work for a single isolated WD and does not require either a main sequence or a degenerate companion. Mannucci et al. argue for a bimodal delay time distribution for observed SN Ia with about 50% ‘prompt’ SNe Ia with short delay times of order y and the remaining 50% ‘tardy’ SNe Ia with a much broader delay time distribution Mannucci et al. (2006); Matteucci et al. (2006), however see Section 3.5 of Maoz et al. (2014). Our mechanism could explain a fraction of SN with relatively short delay times. We assume SN with delay times longer than the half-life of 235U come from a more conventional mechanism involving one or two WDs in a binary system (Wang and Han (2012); Hillebrandt et al. (2013); Ruiz-Lapuente (2014)).
Conclusions: The first solids that form as a white dwarf (WD) starts to crystallize are greatly enriched in actinides because of their large charges. We estimate that these first solids could be so enriched in actinides that they may support a fission chain reaction. This reaction could ignite carbon burning and lead to the explosion of an isolated WD in a thermonuclear supernova.
We thank Andrew Cumming, Gerardo Ortiz, Irina Sagert, and Mike Snow for helpful discussions. This research was supported in part by the US Department of Energy Office of Science grants DE-FG02-87ER40365 and DE-SC0018083.
References
- Gaia Collaboration (2018) Gaia Collaboration, Astronomy & Astrophysics 616, A10 (2018), arXiv:1804.09378 [astro-ph.SR] .
- van Horn (1968) H. M. van Horn, Astrophys. J. 151, 227 (1968).
- Tremblay et al. (2019) P.-E. Tremblay, G. Fontaine, N. P. G. Fusillo, B. H. Dunlap, B. T. Gänsicke, M. A. Hollands, J. J. Hermes, T. R. Marsh, E. Cukanovaite, and T. Cunningham, Nature (London) 565, 202 (2019), arXiv:1908.00370 [astro-ph.SR] .
- Bildsten and Hall (2001) L. Bildsten and D. M. Hall, The Astrophysical Journal 549, L219 (2001).
- Hughto et al. (2010) J. Hughto, A. S. Schneider, C. J. Horowitz, and D. K. Berry, Phys. Rev. E 82, 066401 (2010).
- Blouin et al. (2020) S. Blouin, J. Daligault, D. Saumon, A. Bédard, and P. Brassard, arXiv e-prints , arXiv:2007.13669 (2020), arXiv:2007.13669 [astro-ph.SR] .
- Camisassa et al. (2020) M. E. Camisassa, L. G. Althaus, S. Torres, A. H. Córsico, S. Cheng, and A. Rebassa-Mansergas, arXiv e-prints , arXiv:2008.03028 (2020), arXiv:2008.03028 [astro-ph.SR] .
- Cheng et al. (2019) S. Cheng, J. D. Cummings, and B. Ménard, The Astrophysical Journal 886, 100 (2019).
- Bauer et al. (2020) E. B. Bauer, J. Schwab, L. Bildsten, and S. Cheng, “Multi-gigayear white dwarf cooling delays from clustering-enhanced gravitational sedimentation,” (2020), arXiv:2009.04025 [astro-ph.SR] .
- Caplan et al. (2020) M. E. Caplan, C. J. Horowitz, and A. Cumming, The Astrophysical Journal 902, L44 (2020).
- Gauthier-Lafaye et al. (1996) F. Gauthier-Lafaye, P. Holliger, and P.-L. Blanc, Geochimica et Cosmochimica Acta 60, 4831 (1996).
- Kuroda (1956) P. K. Kuroda, The Journal of Chemical Physics 25, 781 (1956), https://doi.org/10.1063/1.1743058 .
- Abbott et al. (2019) T. M. C. Abbott, S. Allam, P. Andersen, C. Angus, J. Asorey, A. Avelino, S. Avila, B. A. Bassett, K. Bechtol, G. M. Bernstein, E. Bertin, D. Brooks, D. Brout, P. Brown, D. L. Burke, J. Calcino, A. C. Rosell, D. Carollo, M. C. Kind, J. Carretero, R. Casas, F. J. Castander, R. Cawthon, P. Challis, M. Childress, A. Clocchiatti, C. E. Cunha, C. B. D’Andrea, L. N. da Costa, C. Davis, T. M. Davis, J. D. Vicente, D. L. DePoy, S. Desai, H. T. Diehl, P. Doel, A. Drlica-Wagner, T. F. Eifler, A. E. Evrard, E. Fernandez, A. V. Filippenko, D. A. Finley, B. Flaugher, R. J. Foley, P. Fosalba, J. Frieman, L. Galbany, J. García-Bellido, E. Gaztanaga, T. Giannantonio, K. Glazebrook, D. A. Goldstein, S. González-Gaitán, D. Gruen, R. A. Gruendl, J. Gschwend, R. R. Gupta, G. Gutierrez, W. G. Hartley, S. R. Hinton, D. L. Hollowood, K. Honscheid, J. K. Hoormann, B. Hoyle, D. J. James, T. Jeltema, M. W. G. Johnson, M. D. Johnson, E. Kasai, S. Kent, R. Kessler, A. G. Kim, R. P. Kirshner, E. Kovacs, E. Krause, R. Kron, K. Kuehn, S. Kuhlmann, N. Kuropatkin, O. Lahav, J. Lasker, G. F. Lewis, T. S. Li, C. Lidman, M. Lima, H. Lin, E. Macaulay, M. A. G. Maia, K. S. Mandel, M. March, J. Marriner, J. L. Marshall, P. Martini, F. Menanteau, C. J. Miller, R. Miquel, V. Miranda, J. J. Mohr, E. Morganson, D. Muthukrishna, A. Möller, E. Neilsen, R. C. Nichol, B. Nord, P. Nugent, R. L. C. Ogando, A. Palmese, Y.-C. Pan, A. A. Plazas, M. Pursiainen, A. K. Romer, A. Roodman, E. Rozo, E. S. Rykoff, M. Sako, E. Sanchez, V. Scarpine, R. Schindler, M. Schubnell, D. Scolnic, S. Serrano, I. Sevilla-Noarbe, R. Sharp, M. Smith, M. Soares-Santos, F. Sobreira, N. E. Sommer, H. Spinka, E. Suchyta, M. Sullivan, E. Swann, G. Tarle, D. Thomas, R. C. Thomas, M. A. Troxel, B. E. Tucker, S. A. Uddin, A. R. Walker, W. Wester, P. Wiseman, R. C. Wolf, B. Yanny, B. Zhang, and Y. Z. and, The Astrophysical Journal 872, L30 (2019).
- Howell (2011) D. A. Howell, Nature Communications 2, 350 (2011).
- Sullivan (2010) M. Sullivan, “Type ia supernovae and cosmology,” in Lectures on Cosmology: Accelerated Expansion of the Universe, edited by G. Wolschin (Springer Berlin Heidelberg, Berlin, Heidelberg, 2010) pp. 59–97.
- Perlmutter et al. (2011) S. Perlmutter, B. P. Schmidt, and A. G. Riess, “The nobel prize in physics for the discovery of the accelerating expansion of the universe through observations of distant supernovae.” (2011).
- Wang and Han (2012) B. Wang and Z. Han, New Astronomy Reviews 56, 122 (2012), arXiv:1204.1155 [astro-ph.SR] .
- Hillebrandt et al. (2013) W. Hillebrandt, M. Kromer, F. K. Röpke, and A. J. Ruiter, “Towards an understanding of type ia supernovae from a synthesis of theory and observations,” (2013), arXiv:1302.6420 [astro-ph.CO] .
- Ruiz-Lapuente (2014) P. Ruiz-Lapuente, New Astronomy Reviews 62-63, 15 (2014).
- Mckinven et al. (2016) R. Mckinven, A. Cumming, Z. Medin, and H. Schatz, The Astrophysical Journal 823, 117 (2016).
- Horowitz et al. (2010) C. J. Horowitz, A. S. Schneider, and D. K. Berry, Phys. Rev. Lett. 104, 231101 (2010).
- Medin and Cumming (2010) Z. Medin and A. Cumming, Phys. Rev. E 81, 036107 (2010).
- Holmbeck et al. (2018) E. M. Holmbeck, T. C. Beers, I. U. Roederer, V. M. Placco, T. T. Hansen, C. M. Sakari, C. Sneden, C. Liu, Y. S. Lee, J. J. Cowan, and A. Frebel, The Astrophysical Journal 859, L24 (2018).
- Lodders (2019) K. Lodders, “Solar elemental abundances,” (2019), arXiv:1912.00844 [astro-ph.SR] .
- (25) On line supplemental material for this article, see Appendix .
- (26) National Nuclear Data Center at http://www.nndc.bnl.gov .
- Lamarsh (1977) J. R. Lamarsh, Introduction to Nuclear Engineering (Addison Wesley, 1977).
- Cummings et al. (2018) J. D. Cummings, J. S. Kalirai, P.-E. Tremblay, E. Ramirez-Ruiz, and J. Choi, The Astrophysical Journal 866, 21 (2018).
- Cooper and Bildsten (2008) R. L. Cooper and L. Bildsten, Phys. Rev. E 77, 056405 (2008).
- Shternin and Yakovlev (2006) P. S. Shternin and D. G. Yakovlev, Phys. Rev. D 74, 043004 (2006).
- Timmes and Woosley (1992) F. X. Timmes and S. E. Woosley, Astrophys. J. 396, 649 (1992).
- Poludnenko et al. (2019) A. Y. Poludnenko, J. Chambers, K. Ahmed, V. N. Gamezo, and B. D. Taylor, Science 366, eaau7365 (2019).
- Mannucci et al. (2006) F. Mannucci, M. Della Valle, and N. Panagia, Monthly Notices of the Royal Astronomical Society 370, 773 (2006), https://academic.oup.com/mnras/article-pdf/370/2/773/2903658/mnras0370-0773.pdf .
- Matteucci et al. (2006) F. Matteucci, N. Panagia, A. Pipino, F. Mannucci, S. Recchi, and M. Della Valle, Monthly Notices of the Royal Astronomical Society 372, 265 (2006), https://academic.oup.com/mnras/article-pdf/372/1/265/5782472/mnras0372-0265.pdf .
- Maoz et al. (2014) D. Maoz, F. Mannucci, and G. Nelemans, Annual Review of Astronomy and Astrophysics 52, 107 (2014), https://doi.org/10.1146/annurev-astro-082812-141031 .
Appendix
.1 Linear mixing compositions
In this section we provide in Tables 4 and 5 abundances of the liquid and solid phases as shown in Fig. 2 of the main paper. Molecular dynamics simulations are described in Sec. .2.
| (liquid) | (solid) | |
|---|---|---|
| 6 | 0.49295194553376287 | 0.23362533854669934 |
| 8 | 0.49295194553376287 | 0.32492889695169003 |
| 9 | 4.9686426256180860E-007 | 3.6866819993714355E-007 |
| 10 | 1.2636784000587731E-002 | 1.0409983645970053E-002 |
| 11 | 2.2613192422104362E-005 | 2.0796337324649017E-005 |
| 12 | 4.0296865388871094E-004 | 4.1472075483349973E-004 |
| 13 | 3.2010577923470222E-005 | 3.6915127207336077E-005 |
| 14 | 3.9123170280457373E-004 | 5.0828508971819709E-004 |
| 15 | 3.2315738651657788E-006 | 4.7577577604337754E-006 |
| 16 | 1.7096825412559870E-004 | 2.8688838579082860E-004 |
| 17 | 2.0696157078361951E-006 | 3.9805002804735190E-006 |
| 18 | 3.8223337364006851E-005 | 8.4726513693123020E-005 |
| 19 | 1.4127376788273156E-006 | 3.6286258879588543E-006 |
| 20 | 2.2391755278316973E-005 | 6.6998323717337873E-005 |
| 21 | 1.3184508384514136E-008 | 4.6195637709868454E-008 |
| 22 | 9.6203875719644679E-007 | 3.9675311376132979E-006 |
| 23 | 1.0758871827125777E-007 | 5.2490469470911812E-007 |
| 24 | 5.1368722578240533E-006 | 2.9796231189119231E-005 |
| 25 | 3.5562961784935750E-006 | 2.4645733986116784E-005 |
| 26 | 3.4115404484558827E-004 | 2.8384366779132123E-003 |
| 27 | 8.8418364833833664E-007 | 8.8742625202445955E-006 |
| 28 | 1.9041246975498605E-005 | 2.3163094474264208E-004 |
| 29 | 2.0930896100044694E-007 | 3.1004590066959337E-006 |
| 30 | 4.9295194553376294E-007 | 8.9326795429250368E-006 |
| 31 | 1.4162587641525570E-008 | 3.1538300926850089E-007 |
| 32 | 4.6947804336548850E-008 | 1.2905875582566026E-006 |
| 33 | 2.3747764360237624E-009 | 8.0948499116693123E-008 |
| 34 | 2.6447263109589182E-008 | 1.1227893608345454E-006 |
| 35 | 4.8121499444962572E-009 | 2.5555642110274423E-007 |
| 36 | 2.0070186353874633E-008 | 1.3390891593029508E-006 |
| 37 | 2.8051313091087936E-009 | 2.3614812413699321E-007 |
| 38 | 9.1156986753465687E-009 | 9.7238962176758543E-007 |
| 39 | 1.7018579071998956E-009 | 2.3100543426260367E-007 |
| 40 | 4.2644255605698538E-009 | 7.3964223875862461E-007 |
| 41 | 3.0516072818756751E-010 | 6.7912630607248444E-008 |
| 42 | 1.0172024272918918E-009 | 2.9165792081199557E-007 |
| 44 | 7.0812938207627849E-010 | 3.4116346103081000E-007 |
| 45 | 1.3223631554794592E-010 | 8.3083051543101197E-008 |
| (liquid) | (solid) | |
|---|---|---|
| 46 | 5.3989974987031172E-010 | 4.4413587486582836E-007 |
| 47 | 1.9444215629387313E-010 | 2.1025715753936566E-007 |
| 48 | 6.1814609043122656E-010 | 8.8209113811041236E-007 |
| 49 | 7.0030474802018688E-011 | 1.3239262544836350E-007 |
| 50 | 1.4045218130684197E-009 | 3.5313472899560926E-006 |
| 51 | 1.4045218130684195E-010 | 4.7146037001072241E-007 |
| 52 | 1.8466136372375879E-009 | 8.3072267398741265E-006 |
| 53 | 6.2205840745927222E-010 | 3.7646306118210063E-006 |
| 54 | 2.1517743654251553E-009 | 1.7584763866454542E-005 |
| 55 | 1.4397326663208312E-010 | 1.5947680709495643E-006 |
| 56 | 1.7801042477608103E-009 | 2.6825900187282332E-005 |
| 57 | 1.7957535158729935E-010 | 3.6953572845768090E-006 |
| 58 | 4.5382877525330550E-010 | 1.2799728815374261E-005 |
| 59 | 6.8465547990800394E-011 | 2.6562491509055975E-006 |
| 60 | 3.3802419122315170E-010 | 1.8105578444288122E-005 |
| 62 | 1.0680625486564863E-010 | 1.1023049628428485E-005 |
| 63 | 3.9123170280457374E-011 | 5.6350086615352327E-006 |
| 64 | 1.3536616917038251E-010 | 2.7306869014457609E-005 |
| 65 | 2.4451981425285858E-011 | 6.9328962431122075E-006 |
| 66 | 1.5923130304146148E-010 | 6.3679214189768757E-005 |
| 67 | 3.4858744719887521E-011 | 1.9732020393274201E-005 |
| 68 | 1.0015531591797088E-010 | 8.0526483479513336E-005 |
| 69 | 1.5766637623024322E-011 | 1.8068230574103112E-005 |
| 70 | 9.8590389106752573E-011 | 1.6159298517913045E-004 |
| 71 | 1.4866804706573801E-011 | 3.4971104242230517E-005 |
| 72 | 6.0640913934708923E-011 | 2.0542183007793289E-004 |
| 73 | 8.4114816102983345E-012 | 4.1173800326116089E-005 |
| 74 | 5.6337365203858610E-011 | 3.9983817265815087E-004 |
| 75 | 2.1400374143410181E-011 | 2.2095984970340151E-004 |
| 76 | 2.5508307022858210E-010 | 3.8444691668953371E-003 |
| 77 | 2.4764966787529519E-010 | 5.4664740070573484E-003 |
| 78 | 4.8512731147767138E-010 | 1.5735689736341808E-002 |
| 79 | 7.6290182046891878E-011 | 3.6483689993806979E-003 |
| 80 | 1.4710312025451973E-010 | 1.0406039315687302E-002 |
| 81 | 7.0030474802018688E-011 | 7.3521024108057099E-003 |
| 82 | 1.2949769362831390E-009 | 0.20242723306727989 |
| 83 | 5.5163670095444893E-011 | 1.2881256024068765E-002 |
| 90 | 1.6470854688072555E-011 | 6.9868308321281880E-002 |
| 92 | 9.3465253800012668E-012 | 9.3418583343566702E-002 |
.2 Molecular dynamics simulations
In this section we describe preliminary molecular dynamics simulations that are illustrated in Fig. 3. We have extensively used classical molecular dynamics simulations to model astromaterials in WDs and neutron stars Caplan and Horowitz (2017). In our model nuclei are fully ionized and treated as point particles of charge which interact via a screened two-body potential
| (4) |
with periodic separation and screening length using where is the electron density. To control finite size effects we cutoff this potential at . We use a step size of fm/c.
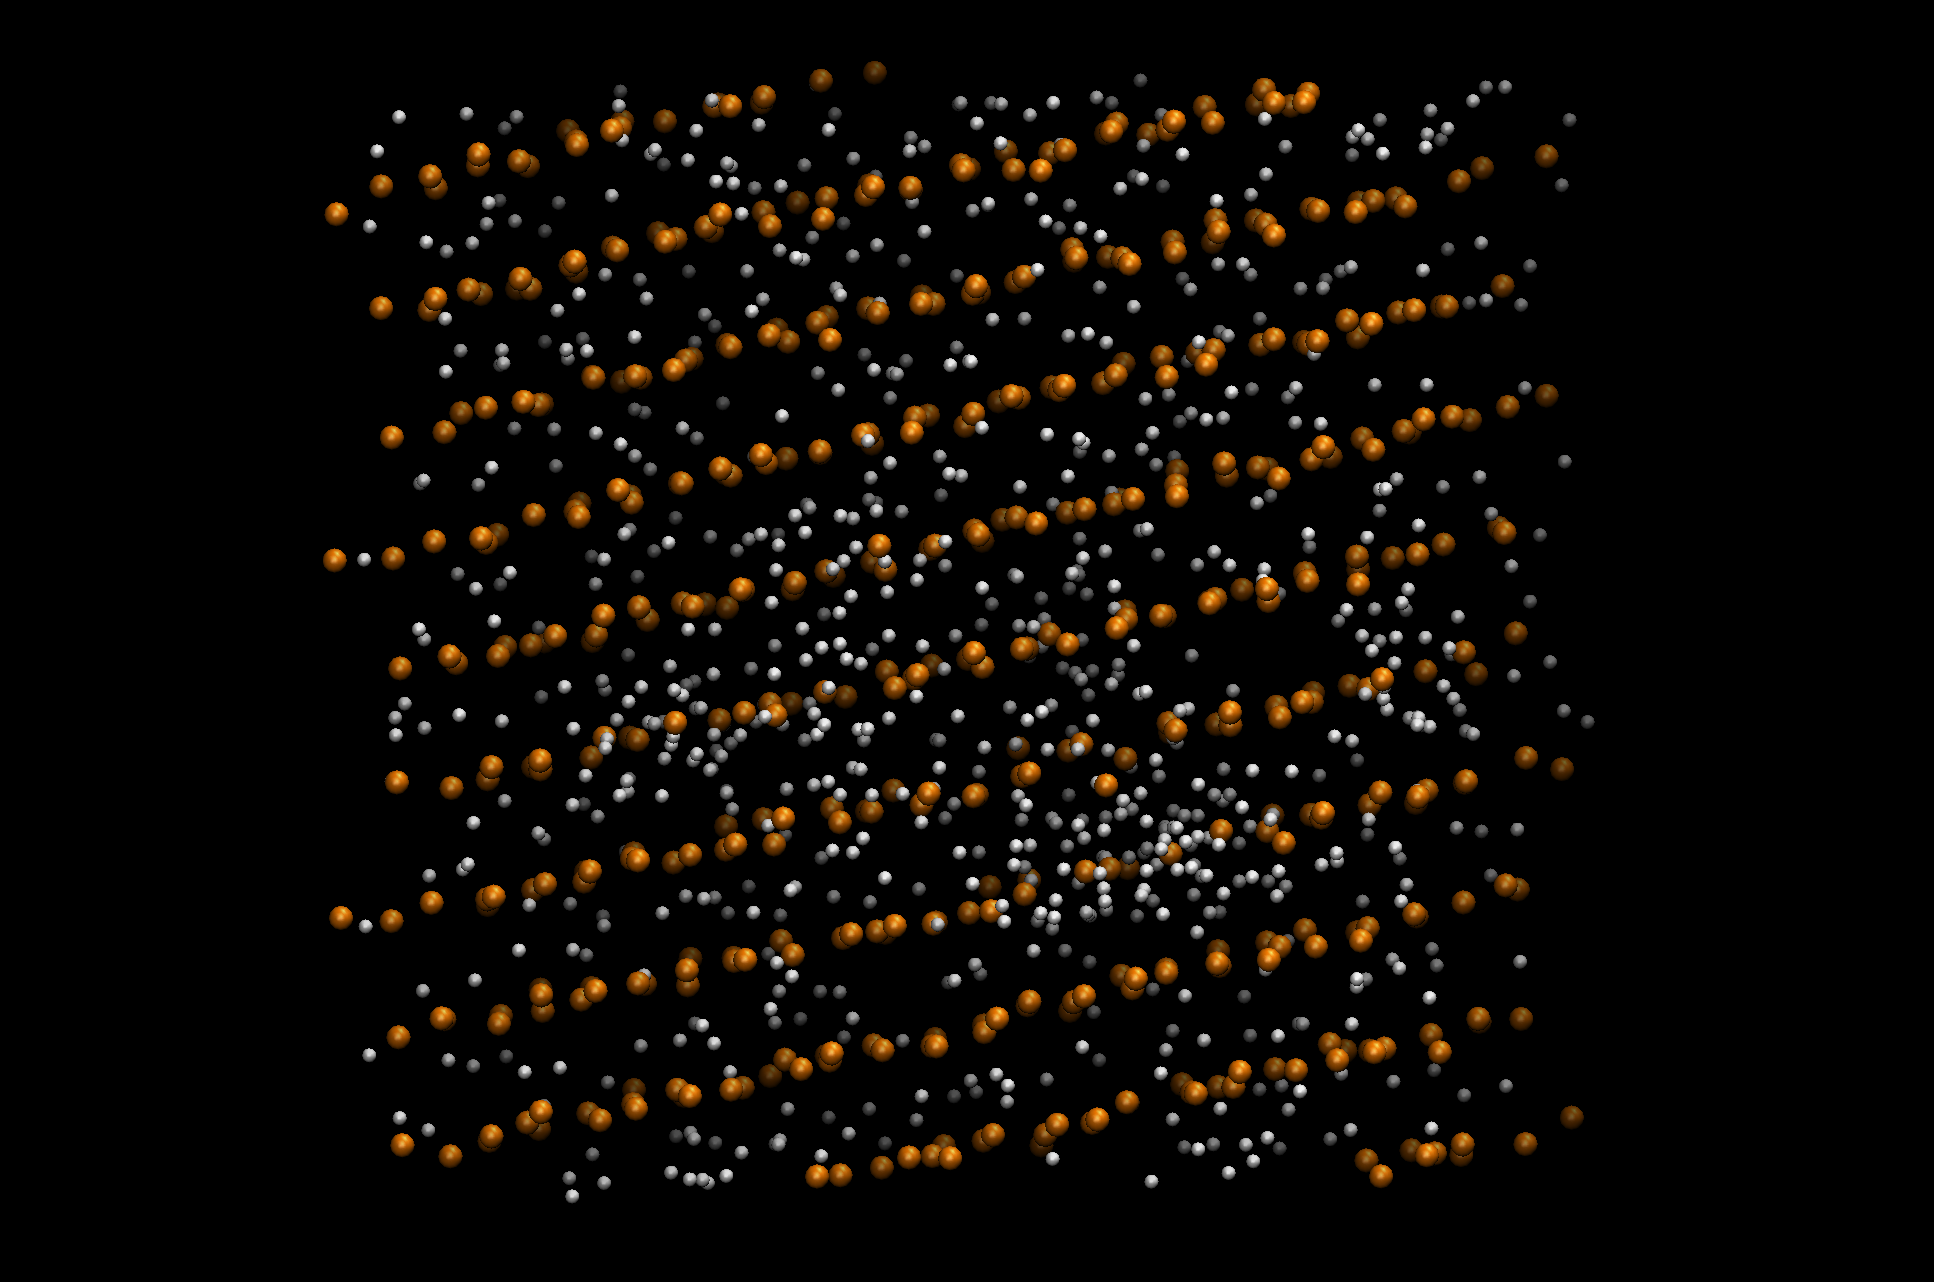
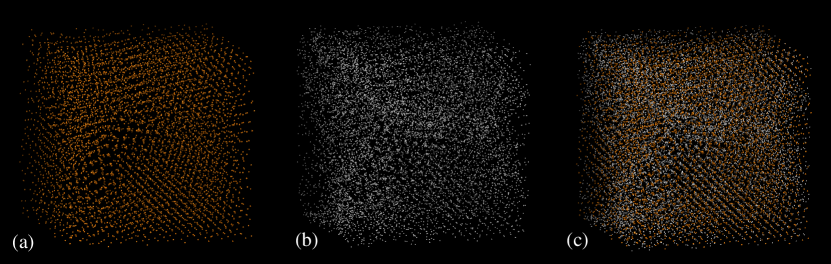
We prepared an initial solid phase by starting a small system with 512 U, 384 C, and 384 O ions in a cubical simulation volume. The initial positions were distributed randomly with a uniform probability. The ion density was fm-3 and the temperature was 19 keV. The system was observed to freeze and the final configuration, after a simulation time of about fm/c, is shown in Fig. 3.
The U ions are approximately arranged on a crystal lattice as are some of the C and O ions. However the remainder of the C and O ions appear to cluster in a nonuniform way. We interpret this clustering as initial evidence for phase separation. Some of the C/O appear to be starting to diffuse out of the crystal lattice. This suggests that the equilibrium abundance of U in the solid phase is larger than our initial U abundance of 0.4. We confirm this result below with a two phase simulation.
We next prepared a liquid phase with 3748 C and 3749 O ions in a cubical simulation volume of the same size and approximately the same electron density as the solid simulation. This simulation was equilibrated by running for a short time and then both simulations had there temperatures reduced to 5 keV.
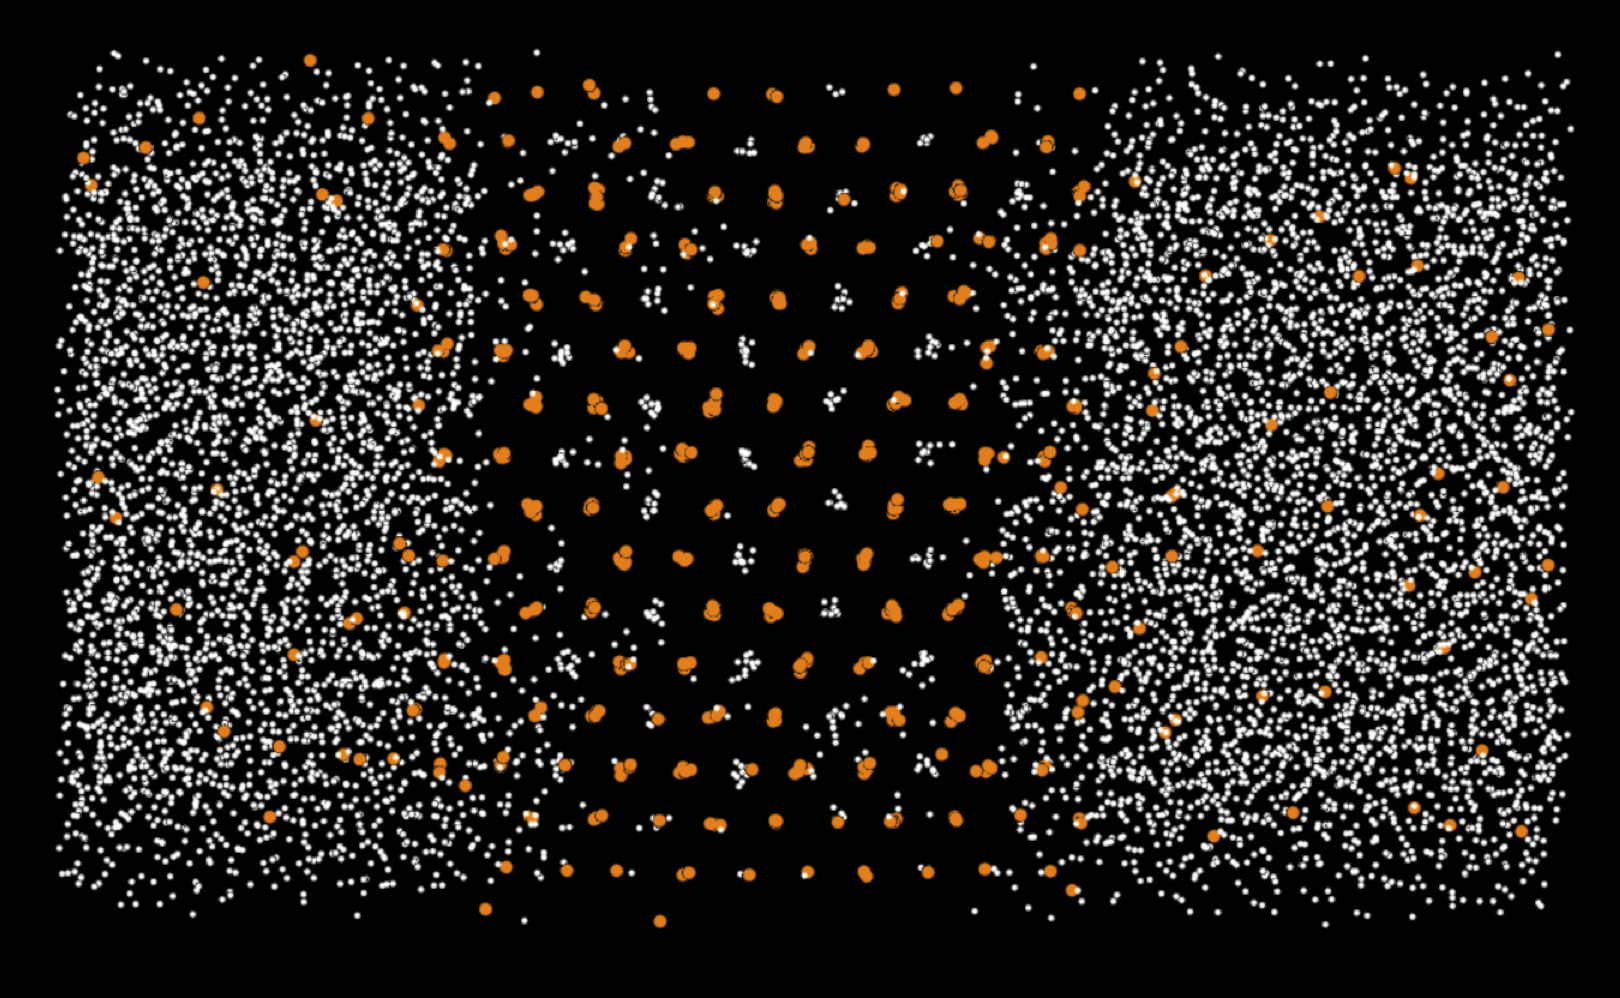
The two systems were combined in a single rectangular shaped simulation volume that is twice as long in the z direction as in the x and y. This combined system with a total of 8777 ions was evolved for a further fm/c at a temperature of 5 keV and than the somewhat high temperature of 7 keV to speed the diffusion of C and O. The final configuration is shown in Fig. 4. The composition of this configuration is determined by dividing the simulation volume along the long axis into 20 equal subvolumes (slices) and determining the compsotion of each sub-volume by simply counting the number of ions of each type that are inside. The results are shown in Fig. 5.
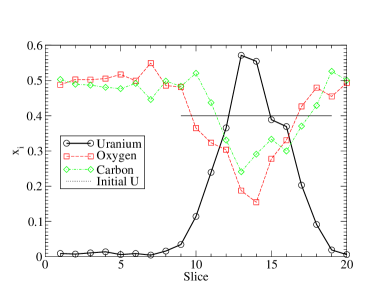
The uranium concentration in the center of the solid phase is seen to increase from 0.4, the initial value of the original small solid simulation, to almost 0.6 as C and O diffused from the solid into the liquid. This value 0.6 may represent something of a lower bound for the concentration of U in the solid. Finite size effects and the limited running time of the simulation may not have allowed C and O to diffuse further possibly lowering the C and O concentration in the solid even further. This will be checked with larger and longer MD simulations in future work.
.3 Alternate Lattices
The lattice structure of the solid may be complicated given the large charge ratios and is likely sensitive to the exact composition. We present here one example of a nontrivial lattice which formed spontaneously in an MD simulation.
The mixture considered here contains 4142 C, 5760 O, 3588 Pb, 1238 Th, and 1656 U for a total of 16384 nuclei (, for GPU threading), which is slightly enhanced in C and O relative to the solid described in Tab. 4. The mixture was initialized as a liquid with random initial positions with a temperature near . At this the mixture was weakly supercooled and so it quickly crystallized. The crystal that formed had a CsCl type lattice, i.e. a binary cubic lattice with a two-atom basis which alternates between actinides and C/O, and is shown in Fig. 6. This is first example known to the authors of a lattice of this kind forming spontaneously in a simulation.
The number abundance of C/O is approximately 60% while Pb/Th/U numbers about 40%, which results a number of defects. The crystal appears to have multiple domains with different orientations, with a large number of C/O concentrated at the domain walls (arrows). This suggests the C/O abundance is too high and that a properly annealed crystal may expel light elements so that the ratio is very nearly 50/50 with actinides. In contrast, other lattice families such as orthorhombic or hexagonal may expel even more C/O and greatly enhance the actinide purity (see Engstrom et al. (2016) for examples). Therefore, if phase separation is sensitive to the exact lattice structure that nucleates then future work may consider lattice corrections to the solid free energy.
Given the variation in charges on lattice sites there are likely screening effects, similar to what was reported in Caplan (2020). In short, we expect that there is likely some coordination so that the lowest Z may preferentially neighbor the highest Z so that unit cells may find an average charge to preserve long range order. We also resolve small clusters of C/O on some actinide lattice sites whose charge together acts like one actinide. Given the large timescale for actinide diffusion relative to C/O this configuration is difficult to anneal without a significant investment of computing time, but should be explored in detail in future work.
References
- Caplan and Horowitz (2017) M. E. Caplan and C. J. Horowitz, Rev. Mod. Phys. 89, 041002 (2017).
- Engstrom et al. (2016) T. Engstrom, N. Yoder, and V. Crespi, The Astrophysical Journal 818, 183 (2016).
- Caplan (2020) M. E. Caplan, Phys. Rev. E 101, 023201 (2020).