A Molecular Field Approach to Pressure Induced Phase Transitions in Liquid Crystals: Smectic-Nematic transition
Abstract
Since a rigorous microscopic treatment of a nematic fluid system based on a pairwise interaction potential is immensely complex we had introduced a simple mean field potential which was a modification of the Maier-Saupe potential in a previous paper DasGupta et al. (2018). Building up on that here we have modified that potential to take into account the various aspects of a smectic A-nematic phase transition. In particular we have studied the dependence of the phase transition on the coupling coefficient between the nematic and smectic order parameters which in turn depends on the length of alkyl chain, existence of tricritical point, variation of entropy and specific heat as well as the dependence of the phase transition on pressure.
1School of Physical Sciences, National Institute of Science
Education and Research, HBNI, P. O. Jatni, 752050, India.
1Email ID: shabnam.sabana@gmail.com, Phone No. 8981479826
2Department of Physics, Lady Brabourne College, Kolkata 700017,
India.
2Email ID: sudeshna.dasgupta10@gmail.com, Phone No. 983146102
3Department of Physics, Mahishadal Raj College, Mahishadal,
Purba Medinipur, India.
3Email ID: ghoshaln@yahoo.co.in, Phone No. 8335950698
4Department of Physical Sciences, IISER Kolkata, Mohanpur 741246,
India.
4Email ID: adg@iiserkol.ac.in, Phone No. 9831937272
5Retd. Professor, Department of Physics, Jadavpur University,
Kolkata700032, India.
5Email ID: roy.soumenkumar@gmail.com, Phone No. 9874741525.
1 Introduction
Maier and Saupe Maier and Saupe (1960) presented a microscopic statistical theory of nematic liquid crystals based on dipole-dipole dispersive interactions. They obtained an orientation dependent potential between a pair of elongated molecules which successfully described the first order nematic-isotropic liquid phase transition in a molecular field approximation. In this theory only the orientational order parameter was considered. In 1970, Kobayashi K. Kobayashi (1970); Kobayashi (1971) introduced a theory of melting in liquid crystals for which both the translational and orientational order parameters were taken into account. His formulation was analogous to that of Kirkwood and Monroe Kirkwood and Monroe (1941). Later in 1971, McMillan McMillan (1971, 1972) presented a simple molecular model with anisotropic forces for the smectic A phase by extending the Maier-Saupe molecular potential. Introducing one physical parameter as a dimensionless interaction strength for the smectic A phase, he predicted that the extent of the nematic range would depend on the value of . The nematic range decreases as increases leading to a first order smectic A-isotropic transition. One gets a triple point where the three phases, namely, smectic A (A), nematic (N) and isotropic (I) coexist. McMillan calculated the transition temperatures as a function of and produced a generalized phase diagram to explain the role of alkyl end chains in the formation of the smectic A phase. He was the first to point out that the A-N transition could be second order if , where is the A-N and the N-I transition temperatures. Above this value the A-N transition is a first order transition. A change in the order of phase transition is thus expected near giving rise to a tricritical point (TCP). According to this theory the appearance of a second order phase transition is related to the saturation of the nematic order at . McMillan’s prediction of second order behavior was subsequently verified experimentally by Doane et al Doane et al. (1972) in 1972. With the NMR study of the homologous series of compunds like -n-alkoxybenzylidene--phenylazoaniline, they found that the A-N transition could be second order or very nearly second order. The same qualitative features were presented in the de Gennes De Gennes (1973) model. Using a Landau expansion of smectic A free energy, he showed that the order of the transition depends on which is the strength of the coupling between the nematic or orientational order parameter and the smectic A or density order parameter. The alkyl chain length is related to the coupling constant . As increases which in turn increases the coupling between the nematic and smectic A order parameters, the extent of the nematic phase gradually becomes smaller. This favours a first order A-N phase transition. At lower values of however, the larger range of the nematic phase saturates the order parameter and the A-N transition becomes second order. A tricritial point exists at the cross over from second to first order behavior. The question of the existence of a A-N tricritical point has motivated interest among researchers for several years. Since the theoretical discovery by Kobayashi K. Kobayashi (1970); Kobayashi (1971) and McMillan McMillan (1971, 1972), there have been several experiments that strongly suggest such a point does exist on phase diagrams of temperature vs pressure McKee and McColl (1975) or vs concentration of the liquid crystalline material Johnson et al. (1975); Karat and Madhusudana (1979). Alben Alben (1973) predicted a He3-He4 like TCP in binary liquid crystal mixtures. In 1973 Keyes et al Keyes et al. (1973) reported a pressure study for the transition between the smectic A and cholesteric liquid crystalline phases of cholesteryl oleyl carbonate and discovered a new type of TCP. However, Halperin, Lubensky and Ma Halperin et al. (1974); Halperin and Lubensky (1974) argued that the A-N transition can never be truly second order, thus, ruling out conventional tricritical behavior. The trend of three phases meeting at a single point was experimentally found by Shashidhar and Chandrasekhar Shashidhar and Venkatesh (1979) when they investigated the pressure dependence for methoxybenzoic acid and ethoxybenzoic acid. This work not only supported the appearance of a triple point (TP) in liquid crystalline systems but also established for the first time the existence of the solid-nematic-isotropic and solid-smectic A-nematic triple points in a single component system. This investigation gave a detailed insight on the effect of pressure on the liquid crystalline phase transitions confirming the presence of a tricritical point (TCP) at kbar as predicted by Keyes et al Keyes et al. (1973). Later in 1979 D. Brisbin Brisbin et al. (1979) et al reported the presence of tricritical point in the homologous series pentylbenzenethioalkoxybenzoate by their specific heat and birefringence measurements. Thoen Thoen et al. (1984) et al in 1984 also showed by using adiabatic-scanning calorimetry that although A-N transition is first order for very narrow N ranges, it is second order for large N ranges in the series alkoxycyanobiphenyl. Up till now many experiments and theories Marynissen et al. (1985); Lampe and Collings (1986); Longa (1986); Rananvare et al. (1987); Huster et al. (1987); Stine and Garland (1989); DasGupta and Roy (2003); Mukherjee and Rzoska (2002); Cladis et al. (1981) have confirmed this trend of appearances of TP and TCP for many liquid crystal materials and liquid crystal mixtures.
In 2018 DasGupta et al. (2018) we had presented a molecular field theory to study pressure induced phase transitions in liquid crystals. A simple effective potential was chosen to discuss in particular the N-I phase transition. In the present paper, we intend to demonstrate the utility of our model in a more general case. Following McMillan’s molecular model, we have extended the potential for studying the A N I phase transitions. The purpose of this paper is to present the pressure dependence of such systems using our model and to calculate its properties. A qualitative as well as quantitative comparison between the results so obtained and those obtained with existing theoretical and experimental results have been made.
2 Our Model
One of the pioneering works in theoretical modelling of liquid crystals was by Maier and Saupe Maier and Saupe (1960) who in order to explain the orientational order in nematics introduced the potential
| (1) |
For any smectic A liquid crystal there is an additional one-dimensional translational periodicity which requires some degree of translational order in addition to the long-range orientational order for characterizing the phase. McMillan McMillan (1971) developed Eq. 1 further to account for the possibility of a smectic A phase. Any realistic theoretical model of liquid crystals which allow volume fluctuation must include both repulsive and attractive interactions. In DasGupta et al. (2018) we had used a molecular field approach by adapting the Maier Saupe potential for this purpose by adding an isotropic volume dependent term. In this paper we further extend that work by following the development by McMillan McMillan (1971) that included another term to account for the translational periodicity. We have used this to study the liquid crystalline smectic A to nematic phase transition. The effective single particle potential we choose for this purpose is given by
| (2) |
where , , and are constants and is the volume of the fluid per molecule. Here the volume dependence of the isotropic terms has been chosen to mimic the scaling behavior of the familiar Lennard-Jones potential DasGupta et al. (2018). Both Maier Saupe and McMillan models were on fixed lattices. In the current paper we investigate a continuum version. We have considered the isothermal-isobaric ensemble, denoted as the NPT ensemble, here.
Using this potential the canonical partition function can be written as
| (3) |
where
| (4) |
and
Here, , is the layer thickness and is the volume of the system.
Hence, the partition function for the NPT ensemble is
| (5) |
which becomes
| (6) |
where
| (7) |
where denotes the purely orientational (i.e. nematic) order parameter and denotes the mixed order parameter which describes the coupling between the degrees of orientational and translational order. As in McMillan McMillan (1971) we neglect the purely translational order parameter.
So depends on , , and on the constant parameters , , , , and . Here we are singling out its volume dependence since we are going to use the saddle point method where the integral is only over volume. Since we can use the saddle point approximation DasGupta et al. (2018) to write (upto a multiplicative constant which we ignore)
| (8) |
where is the value of which maximizes .
Maximizing we get the equation of state
| (9) |
Using this we can construct the Gibb’s free energy of the system given by
up to a constant. Hence the Gibb’s free energy of the system in units of is given by
| (10) |
where and .
Now by minimizing Eq. 10 w.r.t and we obtain
| (11) |
and
| (12) |
Solving Eq. 9, Eq. 11 and Eq. 12 simultaneously we obtain the value of , and for the different liquid crystalline phases. Again solving Eq. 9 for yields the value of for the isotropic phase. Similarly the condition and yields the smectic A phase and and yields the nematic phase. Out of these possibilities the equilibrium value of , and for a particular set of constant parameters , , , , and is decided by checking which of these yield the lower value of . This value of , and globally minimizes the function .
Now we obtain the critical constants , and for the isotropic-vapor transition from Eq. 9 (setting ) in terms of and .
| (13) |
| (14) |
| (15) |
To get rid of the constants and , we have expressed the temperature (), pressure () and volume () in terms of reduced parameters , , .
From Eq. 9 we obtain the reduced equation of state
| (16) |
The corresponding free energy in terms of the reduced set of parameters , and is
| (17) |
Using Eq. 16 and Eq. 17, we obtained the values of , and . Again solving Eq. 16 for yields the value of for the isotropic phase. As discussed earlier out of these two values the equilibrium value of , and is decided on the basis of which of these values yields a lower .
The entropy in the reduced form is
| (18) |
We have calculated the specific heat at constant pressure using the equation
| (19) |
where the derivative has been evaluated numerically.
3 Results and Discussions
In this section, the results obtained using our model potential have been discussed and compared with the existing theoretical and experimental results. In our model, and are free parameters which can be varied to match different liquid crystalline systems. For example the value of and helped us fit the experimental data of A-N transition temperature (K) and the N-I transition temperature (K) for 8OCB quite well.
3.1 Effect of pressure on the order parameters:
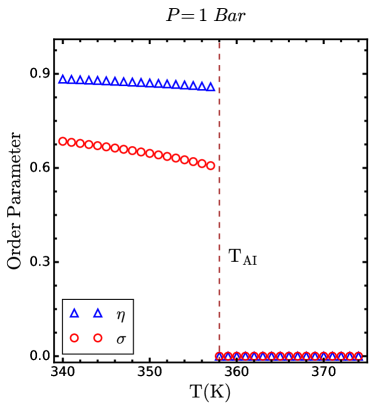
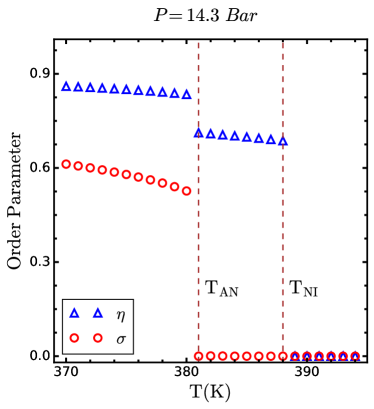
The variation of order parameters and with temperature are shown in fig. 1 for the choice of model parameter . Variation at two different pressure has been discussed here. The left diagram shows variation at Bar and the right one at Bar. The effect of pressure on the A-I or A-N transition is to increase the transition temperature as can be seen from the figure. This is because of the fact that an increase in pressure brings about more order in the liquid crystal molecules. From the variation of the curve, the A-I or A-N transition is found to be of first order even at elevated pressure. It is also seen that as pressure increases, the discontinuity of the curve, at the transition, decreases. This result is in accordance with the work by Mukherjee et al Mukherjee and Rzoska (2002) in 2002. Another interesting feature is the appearence of the pressure induced nematic phase at higher pressure as can be seen following the curve.
3.2 Effect of temperature on the order parameters
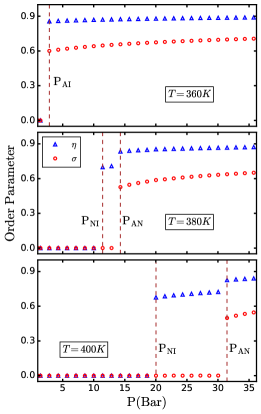
The pressure dependence of the order parameters and is shown in fig. 2 for three representative values of temperature. At there is a direct smectic A to isotropic transition while at the higher T values i.e. at K and K nematic phase is also present. Here, as expected, we can see the A-N transition at and subsequently a N-I transition at for the lower values of pressure. It can be noted that the value of order parameters decreases with the decrease of pressure in each case thereby showing that the liquid crystalline system becomes less and less ordered as pressure decreases.
3.3 Significance of the model parameter
The physical parameter acts as a dimensionless interaction strength for the smectic A phase. From the theoretical point of view is related to the length of the alkyl chain in a homologous series such that should increase with increasing chain length. In analogy to the McMillan theory McMillan (1971) we have taken different values of the constant to discuss the variation of liquid-crystal behavior in a homologous series.
3.3.1 Phase diagram
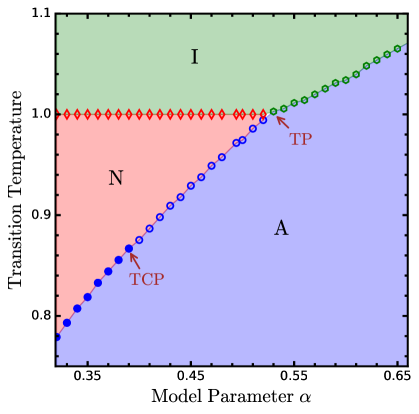
The transition temperatures () as a function of the model parameter are plotted in the fig. 3, where , the N-I transition temperature. The phase diagram shows that at lower values of (i.e. for shorter chain length) all three phases, namely, smectic A, nematic and isotropic exist and, A N I phase transitions occur as temperature is increased. For higher values of () (i.e. for longer chain length), only smectic A and isotropic phases can be observed and a direct A I transition takes place. represents the N-I transition line upto . The A-N transition temperature is an increasing function of and reaches the N-I line at . All these three phase transition lines, A-N, N-I and A-I, as can be seen from the fig. 3., meet at (, ), and thus, form a triple point (TP). The curve is very nearly a continuation of the curve at the triple point as expected from the theoretical model.
Another interesting feature can be pointed out from this phase diagram. The A-N transition line is second order for (this has been indicated by the filled blue circles in the phase diagram) and is first order for (this has been indicated by the open blue circles in the phase diagram). This confirms the presence of a tricritical point (TCP) at and . This phase diagram is seen to give an excellent qualitative agreement with McMillan’s model McMillan (1971).
3.3.2 Thermodynamic variables at different values of :
To illustrate the above stated behavior of phase diagram, in this section we shall discuss the order parameters and , the entropy and the specific heat as a function of temperature for three different values of interaction strength .
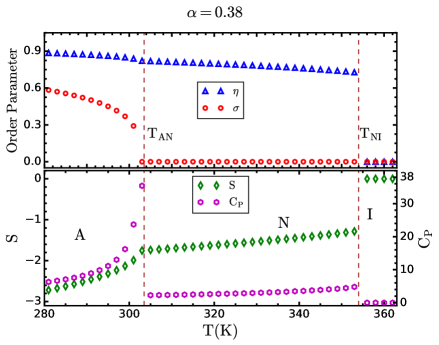
For (fig. 4), the A-N transition is second order as the smectic order parameter falls continuously to at the transition (). The corresponding N-I transition is, however, first order in nature because of the presence of a discontinuous jump at . Entropy () and specific heat () also show similar kind of behavior. We can see that the entropy changes continuously at the A-N transition indicating a second order but has a discontinuous jump at the N-I transition favoring first order phase transition. In case of , we get discontinuous jump at both the transitions but quantitatively the value of discontinuity at the N-I transition is larger than that at the A-N transition.
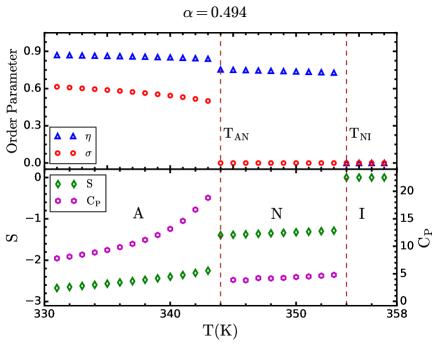
For (fig. 5) the A-N transition is first order as drops discontinuously to at the transition (). The corresponding N-I transition is also first order in nature. The discontinuity in and at both transitions show that they are first order transitions.
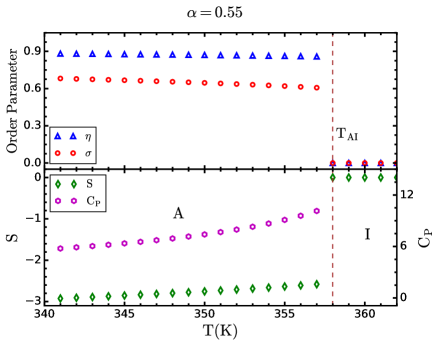
For (fig. 6) a direct A-I transition occurs. Both order parameters and drops discontinuously to at . The discontinuity in and show that the A-I transition is a first order transition.
All these values are at the atmospheric pressure Bar.
3.3.3 Phase diagrams at different values of :
A detailed investation on the pressure and temperature dependence of a liquid crystalline system at different values of has been carried out. The study shows that smectic A-nematic and nematic-isotropic liquid transition temperatures depend on pressure as well as on the parameter value . As value changes the nature of phase diagram changes drastically. Here we have discussed the phase diagrams for three different values of .
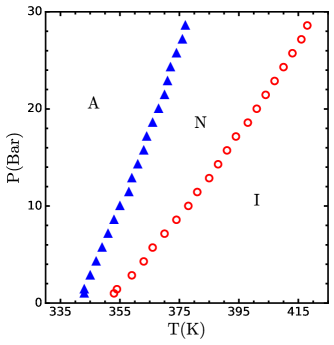
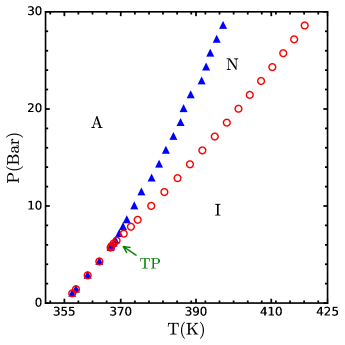
For (fig. 7), we have the phase diagram denoting the smectic A, nematic and isotropic liquid phases. As the pressure is raised, both the A-N and N-I transition temperatures increase. It is also seen from the diagram that the slope for the N-I transition line is greater than that of A-N transition line. This result is in accordance with the experimental data. This kind of behavior is also expected according to the Clausius-Clapeyron equation. For our choice of parameters, this phase diagram (fig. 7) reproduces the known behavior of cyano-octyloxybiphenyl () as shown by Cladis et. al. Cladis et al. (1981) in their experimental work.
The phase diagram for the model parameter is shown in (fig. 8). At lower pressure, there is only one transition, namely, smectic A to isotropic (A-I) transition. At higher pressure the nematic phase appears and there are two transitions, namely, A-N and N-I transitions. The branching point from where A-N and N-I transition lines originate from the A-I transition line is called the triple point (TP). With our specific choice of parameter values, we get TP at ( K, Bar). Experimentally, the appearence of such smectic A-nematic-isotropic TP was found by Lampe et. al. Lampe and Collings (1986) in the ninth members of the homologous series of di-alkylazoxybenzenes ().
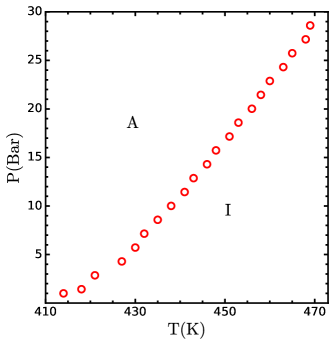
With higher value of the nature of phase diagram changes completely. Fig. 9 shows the phase diagram for . Here we can see that our system undergoes a direct transition from the smectic A to the isotropic phase without going through the nematic phase. Qualitatively, this can be attributed to the high value of which in turn signifies liquid crystalline molecules with long alkyl chains. This can be seen in the homologous series of cyanobiphenyls (for example or as shown in Drozd-Rzoska et al. (2000)).
4 Conclusions
We have presented a simple model potential which reproduces much of the known behavior of a smectic A-nematic-isotropic liquid phase transition. Investigating the properties of thermotropic liquid crystalline system we have shown that the application of pressure can result in the appearance of a nematic phase. Detailed investigation at different values of helped us to confirm that large value corresponds to long alkyl chain behavior in the homologous series. Different values of the parameters A and can be chosen to study different liquid crystalline materials.
5 Acknowledgements
Sabana Shabnam acknowledges financial support from the Department of Atomic Energy, Government of India and NISER HPC facility. The author also thanks Dr. Ashis Kumar Nandy for the useful discussions.
References
- [1]
- Alben [1973] Alben R 1973 Solid State Communications 13(11), 1783–1785.
- Brisbin et al. [1979] Brisbin D, DeHoff R, Lockhart T and Johnson D 1979 Physical Review Letters 43(16), 1171.
- Cladis et al. [1981] Cladis P, Guillon D, Bouchet F and Finn P 1981 Physical Review A 23(5), 2594.
- DasGupta and Roy [2003] DasGupta S and Roy S K 2003 Physics Letters A 306(4), 235–242.
- DasGupta et al. [2018] DasGupta S, Shabnam S, Pramanick S, Ghoshal N, DasGupta A and Roy S K 2018 Physical Review E 98(2), 022701.
- De Gennes [1973] De Gennes P 1973 Molecular Crystals and Liquid Crystals 21(1-2), 49–76.
- Doane et al. [1972] Doane J, Parker R, Cvikl B, Johnson D and Fishel D 1972 Physical Review Letters 28(26), 1694.
- Drozd-Rzoska et al. [2000] Drozd-Rzoska A, Rzoska S J and Zioło J 2000 Physical Review E 61(5), 5349.
- Halperin and Lubensky [1974] Halperin B and Lubensky T 1974 Solid State Communications 14(10), 997–1001.
- Halperin et al. [1974] Halperin B, Lubensky T and Ma S k 1974 Physical Review Letters 32(6), 292.
- Huster et al. [1987] Huster M, Stine K and Garland C 1987 Physical Review A 36(5), 2364.
- Johnson et al. [1975] Johnson D, Maze C, Oppenheim E and Reynolds R 1975 Physical Review Letters 34(18), 1143.
- K. Kobayashi [1970] K. Kobayashi K 1970 Journal of the Physical Society of Japan 29(1), 101–105.
- Karat and Madhusudana [1979] Karat P and Madhusudana N 1979 Molecular Crystals and Liquid Crystals 55(1), 119–133.
- Keyes et al. [1973] Keyes P, Weston H and Daniels W 1973 Physical Review Letters 31(10), 628.
- Kirkwood and Monroe [1941] Kirkwood J G and Monroe E 1941 The Journal of Chemical Physics 9(7), 514–526.
- Kobayashi [1971] Kobayashi K K 1971 Molecular Crystals and Liquid Crystals 13(2), 137–148.
- Lampe and Collings [1986] Lampe M W and Collings P J 1986 Physical Review A 34(1), 524.
- Longa [1986] Longa L 1986 The Journal of chemical physics 85(5), 2974–2985.
- Maier and Saupe [1960] Maier W and Saupe A 1960 Z. Naturforsch., 15a pp. 287–292.
- Marynissen et al. [1985] Marynissen H, Thoen J and Dael W V 1985 Molecular Crystals and Liquid Crystals 124(1), 195–203.
- McKee and McColl [1975] McKee T J and McColl J R 1975 Physical Review Letters 34(17), 1076.
- McMillan [1972] McMillan W 1972 Physical Review A 6(3), 936.
- McMillan [1971] McMillan W L 1971 Physical Review A 4(3), 1238.
- Mukherjee and Rzoska [2002] Mukherjee P K and Rzoska S J 2002 Physical Review E 65(5), 051705.
- Rananvare et al. [1987] Rananvare S, Pisipati V and Freed J 1987 Chemical physics letters 140(3), 255–262.
- Shashidhar and Venkatesh [1979] Shashidhar R and Venkatesh G 1979 Le Journal de Physique Colloques 40(C3), C3–396.
- Stine and Garland [1989] Stine K and Garland C 1989 Physical Review A 39(6), 3148.
- Thoen et al. [1984] Thoen J, Marynissen H and Van Dael W 1984 Physical review letters 52(3), 204.