The PRad Windowless Gas Flow Target
Abstract
We report on a windowless, high-density, gas flow target at Jefferson Lab that was used to measure , the root-mean-square charge radius of the proton. To our knowledge, this is the first such system used in a fixed-target experiment at a (non-storage ring) electron accelerator. The target achieved its design goal of an areal density of 21018 atoms/cm2, with the gas uniformly distributed over the 4 cm length of the cell and less than 1% residual gas outside the cell. This design eliminated scattering from the end caps of the target cell, a problem endemic to previous measurements of the proton charge radius in electron scattering experiments, and permitted a precise, model-independent extraction of by reaching unprecedentedly low values of , the square of the electron’s transfer of four-momentum to the proton.
keywords:
Hydrogen Target , Gas Target , Proton Charge Radius1 Introduction
The Proton Radius Experiment at Jefferson Lab (PRad) [1] carried out a precise measurement of an important quantity in physics, the root-mean-square (rms) charge radius of the proton, . Precise knowledge of has a wide-ranging impact: from our understanding of the structure of the proton in terms of its quark and gluon degrees of freedom, to our knowledge of the Rydberg constant – a fundamental constant of nature – due to the impact has on bound-state quantum electrodynamics (QED) calculations of atomic energy levels. The charge radius of the proton can be measured using two techniques. In the first, it is extracted from spectroscopic measurements of energy level differences of the hydrogen atom (e.g. the Lamb shift), combined with state-of-the-art quantum electrodynamics (QED) calculations. In the second method, utilized by PRad, is determined from the slope of the proton’s electric form factor , extracted from the electron-proton e-p elastic scattering cross section and extrapolated to zero momentum transfer. More formally, is given by
| (1) |
where is the square of the four-momentum transfer in e-p elastic scattering.
Historically, obtained from these two methods agreed within experimental uncertainties [2]. However, in 2010 was obtained for the first time from a measurement of the Lamb shift of muonic hydrogen, in which the electron of the H atom is replaced by the much heavier muon. The result was a factor of ten more precise than all previous measurements [3], but significantly smaller than previous measurements. Around the same time, a new electron scattering experiment was also performed with over 1400 data points at Mainz [4] and a new value of was extracted. Although the new result was more precise than previous scattering measurements, it was consistent with the old results, leading to a 7 discrepancy between the muonic hydrogen and regular hydrogen values of . This triggered the “proton charge radius puzzle” and led to major experimental and theoretical efforts to understand and/or resolve the discrepancy. In this regard, significant progress has been made in recent years. The latest Lamb shift results on regular hydrogen [5] favor the smaller value of indicated by muonic hydrogen. Likewise, the PRad result [1] also agrees with the muonic hydrogen .
The PRad experiment featured a number of innovations that made it the least model-dependent of all modern, high-precision electron scattering measurements of to date. First, utilizing a large-acceptance, high-resolution electromagnetic calorimeter (HyCal), it achieved the lowest ever observed for e-p scattering in a magnetic-spectrometer-free measurement. Additionally, the large acceptance of the calorimeter allowed coverage in that was wide enough to ensure the necessary extrapolation to in Eq. 1 was robust. The second innovation was the simultaneous detection of e-e (Møller scattering) and e-p elastic scattering in the same experimental acceptance. Doing so helped control systematic uncertainties associated with the beam-target luminosity to an unprecedented level. The third innovation, and the topic of this article, was a new hydrogen gas target that eliminated scattering from the end caps of the target cell, a problem common to previous electron scattering measurements of . Together, these innovative methods permitted a precise electron scattering measurement at unprecedentedly low values of , allowing for extraction of in a model-independent manner. The PRad result agrees with the muonic hydrogen results and gives support to the recently revised value for the Rydberg constant [6], one of the most accurately determined fundamental constants in nature.
Here we report on the design, construction, and performance of the windowless, cryo-cooled, continuous-flow hydrogen gas target that was used in the PRad experiment. The target incorporated a novel design feature of small apertures on the front and back surfaces of the target cell, such that the electron beam interacted almost exclusively with the hydrogen gas inside the cell. Gas that escaped through the apertures and into the accelerator beam line was removed by a number of high capacity vacuum pumps, reducing its density by three or more orders of magnitude. With this design, the target maintained an areal density of approximately hydrogen atoms/cm2 distributed uniformly over the 4 cm length of the target, while also minimizing the amount of material exposed to the beam outside the cell, a critical factor for reducing systematic uncertainties in the experiment.
2 Target Design and Construction
To detect the energy and scattering angle of electrons in both e-p and e-e scattering at very low values of Q2, the PRad experiment (Fig. 1) utilized HyCal, an electromagnetic hybrid calorimeter originally built for a precise measurement of the neutral pion radiative decay width by the PrimEx collaboration [7, 8, 9]. The angular resolution of the measurements was further improved using two gas electron multiplier (GEM) detectors directly in front of HyCal. Nevertheless, as the detectors were placed at very forward angles, it was not possible to reconstruct the scattering vertex with extreme precision. Furthermore, backgrounds are often a serious issue for very forward-angle electron scattering experiments because the cross section for many processes increases with decreasing scattering angle. These aspects made it critical to localize the hydrogen target sample to a relatively small volume free from any contaminants, including beam-entrance and beam-exit windows. At the same time, a highly accurate determination of the absolute target density was not necessary, thanks to the simultaneous measurement of e-e rates from Møller scattering alongside the elastic e-p rates. To this end, the PRad target was a sample of hydrogen gas flowing continuously through an open (windowless) target cell 4 cm long. The gas was cooled to cryogenic temperatures to increase its volumetric density inside the cell to about atoms per cm3, and the cell was specifically designed to create a large pressure difference between gas inside the cell and the surrounding beam line vacuum.
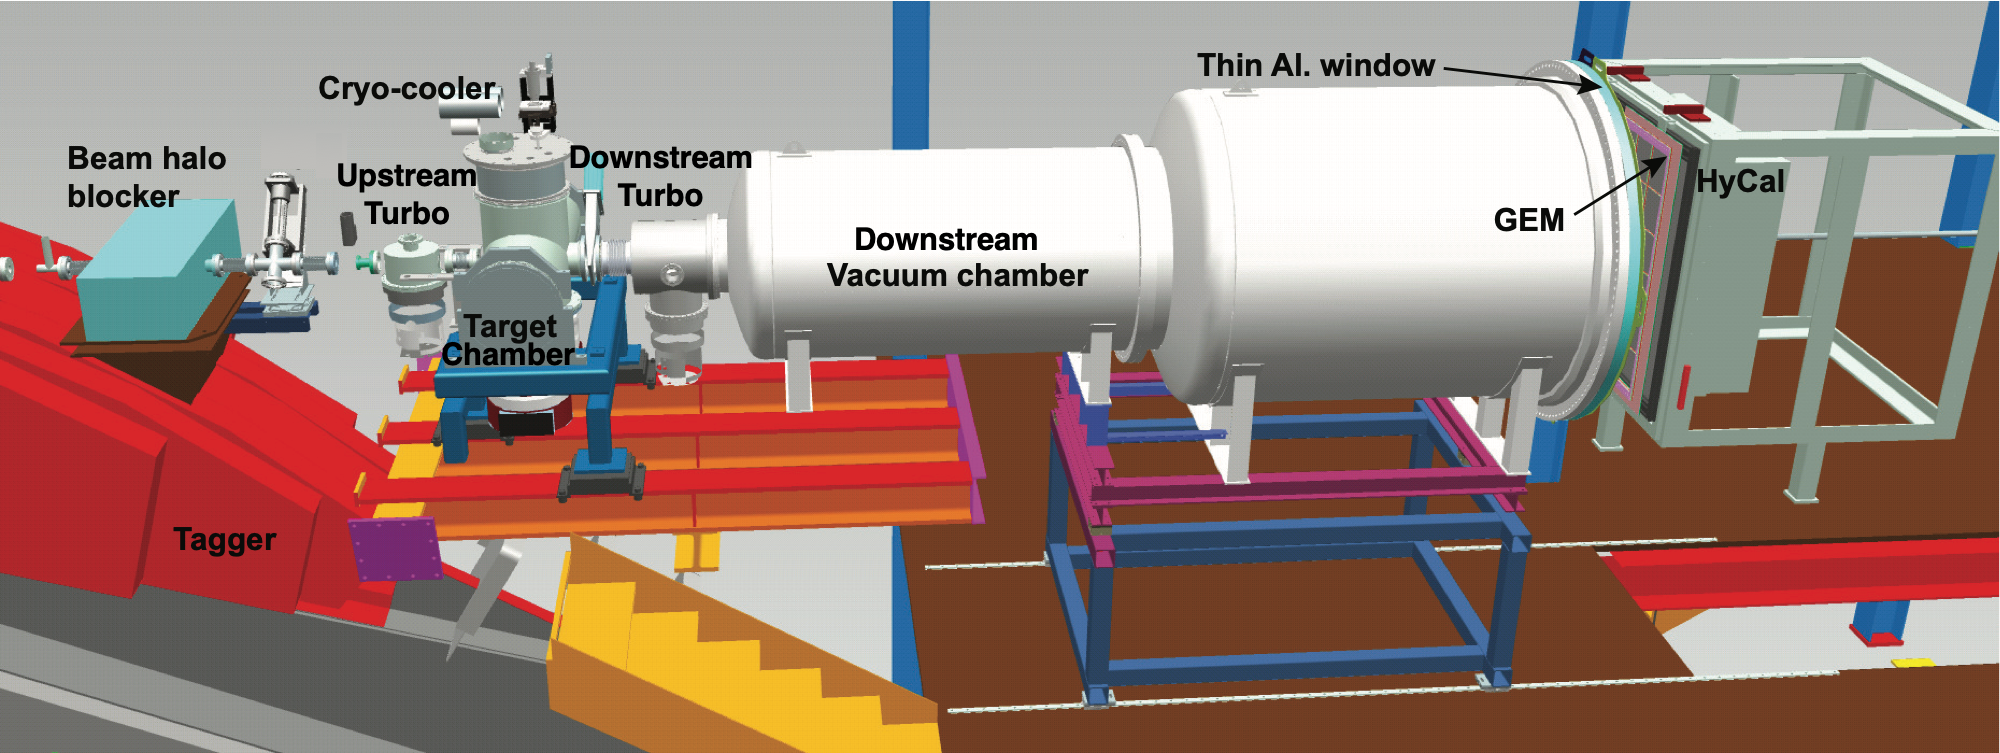
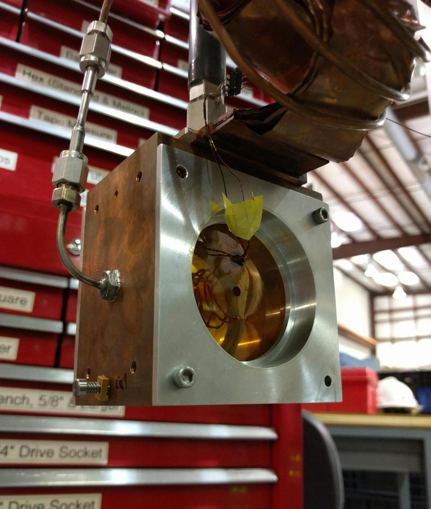
Figure 2 is a sectional drawing of the PRad target chamber and shows most of its major components. A photograph of the target installed on the Hall B beam line is shown on the left in Fig. 3. High-purity hydrogen gas (>99.99%) was supplied from a high-pressure cylinder located outside the experimental hall and metered into the target system via a 0–10 slpm mass flow controller. Using a pair of remotely actuated valves, the gas could be directed into the target cell for production data-taking, or into the top of the chamber for background measurements.
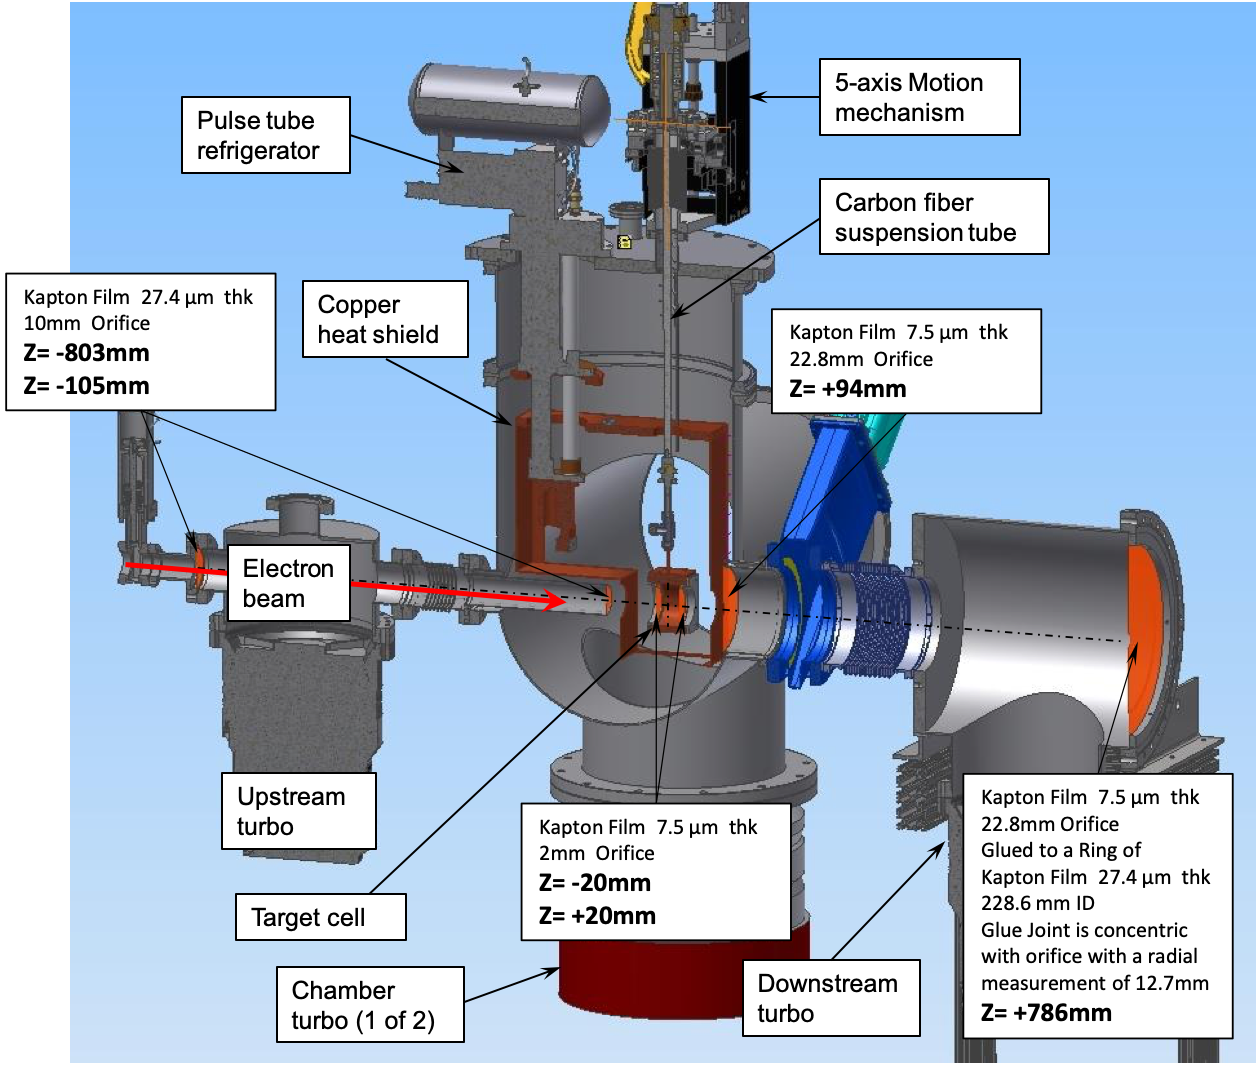
Before entering the cell, the gas was cooled to cryogenic temperatures using a two-stage pulse tube cryocooler (Cryomech model PT810) with a base temperature of 8 K and a cooling power of 20 W at 14 K. The cryocooler’s first stage served two purposes. It cooled a tubular, copper heat exchanger that lowered the hydrogen gas temperature to approximately 60 K. It also cooled a copper heat shield surrounding the lower temperature components of the target, including the target cell. The second stage of the cryocooler cooled the gas to its final operating temperature using a similar heat exchanger and cooled the target cell via a 40 cm long, flexible copper strap. The temperature of the second stage was measured by a calibrated cernox thermometer444Lake Shore Cryotronics and stabilized at approximately 15 K using a small cartridge heater and automated temperature controller. Without this, the hydrogen gas would condense or even freeze inside the second stage heat exchanger.
The target cell, shown on the right in Figure 3, was machined from a single block of C101 copper. Its outer dimensions were cm3, with a 6.3 cm diameter hole along the axis of the beam line. The hole was covered at both ends by 7.5 m thick polyimide foils held in place by aluminum end caps. Cold hydrogen gas flowed into the cell at its midpoint and exited via 2 mm holes at the center of either polyimide foil. The holes also allowed the electron beam to pass through the H2 gas without interacting with the foils themselves, effectively making this a “windowless” gas target. Compared to a long thin tube, the design of a relatively large target cell with small orifices had two important advantages. First, it produced a more uniform density profile along the beam path, allowing us to better estimate the gas density based upon its temperature and pressure. Second, it greatly reduced a potential source of background scattering. Rather than scattering from the 4 cm long copper cell walls, any “halo” electrons outside the primary beam radius could only scatter from the much thinner 7.5 m polyimide foils.

A second calibrated cernox thermometer, suspended inside the cell, provided a direct measure of the gas temperature. Approximately 50 cm of each of the thermometer’s four lead wires was coiled inside the cell to improve the thermal conduction between the thermometer and gas. The gas pressure was measured by a 0–10 torr capacitance manometer located outside the vacuum chamber and connected to the cell by a carbon fiber tube approximately one meter long and 2.5 cm in diameter. The same tube was used to suspend the target cell from a motorized, 5-axis motion controller which could position the target with a precision of about m. The motion controller was also used to lift the cell out of the beam in order to investigate possible scattering of beam halo from the polyimide windows. Finally, two 1 m thick carbon and aluminum foils were attached to the bottom of the copper target cell for background and calibration measurements.
High-speed turbomolecular pumps were used to evacuate the hydrogen gas as it left the target cell and maintain the surrounding vacuum chamber and beam line at low pressure. Two Pfeiffer HiPace 3400 magnetically levitated turbo pumps, each with a nominal pumping speed of 3000 l/s, were attached directly under the chamber, while two additional Pfeiffer HiPace 1500 turbo pumps with 1400 l/s speed each were used on the upstream and downstream portions of the beam line. A second capacitance manometer measured the hydrogen gas pressure inside the target chamber, while cold cathode vacuum gauges were utilized in all other locations. While the response of capacitance manometers was independent of the gas species being measured, the cathode gauge readings required correction for the ionization energy of hydrogen, made according to the manufacturer’s specifications.
As illustrated in Fig. 2, additional polyimide orifices were installed at various locations to limit the extent of target (hydrogen) gas along the path of the beam. With this design, the density of gas decreased significantly outside the target cell, with an estimated 99% of scattering occurring within the 4 cm length of the cell (Sec 4.1). For obvious reasons of safety, the hydrogen exhausted from all vacuum pumps was vented outside the experimental hall. A continuous flow of nitrogen gas was also added to the vent line to prevent the formation of a combustible mixture of hydrogen and oxygen.
3 Target Performance
The temperature and pressure of H2 gas flowing through the PRad target cell, as well as the resulting areal density, are shown as a function of flow rate in Fig. 4. For these measurements, the temperature of the cryocooler was regulated at 15 K. At lower temperatures, target operation became unstable as hydrogen condensed and eventually froze inside the second stage heat exchanger. The cernox thermometer inside the cell had a calibration accuracy of mK, while the accuracy of the capacitance manometer was torr. No attempt was made to determine temperature gradients within the cell. The pressure difference between cold gas in the cell and room temperature gas in the manometer was estimated using the correlation function [11]:
| (2) |
and was less than 0.2% under all measured conditions. Here and are the pressures and temperatures of the gas at the High and Low temperature ends of the connecting tube of radius , expressed in Pa, K, and m, respectively.
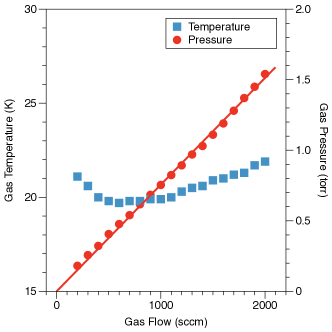

As shown in Fig. 4, the temperature of the gas inside the cell was largely independent of flow rate, while the pressure increased in a linear manner. This is the expected behavior of a compressible, near-ideal gas flowing through an orifice of diameter , where the mass flow rate can be written as [12]
| (3) |
Here is the density of the gas on the upstream side of the orifice, and and are its pressures on the upstream and downstream sides, respectively. is the discharge coefficient (about 0.6 for an orifice with sharp edges), is the ratio of the orifice diameter to the upstream pipe diameter, and is the expansibility factor for small-bore orifices [13],
| (4) |
with the ratio of the gas’s specific heats. For hydrogen gas at the PRad operating conditions, . Taking , , and , Eq. 3 reduces to the linear relationship between pressure and flow that is seen in Fig. 4. The red curve in Fig. 4 was generated using Eq. 3 to calculate the flow of H2 gas through two 2 mm orifices at the measured pressures and temperatures and using a discharge coefficient .
4 Target Operation
Data collection during the PRad experiment was typically broken into one hour segments, or “runs”, with the target operating in one of the four configurations illustrated in Fig. 5. Production data for measuring the proton charge radius utilized configuration (a), in which high-density H2 gas flowed through the target cell while the surrounding vacuum chamber and beam line were filled with lower-density gas escaping from the cell. The performance the target in this configuration is described in Sec. 4.1. Configurations (b)–(d) were utilized to examine scattering of electrons from material other than hydrogen atoms in the target cell and are the subject of Sec. 4.2.

4.1 Production Run Performance
All production runs for measuring were made with 600 sccm H2 gas flowing through the target cell, giving pressure and temperature measurements of about 0.47 torr and 19.5 K, respectively. The resulting gas density was 0.78 g/cm3 [14], which corresponded to a cm-2 areal density of hydrogen atoms within the 4 cm long cell. The performance of the target throughout all 110 production runs is shown in Fig. 6. During the course of any one hour run, the gas temperature and pressures varied by less than one percent, although fluctuations up to a few percent between runs can be seen in Fig. 6. These occurred following long periods of operation with other target configurations but had no impact on the extracted value of because the e-p elastic scattering rates were always normalized to the Møller scattering rates.


Gas pressures measured in other regions of the beam line (“residual gas”) were two-to-four orders of magnitude lower than the cell pressure (Table 1). The greatest quantity of residual gas along the beam path was inside the 4 m long downstream vacuum chamber (Fig. 1). Here the pressure was slightly higher than at the downstream turbo pump, presumably due to outgassing or leaks in the chamber. This can be greatly reduced in future installations by additional pumping on the chamber or reducing the 22.9 mm orifice at the chamber’s entrance (see Fig.2).
Table 1 indicates that approximately 99% of all hydrogen in the beam’s path was constrained within the 4 cm length of the target cell. Because the pressure sensors were mounted several centimeters from the beam axis, the values in Table 1 could not be utilized to accurately correct for the presence of the residual gas. Instead, these corrections were made using the background measurements described below. In addition, the COMSOL Multiphysics® modelling software was used to simulate the density of H2 gas flowing through the target system and beam line in configurations (a) and (b) (Figure 7). Additional studies, including simulations with various density profiles outside the target cell, were performed, and systematic uncertainties were assigned to account for the presence of the residual gas [15]. This, along with halo scattering contributed a systematic uncertainty of less than 0.5% [16] to the extracted value of .
| Beam Line | Length | Pressure | Thickness | Percentage |
|---|---|---|---|---|
| Region | (cm) | (torr) | (atoms/cm2) | of total |
| Target Cell | 4 | 0.47 | 99.06 | |
| US Beam line | 300 | 0.02 | ||
| US Turbo | 71 | 0.01 | ||
| Target Chamber | 14 | 0.11 | ||
| DS Turbo | 71 | 0.07 | ||
| DS Chamber | 400 | 0.72 |

4.2 Background Measurements
The target configurations (b), (c), and (d) shown in Fig. 5 were used to study sources of background in the PRad measurements, that is, electrons that scattered from material other than hydrogen atoms inside the target cell. In configuration (b), the hydrogen gas flow was kept at 600 sccm but was admitted directly into the target chamber rather than the target cell. Thus, all scattering sources along the beam path were the same as in production runs except for gas inside the cell, which was reduced more than three orders of magnitude. The resulting charge-normalized data rates for e-p and e-e (Møller) scattering made with background configuration (b) were then subtracted from the full-cell measurements to isolate scattering from hydrogen atoms within the target cell. Configurations (c) and (d) were used to better understand the origin of background events. There was no gas flowing into the system in either configuration, and the only difference was the location of the target cell. The cell remained in the beam path in (c) but was lifted in (d), thus removing the cell windows as a possible source of background.
Scattering rates for each of the three background configurations are plotted as a function of reconstructed electron scattering angle in Fig. 8. These measurements were made at a 2.2 GeV beam energy and normalized to the production scattering rates measured with configuration (a). All rates display prominent peaks at very forward angles, indicating the greatest sources of background scattering were near or upstream from the target cell. As expected, the rates from configuration (b) were the greatest, since they included all sources of background scattering, including residual hydrogen gas in the beam line. The background contribution from this residual gas can be determined from the difference (b)-(c) and is seen to be approximately 1%, consistent with the results shown in Table 1.
Rates for configurations (c) and (d) are similar, which indicates little background from the target cell windows. We conclude that the majority of the background (6–8%) came from halo scattering from beam line elements other than the target and was likely produced by the upsteam Beam Halo Blocker seen in Fig. 1, a 12.7-mm diameter collimator designed to reduce the intrinsic size of the halo.

5 Summary
We have described a new hydrogen gas target utilized in PRad, an electron scattering measurement of the root-mean-squared charge radius of the proton conducted at Jefferson Lab. The target design eliminated the beam entrance and exit windows that have constituted major sources of background scattering in previous measurements from electron scattering. Together with other innovative instrumentation and measurement techniques, the target permitted a precise and model-independent extraction of from e-p elastic scattering. This target will be used in a newly approved PRad-II [17] experiment at JLab that will improve the proton charge radius measurement by a factor of nearly four compared with the PRad experiment. The apparatus described here is also compatible with practically any noncorrosive target gas (deuterium, helium, argon, neon, etc.), and can be used in other experiments where such a target system is advantageous.
Acknowledgements
This work was funded in part by the US National Science Foundation (NSF MRI PHY-1229153) and by the US Department of Energy (contract number DE-FG02-03ER41231), including contract number DE-AC05-06OR23177, under which Jefferson Science Associates, LLC operates the Thomas Jefferson National Accelerator Facility. We thank the staff of Jefferson Laboratory, in particular the Jefferson Lab Target Group, for their support throughout the experiment. We are also grateful to all grant agencies for providing funding support to the authors throughout this project.
References
- [1] W. Xiong et al., Nature 575, 147 (2019).
- [2] P.J. Mohr, B.N. Taylor, Rev. Mod. Phys. 80, 633 (2008).
- [3] R. Pohl et al., Nature 466, 213 (2010).
- [4] J. C. Bernauer et al., Phys. Rev. Lett. 105, 242001 (2010).
- [5] N. Bezginov et al., Science 365 (6457), 1007–1012 (2019).
- [6] P.J. Mohr, D.B. Newell, and B.N. Taylor, CODATA recommended values of the fundamental physical constants: 2018. http://physics.nist.gov/constants (2019).
- [7] A. Gasparian Proc. XI Int. Conf. Calorim. Part. Phys. 1, 109 (2004).
- [8] I. Larin et al., Phys. Rev. Lett. 106, 162303 (2011).
- [9] I. Larin, Y. Zhang et al., Science 368 (6490), 506–509 (2020).
- [10] A. Gasparian, D. Dutta, H. Gao, M. Khandaker et al. E12-11-106, Proposal to Jefferson Lab PAC 39, 2012.
- [11] P.P.M. Steur, B. Fellmuth, and O. Tamura, Guide to the Realization to the ITS-90: Interpolating Constant-Volume Gas Thermometry, Bureau International des Poid et Mesures (2015).
- [12] ISO 5167-1:2003, Measurement of fluid flow by means of pressure differential devices inserted in circular cross-section conduits running full - Part 1: General principles and requirements, International Organization for Standardization (ISO), 1 March 2003.
- [13] E. Buckingham, Bureau of Standards Journal of Research, 9, 459 (1932).
- [14] National Institute of Standards and Technology website, Thermophysical Properties of Fluids, https://webbook.nist.gov/chemistry/fluid/.
- [15] W. Xiong, Ph.D. thesis, Duke University, May 2020.
- [16] W. Xiong et al., Nature 575, 147 (2019) Supplementary information.
- [17] Jefferson Lab Proposal PR12-20-004, “PRad-II: A New Upgraded High Precision Measurement of the Proton Charge Radius”, Spokespersons: D. Dutta, H. Gao, A. Gasparian (contact), K. Gnanvo, D. Higinbotham, N. Liyanage, E. Pasyuk, and C. Peng.