ALMA Observations of Giant Molecular Clouds in M33. III.:
Spatially Resolved Features of the Star-Formation Inactive Million-solar-mass Cloud
Abstract
We present 12CO ( = 2–1), 13CO ( = 2–1), and C18O ( = 2–1) observations toward GMC-8, one of the most massive giant molecular clouds (GMCs) in M33 using ALMA with an angular resolution of 044 027 (2 pc 1 pc). The earlier studies revealed that its high-mass star formation is inactive in spite of a sufficient molecular reservoir with a total mass of 106 . The high-angular resolution data enable us to resolve this peculiar source down to a molecular clump scale. One of the GMC’s remarkable features is that a round-shaped gas structure (the Main cloud) extends over the 50 pc scale, which is quite different from the other two active star-forming GMCs dominated by remarkable filaments/shells obtained by our series of studies in M33. The fraction of the relatively dense gas traced by the 13CO data with respect to the total molecular mass is only 2%, suggesting that their spatial structure and the density are not well developed to reach an active star formation. The CO velocity analysis shows that the GMC is composed of a single component as a whole, but we found some local velocity fluctuations in the Main cloud and extra blueshifted components at the outer regions. Comparing the CO with previously published large-scale H i data, we suggest that an external atomic gas flow supplied a sufficient amount of material to grow the GMC up to 106 .
1 Introduction
Giant molecular clouds (GMCs) are the fundamental cradles of star formation (see the review by e.g., Fukui & Kawamura 2010, and Heyer & Dame 2015). The formed stars, especially high-mass stars, eventually destroy and deform the parental molecular clouds, and provide metal-rich ingredients; thus the lifecycle likely controls the galaxy evolution itself. A wide-field CO imaging along the Milky Way (MW, e.g., Dame et al. 2001; Jackson et al. 2006; Nishimura et al. 2015; Umemoto et al. 2017; Su et al. 2019) is a powerful tool to fully resolve GMCs spatially. However, investigating individual targets alone provides us only a snapshot of the evolutionary sequence, and thus comprehensive studies throughout a galaxy outside the Milky Way, which does not suffer from the contamination problem at the line of sight and the distance ambiguity, have great advantages to compile a large number of GMC sample uniformly.
Some of the comprehensive CO surveys toward the Local group of galaxies, especially the Large Magellanic Cloud (LMC), revealed a GMC scale resolution (40 pc) view and derived an evolutionary track of the GMC (Fukui et al., 1999, 2008; Kawamura et al., 2009). One striking result in the LMC is that a large fraction (1/4) of the GMCs does not harbor any bright H ii regions, indicating that the evolutionary stage is likely in an early phase prior to high-mass star formation (hereafter, starless GMC). These starless GMCs are supposed not to be exposed to any stellar feedback and thus they are suitable targets to investigate the initial condition of not only star formation but also molecular cloud formation.
Observational studies in the ALMA era enabled us to reveal the substructure of molecular clouds in the Magellanic Clouds (e.g., Indebetouw et al., 2013; Fukui et al., 2015, 2019; Muraoka et al., 2017; Saigo et al., 2017; Naslim et al., 2018; Sawada et al., 2018; Tokuda et al., 2019; Wong et al., 2019) with a size scale of 0.1–100 pc. The pilot CO studies toward individual targets found that the active star-forming regions show well-developed structures, such as cores/filaments, whereas some of the inactive star-forming regions show a diffuse/extended feature (Sawada et al., 2018).
More distant galaxies are also vital targets to comprehensively understand the picture of star/molecular cloud formation. Although the achievable spatial resolution is more than 10 times coarser than that in the Magellanic clouds, the Triangulum Galaxy (M33) provides us with a unique laboratory located nearest to us, 840 kpc (Freedman et al., 2001), among similar targets accessible from the ALMA site. The flocculent spiral galaxy, M33, has the potential to investigate the effects of the complex gas dynamics on star formation and galaxy evolution (Wada et al., 2011), which may not be achieved by studies of grand design spiral galaxies, such as M51. Our M33 observations with the ALMA found giant molecular filaments whose length is more than 50 pc along one of the stellar spiral arm (Tokuda et al. 2020, hereafter Paper I). In addition to this, there is the highly active star-forming GMC at a vicinity of NGC 604, which contains the largest H ii region in the Local Group of galaxies, enabling us to study such an extreme star formation (Muraoka et al. 2020, hereafter, Paper II).
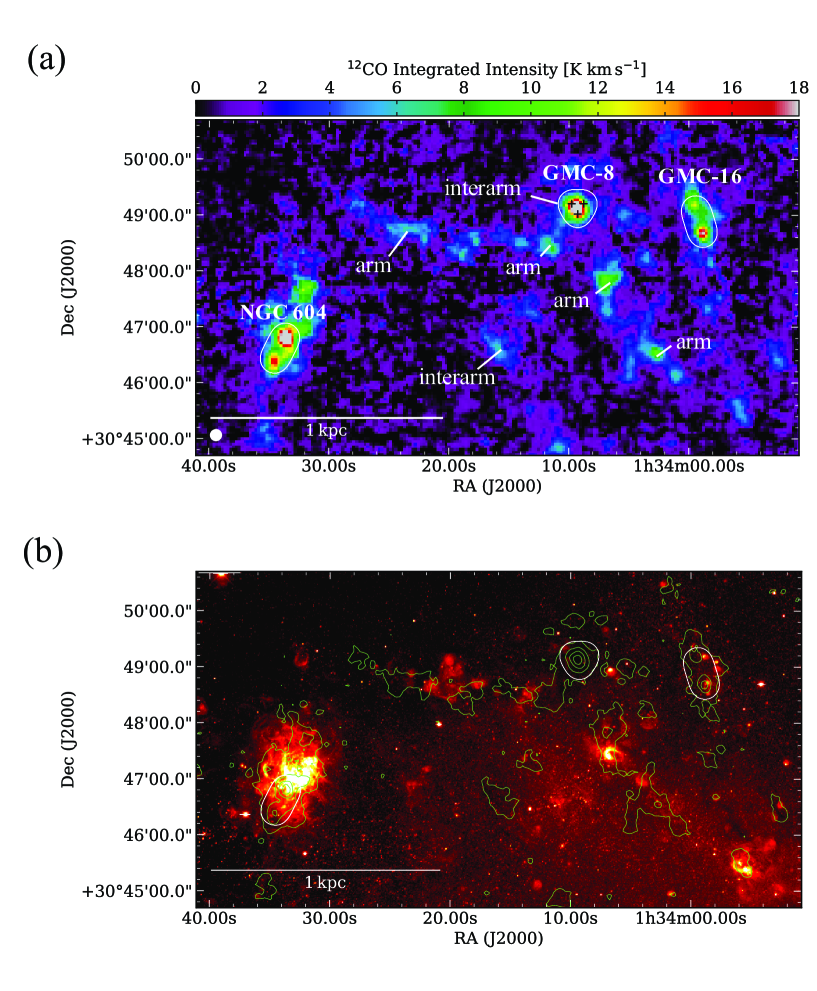
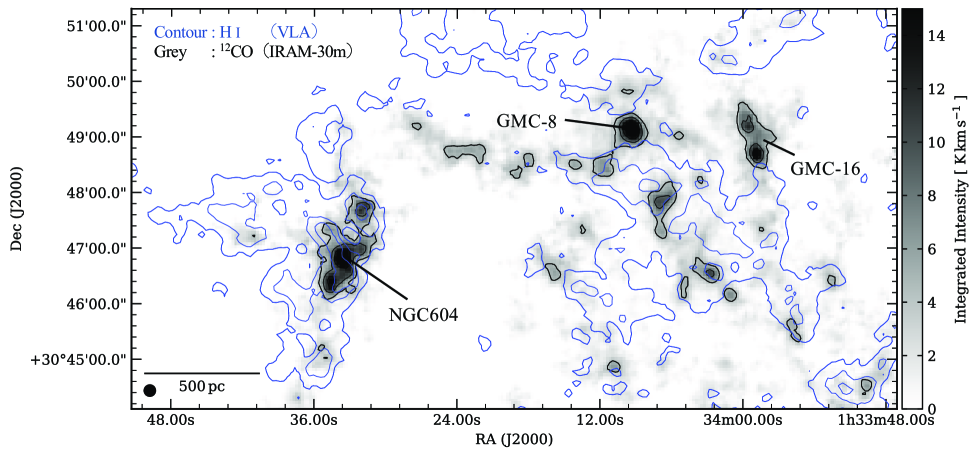
Our target object in this study is GMC-8 (Figure 1) cataloged by the ASTE 12CO (3–2) survey of Miura et al. (2012). The GMC corresponds to the cloud number of 245 from the IRAM 12CO (2–1) survey by Gratier et al. (2012) (see also the 12CO (1–0) observations, Rosolowsky et al. 2007; Onodera et al. 2010; Tosaki et al. 2011). This cloud has the strongest emission in 12CO (1–0), inferring that GMC-8 is one of the most massive among more than 250 GMCs in M33. The molecular mass of GMC-8 is 106 based on the 12CO luminosity. Miura et al. (2012) reported that the star-formation activity of this cloud is inactive, indicating that the GMC is presumably an exception in the galactic-scale perspective, i.e., the Kennicutt–Schmidt law (Schmidt, 1959; Kennicutt, 1998; Kennicutt & Evans, 2012). The previous infrared/optical observations found 24 m (Verley et al., 2007) and H (Hodge et al., 1999) sources toward this GMC (see also Section zr3.1), but Gratier et al. (2012) did not categorize GMC-8 as an exposed star formation phase based on their extreme faintness feature compared to the other active star-forming GMCs. Rosolowsky et al. (2007) labeled its location as the interarm region of the northern M33 (see Figure 1), and thus the environment may be relevant to the inactive nature of star formation. Such a starless GMC is highly rare in the Milky Way. A few examples in the solar neighborhood are the Maddalena’s cloud (Maddalena & Thaddeus, 1985) and the Cygnus OB7 GMC (Dobashi et al., 1994, 1996), which are less massive than GMC-8 (see also Sect. 4.1). Numerical simulations of GMC formation suggest that the converging flow of H i gas (Hennebelle & Péraut, 1999; Koyama & Inutsuka, 2004; Inoue & Inutsuka, 2009) makes a large amount of molecular materials whose mass is 104 (Inoue & Inutsuka., 2012); meanwhile, the typical cross section in these simulations is 10 pc by 10 pc, which suggests that drastic flows with 100 pc scales are required to be 106 . Semianalytic studies of the GMC mass function (e.g., Kobayashi et al., 2018) also suggest that it is not easy to produce more than 105 clouds within a GMC lifetime via converging flows with a typical condition. Therefore GMC-8 in M33 is a vital target to explore the formation mechanism of massive GMCs.
This paper presents our new ALMA CO data of GMC-8 (Sect. 2) with a spatial resolution of 1 pc and investigates its resolved physical properties (Sect. 3). In this study, we discuss the formation of GMC-8 as a very massive GMC by combining the previously obtained large-scale CO and H i maps (Sect. 4).
2 The Data
We conducted ALMA Band 6 (211–275 GHz) observations toward three GMCs in M33 using the ALMA 12 and the 7 m array of the Atacama Compact Array (ACA) in Cycle 5 (P.I.: K.Muraoka #2017.1.00461.S). The observation details and data reduction process were described in Paper I. Here we briefly summarize the observation settings and the data qualities for GMC-8. Three pointing observations at the central coordinates of (, ) = (1h34m0927, +30°49″012), (1h34m0877, +30°49″124), and (1h34m0977, +30°49″124) made a triangular-shaped coverage, as shown in Figure 1. The target molecular lines were 12CO ( = 2–1), 13CO ( = 2–1), and C18O ( = 2–1). The wavelength of the continuum band is 1.3 mm with a sensitivity of 0.02 mJy beam-1.
We combined the 12 m and 7 m array data with the feathering task. The beam size of the 12CO combined data is 042 026 (1.7 pc 1.0 pc), and the rms noise level is 0.9 K at a velocity resolution of 0.2 km s-1. We estimated the missing flux of the 12CO ALMA data in GMC-8 by comparing with the single-dish IRAM 30 m data (Druard et al., 2014). The total missing flux across the observed field is 30%, and thus we additionally combined the ALMA and the IRAM data using the feathering technique. We note that because the velocity resolution of the IRAM data, 2.6 km s-1, is much coarser than that of the ALMA data, we use the ALMA data alone for analyses that require a high-velocity resolution (see the captions in each figure).
We made moment-masked cube data (e.g., Dame, 2011; Nishimura et al., 2015) to suppress the noise effect. We set the emission-free pixels, which are determined by significant emission from the smoothed data in the velocity/spatial axes, as zero values. We used the processed data to make moment maps of 12CO and 13CO.
3 Results
3.1 Spatial Distributions and Physical Properties of GMC-8 in 12CO and 13CO
Figure 2 shows the velocity-integrated intensity map (moment 0) of 12CO( = 2–1) and 13CO( = 2–1). One of the remarkable features in the 12CO map (panel(a)) is a widely extended and round-shaped structure with a diameter of 50 pc as indicated by the magenta dashed circle in the figure. We call this structure as the Main cloud hereafter. It has a relatively sharp boundary at the western side, although it extends outward with several arm-like features in the other directions. The peak integrated intensity is 60 K km s-1, corresponding to an H2 column density of 2 1022 cm-2 if we assume a constant 12CO( = 2–1)/12CO( = 1–0) ratio of 0.5, obtained from the single-dish data (Tosaki et al., 2011; Druard et al., 2014), and the factor of 4 1020 cm-2 (K km s-1)-1 (Druard et al., 2014). The total mass integrated within the observed field (hereafter ) is 4106 , which is consistent with the previous studies (Druard et al., 2014).
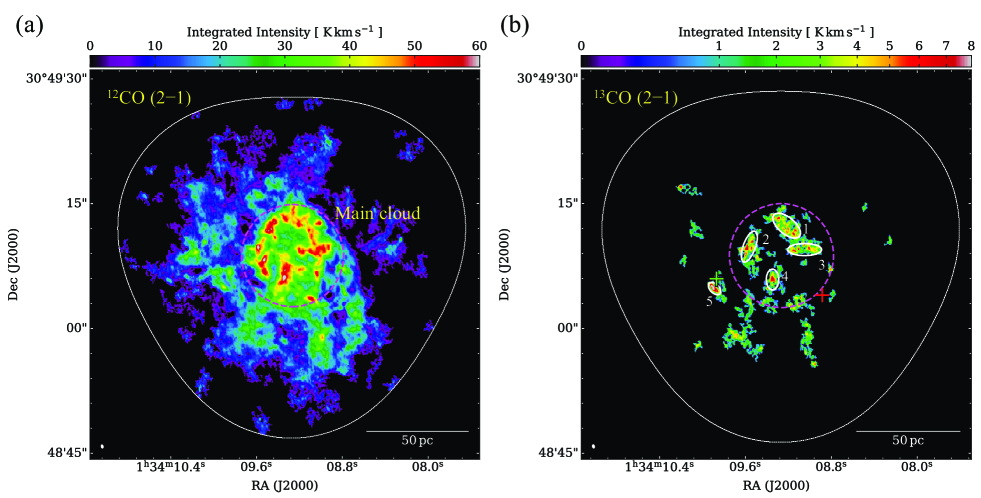
In contrast to 12CO, the 13CO moment 0 show a clumpy distribution throughout the observed field. As one can see, there are 20 spatially isolated components, and we call these objects as CO clumps. The intensities of the 13CO clumps are 2–10 K km s-1, which are at most one-tenth lower than that of the two active star-forming GMCs (Paper I for GMC-16, and Paper II for NGC 604 GMC). We selected five bright clumps whose peak 13CO intensity exceeds 5 K km s-1, corresponding to the column density of 1.51021 cm-2, as as indicated in Figure 2(b). We derived the size of the 13CO clumps by 2D Gaussian fittings at each clump in the image plane within the regions at a more than 3 contour. Table 1 gives the physical properties of the 13CO clumps. The intensity and typical sizes are similar to Galactic low-mass star-forming regions, such as Taurus, Chamaeleon, and Aquila (Mizuno et al., 1995, 1999; Kawamura et al., 1999), and a Planck Cold Cloud in the LMC (Wong et al., 2017), traced by their 13CO observations with a similar angular resolution. To characterize these clumps, we estimated the H2 column density assuming the local thermodynamic equilibrium with a uniform excitation temperature of 10 K and a relative [H2]/[13CO] abundance of 1.4 106 (see also Paper I, II). The mean column densities and masses () are (3–5) 1021 cm-2 and (2–10) 103 .
| Source ID | R.A. | Decl. | Size | Virial Mass | |||||
|---|---|---|---|---|---|---|---|---|---|
| (J2000.0) | (J2000.0) | (pc) | (km s-1) | (km s-1) | (cm-2) | (cm-2) | () | () | |
| clump-1 | 01 34 09.22 | 30 49 12.19 | 205.8 | 247.7 | 5.7 | 31021 | 11022 | 4104 | 1104 |
| clump-2 | 01 34 09.57 | 30 49 09.72 | 9.13.3 | 247.8 | 5.1 | 41021 | 11022 | 2104 | 4103 |
| clump-3 | 01 34 09.06 | 30 49 09.76 | 188.5 | 242.4 | 4.7 | 31021 | 81021 | 3104 | 5103 |
| clump-4 | 01 34 09.34 | 30 49 05.86 | 7.33.3 | 257.3 | 4.4 | 41021 | 91021 | 1104 | 2103 |
| clump-5 | 01 34 09.89 | 30 49 04.82 | 5.41.8 | 251.7 | 2.3 | 51021 | 21022 | 2103 | 3103 |
Note. — (1) Central velocity. (2) Velocity width of 13CO( = 2–1) emission. (3) Mean of H2 column density. (4) Peak of H2 column density. (5) Virial mass calculated from the following formula, = , where is the geometric mean of the source size. (6) Total LTE mass within each clump.
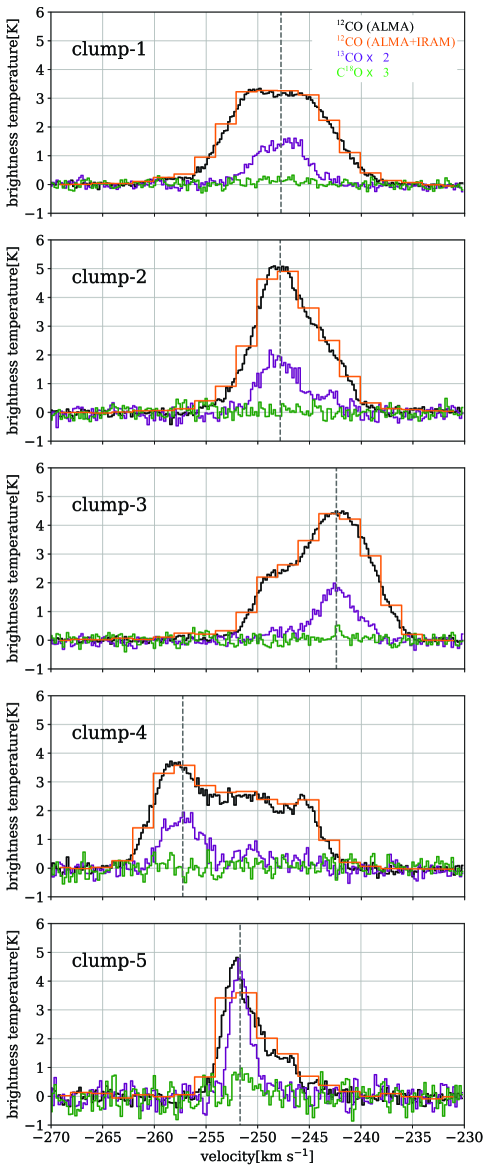
For each selected 13CO clump, we performed the average scheme within the regions showing significant 13CO emission above 3 to obtain the representative spectra. Figure 3 show the 12CO, 13CO and C18O spectra. The subsequent Gaussian fitting to the 13CO spectra determined their central velocity () and velocity width in FWHM (). The has a large variety from 257 km s-1 to 242 km s-1. Although the 13CO profiles have a Gaussian shape, some 12CO spectra show complex profiles, which likely have multiple velocity components. The averaged analysis allows us to search weak C18O emission at the clumps. At clump-3, we found significant C18O emission, whose peak velocity is similar to that of 13CO. The detection of C18O with more than 3 noise level of the average spectra implies the presence of dense molecular materials with the density of 104 cm-3. At clump-5, we found marginal C18O emission and the highest 13CO integrated intensity in the observed field (see Figure 2). The (column) density peak presents at the region close to the GMC edge instead of an inner side of the Main cloud.
The integrated total in the observed field (hereafter ) is 6 104 . The mass ratio (/) is 2%, which is remarkably lower than that of the other star-forming GMCs in M33 (Table 2, see also Paper I, II) and the Galactic plane average of 24% (Torii et al., 2019). This result shows that the relatively dense gas fraction with respect to the total molecular gas is not high compared to the other targets, and consistent with nondetection of 1.3 mm and C18O emission tracing 104 cm-3 dense gas at this resolution/sensitivity.
| GMC Name | C18O Detection | 1.3 mm Detection | / | ||
|---|---|---|---|---|---|
| () | () | ||||
| GMC-16 | Y | Y | 2 106 | 2 105 | 0.1 |
| NGC 604 GMC | Y | Y | 3 106 | 3 105 | 0.1 |
| GMC-8 | N | N | 4 106 | 6 104 | 0.02 |
Note. — (1) Total molecular gas mass derived from the 12CO ( = 2–1) luminosity assuming the factor of 4 1020 cm-2 (K km s-1)-1. Based on the single-dish data, we applied 12CO ( = 2–1)/12CO ( = 1–0) ratios of 0.7 for GMC-16, 0.85 for NGC 604 and 0.5 for GMC-8. (2) LTE mass derived from the 13CO ( = 2–1) data. (3) Smoothing analysis toward some of the selected 13CO clumps shows significant C18O emission (see the text).
Figure 4 shows the velocity dispersion, (moment 2), map and the peak brightness temperature map in 12CO. The GMC center shows a higher velocity dispersion than the outer parts. In the Main cloud, the FWHM line width of the average spectra is 11 km s-1 derived by the Gaussian fitting. We will describe the velocity structure further in the next subsection (Sect. 3.2). The peak brightness temperature (panel (b)) ranges from a few to 8 K, suggesting that the excitation temperature is low (10 K). In contrast to this, the most active star-forming complex, NGC 604, shows much higher temperature of 40 K (Paper II), indicating that GMC-8 currently does not harbor any remarkable heating sources. Although the edge of the Main cloud has a higher brightness temperature in the field, these regions are apart from the faint 24 m and H sources (Figure 2(b)). Note that the position accuracy of the two data sets, 3″for 24 m (Rieke et al., 2004) and 05 for H (see Hoopes & Walterbos 2000; Bailer-Jones et al. 2018), does indicate that they are outside of the Main cloud.
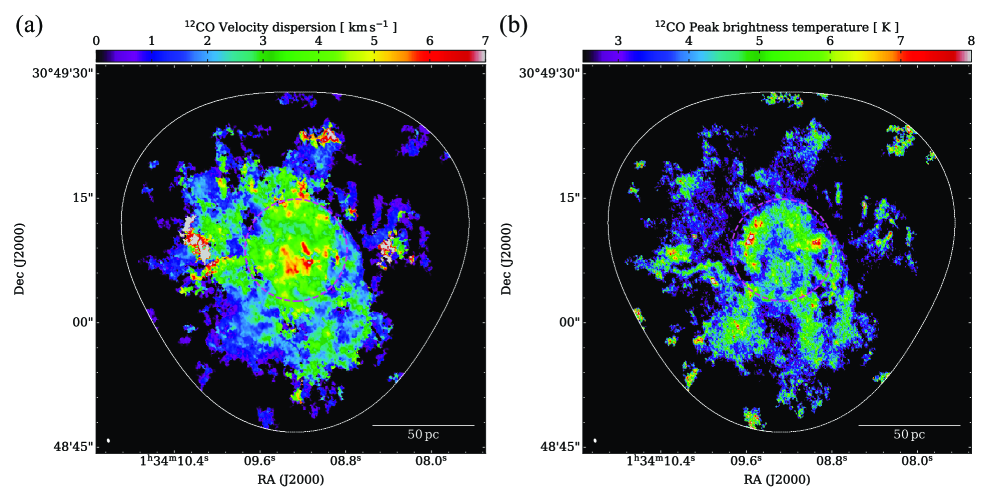
The magenta dashed circle is the same as that in Figure 2. The white ellipse in the lower left corner shows the angular resolution. The white line shows the field coverage of the ALMA observations. (b) Same as (a) but for the peak brightness temperature map of the 12CO ( = 2–1) data.
3.2 Velocity Structures of GMC-8
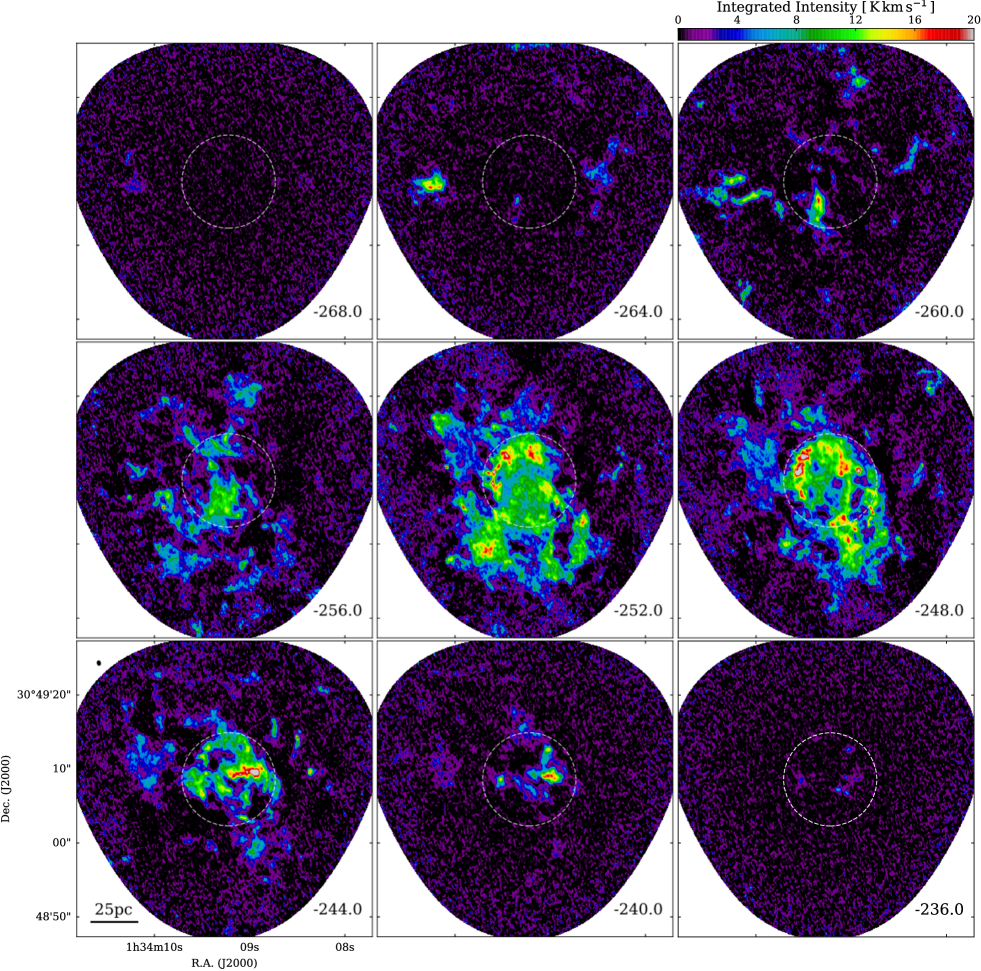
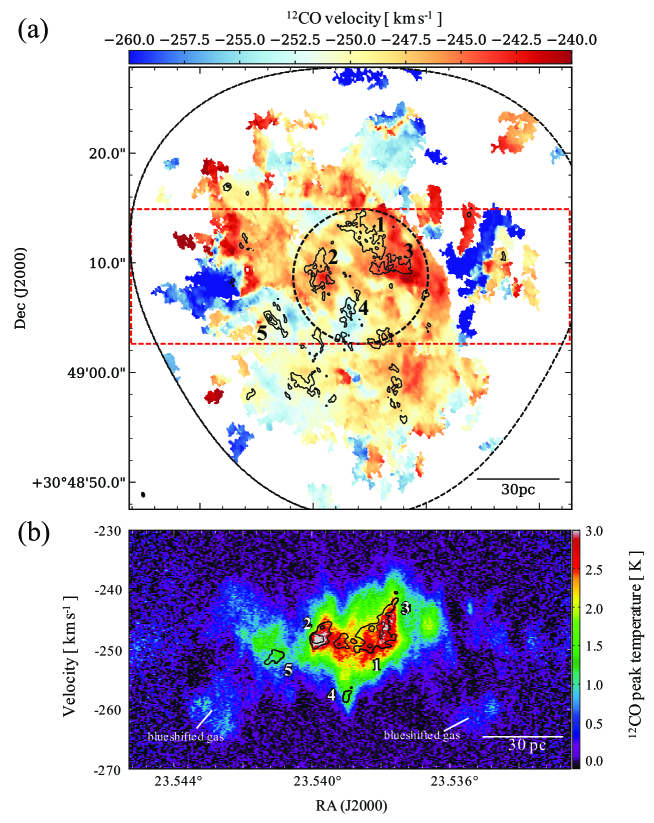
The velocity channel maps of 12CO in Figure 5 show that the emission are continuously distributed over the velocity range of 268 – 236 km s-1. Figure 6 shows the intensity-weighted velocity (moment1) map. Toward the Main cloud, panel (a) shows that there is no velocity jump larger than 5 km s-1 (see also panel (b)). If there are more than two velocity components, the velocity maps show opposite results, i.e., a drastic velocity gap in moment 1 and a large dispersion in moment 2.
We made the 12CO position-velocity (PV) diagram in the horizontal direction along the Main cloud to explore the velocity structure further (Figure 6(b)). Although we see some velocity fluctuations, the Main cloud shows an almost single velocity component with the velocity width of 10–20 km s-1. We thus conclude that the Main cloud is almost composed of a single velocity component. However, at the western and eastern side of the Main cloud, there are notable blueshifted components whose velocity is 260 km s-1, as appeared in Figure 6(b). We confirmed large differences at most 15 km s-1 among the centroid velocities of 13CO clumps (Sect. 3.1). The 13CO contours on the PV diagram in Figure 6(b) demonstrate that clump-4 and -5 are at the edge of the 12CO emission rather than centrally concentrated along with the 12CO intense velocity range. We discuss these velocity features and the possibility that more than two velocity gas streams develop in the massive cloud in Sect. 4.2.
4 Discussion
4.1 Comparisons with Other Massive GMCs in the Local Group
As mentioned in the introduction, GMC-8 is one of the most massive GMCs in M33. The GMC belongs to a series of extremely massive clouds in the Local group of galaxies at least in terms of its total H2 mass. This section summarizes previous studies of massive GMCs in the MW, LMC, and M33 from the literature, and then compares their physical properties and those of GMC-8. Table 3 shows the characteristics of massive GMCs based on the CO or its isotopologue observations with an angular resolution of 1–40 pc and a velocity resolution of 0.1–0.6 km s-1. The massive GMCs, whose molecular gas mass exceeds 106 in the MW, actively form high-mass stars almost exclusively. The Maddalena’s cloud and Cygnus OB7 are rare clouds as quiescent GMCs, which are hard to find within 1 kpc from the Sun.
The sizes and velocity widths do not differ greatly among these GMCs except for a relatively narrow line width in Cygnus OB7. We found a marginal indication of a higher line width in GMC-8. If the observational bias artificially produces such a feature, this effect should be more pronounced in the MW targets due to its edge-on view. Therefore, we speculate that GMC-8 inherently has a large line width, which means that a high-level turbulent motion dominates the cloud or there is a superposition of multiple velocity components. For example, spatially/velocity resolved observations of the MW/LMC/M33 massive clouds obtained substantial evidence of cloud–cloud collisions (W43, Kohno et al. 2021; W49, Miyawaki et al. 2009; W51, Fujita et al. 2021; Carina, Fujita et al. 2021; LMC-N159, Fukui et al. 2019; Tokuda et al. 2019; GMC-37, Sano et al. 2020; NGC 604, Paper II; GMC-16, Paper I) and the authors suggest that such drastic events triggered high-mass star formation therein. Although Dobashi et al. (2014) reported colliding filaments with a few km s-1 velocity difference in Cygnus OB7 at the dense cloud center, such local phenomena (i.e., filament collisions) does not largely change the GMC scale velocity width as a whole. Star-formation active GMC tends to show highly developed structures composed of many spatially steep features, such as shells and filaments, while an extended diffuse component dominates less active clouds (see also a quantitative analysis in the LMC; Sawada et al. 2018). The extended gas feature of GMC-8 is qualitatively different from filamentary structures discovered in the other two GMCs in M33 (Papers I, II). The low-density nature and less-developed structure are consistent with those in the other star-formation inactive clouds, but the velocity width is comparable to active star-forming regions in the Local group. We discuss the velocity structure and the formation origin of GMC-8 in Sect. 4.2.
| GMC Name | Hosting Galaxy | Size | Mass | References | |
|---|---|---|---|---|---|
| (pc) | () | (km s-1) | |||
| Active star-formation | |||||
| W43 | Milky Way | 70150 | 2106 | 5–10 | Carlhoff et al. (2013) |
| W49 | Milky Way | 120120 | 1106 | 4–9 | Galván-Madrid et al. (2013) |
| W51 | Milky Way | 80110 | 1106 | 9 | Carpenter et al. (1998) |
| Carina | Milky Way | 6080 | 2105 | 5 | Rebolledo et al. (2016) |
| N159 | LMC | 60100 | 6105 | 7–10 | Minamidani et al. (2008) |
| NGC 604 | M33 | 100200 | 3106 | 9 | Muraoka et al. (2020) |
| GMC-16 | M33 | 18080 | 2106 | 6 | Tokuda et al. (2020) |
| Inactive star-formation | |||||
| Maddalena’s cloud | Milky Way | 250100 | 1105 | 8 | Lee et al. (1994) |
| Cygnus OB7 | Milky Way | 80100 | 2105 | 4 | Dobashi et al. (1994) |
| GMC225 | LMC | 10040 | 1105 | 6 | Minamidani et al. (2008) |
| GMC-8 | M33 | 7080 | 4106 | 11 | This work |
Note. — (1) Total molecular mass traced by CO observations. (2) FWHM of the velocity profile.
4.2 A possible formation origin and fate of GMC-8
Previous numerical simulations investigate molecular cloud formation and its mass supply by atomic gas (H i) supersonic flow (e.g., Hennebelle & Péraut, 1999; Koyama & Inutsuka, 2000, 2002; Vázquez-Semadeni et al., 2007; Inoue & Inutsuka., 2012). However, some theoretical works (e.g., Kobayashi et al., 2017, 2018) suggest that it takes 100 Myr to gain the H2 mass up to 106 in the case of recursive accretion flows from multiple directions with a density of 1 cm-3 (see Koda et al. 2009, for estimations considering a spherical configuration of the mass accretion, which also suggest a similar timescale of 100 Myr). Such a long timescale is significantly larger than the typical GMC lifetime, a few 10 Myr (Fukui et al., 1999; Kawamura et al., 2009). Fukui et al. (2009) observationally derived an H i gas accretion rate onto GMCs of 0.05 yr-1 by considering the three-dimensional relation between the H i envelope and molecular clouds in the LMC. In this case, although it is possible to grow up to 106 within the GMC lifetime, the star-formation inactive GMC is supposed to evolve into the subsequent state (i.e., inhering bright H ii regions) in a much shorter time, 6 Myr (Kawamura et al., 2009; Corbelli et al., 2017). Therefore, in order to obtain a large amount of molecular gas in a shorter time, it is necessary to supply materials by a drastic phenomenon rather than a steady-state accretion condition.
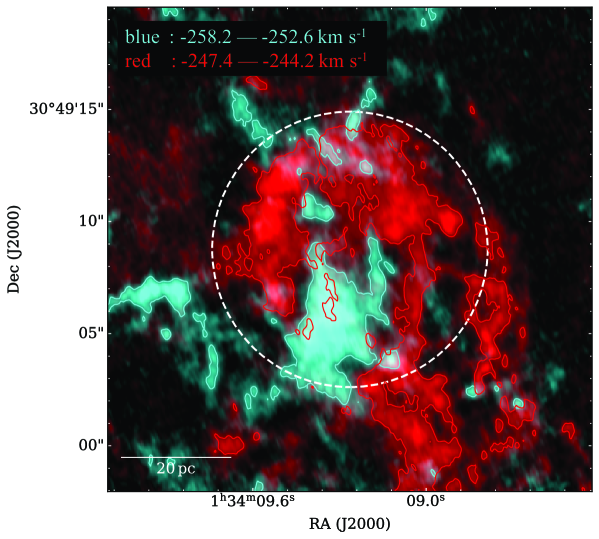
We revisit the PV diagram (Figure 6) to investigate whether or not the velocity structure preserves the remnants of a gas convergence. As we show in Sect. 3.2, the GMC is composed of an almost single velocity component with some local fluctuations. Among these features, the clump-4 is relatively blueshifted in the Main cloud (see panel (b)). This characteristic is similar to a synthetic PV diagram, which is called as V-shaped feature, produced by cloud–cloud collision (Takahira et al., 2014; Haworth et al., 2015; Fukui et al., 2018). Figure 7 shows the blueshifted and redshifted CO components with complementary distributions with each other, which is also one of the pieces of evidence for gas collision (Fukui et al., 2021). Based on these results, we set up a hypothesis that two molecular clouds with a relative velocity difference of 10 km s-1 (see the next paragraph) collided with each other, and the event realizes the total molecular mass of 106 in this region.
Notably, there are two independent blueshifted (260 km s-1) clouds at the east and west sides of the Main cloud (see Figure 6 (b)). If the blueshifted colliding counterpart was larger than the GMC seed, the extended parts of blueshifted clouds could not interact with the Main cloud. We may witness the present blueshifted components as two remnant clouds that are not decelerated by the collision (see also Section 4.3). The average column density of the Main cloud and blueshifted clouds are 3 1022 cm-2 and 1 1022 cm-2, respectively. If the column density ratio represents the mass ratio between the current product (i.e., the Main Cloud) and the GMC seed before the collision, the extra blueshifted component would contribute at least 20–30% as the mass reservoir to produce the million-solar-mass GMC.
Even though it is not easy to precisely estimate the collision’s timescale, the expected duration is on the order of a few Myr (= a few 10 pc/10 km s-1), which is derived from the GMC size divided by the relative velocity. This is consistent with the statistically derived timescale of the star formation inactive phase without remarkable H ii regions. According to the compilation by Corbelli et al. (2017), the total number of such GMCs in M33 is 178 (= Type A + B clouds in their catalog). The fact that there are no other clouds with a comparable mass to GMC-8 at the same stage indicates that its lifetime is very short if we assume the ratio of the number of objects at each stage is proportional to that of the timescale. Possible fate of GMC-8 is to evolve into a less massive GMC immediately by (i) gas consumption/destruction through star formation and/or (ii) dissipating the molecular gas due to turbulence without star formation. The presence of the 24m source at the vicinity of clump-5 indicates that an embedded star formation is already on-going. Meanwhile, as shown in Table 1, the virial mass of the 13CO clumps is larger than their except for clump-5, indicating that most of the dense materials are not self-gravitating. Despite the presence of the collisional signatures in this system, the inactive nature of high-mass star-formation can be explained by the lower column density of the molecular gas that can produce at least one single O-star. According to the recent statistical investigations of colliding clouds among more than 50 samples by Enokiya et al. (2021), at least a single O-star formation requests higher H2 column density more 1022 cm-2, which is mostly higher than those of the 13CO clumps in GMC-8. Recent ALMA observations toward the interacting galaxies system, NGC 4567/4568, also found a star-formation inactive molecular layer with a colliding velocity feature (Kaneko et al., 2018). In summary, the combination of the local star-formation activity and gas dissipation due to turbulent motion may be going to reduce the molecular gas of this system in the near future.
4.3 Comparison with Large-scale H i and CO Distributions
We subsequently discuss the origin of the colliding gas whose relative velocity is 10 km s-1 against the Main cloud. Supernova remnant searches in M33 (e.g., Garofali et al., 2017; Long et al., 2018) did not find any candidates within 300 pc around GMC-8, which means that supernova feedback is unlikely to be the origin of the high-velocity colliding flow. The location of the GMC is in the interarm region (see Section 1), and thus the galactic shock also cannot be appropriate, as suggested in our GMC-16 study (Paper I) whose location is near the stellar spiral arm.
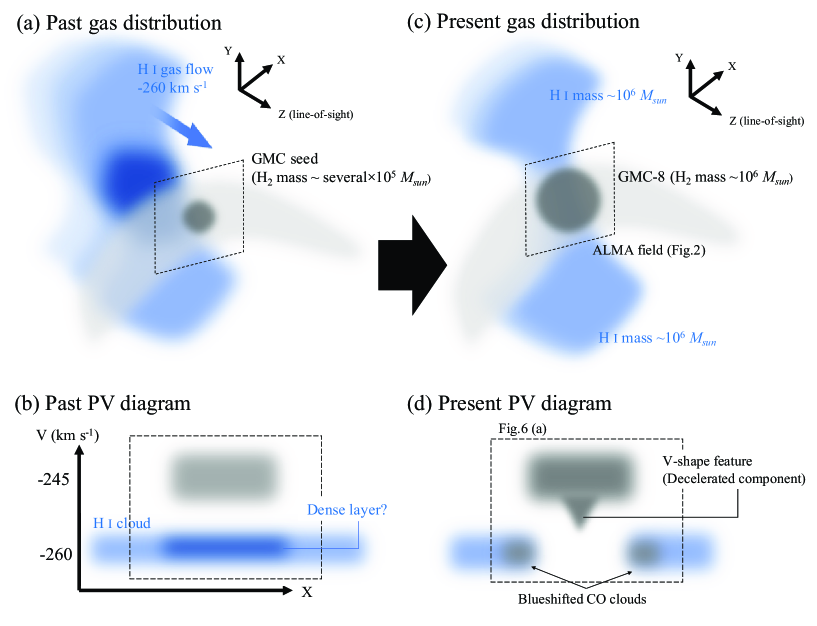
We here investigate a large-scale H i gas distribution obtained with the Very Large Array (VLA) observations (Gratier et al., 2010). We used a velocity cube that we corrected to the the galactic rotation, and the shifted velocity frame is (see Tachihara et al. 2018). We overlay a blueshifted velocity H i component ( = 214–184 km s-1), which is the same as the NGC 604 study defined by Tachihara et al. (2018), on the CO gas (Figure 8). This velocity is consistent with that in the blueshifted (260 km s-1) CO gas (Figure 6) in the standard frame. The colliding H i gas is likely converted into a molecular state at the GMC position as a whole. Our approximate estimation of the blueshifted atomic gas mass at both of the northern/southern sides of GMC-8 is 106 within the same area as GMC-8 traced by the single-dish CO observation assuming the optically thin limit of the H i emission. If we assume such a large amount of the atomic gas as an initial condition of the colliding H i flow onto a GMC-8 seed, a certain fraction of hydrogen gas may be converted into H2 during the collision. Figure 9 summarizes our suggestion for the mass growth process of GMC-8. There were a less massive GMC seed along the interarm region and a blueshifted H i gas component possibly containing a dense layer before the collision (panels (a) and (b)). Panels (c) and (d) mimic observed gas distribution in and the PV diagram. The deceleration by the collision of the two clouds explains the lack of blueshifted components toward the Main cloud (see Sect. 4.2). The present circumstance around GMC-8 suggests that the large-scale (50 pc) H i flow is the promising phenomena to increase GMC mass up to 106 . This is consistent with the theoretical prediction that a dynamic mass accumulation is required to form such massive GMC rather than local converging flows (see the introduction).
We finally remark on the origin of the H i flow. Tachihara et al. (2018) pointed out that a tidal interaction between M31 and M33 drove external H i flows onto the M33 disk based on the presence of a bridge feature connecting the two galaxies (Braun & Thilker, 2004; Putman et al., 2009; Lockman et al., 2012). Grossi et al. (2008) found high-velocity H i clouds, which are supposed to be tidal debris, and suggested they are supply sources for high-mass star formation. Alternatively, we cannot exclude an internal origin of such high-velocity diffuse gas. Wada et al. (2011) proposed that the dynamic spiral theory, which involves nonsteady stellar arms (Dobbs & Baba 2014 and references therein), explain the presence of complex gas structures in flocculent spiral galaxies like M33. In this case, we predict that there are gas flows from multiple directions onto molecular clouds. There are some high-velocity components apart from the galactic rotation other than GMC-8 and NGC 604 (Figure 8). Though we cannot determine which external or internal origins dominate as such gas supply phenomena, further investigating the relation between H i and CO will give a better understanding of GMC evolution during the galactic lifecycle.
5 Summary
This paper describes ALMA observations of one of the star-formation inactive GMCs in M33, GMC-8, with a total H2 mass of 106 . As one of the most massive GMCs in the galaxy, it is a vital target to understand such an exclusive target’s formation mechanism in the Local group of galaxies. The primary conclusions are summarized as follows:
-
1.
The molecular gas (traced by 12CO) distribution in an 1 pc view is a highly extended and round-shaped structure. This finding is different from our companion studies (Papers I, II) of two active star-forming GMCs with many remarkable shell/filamentary structures.
-
2.
The 13CO total flux and peak intensity of GMC-8 are remarkably weaker than those in the other two GMCs. The dense (103–104 cm-3) gas fraction with respect to the total H2 mass judging from the 13CO/12CO data is as low as 2%. The development of density and structure in molecular clouds is necessary for the process leading to high-mass star formation.
-
3.
Our compilation from the literature found that the velocity width of GMC-8 is similar to or slightly higher than those of other active high-mass star-forming GMCs in the Local universe. Although the GMC velocity component appears to be single as a whole, the velocity/spatially resolved observations found several characteristics that coalescence of two components forms the molecular cloud. We suggest that a convergent gas flow onto the GMC seed with a molecular mass of several 105 may work to grow up at most 106 without any remarkable high-mass star formation activities on a relatively short timescale of a few megayears.
References
- Astropy Collaboration et al. (2018) Astropy Collaboration, Price-Whelan, A. M., Sipőcz, B. M., et al. 2018, AJ, 156, 123
- Bailer-Jones et al. (2018) Bailer-Jones, C. A. L., Rybizki, J., Fouesneau, M., et al. 2018, AJ, 156, 58. doi:10.3847/1538-3881/aacb21
- Braun & Thilker (2004) Braun, R. & Thilker, D. A. 2004, A&A, 417, 421
- Carlhoff et al. (2013) Carlhoff, P., Nguyen Luong, Q., Schilke, P., et al. 2013, A&A, 560, 24
- Carpenter et al. (1998) Carpenter, J. M., & Sanders, D. B. 1998, AJ, 116, 1856
- Corbelli et al. (2017) Corbelli, E., Braine, J., Bandiera, R., et al. 2017, A&A, 601, A146
- Dame (2011) Dame, T. M. 2011, arXiv:1101.1499
- Dame et al. (2001) Dame T. M., Hartmann D., Thaddeus P., 2001, ApJ, 547, 792
- Dobashi et al. (1994) Dobashi, K., Bernard, J.-Ph., Yonekura, Y., & Fukui, Y. 1994, ApJS, 95, 419
- Dobashi et al. (1996) Dobashi, K., Bernard, J.-Ph., & Fukui, Y. 1996, ApJ, 466, 282
- Dobashi et al. (2014) Dobashi, K., Matsumoto, T., Shimoikura, T., et al. 2014, ApJ, 797, 58
- Dobbs & Baba (2014) Dobbs, C. & Baba, J. 2014, PASA, 31, e035
- Druard et al. (2014) Druard, C., Braine, J., Schuster, K. F., et al. 2014, A&A, 567, A118
- Enokiya et al. (2021) Enokiya, R., Torii, K., & Fukui, Y. 2021, PASJ, 73, S75. doi:10.1093/pasj/psz119
- Freedman et al. (2001) Freedman, W. L., Madore, B. F., Gibson, B. K., et al. 2001, ApJ, 553, 47
- Fujita et al. (2021) Fujita, S., Torii, K., Kuno, N., et al. 2021, PASJ, 73, S172. doi:10.1093/pasj/psz028
- Fujita et al. (2021) Fujita, S., Sano, H., Enokiya, R., et al. 2021, PASJ, 73, S201. doi:10.1093/pasj/psaa078
- Fukui et al. (1999) Fukui, Y., Mizuno, N., Yamaguchi, R., et al. 1999, PASJ, 51, 745
- Fukui et al. (2008) Fukui, Y., Kawamura, A., Minamidani, T., et al. 2008, ApJS, 178, 56
- Fukui et al. (2009) Fukui, Y., Kawamura, A., Wong, T., et al. 2009, ApJ, 705, 144
- Fukui & Kawamura (2010) Fukui, Y. & Kawamura, A. 2010, ARA&A, 48, 547
- Fukui et al. (2015) Fukui, Y., Harada, R., Tokuda, K., et al. 2015, ApJ, 807, L4
- Fukui et al. (2018) Fukui, Y., Kohno, M., Yokoyama, K., et al. 2018, PASJ, 70, S41
- Fukui et al. (2019) Fukui, Y., Tokuda, K., Saigo, K., et al. 2019, ApJ, 886, 14
- Fukui et al. (2021) Fukui, Y., Habe, A., Inoue, T., et al. 2021, PASJ, 73, S1. doi:10.1093/pasj/psaa103
- Galván-Madrid et al. (2013) Galván-Madrid, R., Liu, H. B., Zhang, Z.-Y., et al. 2013, ApJ, 779, 121
- Garofali et al. (2017) Garofali, K., Williams, B. F., Plucinsky, P. P., et al. 2017, MNRAS, 472, 308
- Gratier et al. (2010) Gratier, P., Braine, J., Rodriguez-Fernandez, N. J., et al. 2010, A&A, 522, A3
- Gratier et al. (2012) Gratier, P., Braine, J., Rodriguez-Fernandez, N. J., et al. 2012, A&A, 542, A108
- Grossi et al. (2008) Grossi, M., Giovanardi, C., Corbelli, E., et al. 2008, A&A, 487, 161
- Haworth et al. (2015) Haworth T. J., Shima K., Tasker E. J., et al. 2015, MNRAS, 454, 1634
- Hennebelle & Péraut (1999) Hennebelle, P. & Péraut, M. 1999, A&A, 351, 309
- Heyer & Dame (2015) Heyer, M. & Dame, T. M. 2015, ARA&A, 53, 583
- Hinz et al. (2007) Hinz, J. L., Rieke, M. J., Rieke, G. H., et al. 2007, ApJ, 663, 895. doi:10.1086/518817
- Hodge et al. (1999) Hodge, P. W., Balsley, J., Wyder, T. K., & Skelton, B. P. 1999, PASP, 111, 685
- Hollenbach & Salpeter (1971) Hollenbach, D. & Salpeter, E. E. 1971, ApJ, 163, 155
- Hoopes & Walterbos (2000) Hoopes, C. G. & Walterbos, R. A. M. 2000, ApJ, 541, 597
- Indebetouw et al. (2013) Indebetouw, R., Brogan, C., Chen, C. H. R., et al. 2013, ApJ, 774, 73
- Inoue & Inutsuka (2009) Inoue, T. & Inutsuka, S.-. ichiro . 2009, ApJ, 704, 161
- Inoue & Inutsuka. (2012) Inoue, T. & Inutsuka, S.-I. 2012, ApJ, 759, 35
- Jackson et al. (2006) Jackson, J. M., Rathborne, J. M., Shah, R. Y., et al. 2006, ApJS, 163, 145
- Jura (1974) Jura, M. 1974, ApJ, 191, 375
- Kaneko et al. (2018) Kaneko H., Kuno N., Saitoh T. R. 2018, ApJ, 860, L14
- Kawamura et al. (1999) Kawamura, A., Onishi, T., Mizuno, A., et al. 1999, PASJ, 51, 851
- Kawamura et al. (2009) Kawamura, A., Mizuno, Y., Minamidani, T., et al. 2009, ApJS, 184, 1
- Kennicutt (1998) Kennicutt, R. C. 1998, ApJ, 498, 541
- Kennicutt & Evans (2012) Kennicutt, R. C. & Evans, N. J. 2012, ARA&A, 50, 531
- Kobayashi et al. (2017) Kobayashi, M. I. N., Inutsuka, S.-. ichiro ., Kobayashi, H., et al. 2017, ApJ, 836, 175
- Kobayashi et al. (2018) Kobayashi, M. I. N., Kobayashi, H., Inutsuka, S.-i., & Fukui, Y. 2018, PASJ, 70, s59
- Koda et al. (2009) Koda, J., Scoville, N., Sawada, T., et al. 2009, ApJ, 700, L132. doi:10.1088/0004-637X/700/2/L132
- Kohno et al. (2021) Kohno, M., Tachihara, K., Torii, K., et al. 2021, PASJ, 73, S129. doi:10.1093/pasj/psaa015
- Koyama & Inutsuka (2000) Koyama, H. & Inutsuka, S.-I. 2000, ApJ, 532, 980
- Koyama & Inutsuka (2002) Koyama, H. & Inutsuka, S.-. ichiro . 2002, ApJ, 564, L97. doi:10.1086/338978
- Koyama & Inutsuka (2004) Koyama, H. & Inutsuka, S.-. ichiro . 2004, ApJ, 602, L25
- Lee et al. (1994) Lee, Y., Snell, R. L., & Dickman, R. L. 1994, ApJ, 432, 167
- Lockman et al. (2012) Lockman, F. J., Free, N. L., & Shields, J. C. 2012, AJ, 144, 52
- Long et al. (2018) Long, K. S., Blair, W. P., Milisavljevic, D., et al. 2018, ApJ, 855, 140
- Maddalena & Thaddeus (1985) Maddalena, R. J. & Thaddeus, P. 1985, ApJ, 294, 231
- McMullin et al. (2007) McMullin, J. P., Waters, B., Schiebel, D., et al. 2007, Astronomical Data Analysis Software and Systems XVI, 127
- Minamidani et al. (2008) Minamidani, T., Mizuno, N., Mizuno, Y., et al. 2008, ApJS, 175, 485
- Miura et al. (2012) Miura, R. E., Kohno, K., Tosaki, T., et al. 2012, ApJ, 761, 37
- Miyawaki et al. (2009) Miyawaki, R., Hayashi, M., & Hasegawa, T. 2009, PASJ, 61, 39
- Mizuno et al. (1995) Mizuno, A., Onishi, T., Yonekura, Y., et al. 1995, ApJ, 445, L161
- Mizuno et al. (1999) Mizuno, A., Hayakawa, T., Tachihara, K., et al. 1999, PASJ, 51, 859
- Muraoka et al. (2017) Muraoka, K., Homma, A., Onishi, T., et al. 2017, ApJ, 844, 98
- Muraoka et al. (2020) Muraoka, K., Kondo, H., Tokuda, K., et al. 2020, ApJ, 903, 94. doi:10.3847/1538-4357/abb822
- Naslim et al. (2018) Naslim, N., Tokuda, K., Onishi, T., et al. 2018, ApJ, 853, 175
- Nishimura et al. (2015) Nishimura, A., Tokuda, K., Kimura, K., et al. 2015, ApJS, 216, 18
- Onodera et al. (2010) Onodera, S., Kuno, N., Tosaki, T., et al. 2010, ApJ, 722, L127
- Putman et al. (2009) Putman, M. E., Peek, J. E. G., Muratov, A., et al. 2009, ApJ, 703, 1486
- Rebolledo et al. (2016) Rebolledo, D., Burton, M., Green, A., et al. 2016, MNRAS, 456, 2406
- Rieke et al. (2004) Rieke, G. H., Young, E. T., Engelbracht, C. W., et al. 2004, ApJS, 154, 25. doi:10.1086/422717
- Robitaille & Bressert (2012) Robitaille, T., & Bressert, E. 2012, APLpy: Astronomical Plotting Library in Python, ascl:1208.017
- Rosolowsky et al. (2007) Rosolowsky, E., Keto, E., Matsushita, S., & Willner, S. P. 2007, ApJ, 661, 830
- Saigo et al. (2017) Saigo, K., Onishi, T., Nayak, O., et al. 2017, ApJ, 835, 108
- Sano et al. (2020) Sano, H., Tsuge, K., Tokuda, K., et al. 2020, PASJ. doi:10.1093/pasj/psaa045 ,
- Sawada et al. (2018) Sawada, T., Koda, J., & Hasegawa, T. 2018, ApJ, 867, 166
- Schmidt (1959) Schmidt, M. 1959, ApJ, 129, 243
- Su et al. (2019) Su, Y., Yang, J., Zhang, S., et al. 2019, ApJS, 240, 9
- Tachihara et al. (2018) Tachihara, K., Gratier, P., Sano, H., et al. 2018, PASJ, 70, S52
- Takahira et al. (2014) Takahira, K., Tasker, E. J., & Habe, A. 2014, ApJ, 792, 63
- Tokuda et al. (2019) Tokuda, K., Fukui, Y., Harada, R., et al. 2019, ApJ, 886, 15
- Tokuda et al. (2020) Tokuda, K., Muraoka, K., Kondo, H., et al. 2020, ApJ, 896, 36
- Torii et al. (2019) Torii, K., Fujita, S., Nishimura, A., et al. 2019, PASJ, 50
- Tosaki et al. (2011) Tosaki, T., Kuno, N., Onodera, S. M., et al. 2011, PASJ, 63, 1171
- Umemoto et al. (2017) Umemoto, T., Minamidani, T., Kuno, N., et al. 2017, PASJ, 69, 78
- Verley et al. (2007) Verley, S., Hunt, L. K., Corbelli, E., et al. 2007, A&A, 476, 1161
- Vázquez-Semadeni et al. (2007) Vázquez-Semadeni, E., Gómez, G. C., Jappsen, A. K., et al. 2007, ApJ, 657, 870. doi:10.1086/510771
- Wada et al. (2011) Wada, K., Baba, J., & Saitoh, T. R. 2011, ApJ, 735, 1
- Wong et al. (2017) Wong, T., Hughes, A., Tokuda, K., et al. 2017, ApJ, 850, 139
- Wong et al. (2019) Wong, T., Hughes, A., Tokuda, K., et al. 2019, ApJ, 885, 50