Compact Spectroscopy of keV to MeV X-rays from a Laser Wakefield Accelerator
Abstract
We reconstruct spectra of secondary X-rays from a tunable 250-350 MeV laser wakefield electron accelerator from single-shot X-ray depth-energy measurements in a compact (7.5 7.5 15 cm), modular X-ray calorimeter made of alternating layers of absorbing materials and imaging plates. X-rays range from few-keV betatron to few-MeV inverse Compton to >100 MeV bremsstrahlung emission, and are characterized both individually and in mixtures. Geant4 simulations of energy deposition of single-energy X-rays in the stack generate an energy-vs-depth response matrix for a given stack configuration. An iterative reconstruction algorithm based on analytic models of betatron, inverse Compton and bremsstrahlung photon energy distributions then unfolds X-ray spectra, typically within a minute. We discuss uncertainties, limitations and extensions of both measurement and reconstruction methods.
Accelerator-based sources of bright, hard X-rays have enabled decades of advances in materials science [1], medicine [2, 3], geology [4], warm dense matter science [5], radiography of high- materials [6] and non-destructive testing in industry [7]. The radio-frequency electron accelerators that underlie these sources, however, are limited to accelerating gradients of MeV/m [8]. Consequently they are tens to hundreds of meters long, expensive to build and operate and challenging to access. Laser wakefield accelerators (LWFAs) powered by intense laser pulses interacting with a plasma [9, 10] offer tabletop complements to conventional accelerators, but require a unique set of diagnostics [11]. With accelerating gradients of GeV/m, LWFAs can accelerate electron bunches within several cm to energies approaching GeV [12], with bandwidth 1-15% and charge s of pC. LWFAs are emerging as versatile small-laboratory sources of fs hard X-ray pulses [13], with photon energies and peak brilliance rivaling those of their conventional synchrotron counterparts, and with a growing list of applications [14, 15, 16].
LWFAs can generate three types of secondary X-rays [13]: betatron, inverse Compton scattered (ICS) radiation, and bremsstrahlung. Betatron radiation originates from transverse undulations of accelerating electrons in a wake’s focusing fields, and is a natural byproduct of the acceleration process [17, 18]. A LWFA producing 250-350 MeV electrons emits betatron X-rays with a synchrotron-like spectrum, with critical energy several keV [19]. ICS radiation results from backscatter of counter-propagating laser photons of energy from accelerated electrons of Lorentz factor , upshifting the photons to energy [20]. Thus ICS of eV photons from electron bunches with peak energy in the range MeV () generates X-rays with spectral peaks in the range MeV. Bremsstrahlung X-rays result from collisions, and associated acceleration, of relativistic electrons passing through a converter after the accelerator, producing broadband X-rays with photon energy up to [21]. Secondary X-ray photons from LWFAs thus span an energy range from several keV to several hundred MeV, enabling a wide range of applications [13, 14], but requiring an unusually versatile spectrometer for source characterization [14].
Currently multiple types of spectrometers are required to cover the photon energy range of X-rays from LWFAs. For keV, X-ray-sensitive charge-coupled devices (CCDs) operating as photon counters can build up a histogram of the spectrum of low-flux X-rays by measuring the charge that individual X-ray photons deposit in single pixels or pixel groups [22, 23]. For keV, Ross filter pair arrays, which take advantage of the wide distribution of K-edge absorption energies across the periodic table, can analyze the spectral content of X-rays in a single shot [24, 25]. For keV, the sharp absorption sensitivity of K-edges is left behind, but broader differential transmission curves of high- materials still enable lower-resolution spectral analysis [26]. For MeV, differential transmission detectors lose resolution quickly, and Compton scattering and pair production become the main processes for resolving X-ray photon energy [27, 28]. X-rays of MeV impinge on a converter, generating Compton electrons and/or pairs that are energy-analyzed in a magnetic spectrometer. The energy of the secondary Compton electrons and pairs is related straightforwardly to that of the incident X-rays, provided the converter is thin enough to avoid multiple scattering events. This converter thickness requirement limits signal-to-noise ratio, often necessitating averaging over multiple shots. To date, Compton/pair-production spectrometers have only measured broadband X-ray spectra. They have not yet measured peaked spectra, e.g. from linear ICS [29].
Here, we spectrally characterize betatron, bremsstrahlung and ICS X-rays from a 250 - 350 MeV LWFA in a single shot, using a single, compact, inexpensive instrument: a modular calorimeter consisting of a stack of absorbers of varying and thickness, interlaced with imaging plates (IPs). The present measurements utilized a single fixed stack design to analyze an unprecedented 4-decade photon-energy range, demonstrating the spectrometer’s universality. However, the design is easily modified to enhance sensitivity and/or resolution within a narrower spectral range of interest. The current geometry can diagnose energies as low as keV, typical of betatron radiation, and as high as 100 MeV, typical of thick target bremsstrahlung radiation. We reconstruct spectra that are betatron-, ICS- or bremsstrahlung-dominated, as well as spectra containing a mixture of different types of X-rays with widely separated photon energies.
The calorimeter used here is based on a design developed by Garcia et al. (2021) for spectrally analyzing various hard X-ray sources, including ps X-ray pulses from intense laser-solid interaction and natural X-ray emission [30]. X-ray calorimeters consisting of alternating absorbers and detectors were used in some previous laser-plasma experiments [31, 32, 33, 34, 35]. A calorimeter stack for diagnosing LWFA electron spectra, charge and divergence was also previously reported [36], although magnetic spectrometers are now universally used for this purpose. The present study differs from prior work in the following key respects: (i) It focuses exclusively on secondary X-rays from LWFAs. (ii) It measures and reconstructs a wider range of photon energies, by employing a longer stack (24 layers) and a strategic mixture of low- and high-Z absorbers. We thereby extend the work of Albert et al. [32] by unfolding not only keV betatron X-ray spectra, but also MeV ICS and bremsstrahlung spectra from the same LWFA. (iii) It streamlines spectral reconstruction by employing an algorithm based on physical or empirical models of betatron, ICS and bremsstrahlung emission and least squares optimization. The resulting fast convergence (currently minute) on a standard lab-grade laptop could, with improvements, become suitable for analyzing data in real time from rep-rated LWFAs. It thereby differs from the more general Bayesian reconstruction algorithm [37] employed in Garcia et al. (2021), which can in principle reconstruct and discover unexpected spectral features different in form from the initial guess, but which takes longer to converge. An additional streamlining element is that we fit spatially-integrated depth-energy distributions, and reconstruct spatially-integrated spectra, foregoing the angular resolution of betatron energies employed in Albert et al. (2013) [32]. Nevertheless, if necessary the reconstruction algorithm could easily be generalized for applications not requiring rapid analysis.
Results
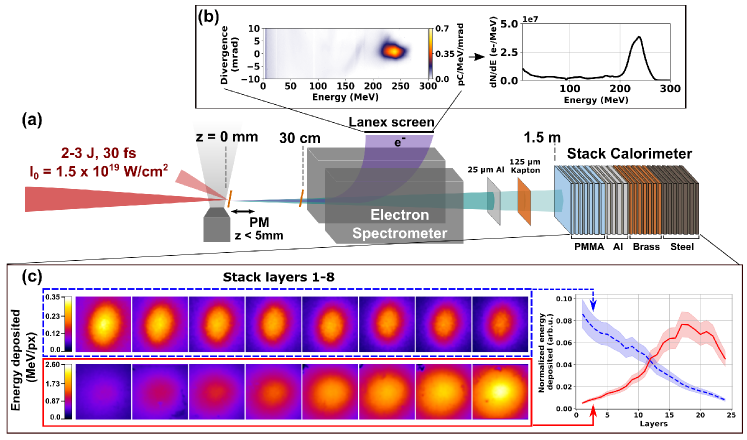
Generation and diagnosis of X-rays. Fig. 1(a) presents a schematic overview of the LWFA X-ray spectrometry setup. A high-energy, ultra short laser pulse impinged on a nitrogen doped helium gas jet and excited a laser wakefield that accelerated electrons (see Methods). A magnetic electron spectrometer dispersed these electrons and diagnosed their energy distribution. A stack calorimeter consisting of 24 absorbing layers interspersed with IPs, recorded the depth-energy distribution of particle cascades initiated by secondary X-rays from the LWFA. Supplementary Table S1 lists absorber compositions and thicknesses and IP parameters for the stack used here. We generated and characterized four types of X-ray outputs:
-
1.
Pure betatron X-rays. Betatron X-rays, generated in a 3-mm jet, propagated from LWFA exit () to calorimeter (entrance plane at cm), passing only through a m-thick Al laser blocking foil and a m-thick Kapton vacuum chamber window, both downstream of the -spectrometer, which together blocked keV X-rays. The -beam generated no other X-rays outside the LWFA. We cross-checked unfolded betatron X-ray spectra in two ways: (a) by measuring betatron X-ray spectral histograms independently on separate, but similar, shots using a Pixis-XO 400BR photon-counting CCD sensitive to X-ray photon energies up to keV [23]; (b) by simulating the spectra generated by a single electron with various trial oscillation trajectories using the classical radiation code CLARA [38] (see Supplementary Material).
-
2.
Pure bremsstrahlung. We used a 5-mm jet to maximize electron and photon energy, and inserted a thick, high- foil (e.g. 800 m-thick Ta) at cm, which acted as a converter. Electrons entering the foil underwent collisions, generating forward bremsstrahlung. The foil blocked betatron X-rays completely.
-
3.
Bremsstrahlung + betatron X-rays. We inserted a thin, low- foil (e.g. m-thick Kapton) at cm. It generated weaker bremsstrahlung, but transmitted most of the incident betatron X-rays. Thus the two had comparable flux at the detector.
-
4.
ICS X-rays. We inserted the thin, low- foil at cm. Here, the transmitted LWFA drive pulse was intense enough to ionize it, converting its front surface to an overdense plasma, or plasma mirror (PM), that retro-reflected the drive pulse back onto trailing electrons, generating ICS X-rays [39, 40, 16]. In this configuration, ICS X-rays dominated over betatron/bremsstrahlung background. Plasma mirroring, and thus ICS, were negligible for foils at cm.
Fig. 1(c) contrasts transverse energy profiles recorded by the first 8 IPs for an ICS-dominated (top left, blue dashed box) and a bremsstrahlung-dominated (bottom left, red solid box) shot. The plot on the right side of Fig. 1(c) shows transversely-integrated deposited energy vs. layer number for all 24 layers (see table 5 in Methods for details on integration radius and total integrated energy for each source). These markedly different longitudinal energy profiles provide raw data for distinguishing the energy content of the two X-ray pulses.
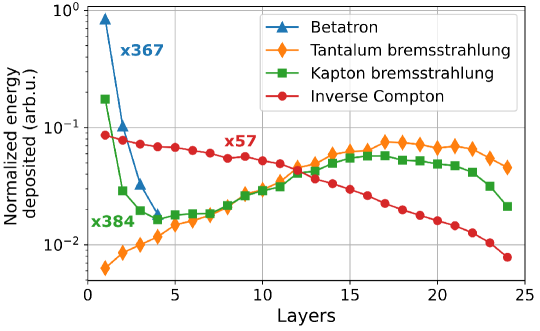
Fig. 2 compares normalized longitudinal energy profiles for the four X-ray outputs described above. Each data is multiplied by the factor shown to give its true amplitude relative to the pure bremsstrahlung source. Pure betatron X-rays (blue triangles) deposit energy with progressively decreasing amplitude only in the first 4 layers, indicative of the short absorption depth of few-keV photons. The energy profile of mixed bremsstrahlung/betatron X-rays (green squares, “Kapton bremsstrahlung”) displays the same sharply-decaying betatron X-ray feature in the first few layers, but now augmented with broadly-distributed deposition deeper in the stack (peaking at layers 16-17) by higher-energy bremsstrahlung photons. Pure bremsstrahlung from a thick, high- foil (orange diamonds, “Tantalum bremsstrahlung”) generates no betatron feature in layers 1-4, only the characteristic broad “bremsstrahlung” peak in deeper layers, now stronger by a factor . ICS X-rays (red circles, “Inverse Compton”) deposit energy in a pattern distinct from the previous cases: energy deposition decreases monotonically throughout the stack. It is possible to recognize different classes of X-rays immediately from these “fingerprint” energy profiles alone, even before analyzing them to reveal their widely differing energy content quantitatively. The multiplicative factors illustrate the high dynamic range of the detector, which shows no saturation over a factor of nearly in deposited energy. To the best of our knowledge, this is the first direct observation of the three different LWFA X-ray sources and their energy signatures from a single detector.
Betatron X-rays. The betatron radiation spectrum is derived [17] from Liénard-Wiechert potentials of accelerating electrons undergoing sinusoidal betatron oscillations of wavenumber and amplitude in the focusing fields of a plasma bubble. Here, is the plasma wavenumber. When the betatron strength parameter , analogous to a wiggler parameter, exceeds unity (for our experiments, ) and varies continuously during acceleration, radiation is generated in a forward-directed continuum of overlapping harmonics of the Doppler-upshifted betatron frequency up to a critical frequency , beyond which intensity diminishes. The spectrum of radiation along the axis from a single electron then takes the form [17]
| (1) |
where , is the number of betatron periods, is an integrated solid angle and is a modified Bessel function. Here, we constrain the betatron photon spectrum to the form of Eq. 1, and use as a fit parameter.
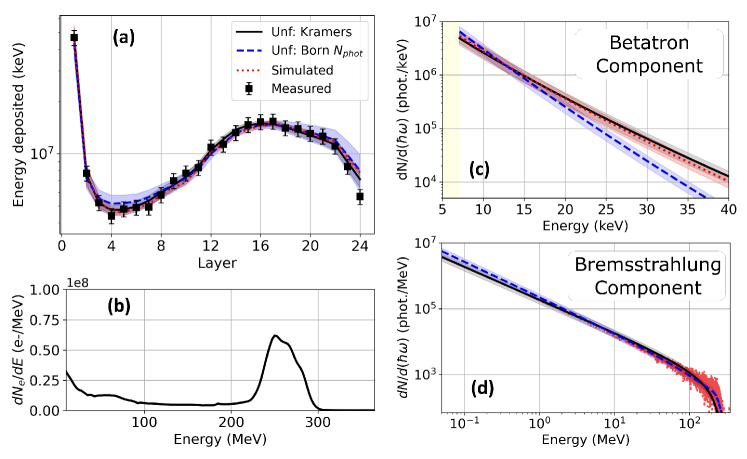
Data points (squares) in Fig. 3(a) show a typical measured on-axis energy deposition profile () from betatron X-rays generated by a 274 MeV () electron bunch with 18 MeV FWHM energy spread [see spectrum in inset of Fig. 3(b), black curve] in plasma, compared to the unfolded energy distribution [solid black curve in panel (a)]. We obtain best fit to the measured energy deposition with a X-ray photon spectrum of critical photon energy keV, shown also by a solid black curve in the main panel of Fig. 3(b). The number of photons within the FWHM of the betatron source is photons/keV over 7 keV. Yellow shading in Fig. 3(b) indicates energies that are blocked by the beam line elements and grey shading gives uncertainties in the unfolded energy profile (a) and spectrum (b), determined via the procedure described in Methods. From , , and , we estimate betatron radius m, or .
Red data points (+’s) in Fig. 3(b) show results of a typical independent X-ray spectral measurement using the photon-counting CCD, for a shot under the same conditions that yielded an electron bunch of nearly identical energy [Fig. 3(b) inset, red dashed curve]. The X-ray spectrum is corrected for the transmission efficiency of the Al laser blocking foil, the Kapton vacuum chamber window [see Fig. 1(a)] and an additional filter that attenuated X-ray flux to less than one photon per pixel. The independently measured and unfolded spectra agree within combined uncertainties in the most sensitive range (8-20 keV) of the X-ray CCD.
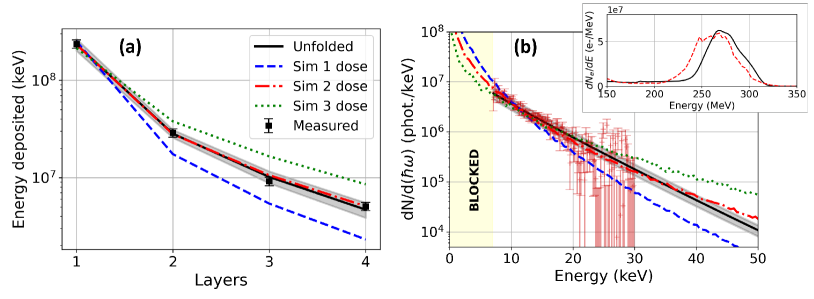
The colored curves in Fig. 3(b) [blue dashed, red dot-dashed and green dotted curves] show X-ray spectra for three values of and , selected from simulations for a range of , values carried out using the classical radiation code CLARA2 [38] (see Supplementary Material). The red dot-dashed curve, which corresponds to m and MeV (Table 1, second row from the bottom), best matches the unfolded and independently measured X-ray spectra over the sensitive range of the CCD detector. The stated uncertainties in and were generated from an ensemble of simulations, and represent variances from the best-fit values. Moreover, this simulated spectrum, when input into equation (8) using the same response matrix used for the unfolding, yielded a calculated deposited energy [Fig. 3(a), red dot-dashed curve, “Sim 2”] nearly indistinguishable from the measured (squares) and unfolded (solid black curve) energy deposition profiles. This good agreement corroborates the value inferred from the unfolding alone.
| Electron parameters | Unfolded Betatron parameters | ||||
| (MeV) | (m) | (keV) | (m) | ||
| Unfolded | - | ||||
| Sim 1 | - | ||||
| Sim 2 | - | ||||
| Sim 3 | - | ||||
The two additional CLARA2 simulation results shown in Fig. 3(b) correspond to m, MeV (blue dashed) and m, MeV (green dotted). Both fall well outside the uncertainty range of the unfolded X-ray spectrum. Similarly their calculated energy distributions, shown by “Sim 1” (blue dashed) and “Sim 3” (green dotted), respectively, in Fig. 3(a) fall well outside the uncertainty range of the measured energy. When we ran the single-parameter unfolding algorithm on these calculated energy profiles, treated as synthetic data, we found keV and for “Sim 1” and a keV and for “Sim 3”, consistent with the original CLARA2 input parameters. These examples illustrate the degree to which the stack-based unfolding method can resolve betatron X-ray parameters associated with different acceleration conditions.
Bremsstrahlung X-rays. Koch and Motz (1959)[41] have compiled a comprehensive summary of cross-section approximations and experimental data for bremsstrahlung. Here we model bremsstrahlung spectra using either electron scattering cross-sections derived from the Born approximation or the so-called Kramers’ law. The Born differential cross-section for scattering of relativistic electrons to produce bremsstrahlung of photon energy has the analytic form (neglecting screening effects)[42]
| (2) |
Here, is the charge of the scattering nucleus, the fine structure constant, the classical electron radius and the initial electron energy. Monoenergetic electrons passing through a thin () low target (e.g. 25 m-thick Kapton) lose negligible energy, so the bremsstrahlung spectrum, i.e. the number of photons per energy bin , has the form of Eq. (2). Here, is target thickness and the radiation length of the target material. Relativistic electrons () passing through a thick (), high target (e.g. 800 m-thick Ta), on the other hand, experience energy-dependent alterations to the scattering cross-section because screening of the nucleus by atomic electrons becomes important in this limit, necessitating a correction to Eq. (2) (see Supplementary Material). We estimate by integrating the cross-section over target thickness, or equivalently over electron energy loss, assuming that electrons lose energy continuously to radiation at a rate .
| (3) |
The integration results in a piece-wise function, in which differs in form for greater than or less than the final electron energy :
| (4a) | |||
| (4b) | |||
where . The Born approximation model has been used widely to predict or model the properties of bremsstrahlung in experiments [41].
Kramers derived the shape of the bremsstrahlung spectrum by a nonrelativistic semi-classical calculation that considered only continuous electron energy loss, but not discrete electron scattering events or radiation absorption [43]. Nevertheless, a common practice is to approximate the integration of the cross section over energy loss through a thick target using Kramers’ law, and to take radiation attenuation within the target into account using NIST attenuation data [44] Moreover, since this integration is equivalent to integrating over incident electron energies, Kramers’ model is also widely used to describe bremsstrahlung from thin targets when there is electron energy spread. Kramers’ approximation for the bremsstrahlung spectrum has the analytic form
| (5) |
where and, for wide electron energy spread, represents the X-ray cutoff photon energy , which is close to the maximum incident electron energy. In practice, the parameter functions as an empirical parameter for fitting or unfolding spectra. Kramers’ Law has widely and successfully approximated observed bremsstrahlung spectra, even (its original assumptions notwithstanding) those generated by relativistic electrons in both thick and thin targets [41].
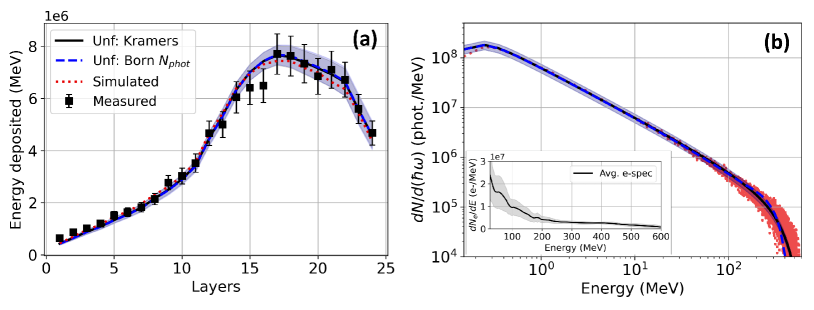
Data points (black squares) in Fig. 4(a) show a typical energy deposition profile , integrated over the beam FWHM of 11.5 0.4 mrad, from bremsstrahlung X-rays that LWFA electrons generated in an 800 m-thick Ta target. The inset of Fig. 4(b) shows the energy distribution of the incident electrons, which had energy up to MeV, but large energy spread, as a result of emerging from an elongated 5 mm LWFA gas jet. Since the 800 m tantalum target significantly disrupted the electrons, preventing accurate on-shot measurement of their energy distribution, the black curve in this inset was obtained by averaging electron spectra of the 5 preceding shots without the tantalum in place, while the grey shaded region represents their standard deviation. The average spectrum corresponds to a total of electrons and average bunch energy 160 MeV, and was used for data analysis and Geant4 simulations.
Blue dashed and solid black curves in Fig. 4(a) show unfolded energy deposition profiles for X-ray spectra based on the Born approximation (Eq. 4a-b) and Kramers’ law (Eq. 5), respectively. Fig. 4(b) presents the corresponding best fit X-ray spectra. Red dotted curves in Fig. 4(a) and (b) show the simulated energy deposition profile and photon spectrum, respectively. Unfolded and simulated energy deposition profiles are nearly indistinguishable from one another and fall within the 10% relative uncertainty of the unfolding over the full range of the stack. Unfolded and simulated spectra similarly agree, with only small differences at the high energy limit (<20%) between the two models. Table 2 compares the bremsstrahlung beam parameters unfolded from the two models and obtained from the simulated spectrum. The uncertainty in the number of photons in the simulated beam reflects the uncertainty in the number of electrons incident on the Ta target.
| (MeV) | (MeV) | ||||
| Simulated | 36 | ||||
| Unf: Kramers | |||||
| Unf: Born |
Betatron + bremsstrahlung X-rays. The 25 m Kapton target was thick enough to generate detectable bremsstrahlung, yet thin enough to transmit most betatron radiation while negligibly perturbing the transverse spatial profile and energy spectrum of incident electrons. Data points (black squares) in Fig. 5(a) show a typical measured energy deposition profile () using this target.
Betatron radiation deposited most of the energy in layers 1-2, bremsstrahlung most of the energy in layers 5-24, while the two sources deposited comparable energy in intermediate layers 3-4. Because betatron and bremsstrahlung energy deposition profiles overlapped minimally, we analyzed and simulated each separately using models described in the previous two sections. We then unfolded the complete profile in one shot with the help of a single additional parameter describing their overall relative amplitude. For data in Fig. 5(a), electrons originated from a 3-mm-long LWFA gas jet, yielding the energy spectrum with quasi-monoenergetic peak at 260 MeV shown in Fig. 5(b), which we measured on the same shot as the X-ray energy deposition profile.
Black solid (blue dashed) curves in Fig. 5(a) represent unfolded deposited energy profiles based on Eq. 1 for betatron radiation, on Kramers’ Law (Born cross-section) for bremsstrahlung, and on an overall betatron/bremsstrahlung amplitude ratio parameter. We gave the Born cross-section model the form of Eq. 2 (rather than 3), since electrons lose negligible energy in the thin target. Both fitted curves fall within experimental error bars throughout the detector stack, and differ noticeably from each other only in layers . Fig. 5(c) and (d) show corresponding betatron and bremsstrahlung spectra, respectively, while the last two rows of Table 3 list unfolded model parameters for betatron radiation and bremsstrahlung. The difference in betatron parameters and result from compensating for the difference between the two bremsstrahlung models in intermediate layers .
| Betatron parameters | Bremsstrahlung parameters | |||
| (keV) | (MeV) | |||
| Simulated | 16.5 | |||
| Unf: Kramers | ||||
| Unf: Born x-sec | ||||
The red dotted line in Fig. 5(a) represents the “simulated” energy deposition profile. To obtain this curve, we first generated the bremsstrahlung part of the energy deposition profile in Geant4 using the measured electron spectrum [Fig. 5(b)], and scaled it vertically to match the measured energy deposition in layers 8 through 24. We then used the remaining energy in the stack to unfold the betatron contribution based on Eq. 1. The simulated profile also falls within experimental error bars throughout the stack, and nearly overlaps the unfolded “Kramers” profile. Likewise, the corresponding simulated spectra [red dotted curves in Fig. 5(c) and (d)] and model parameters (Table 3, third row from bottom) closely match their unfolded “Kramers” model counterparts. Within uncertainty, we observed the same number of betatron photons as from the pure betatron source. On the other hand, we observe 300 times fewer bremsstrahlung photons per electron from the thin Kapton target (Table 3) than from the thick tantalum target (Table 2).
ICS X-rays. The ICS radiation spectrum is derived [20] from Liénard-Wiechert potentials of accelerating electrons undergoing sinusoidal undulations in the electric field of a counter-propagating laser pulse. When the laser strength parameter , analogous to a wiggler parameter, is much less than unity, radiation is generated in a forward directed cone at the Doppler-upshifted fundamental frequency[20] . Here, is the central laser frequency (and = 1.55 eV the central photon energy) and the angle of observation relative to the electron propagation direction. Assuming and given an electron spectrum , the energy radiated per unit can be calculated:
| (6) |
Here, is sharply peaked at the resonant frequency. This integration can take additional time and requires knowledge of the electron spectrum . For a peaked electron spectrum with relative energy spread , the angle-integrated ICS spectrum can be approximated by a Gaussian function with mean photon energy and variance (see Supplementary Material):
| (7) |
Here, we express the spectral amplitude in terms of integrated X-ray pulse energy in order to retain a pure Gaussian function on the right-hand side. The parameters and must satisfy two physical constraints: (i) cannot exceed ; (ii) must exceed the relative energy spread of the electron bunch, i.e. . The values of and extracted from data analysis can then help to diagnose a variety of physical effects involved in ICS with a plasma mirror, e.g. redshift of laser photon frequency during LWFA, which decreases ; laser frequency broadening (here, or larger), electron energy spread (here, ) and angular divergence (here, ), and non-linear scattering (generation of harmonics) [45, 46], all of which contribute in quadrature to . Given the values of , and cited above, we constrain to a practical lower bound of during unfolding.
To generate ICS radiation, we used the thin Kapton foil to minimize bremsstrahlung, and placed it only cm from the LWFA exit to ensure strong retro-reflection of the spent LWFA drive pulse via plasma mirroring, thereby maximizing ICS. Nevertheless betatron radiation from the LWFA leaked through the foil, and electrons from the LWFA generated some bremsstrahlung on passing through it. To remove the bremsstrahlung and betatron component, we took advantage of our ability, demonstrated in the preceding sections, to simulate the bremsstrahlung and betatron energy deposition profiles quantitatively and scale it to each shot based on the electron charge and average energy. We then subtracted this from the measured profile, leaving us with a pure ICS profile only. The ratio of energy in the scaled bremsstrahlung/betatron profile to the total measured energy is for both shots and agrees with independent scintillator based measurements of the relative contributions [47]. The uncertainty in the final background subtracted ICS energy deposition profile incorporates the combined uncertainty in the measured data (10% relative uncertainty) and the scaled bremsstrahlung/betatron uncertainty which we estimate has an increased relative uncertainty of 15%. Thus, the final relative uncertainty is not constant for all layers and is higher for layers most affected by the subtraction procedure (layers 1 and 10-20). To include this modified uncertainty, the least squares optimization includes the relative uncertainty as a weighting for the unfolding. We will hereafter refer to the scaled bremsstrahlung/betatron profile as the background and the final ICS energy deposition profile after the subtraction procedure as the background-subtracted ICS data.
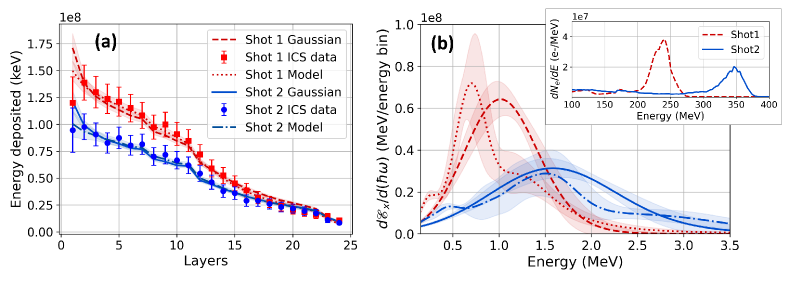
Red and blue data points in Fig. 6(a) show background-subtracted energy deposition profiles of ICS generated on two separate shots, for which electron bunches had peak energy MeV ( and MeV (), respectively [see red dashed and blue solid curves in the inset of Fig. 6(b)]. We achieved the lower and higher electron energies by tuning plasma density to and , respectively. Red dashed and blue solid curves in Fig. 6(a) show best-fit energy deposition profiles from the unfolding process; corresponding curves in the main panel of Fig. 6(b) show unfolded ICS spectra of the form of Eq. (7). Red and blue shading around both pairs of curves represents unfolding uncertainty. Table 4 lists ICS X-ray parameters and of the unfolded spectra, along with corresponding electron parameters for each shot. The unfolded values for the two shots stand in the ratio , whereas the expected scaling of would yield a ratio , assuming identical laser frequency on both shots. While these ratios agree within the combined stated uncertainty, a possible reason for the discrepancy is that the laser pulse driving the denser plasma experienced a larger redshift, thus shifting the more energetic X-ray peak to lower energy.
| Electron parameters | Unfolded ICS parameters | ||||
| (MeV) | (>150 MeV) | (keV) | E spread () | (FWHM) | |
| Shot 1 | |||||
| Shot 2 | |||||
Table 4 presents the statistical average and standard deviation for and for each shot. The two unfolded peaks are separated by more than their combined standard deviation and the unfolded value of for one peak falls outside of the FWHM of the second peak for 100% of trials. We estimate a resolution of the unfolded of 100-200 keV for peak X-ray sources in the energy range of 500 keV to 2 MeV.
Simulations of the ICS spectrum require a good understanding of the 3-D laser intensity and the 6-D electron phase space to get accurate results of the farfield radiation spectrum [46]. However, the use of a plasma mirror makes it difficult to know the exact intensity and spectrum of the scattering laser pulse. Instead, a radiation model based on theory from Esarey et al. (1993) [20] can be used to calculate the anticipated spectral shape generated by the measured electron spectrum scattering from a laser pulse of central frequency and laser strength parameter (see Supplementary Material). The calculation integrates over observation angles that would contribute to signal in the stack and assumes the central frequency of the scattering laser can be redshifted by a percent of the original e.g. where . Calculations assuming several different values of in the range were performed and the spectra resulting from other values within these bounds can be interpolated to provide a set of solutions to compare with the Gaussian model.
An unfolding based on this radiation model finds and to be the values that best fit the measured energy profile () for shot 1 (shot 2). Fig. 6(a) shows the calculated energy deposition profiles (dotted and dash-dotted curves) based on the best fit values of RS and for the radiation model. The corresponding spectra from the model are shown in Fig. 6(b) as dotted and dash-dotted curves with shading corresponding to the uncertainty of the unfolding. The goodness of fit defined by the fitness function (see Methods) is smaller for the radiation model that incorporates the electron spectrum compared with the Gaussian assumption. Moreover, the values of agree to within combined uncertainty with independent estimates of the laser intensity 1 mm after the exit of the accelerator [47].
Discussion
The methods for unfolding the incident photon spectrum presented here are capable of capturing the characteristic radiation parameters for LWFA sources such as the betatron critical energy, bremsstrahlung average energy and ICS peak energy. The main limitation of the stack calorimeter detector and any algorithm used to unfold the incident photon spectrum is that uniqueness of the solution cannot be guaranteed. Here we obtained a robust range of solutions by assuming physical models for the shape of the spectrum and deriving uncertainties from an ensemble of such solutions generated by sampling the measured energy distribution over 100 iterations. An example of this range is the unfolding of bremsstrahlung spectra using two different models that yielded indistinguishable energy deposition profiles with a thick, high-Z target. This multiplicity of solutions indicates that increasing the complexity of the radiation models to account for more features does not necessarily improve the certainty in the reconstructions. We have shown that applying simple assumptions based on the physics of each source can narrow down the range of solutions significantly. Moreover, the comparison for each case to models that incorporate the measured electrons such as the simulated betatron or simulated bremsstrahlung are in agreement within the unfolded uncertainty in all cases. The ICS source is an example where a model that incorporates the electron spectrum can provide a better fit to the observed energy profile, but both unfolded energy profiles fell within the uncertainty of the measured profiles for each shot. Nonlinear ICS in which approaches and exceeds 1 is just such a case where a more complex model may be necessary to unfold the harmonics of the fundamental, . Additionally, unfolding the spectra of X-rays radiated by electrons with multiply-peaked energy distributions will require models that incorporate such distributions explicitly.
Currently, using a least squares optimization algorithm, each single parameter case (betatron and bremsstrahlung dominated) converge to the solutions presented here in s. The case of multiple parameters (bremsstrahlung + betatron and ICS dominated) converges in s on a lab grade laptop. These algorithms can easily be transferred to manycore processors since each unfolding is performed 100 times and each run is independent. These computations can be parallelized to reduce the unfolding time by a factor of 100 or more to ms. To achieve data acquisition rates commensurate with such computational speed, image plates will need to be replaced with prompt scintillators compatible with 10 Hz LWFA repetition rates [48]. In this geometry, plastic scintillators or scintillating fiber arrays alternate with absorbing material and the side of the stack is imaged with a camera or can be connected directly to photomultiplier tubes (PMTs)[49]. The analysis to generate the measured energy deposition profile can also be parallelized since the operations on image data are independent. Moreover, the transmission speed of data along Gigabit-ethernet or USB 3.0 cables is Gbps and can transfer typical image sizes of 5 Mb in ms. Cameras can already operate at the necessary 100 fps for this application. The limiting factor on the speed of unfolding is most likely in the conversion of data to a format for computation on a manycore processor. In total, current technology would allow a prompt scintillator based stack to operate at a minimum of 0.1 to 2 Hz, providing a method for actively unfolding spectra during LWFA experiments where emitted radiation provides a metric for the acceleration process e.g., enhanced betatron radiation from direct laser acceleration (DLA) or higher order harmonics in non-linear ICS.
We have presented a set of unfolded secondary X-ray spectra spanning over 4 orders of magnitude in energy from LWFA accelerated electrons with energies between 230 MeV and 550 MeV. The LWFA and target geometry can be tuned to generate betatron, bremsstrahlung or ICS dominated sources as well as a regime in which both betatron and bremsstrahlung contribute to the stack. We present unfolding of betatron radiation with a critical energy of keV and betatron radius of m which are compared with independent measurements using a X-ray sensitive CCD and simulations from CLARA2. Bremsstrahlung from an 800 m tantalum target is unfolded with an average energy of MeV and photons within the FWHM and is compared with Geant4 simulations. Thin-target bremsstrahlung from m of Kapton includes contribution from both betatron and bremsstrahlung and the unfolded critical energy of the betatron source is keV and the average bremsstrahlung energy is MeV, spanning 3 orders of magnitude in a single shot. Finally, ICS dominated radiation from electron bunches with different peak energies was unfolded to observe a shift in peak ICS energy from keV to MeV and a total of and photons in the FWHM, respectively. The ICS shots were compared with an electron dependent model that unfolded a value for of and and a relative redshift (RS = ) in the laser central frequency of and . The stack calorimeter is less sensitive to background and has a higher signal to noise ratio for the energy ranges presented here than similar spectrometers that rely on a Compton converter [27, 28] or Ross filter pairs [24, 25]. Furthermore, stack calorimeters are compact in size, making them ideal detectors for characterizing X-ray sources from a variety of laser systems.
Methods
Laser wakefield electron acceleration. Pulses of fs duration, nm center wavelength from the DRACO laser at Helmholtz-Zentrum Dresden-Rossendorf (HZDR) [50, 51] were focused to spot size 20 m (FWHM) with typical energy 2 J onto the entrance plane of a 3-mm or 5-mm-long He gas jet doped with 1% Nitrogen. The laser pulse fully ionized the helium, creating plasma of electron density in the range cm-3, and drove a LWFA in the self-truncated ionization-injection regime [50, 52]. A magnetic electron spectrometer [51, 53] with its entrance plane at cm downstream of the gas jet exit determined the electron energy distribution for each shot. Fig. 1(b) shows an example for the 3-mm jet. The spectrum consists of a quasi-monoenergetic peak with central energy in the range MeV (Lorentz factor ), energy spread 20 MeV (FWHM), rms divergence 2 mrad and charge in the range pC, which is responsible for most X-ray production, and a weak poly-energetic, low-energy background. The 5-mm jet yielded electrons with energy up to 550 MeV, with a stronger poly-energetic background.
X-ray spectral reconstruction. We write the integrated energy deposited in layer of the calorimeter as a vector with components . We wish to reconstruct from this the spectrum of incident X-rays, which we discretize as a vector describing the number of photons in bin j of energy and width . A stack response matrix describes the energy deposited in layer i by photon of energy and relates to via [34]:
| (8) |
where the sum is over the number of energy bins, . Here, , with keV for keV keV, keV for keV MeV, keV for MeV MeV, MeV for MeV MeV and MeV for MeV MeV. We generate by simulating energy deposition in the stack’s absorbers and IPs by mono-energetic photon beams of different using Geant4 [54]. A reconstruction begins with an initial guess of , which here is constrained to take the form of a physics-based analytic function of , typically including a small set of fit parameters, describing betatron, ICS or bremsstrahlung radiation, or a combination of them. Specific functions used for each type of X-ray source are presented in the Results. Knowledge of the presence and location of PMs and converters, and other experimental parameters, is critical in choosing appropriate functions. The most accurate models take the measured electron spectrum (Fig. 1(b)) specifically into account. However, models that do not depend explicitly on the electron spectrum are also useful for rapid, albeit approximate, results. In either case, a forward calculation using equation 8 generates a first-generation , which is compared to the measured energy distribution . A fitness function
| (9) |
i.e. the sum of squared residuals between the calculated and measured energy, then evaluates the goodness of fit where, denotes the number of layers. In subsequent iterations, is varied in an effort to minimize . Here, we unfold the spectral shape, not the absolute value, of , by fitting to the energy distribution normalized to total deposited energy . The overall scaling is reintroduced after the completed unfolding to account for the total energy in the beam (see Supplementary Material for stack calibration). As in solving any complex inverse problem with incomplete information, convergence of the iterative procedure and uniqueness of any best fit solution cannot be guaranteed. Thus thorough tests of the sensitivity of results to initial guesses, awareness of experimental conditions, liberal use of physical constraints on the form of solutions and accurate evaluation of error are essential to achieving reliable results.
Analyzing stack data. For each IP layer in the stack the deposited energy is integrated within the FWHM of the incident beam to determine the measured energy distribution in the stack, (plotted in Fig. 2). The divergence of the incident photon beams is found by averaging the divergence in each layer over the relevant layers for each X-ray source. The betatron divergence is found using only layer 1, while the divergence of the bremsstrahlung and ICS sources is averaged over layers 5-18 to avoid an overestimation caused by betatron contributions or scattering in the high Z layers. Table 5 compiles the measured beam divergence for each presented case, the radius of integration for an the resulting energy deposited. In the case of the betatron + bremsstrahlung X-rays from a 25 m-thick Kapton target, the energy deposition profile is integrated over a radius corresponding to the bremsstrahlung HWHM of for unfolding both sources. The unfolded betatron spectrum is then scaled to the energy integrated within a radius of 7 mrad corresponding to the betatron HWHM for direct comparison with the betatron dominated case.
| Beam HWHM (mrad) | Integration radius (mrad) | Total energy deposited (keV) | |
| Betatron | 7.7 | ||
| 800 m Ta bremsstrahlung | 5.7 | ||
| 25 m Kapton bremsstrahlung (betatron) | () | 3.4 (7) | |
| ICS shot 1 | 4.5 | ||
| ICS shot 2 | 3.5 |
Error management. Uncertainty and error in measured energy deposition distribution propagate into uncertainties and errors in recovered X-ray spectra , and must therefore be carefully evaluated. Calibration of IP sensitivity and scanner introduce uncertainty of order into the absolute value of measured energy (see Supplementary Material). Variability of the fading rate of IP luminescence (typically when scanned 10-15 minutes after exposure) [55] introduces additional uncertainty. Fortunately, most of this uncertainty affects only overall energy deposited and absolute energy of the beam, not the shape of the energy deposition from which is unfolded. Nevertheless, layer-dependent errors arise when IPs with different ages, manufacturing and usage histories, and distributions of defects are mixed together in a stack. Repeated exposures of the same IP yield up to rms variation in recorded PSL [56]. Based on this measurement, we estimated rms variations within a stack, to take into account age and sensitivity difference among different IPs. Such variations introduce uncertainty into the normalized shape of the energy distribution, and hence into parameters of the unfolded spectrum. To take this into account, we randomly generate a normal distribution of synthetic energy profiles with standard deviation of around the measured profile . This ensemble of synthetic energy profiles then becomes the target for unfolding. Each iteration uses one distribution from the ensemble as a target; the procedure is repeated 100 times using different to obtain an equivalent ensemble average and standard deviation for the spectrum , and for a given model’s parameter set .
Data Availability. The data that support the plots within this article and other findings of this study are available from the corresponding author upon reasonable request.
References
- [1] Jaeschke, E. J., Khan, S., Schneider, J. R. & Hastings, J. B. Synchrotron Light Sources and Free-Electron Lasers (Springer International Publishing, 2016).
- [2] Lewis, B. Medical applications of synchrotron radiation x-rays. \JournalTitlePhysics in Medicine and Biology 42, 1213–1243, DOI: 10.1080/08940886.2011.567156 (1997).
- [3] Suortti, P. & Thomlinson, W. Medical applications of synchrotron radiation. \JournalTitlePhys. Med. Biol. 48, R1–R35, DOI: 10.1080/08940886.2011.567156 (2003).
- [4] Ketcham, R. A. & Carlson, W. D. Acquisition, optimization and interpretation of x-ray computed tomographic imagery: Applications to the geosciences. \JournalTitleComputers and Geosciences 27, 381–400, DOI: 10.1016/S0098-3004(00)00116-3 (2001).
- [5] Falk, K. et al. Combined x-ray scattering, radiography, and velocity interferometry/ streaked optical pyrometry measurements of warm dense carbon using a novel technique of shock-and-release. \JournalTitlePhysics of Plasmas 21, 056309, DOI: 10.1063/1.4876613 (2014).
- [6] Chen, G., Bennett, G. & Perticone, D. Dual-energy X-ray radiography for automatic high-Z material detection. \JournalTitleNuclear Instruments and Methods in Physics Research, Section B: Beam Interactions with Materials and Atoms 261, 356–359, DOI: 10.1016/j.nimb.2007.04.036 (2007).
- [7] Hanke, R., Fuchs, T. & Uhlmann, N. X-ray based methods for non-destructive testing and material characterization. \JournalTitleNuclear Instruments and Methods in Physics Research, Section A: Accelerators, Spectrometers, Detectors and Associated Equipment 591, 14–18, DOI: 10.1016/j.nima.2008.03.016 (2008).
- [8] Allen, M. A. et al. High-Gradient Electron Accelerator Powered by a Relativistic Klystron. \JournalTitlePhysical Review Letters 63, 2472–2475, DOI: 10.1103/PhysRevLett.63.2472 (1989).
- [9] Tajima, T. & Dawson, J. M. Laser electron accelerator. \JournalTitlePhysical Review Letters 43, 267–270, DOI: 10.1103/PhysRevLett.43.267 (1979).
- [10] Esarey, E., Schroeder, C. B. & Leemans, W. P. Physics of laser-driven plasma-based electron accelerators. \JournalTitleReviews of Modern Physics 81, 1229–1285, DOI: 10.1103/RevModPhys.81.1229 (2009).
- [11] Downer, M. C., Zgadzaj, R., Debus, A., Schramm, U. & Kaluza, M. C. Diagnostics for plasma-based electron accelerators. \JournalTitleReviews of Modern Physics 90, 35002, DOI: 10.1103/RevModPhys.90.035002 (2018).
- [12] Gonsalves, A. J. et al. Petawatt Laser Guiding and Electron Beam Acceleration to 8 GeV in a Laser-Heated Capillary Discharge Waveguide. \JournalTitlePhysical Review Letters 122, 084801, DOI: 10.1103/PhysRevLett.122.084801 (2019).
- [13] Corde, S. et al. Femtosecond x rays from laser-plasma accelerators. \JournalTitleReviews of Modern Physics 85, 1–48, DOI: 10.1103/RevModPhys.85.1 (2013).
- [14] Albert, F. et al. Laser wakefield accelerator based light sources: potential applications and requirements. \JournalTitlePlasma Physics and Controlled Fusion 56, 084015, DOI: 10.1088/0741-3335/56/8/084015 (2014).
- [15] Kneip, S. et al. X-ray phase contrast imaging of biological specimens with femtosecond pulses of betatron radiation from a compact laser plasma wakefield accelerator. \JournalTitleApplied Physics Letters 99, 18–21, DOI: 10.1063/1.3627216 (2011).
- [16] Döpp, A. et al. An all-optical Compton source for single-exposure x-ray imaging. \JournalTitlePlasma Physics and Controlled Fusion 58, 2–5, DOI: 10.1088/0741-3335/58/3/034005 (2016).
- [17] Esarey, E., Shadwick, B. A., Catravas, P. & Leemans, W. P. Synchrotron radiation from electron beams in plasma-focusing channels. \JournalTitlePhysical Review E - Statistical Physics, Plasmas, Fluids, and Related Interdisciplinary Topics 65, 056505, DOI: 10.1103/PhysRevE.65.056505 (2002).
- [18] Kostyukov, I., Kiselev, S. & Pukhov, A. X-ray generation in an ion channel. \JournalTitlePhysics of Plasmas 10, 4818–4828, DOI: 10.1063/1.1624605 (2003).
- [19] Rousse, A. et al. Production of a keV X-ray beam from synchrotron radiation in relativistic laser-plasma interaction. \JournalTitlePhysical Review Letters 93, 1–4, DOI: 10.1103/PhysRevLett.93.135005 (2004).
- [20] Esarey, E., Ride, S. & Sprangle, P. Nonlinear Thomson scattering of intense laser pulses from beams and plasmas. \JournalTitlePhysical Review E 48, 3003–3021, DOI: 10.1103/PhysRevE.48.3003 (1993).
- [21] Glinec, Y. et al. High-resolution -ray radiography produced by a laser-plasma driven electron source. \JournalTitlePhysical Review Letters 94, 1–4, DOI: 10.1103/PhysRevLett.94.025003 (2005).
- [22] Fourment, C. et al. Broadband, high dynamics and high resolution charge coupled device-based spectrometer in dynamic mode for multi-keV repetitive x-ray sources. \JournalTitleReview of Scientific Instruments 80, DOI: 10.1063/1.3189004 (2009).
- [23] Köhler, A. et al. Single-shot betatron source size measurement from a laser-wakefield accelerator. \JournalTitleNuclear Instruments and Methods in Physics Research, Section A: Accelerators, Spectrometers, Detectors and Associated Equipment 829, 265–269, DOI: 10.1016/j.nima.2016.02.031 (2016).
- [24] Ross, P. A. A New Method of Spectroscopy for Faint X-Radiations. \JournalTitleJournal of the Optical Society of America 16, 433, DOI: 10.1364/josa.16.000433 (1928).
- [25] Khutoretsky, I. V. Design of an optimal Ross filter system for x-ray spectra measurements in the range of 8.98-88 keV. \JournalTitleReview of Scientific Instruments 66, 773–775, DOI: 10.1063/1.1146285 (1995).
- [26] King, P. M. et al. X-ray analysis methods for sources from self-modulated laser wakefield acceleration driven by picosecond lasers. \JournalTitleReview of Scientific Instruments 90, DOI: 10.1063/1.5082965 (2019).
- [27] Singh, S. et al. Compact high energy x-ray spectrometer based on forward Compton scattering for high intensity laser plasma experiments. \JournalTitleReview of Scientific Instruments 89, 1–8, DOI: 10.1063/1.5040979 (2018).
- [28] Tiwari, G., Kupfer, R., Jiao, X., Gaul, E. & Hegelich, B. M. Gradient magnet design for simultaneous detection of electrons and positrons in the intermediate MeV range. \JournalTitleReview of Scientific Instruments 90, DOI: 10.1063/1.5099155 (2019).
- [29] Yan, W. et al. High-order multiphoton Thomson scattering. \JournalTitleNature Photonics 11, 514–521, DOI: 10.1038/nphoton.2017.100 (2017).
- [30] Laso Garcia, A. et al. Multipurpose high-energy X-ray calorimeter for high-intensity laser-matter interactions. \JournalTitleIn preparation for Review of Scientific Instruments (2021).
- [31] Chen, C. D. et al. A Bremsstrahlung spectrometer using k-edge and differential filters with image plate dosimeters. \JournalTitleReview of Scientific Instruments 79, 4–7, DOI: 10.1063/1.2964231 (2008).
- [32] Albert, F. et al. Angular dependence of betatron X-ray spectra from a laser-wakefield accelerator. \JournalTitlePhysical Review Letters 111, 1–5, DOI: 10.1103/PhysRevLett.111.235004 (2013).
- [33] Scott, R. H. et al. Measuring fast electron spectra and laser absorption in relativistic laser-solid interactions using differential bremsstrahlung photon detectors. \JournalTitleReview of Scientific Instruments 84, 1–11, DOI: 10.1063/1.4816332 (2013).
- [34] Horst, F. et al. A TLD-based ten channel system for the spectrometry of bremsstrahlung generated by laser-matter interaction. \JournalTitleNuclear Instruments and Methods in Physics Research, Section A: Accelerators, Spectrometers, Detectors and Associated Equipment 782, 69–76, DOI: 10.1016/j.nima.2015.02.010 (2015).
- [35] Rhee, Y. J. et al. Spectral tomographic analysis of Bremsstrahlung X-rays generated in a laser-produced plasma. \JournalTitleLaser and Particle Beams 34, 645–654, DOI: 10.1017/S0263034616000604 (2016).
- [36] Hidding, B. et al. Novel method for characterizing relativistic electron beams in a harsh laser-plasma environment. \JournalTitleReview of Scientific Instruments 78, DOI: 10.1063/1.2775668 (2007).
- [37] D’Agostini, G. A multidimensional unfolding method based on Bayes’ theorem. \JournalTitleNuclear Inst. and Methods in Physics Research, A 362, 487–498, DOI: 10.1016/0168-9002(95)00274-X (1995).
- [38] Pausch, R. et al. How to test and verify radiation diagnostics simulations within particle-in-cell frameworks. \JournalTitleNuclear Instruments and Methods in Physics Research, Section A: Accelerators, Spectrometers, Detectors and Associated Equipment 740, 250–256, DOI: 10.1016/j.nima.2013.10.073 (2014).
- [39] Ta Phuoc, K. et al. All-optical Compton gamma-ray source. \JournalTitleNature Photonics 6, 308–311, DOI: 10.1038/nphoton.2012.82 (2012).
- [40] Tsai, H. E. et al. Compact tunable Compton x-ray source from laser wakefield accelerator and plasma mirror. \JournalTitlePhysics of Plasmas 22, 023106, DOI: 10.1063/1.4965663 (2015).
- [41] Koch, J. W., H. W. Motz. Bremsstrahlung Cross-Section Formulas and Related Data. \JournalTitleReviews of Modern Physics 31, 920–955, DOI: 10.1103/RevModPhys.31.920 (1959).
- [42] Bethe, H. & Heitler, W. On the Stopping of Fast Particles and on the Creation of Positive Electrons. \JournalTitleProceeding of the Royal Society A 146, 83–112, DOI: 10.1142/9789812795755{_}0006 (1934).
- [43] Kramers, H. A. On the theory of X-ray absorption and of the continuous X-ray spectrum. \JournalTitleThe London, Edinburgh, and Dublin Philosophical Magazine and Journal of Science 46, 836–871, DOI: 10.1080/14786442308565244 (1923).
- [44] Hubbell, J. H. & Seltzer, S. M. X-ray mass attenuation coefficients: Nist standard reference database 126, DOI: /10.18434/T4D01F.
- [45] Jochmann, A. et al. High resolution energy-angle correlation measurement of hard x rays from laser-Thomson backscattering. \JournalTitlePhysical Review Letters 111, 1–5, DOI: 10.1103/PhysRevLett.111.114803 (2013).
- [46] Krämer, J. M. et al. Making spectral shape measurements in inverse Compton scattering a tool for advanced diagnostic applications. \JournalTitleScientific Reports 8, 1–11, DOI: 10.1038/s41598-018-19546-0 (2018).
- [47] Hannasch, A. et al. Nonlinear Inverse Compton Scattering From a Laser Wakefield Accelerator and Plasma Mirror. \JournalTitleSubmitted to AAC Seminar Series Proceedings (2021).
- [48] Rusby, D. R. et al. Novel scintillator-based x-ray spectrometer for use on high repetition laser plasma interaction experiments. \JournalTitleReview of Scientific Instruments 89, DOI: 10.1063/1.5019213 (2018).
- [49] Wurden, G. A. et al. Scintillating-fiber 14 MeV neutron detector on TFTR during DT operation. \JournalTitleReview of Scientific Instruments 66, 901–903, DOI: 10.1063/1.1146200 (1995).
- [50] Couperus, J. P. et al. Demonstration of a beam loaded nanocoulomb-class laser wakefield accelerator. \JournalTitleNature Communications 8, 487, DOI: 10.1038/s41467-017-00592-7 (2017).
- [51] Schramm, U. et al. First results with the novel petawatt laser acceleration facility in Dresden. \JournalTitleJournal of Physics: Conference Series 874, 012028, DOI: 10.1088/1742-6596/874/1/012028 (2017).
- [52] Mirzaie, M. et al. Demonstration of self-truncated ionization injection for GeV electron beams. \JournalTitleScientific Reports 5, 1–9, DOI: 10.1038/srep14659 (2015).
- [53] Kurz, T. et al. Calibration and cross-laboratory implementation of scintillating screens for electron bunch charge determination. \JournalTitleReview of Scientific Instruments 89, 093303, DOI: 10.1063/1.5041755 (2018).
- [54] Agostinelli, S. et al. GEANT4 - A simulation toolkit. \JournalTitleNuclear Instruments and Methods in Physics Research, Section A: Accelerators, Spectrometers, Detectors and Associated Equipment 506, 250–303, DOI: 10.1016/S0168-9002(03)01368-8 (2003).
- [55] Tanaka, K. A. et al. Calibration of imaging plate for high energy electron spectrometer. \JournalTitleReview of Scientific Instruments 76, 013507, DOI: 10.1063/1.1824371 (2005).
- [56] Rosenberg, M. J. et al. Image-plate sensitivity to x rays at 2 to 60 keV. \JournalTitleReview of Scientific Instruments 90, DOI: 10.1063/1.5053592 (2019).
Acknowledgements
U. Texas authors acknowledge support from U. S. Department of Energy grant DE-SC0011617, A.H. from the National Science Foundation Graduate Research Fellowship grant No. DGE-1610403 and M. C. D. from the Alexander von Humboldt Foundation. HZDR authors acknowledge support from the Helmholtz Association under program Matter and Technology, topic Accelerator R & D.
Author contributions statement
A.H., A.L.G., M.L., R.Z., J.C.C., O.Z., T.K., A.F., M.M. and A.I. conducted the experiments. A.H. and A.L.G analyzed the results. A.H., A.L.G. and A.K. performed the simulations and A.K. conducted the experiment that contributed to data in Fig.3(b). L.N. helped with radioactive sources. T.E.C., U.S., A.I and M.C.D. provided overall supervision of the project. All authors reviewed the manuscript.
Additional information
Competing interests: The authors declare no competing interests.