Exploring Origins for Correlations between Flow Harmonics and Transverse Momentum in Small Collision Systems
(Unambiguous Ambiguity)
Abstract
High statistics data sets from experiments at the Relativistic Heavy Ion Collider (RHIC) and the Large Hadron Collider (LHC) with small and large collision species have enabled a wealth of new flow measurements, including the event-by-event correlation between observables. One exciting such observable gauges the correlation between the mean transverse momentum of particles in an event and the various flow coefficients () in the same event Bożek (2016). Recently it has been proposed that very low multiplicity events may be sensitive to initial-state glasma correlations Giacalone et al. (2020a) rather than flow-related dynamics. We find utilizing the ip-jazma framework that the color domain explanation for the glasma results are incomplete. We then explore predictions from pythia8, and the version for including nuclear collisions called pythia-angantyr, which have only non-flow correlations and the ampt model which has both non-flow and flow-type correlations. We find that pythia-angantyr has non-flow contributions to in O, Pb, OO collisions that are positive at low multiplicity and comparable to the glasma correlations. It is striking that in pythia8 in collisions there is actually a sign-change from positive to negative as a function of multiplicity. The ampt results match the experimental data general trends in Pb+Pb collisions at the LHC, except at low multiplicity where ampt has the opposite sign. In Pb collisions, ampt has the opposite sign from experimental data and we explore this within the context of parton geometry. Predictions for O, OO, and XeXe are also presented.
pacs:
25.75.DwI Introduction
The standard time-evolution model for relativistic heavy ion collisions at the Relativistic Heavy Ion Collider (RHIC) and the Large Hadron Collider (LHC) includes an “epoch” of quark-gluon plasma (QGP) formation and hydrodynamic expansion Busza et al. (2018). The QGP expands as a strongly coupled fluid with very small specific shear viscosity Romatschke and Romatschke (2019); Heinz and Snellings (2013). Detailed computer modeling of said time evolution requires inputs including the initial energy deposit geometry and any pre-hydrodynamic evolution. Higher level “flow” correlation observables, such as the event-by-event correlation of anisotropies () and mean transverse momentum , can provide additional insights and constraints on the interplay of geometry and subsequent transport Bożek (2016).
The ATLAS experiment has carried out measurements of the defined as
| (1) |
in Pb and PbPb collisions at = 5.02 TeV at the LHC Aad et al. (2019). The is the covariance between and , and and are the variances of and . Focusing on the correlation of elliptic flow and , in PbPb collisions the correlator is negative at low event multiplicity, then turning positive and increasing with multiplicity, and finally slightly decreasing for the very highest multiplicity events. These features are semi-quantitatively reproduce in a simple calculation of initial Glauber geometry combined with hydrodynamic flow Bozek (2016); Giacalone et al. (2020b); Schenke et al. (2020), though the results depend sensitively on the geometry model in small collision systems Bozek and Mehrabpour (2020).
The basic idea is that there are event-to-event fluctuations in the geometric size of the overlap region in the transverse plane at fixed multiplicity. Smaller overlap area with the same multiplicity leads to larger pressure gradients and thus larger radial flow and hence larger mean transverse momentum . If there is a positive correlation in geometry for smaller overlap area events to have a larger eccentricity, and vice versa, then one gets a positive correlator. If there is the opposite correlation such that for smaller overlap area events, they have a smaller eccentricity, and vice versa, then one gets a negative correlator. It has been shown that alternative variables to the overlap area present a stronger correlation Giacalone et al. (2020b); Schenke et al. (2020); however, the basic picture above still holds.
However, the detailed behaviour in the lowest multiplicity events warrants further examination. The question of whether small collision systems, for example and Pb at the LHC and Au, Au, 3HeAu at RHIC, have correlations induced via hydrodynamic expansion of small QGP droplets or via a mimic from initial-state correlations, for example glasma correlations, has been studied in detail Nagle and Zajc (2018); Dusling et al. (2016). Extensive data from the LHC and the geometry scan from RHIC Aidala et al. (2019), combined with theoretical clarification for glasma correlations Mace et al. (2018, 2019); Nagle and Zajc (2019), have given a clear answer for the higher multiplicity events in small collision systems – there is overwhelming evidence for correlations via initial geometry coupled with strong final-state interactions (e.g. hydrodynamics).
Even more recently, it has been proposed that initial-state correlations may yet dominate over final-state collectivity in the very lowest multiplicity collisions, i.e. for Schenke et al. (2019). Current there is no clear experimental evidence for such glasma correlations at these multiplicities. A proposal has been put forth that the correlation between anisotropies and event average can provide definitive evidence: Ref. Giacalone et al. (2020a) states that “experimental observation of these clean qualitative signatures in peripheral heavy ion and small system collisions will be the first evidence for the presence and importance of initial state momentum anisotropies predicted by an effective theory of QCD.”
The calculations, in a hybrid glasma and hydrodynamic model, indicate that the correlator should change sign from negative at low multiplicity back to positive at the very lowest multiplicities where glasma correlations dominate. The basic argument is that in the glasma color domain picture, events with a smaller transverse size will have fewer color domains and hence a stronger glasma type correlation. Ref. Schenke (2021) notes that at fixed multiplicity, the saturation scale of the projectile, which drives the , decreases with increasing transverse area and hence the positive correlator from initial-state glasma correlations alone. We highlight that the connection between the calculation in momentum-space and the spatial domain picture (see Ref. Lappi et al. (2016) for details) makes the cause-effect relation for the positive correlation via glasma diagrams to some degree speculative. In Appendix IX, we utilize the ip-jazma framework to show that the scaling of projectile saturation scale and eccentricity with overlap area do not follow the ordering postulated above and thus require further validation.
Due diligence requires the checking of whether non-exotic (i.e. not glasma correlations) could also mimic said sign change and hence positive correlations at the lowest multiplicities. It is notable that within the calculation of Ref. Giacalone et al. (2020a), there is no inclusion of what are often referred to as non-flow correlation effects (e.g. from dijet correlations, overall momentum conservation, etc.).
In this paper we explore the expectations for the correlator in the pythia8 and pythia-angantyr models Sjostrand et al. (2008); Bierlich et al. (2018), which have neither initial-state glasma correlations nor final-state interactions. pythia-angantyr is an extension of the publicly available pythia8 code that allows the modeling of and collisions, and is named for Angantyr the Berserker in Norse mythology saga og Heioreks (1618-1682). We highlight that there is a version of pythia-angantyr with so-called “string shoving” Bierlich et al. (2016) that may effectively model final-state interactions; however, we are running the code without this option turned on.
We also explore calculations from the A-Multi-Phase Transport (ampt) model Lin et al. (2005), which again has no initial-state glasma correlations but has both initial state non-flow (e.g. dijets) and final-state parton and hadron scattering. In the process of completing this manuscript, a complementary study using the pythia8 and hijing Gyulassy and Wang (1994) models has been submitted Zhang et al. (2021).
II Methodology
There are different methods for constructing the correlator, in part in an effort to reduce non-flow contributions. We follow the three-subevent method Aad et al. (2019) using three separate regions labeled , , and : , , and . Charged particles in subevents and are used to calculate to suppress the non-flow contribution, and the is obtained with charged particles from subevent . The is calculated using particles in , and particles in and are used to calculate the event multiplicity .
The term in the correlator is defined as
| (2) |
where is the azimuthal angle of particles in the region (), and is the average in the entire events at a certain multiplicity range. The variance of is calculated with two-particle and four-particle correlations,
| (3) |
where and are the flow coefficients obtained from two- and four-particle correlations, respectively. The and are the two-particle and four-particle correlations with the subevent method Jia et al. (2017) with particles in the region and . Events required to have at least two charged particles in each region ( and ) for the four-particle correlation. The variance of is estimated by the dynamical fluctuation magnitude Abelev et al. (2014) defined as
| (4) |
and particles in region are used. The is calculated with , , and , and the should be positive for valid value.
III pythia8 Results
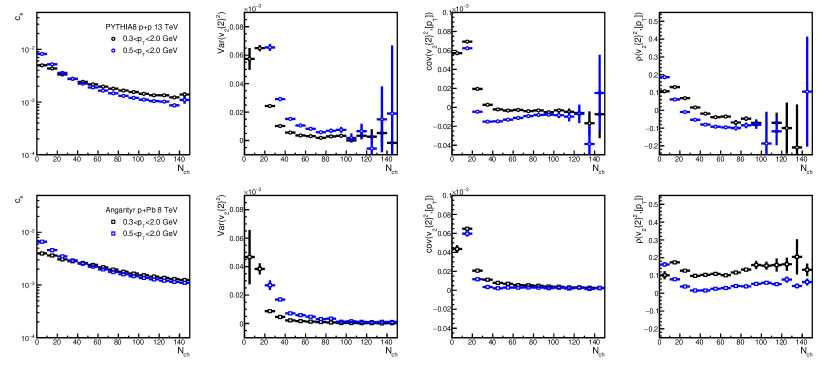
We have run millions of events for various collision systems within the pythia8 and pythia-angantyr frameworks. The output particle truth list is then processed through the full three-subevent calculation detailed above. Here we utilize the ATLAS define regions of , , and and consider charged hadrons with . For the event category, the is determined within the range and for charged hadrons with . Figure 1 shows the resulting correlator from pythia8 for at 5 TeV and 13 TeV and from pythia-angantyr for O at 5 TeV, Pb at 8 TeV, and OO at 5 TeV. Note that future running of O and OO at the LHC may end up being run at a different collision energy. The full eight-panel set of calculated ingredients that go into the correlator are shown in the Appendix VIII in Figure 11.
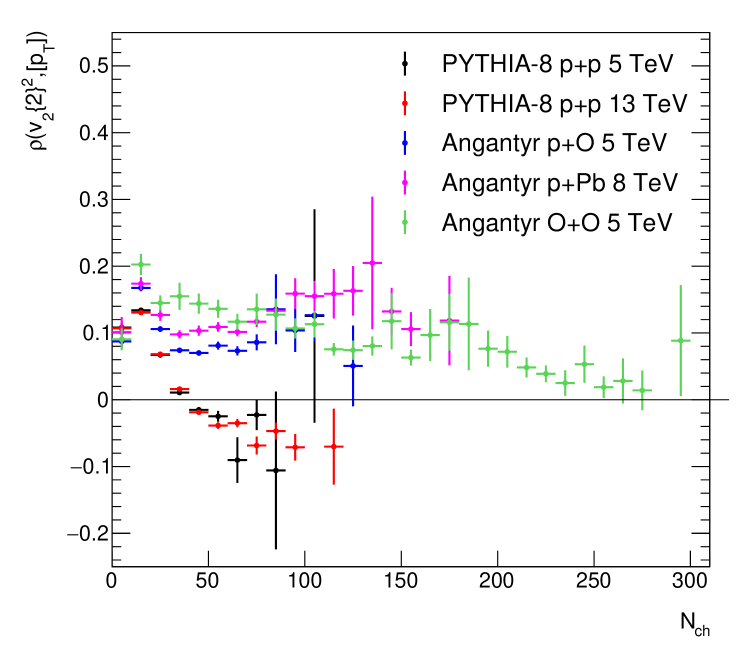
The correlations in O, Pb, and OO collisions are positive for all and are around 10%. In contrast, the results in at 5 and 13 TeV (consistent with each other) are positive for and then change sign to negative for . These non-zero correlations cannot be from spatial geometry coupled to final-state interactions or flow, since pythia-angantyr has neither. Instead they result from non-trivial correlations due to jets, correlation between jets and underlying event, and multiplicity category correlations.
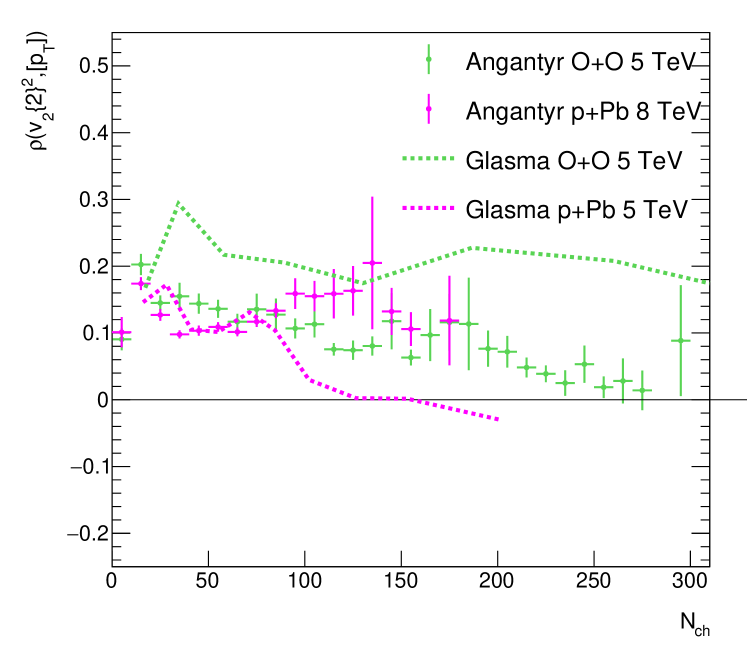
Figure 2 shows a comparison in Pb and OO between the pythia-angantyr results and glasma initial-state calculations Giacalone et al. (2020a). In this case, the glasma correlator is a proxy determined in momentum space from the correlations encoded in the prior to any hydrodynamic calculation in their hybrid framework. What is striking is that both calculations are positive and of a similar order of magnitude. It decidedly means that a full accounting of non-flow effects, as coded into pythia8 and pythia-angantyr, are needed to make any statement about more exotic glasma correlations.
It should be be pointed out that such contributions as seen in the correlation may be additive to leading order if the sources of flow and non-flow particles are independent, as is often assumed in non-flow subtraction techniques. However, in low multiplicity events this independence must be violated due to momentum conservation, overall color neutrality, as well as the possible direct scattering of particles from each source. Thus, one can postulate additive contributions Zhang et al. (2021), though at the lowest multiplicities it is unknown the level of violation.
IV ampt Results
We now compare with calculations from the ampt model (version v1.26t9b-v2.26t9b), which is publicly available code Lin et al. (2005). The ampt model has been run it the default mode, with a parton screening mass of 3.22 fm-1 (or equivalently a parton-parton cross section of 3 mb) and with Lund symmetric splitting function parameters ( and ), set to optimize matching with particle multiplicities and at the LHC Zhang et al. (2019). ampt has been successful at describing a number of global and flow features of heavy ion data, including in small collision systems – see Refs. Zhang et al. (2019); He et al. (2016); Orjuela Koop et al. (2015); Bzdak and Ma (2014) for examples.
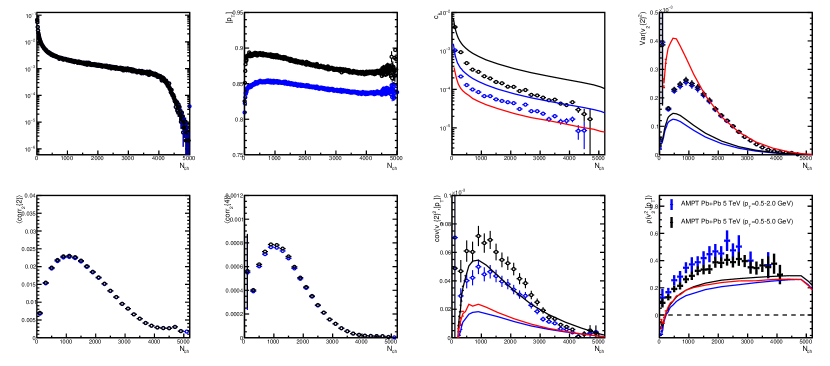
Again, millions of ampt events have been run for at 5 and 13 TeV, O and OO at 5 TeV, Pb at 5 and 8 TeV, and XeXe and PbPb at 5 TeV. The results for large systems are shown in Figure 3 and compared with ATLAS results in PbPb collisions Aad et al. (2019). The AMPT results are calculated with the three-subevent method in , , and and consider charged hadrons with , matching the higher low- selection used by ATLAS in Ref. Aad et al. (2019). The ATLAS data -axis values are re-scaled since ATLAS does not correction for reconstruction efficiency in the published results.
The ampt PbPb results show a qualitatively similar trend to the ATLAS data, but are approximately a factor of two higher. It is also notable that neither the ampt PbPb nor XeXe go negative for the lowest as seen in the data. ATLAS has shown a modest dependence in PbPb collisions of on the selection of the charged hadrons used in their analysis Aad et al. (2019). They observe a modest 15% increase in when switching to charged hadrons with , while in ampt the has a roughly 15% decrease in with the same momentum selection change.
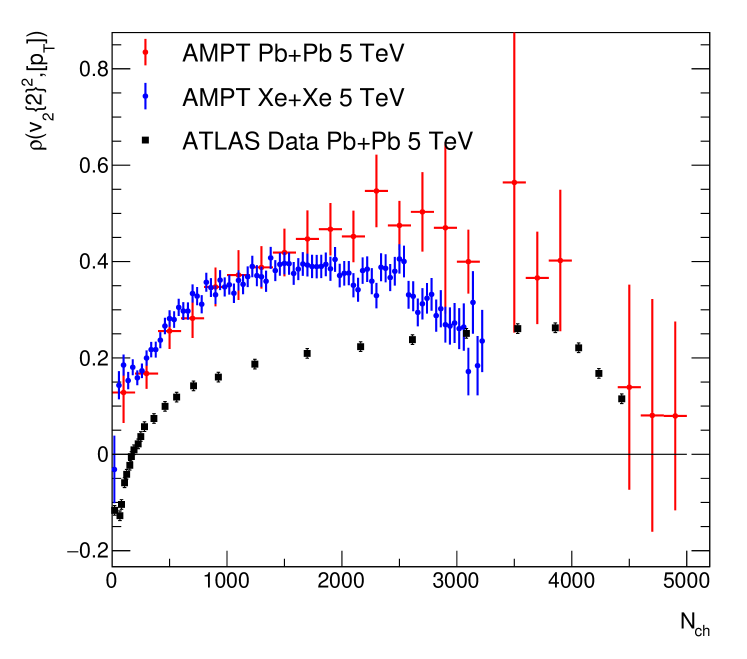
The full eight panel comparison of ingredients for PbPb that go into the calculation are shown in Appendix VIII in Figure 13. Again one observes qualitatively similar trends between ampt and data, but significant quantitative differences. One other striking observation from ampt is that the average as a function of actually decreases with increasing over a significant range of – see Figure 13 in Appendix VIII. This is contrary to results in experimental data Abelev et al. (2013) where average transverse momentum always increases with increasing in , Pb and PbPb collisions. One key question regarding finite parton-parton scattering pictures is how they build up radial flow and thus increase the . This ampt result indicates that this effect is not modeled fully in ampt, even for large collision systems.
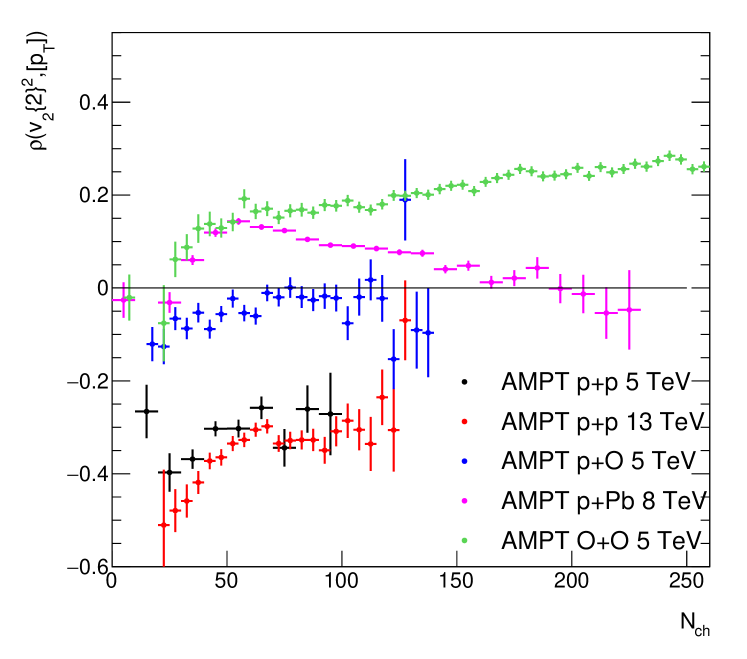
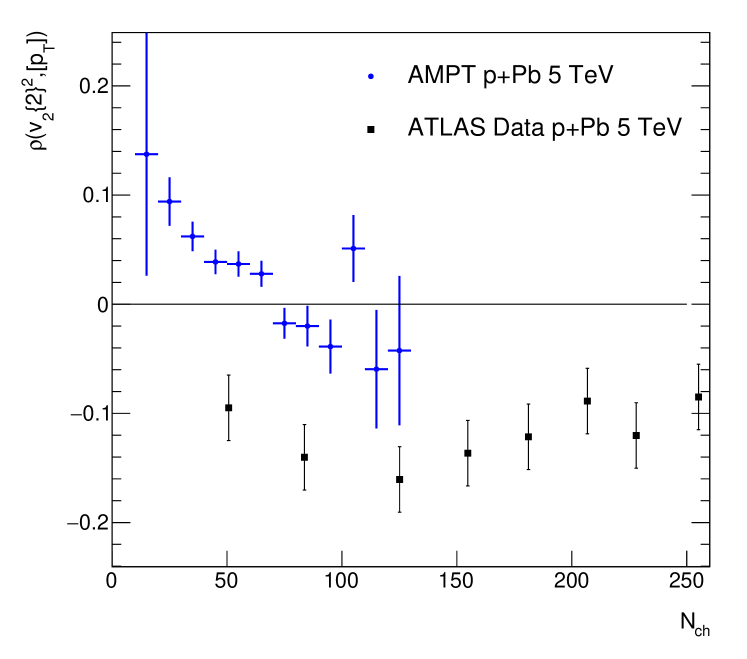
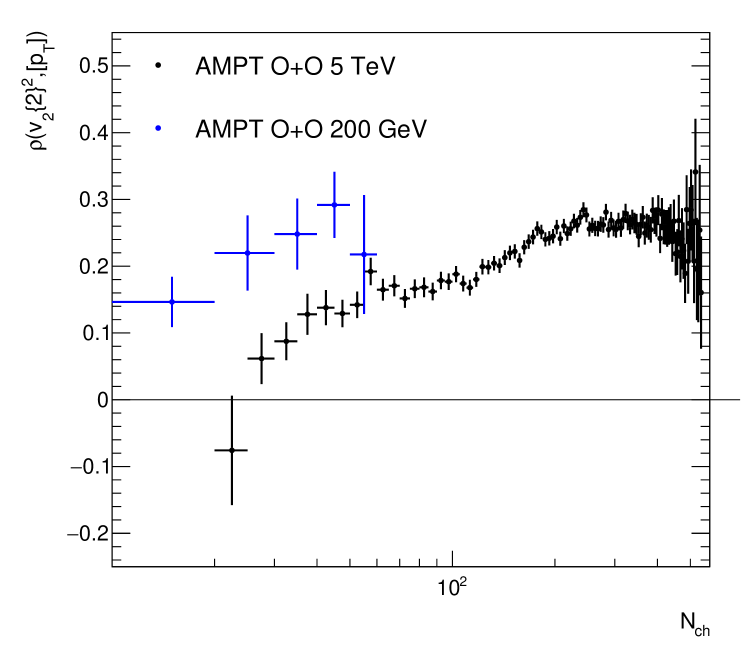
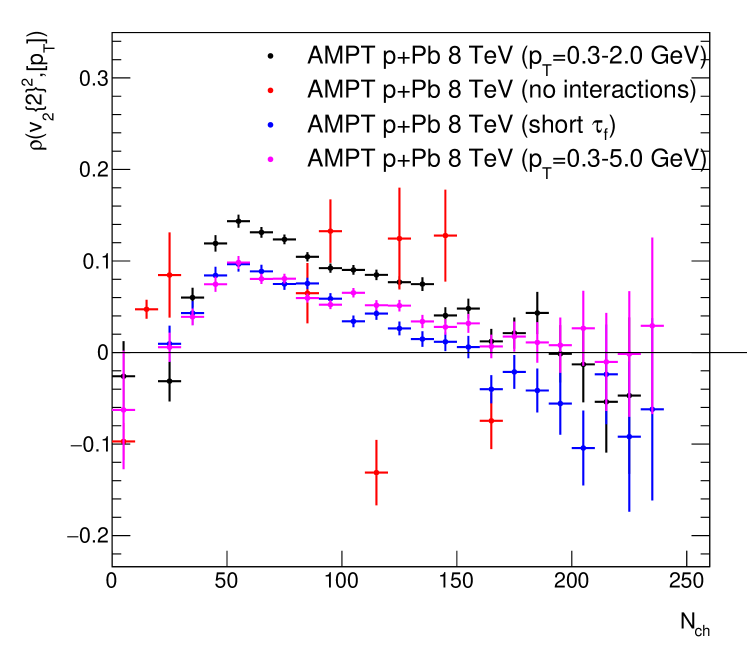
ampt predictions for small collision systems, at 5 and 13 TeV, O and OO at 5 TeV, and Pb at 8 TeV are shown in Figure 4. In this case the results vary from a large negative correlation in collisions to positive correlations in Pb and OO. It is striking that the positive correlations in Pb and OO are quite comparable to those from pythia-angantyr in Figure 1, even though ampt has both flow and non-flow contributions.
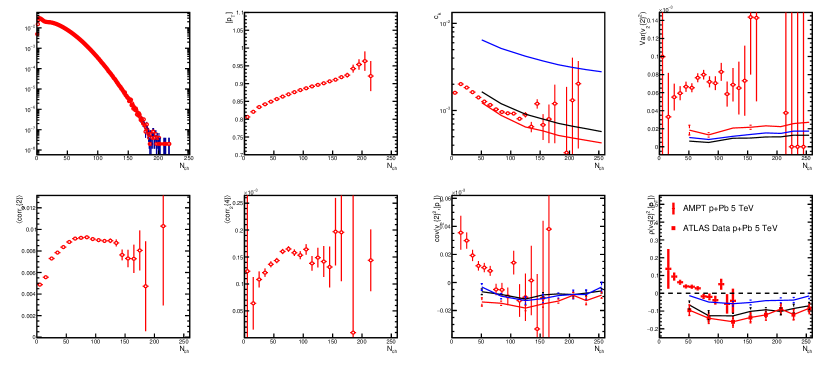
ATLAS has measured the correlator in Pb collisions, but from earlier data taken at 5 TeV. ampt calculations are compared with ATLAS data for Pb collisions at 5 TeV for the selection in Figure 9. The ampt result is positive, though decreasing with , and is opposite to the consistently negative result in data. The full eight panel comparison of ingredients for Pb that go into the calculation are shown in Appendix VIII in Figure 14.
Since there may be OO data taking at RHIC by the STAR experiment and/or the sPHENIX experiment at 200 GeV, as well as at the LHC in Run-3, we present predictions for the correlator from those systems in Figure 6. We highlight that for the results at 200 GeV, we have modeled the acceptance selections for a detector with and as such have regions , , and and consider charged hadrons with . Also, the -axis values of are defined by and . The results indicate a positive correlator with a very similar shape and magnitude at the two energies if one considers a rescaling of the -axis between collision energies.
V Discussion
Within the ampt model, one can examine the geometry as defined by the partons that are “string-melted” out of the color strings – as has been done previously Nagle et al. (2018); Orjuela Koop et al. (2016). The partons after appearing have a formation time set in ampt corresponding to the uncertainty principle before they can start scattering with other partons. It is their location after the formation time utilized here for calculating the eccentricity of the event and the overlap area Alver et al. (2008). Here we define the overlap area , noting there are different prefactors used in the literature.
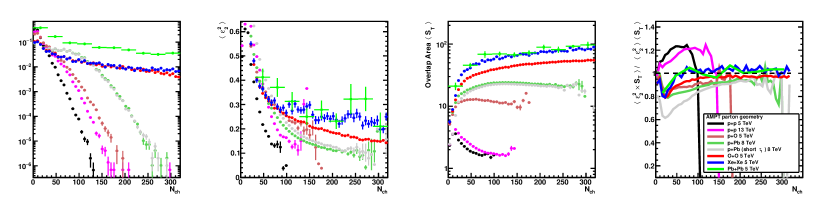
Figure 7 shows results from at 5 and 13 TeV, O and OO at 5 TeV, Pb at 8 TeV, and XeXe at 5 TeV. The panels from left to right show (i) the multiplicity distribution of events normalized to unity, (ii) the average eccentricity squared as a function of , (iii) the average overlap area as a function of , and the (iv) correlation between and normalized by their individual average values. Thus, the correlation is if there is a correlation between eccentricity and area and if there is an anti-correlation.
The correlation (or anti-correlation) in geometry is a good predictor for ampt for whether the correlation will be positive or negative. The positive correlation of eccentricity and area in collisions at 5 and 13 TeV is mirrored in the negative correlation shown in Figure 4, though not at larger . The negative geometry correlation for and OO is mirrored in the positive correlation again shown in Figure 4.
For comparison, we calculate the geometry correlation for Monte Carlo Glauber type models Loizides (2016). The Glauber calculation is carried out with standard nuclear geometry parameters and including three constituents per nucleon. The results for the (i) multiplicity, (ii) eccentricity squared, (iii) the overlap area, and (iv) the correlation of eccentricity and area are shown in Figure 8 in the panels from left to right.
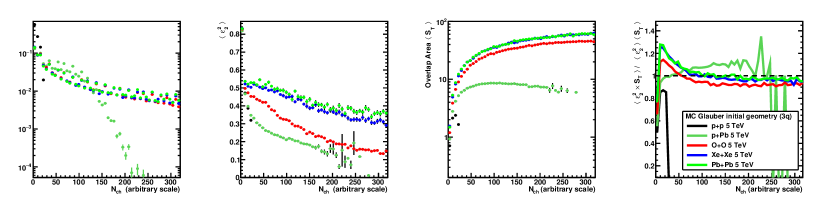
In this zoomed in view for , the geometry correlations are often opposite between ampt and Monte Carlo Glauber with three constituents. We know that in the case of collisions, the ampt geometry is almost exclusively two strings and thus the partons have a geometry that appears as two radial distributions of partons around each string with the distance in the transverse plane based on the formation time – see Ref. Nagle et al. (2018) for details. In this case, two strings that are farther apart will lead to a much more elliptical geometry and a larger area; hence the positive correlation seen in the ampt results in Figure 7. In contrast, in the Monte Carlo Glauber with three constituents, the larger area typically leads to a more circular geometry and thus a negative correlation. However, in ampt as soon as one has a collision, there are multiple strings and they have a geometry correlation that is negative and once again flipped from the Monte Carlo Glauber case. The disagreement of ampt with experimental Pb data shown in Figure 5 may lead one to conclude that ampt string geometry is not a good descriptor, or that a substantial over-prediction of non-flow in ampt changes the sign. Additional comparisons with measurements in data should prove useful.
One question is whether the formation time implemented in ampt might be altering the initial geometry as it mimics free streaming. Thus, for Pb collisions, we have re-run ampt with the formation time reduced by a factor of 10. Those results, labeled short , are also shown in Figure 7 and show a modestly smaller overlap area and a modestly larger eccentricity. These effects do impact the correlator as shown in Figure 9. These changes do modify the value by almost a factor of two, though do not change the sign.
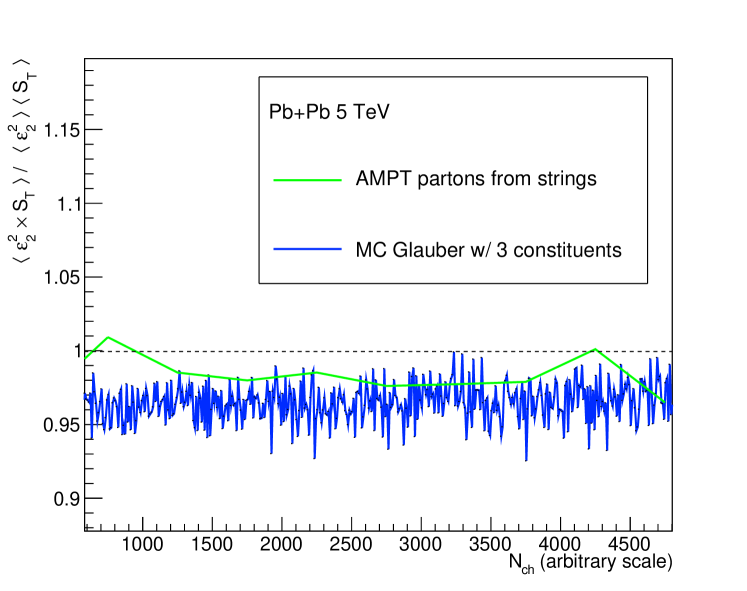
Finally, for the PbPb case, the geometry correlation is opposite in the very low region between ampt and Monte Carlo Glauber, where again ampt may have the wrong geometry as indicated by the lack of sign change that is seen in data – see Figure 3. However, for larger as shown in Figure 10, the correlation in both ampt and Monte Carlo Glauber is negative and thus would predict a positive correlator – exactly as seen in Figure 3 at . It is notable that the correlation is weaker, i.e. closer to one, in ampt, though it over-predicts by almost a factor of two.
VI Summary
In summary, we have carried out a study of elliptic flow – transverse momentum correlations within the context of pure non-flow pythia8 and pythia-angantyr models and the combination of flow and non-flow ampt model. The results indicate that even with the three-subevent method to reduce non-flow, substantial non-zero correlations persist for small collision systems and peripheral event classes in large collision systems. The pythia8 and pythia-angantyr correlations are comparable in size to predicted glasma correlations. It is striking that ampt calculations have the opposite sign to measured ATLAS data in Pb and peripheral PbPb collisions, which may indicate that the string geometry, combined with string melting, has an incorrect modeling of the initial geometry. Finally, the pure glasma results for the correlator are interesting, and the simple color domain explanation appears incorrect, and thus more study is warranted as explanations can be as important as the result itself.
VII Acknowledgements
We gratefully acknowledge useful discussions with Giuliano Giacalone, Jiangyong Jia, Blair Seidlitz, Bjoern Schenke, Christian Bierlich, and Ross Snyder. We also want to remember Jack Sandweiss, who was an inspiration to so many of us and would want us to continue to “take nature to the mat” and uncover it’s secrets. JLN acknowledges support from the U.S. Department of Energy, Office of Science, Office of Nuclear Physics under Contract No. DE-FG02-00ER41152. SHL acknowledges support from the National Research Foundation of Korea (NRF) grant funded by the Korea government (MSIT) under Contract No. 2020R1C1C1004985.
VIII Appendix A
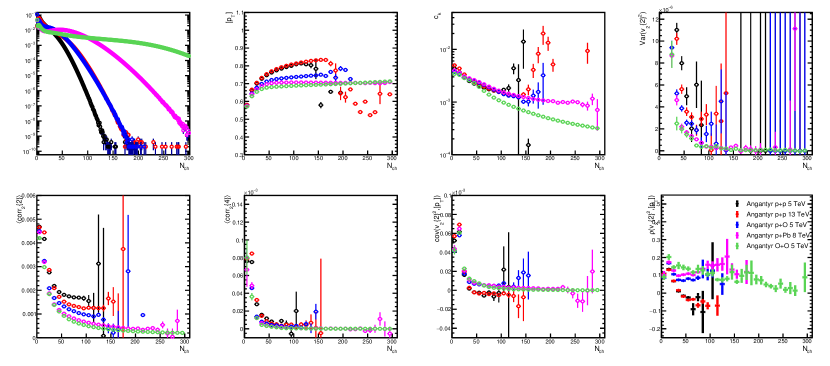
For completeness we include the full set of calculated quantities in the model calculations. Shown in Figure 11 are the pythia8 and pythia-angantyr results from upper left to upper right and then lower left to lower right: (i) the minimum bias distribution with the integral normalize to one, (ii) the event as a function of , (iii) the coefficient , (iv) the variance of , (v) the average two-particle cumulant, (vi) the average four-particle cumulant, (vii) the covariance, and finally (viii) the correlation all as a function of . We highlight that the range of shown here is meant to highlight small systems, and thus the OO distribution extends beyond the range of the figure. Also, at some large at the very tail of the distribution for each collision systems, the statistical uncertainties get large. In the distributions, we have eliminated points with uncertainties larger than a set value for clarity of comparison between systems. Note that results from pythia8 and pythia-angantyr for at 13 TeV are compared, and no significant difference is observed.
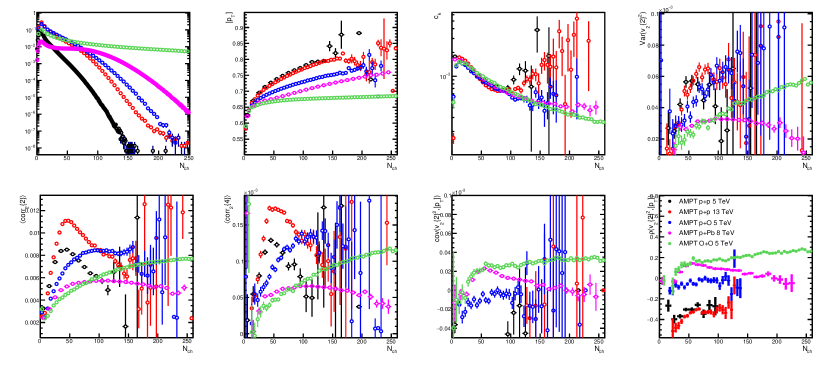
Shown in Figure 12 are the same quantities for small systems from ampt. Lastly, in Figures 13 and 14 are the eight panels for PbPb and Pb at 5 TeV compared with ATLAS results Aad et al. (2019).
Figure 15 shows results of the coefficient , the variance of , the covariance , and the correlation for two ranges in at 13 TeV and Pb at 8 TeV. The values in are lower than those in where the non-flow contribution is expected to be smaller. The correlations at low multiplicity are positive in both ranges and collision systems, but the sign change has been reported in Pb from hijing Zhang et al. (2021).
IX Appendix B
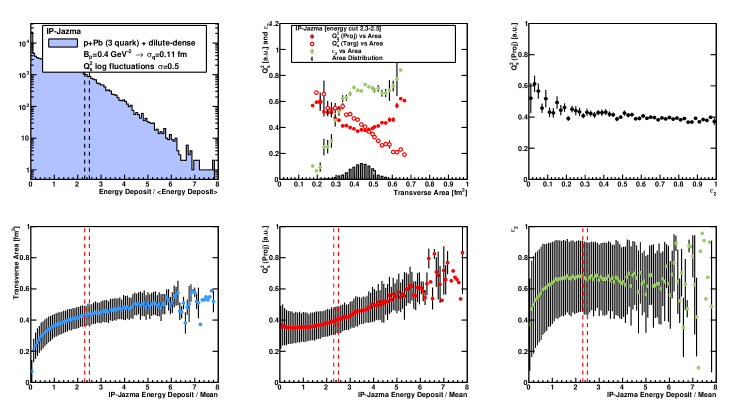
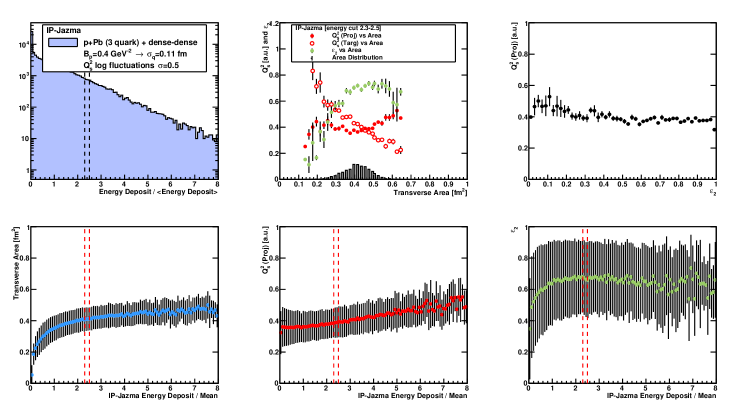
Here we briefly explore the relationship between area, eccentricity, and saturation scale within the ip-jazma framework Nagle and Zajc (2019). The ip-jazma calculation includes the IP-Sat features of treating each nucleon, or in this case each constituent quark, as a two-dimensional Gaussian distribution for the saturation scale . The saturation scale is allowed to fluctuate via a Gaussian parameter on a log-normal distribution – thus the fluctuations are quite large and have a high-side tail. These features mimic the ip-glasma calculations and then the energy deposit is calculated on a grid in each cell as the product of the summed in the projectile and the summed in the target. This calculation mimics the dense-dense limit of saturation calculations and reproduces the ip-glasma geometry with good accuracy Snyder et al. (2021). We can also use ip-jazma to mimic the dilute-dense limit where the target contribution is treated logarithmically – see Ref. Nagle and Zajc (2019) for details.
We simulate Pb collisions at 5 TeV and categorize each event via the overlap area, the eccentricity, and the saturation scale of the projectile over the overlap region. For the overlap region, to avoid over-counting the area in cases where there may be so-called “islands” of energy deposit (i.e. where different regions are disconnected) we simply count cells above a minimum energy rather than use the pocket equation . Similarly for the saturation scale of the projectile, we simply average the value over the cells included in the area calculation. The absolute values will thus have a sensitivity to this minimum energy, but for the correlations the relative values should be mostly insensitive.
Figure 16 shows the dilute-dense case for Pb collisions. The upper left panel shows the energy deposit distribution normalized to the mean for minimum bias collisions. The lower panels from left to right show the overlap area in the transverse plane, the average projectile, and separately target, over the overlap area, and the eccentricity as a function of the energy deposit normalized to the mean. The points are the mean values while the vertical lines represent the rms of the distribution about the mean. We then select a fixed energy deposit bin, as shown by the vertical dashed lines. The upper middle panel shows the variation in and with transverse area for this fixed energy selection. Lastly, in the upper right, again in this fixed energy bin, the correlation of the projectile and is shown. The same results but in the dense-dense case are shown in Figure 17.
One simple remark is that the projectile saturation scale does not increase with decreasing area as conjectured in Ref. Schenke (2021), and rather has a more complicated dependence. The very large fluctuations in added by hand for each constituent quark play a key role here. At fixed energy deposit, to have a small area, it is most likely that one quark has fluctuated to a very large , which would then explain the anti-correlation of projectile and area, for cases where the area is less than 0.4 fm2. It also then explains the very large drop off in eccentricity, since the single quark distribution is circularly symmetric. The behaviour for area greater than 0.4 fm2 has an increasing projectile, and since it is at fixed energy deposit, can only be explained by having a decrease in the target in the region of overlap – also shown in the upper middle panel of Figure 16. It may seem surprising that the in the proton projectile and Pb target are so similar, but this is a consequence of higher multiplicity events arising from large fluctuations in the projectile – see Ref. Nagle and Zajc (2019) for example. Arguments about the expectations ignoring the very large spatial and fluctuations in the target need to be revisited.
In both the dilute-dense and dense-dense cases, the relationship between projectile and eccentricity is a modest anti-correlation, almost uncorrelated in the dense-dense case. Thus, from this simple viewpoint, one might expect a negative correlator. In contrast, the ip-glasma yields a positive Giacalone et al. (2020a). Thus, further work is warranted to understand the source of this positive correlation.
References
- Bożek (2016) Piotr Bożek, “Transverse-momentum–flow correlations in relativistic heavy-ion collisions,” Phys. Rev. C 93, 044908 (2016).
- Giacalone et al. (2020a) Giuliano Giacalone, Björn Schenke, and Chun Shen, “Observable signatures of initial state momentum anisotropies in nuclear collisions,” Phys. Rev. Lett. 125, 192301 (2020a), arXiv:2006.15721 [nucl-th] .
- Busza et al. (2018) Wit Busza, Krishna Rajagopal, and Wilke van der Schee, “Heavy Ion Collisions: The Big Picture, and the Big Questions,” Ann. Rev. Nucl. Part. Sci. 68, 339–376 (2018), arXiv:1802.04801 [hep-ph] .
- Romatschke and Romatschke (2019) Paul Romatschke and Ulrike Romatschke, Relativistic Fluid Dynamics In and Out of Equilibrium, Cambridge Monographs on Mathematical Physics (Cambridge University Press, 2019) arXiv:1712.05815 [nucl-th] .
- Heinz and Snellings (2013) Ulrich Heinz and Raimond Snellings, “Collective flow and viscosity in relativistic heavy-ion collisions,” Ann. Rev. Nucl. Part. Sci. 63, 123–151 (2013), arXiv:1301.2826 [nucl-th] .
- Aad et al. (2019) Georges Aad et al. (ATLAS), “Measurement of flow harmonics correlations with mean transverse momentum in lead-lead and proton-lead collisions at TeV with the ATLAS detector,” Eur. Phys. J. C 79, 985 (2019), arXiv:1907.05176 [nucl-ex] .
- Bozek (2016) Piotr Bozek, “Transverse-momentum–flow correlations in relativistic heavy-ion collisions,” Phys. Rev. C 93, 044908 (2016), arXiv:1601.04513 [nucl-th] .
- Giacalone et al. (2020b) Giuliano Giacalone, Fernando G. Gardim, Jacquelyn Noronha-Hostler, and Jean-Yves Ollitrault, “Correlation between mean transverse momentum and anisotropic flow in heavy-ion collisions,” (2020b), arXiv:2004.01765 [nucl-th] .
- Schenke et al. (2020) Björn Schenke, Chun Shen, and Derek Teaney, “Transverse momentum fluctuations and their correlation with elliptic flow in nuclear collision,” Phys. Rev. C 102, 034905 (2020), arXiv:2004.00690 [nucl-th] .
- Bozek and Mehrabpour (2020) Piotr Bozek and Hadi Mehrabpour, “Correlation coefficient between harmonic flow and transverse momentum in heavy-ion collisions,” Phys. Rev. C 101, 064902 (2020), arXiv:2002.08832 [nucl-th] .
- Nagle and Zajc (2018) James L. Nagle and William A. Zajc, “Small System Collectivity in Relativistic Hadronic and Nuclear Collisions,” Ann. Rev. Nucl. Part. Sci. 68, 211–235 (2018), arXiv:1801.03477 [nucl-ex] .
- Dusling et al. (2016) Kevin Dusling, Wei Li, and Björn Schenke, “Novel collective phenomena in high-energy proton–proton and proton–nucleus collisions,” Int. J. Mod. Phys. E 25, 1630002 (2016), arXiv:1509.07939 [nucl-ex] .
- Aidala et al. (2019) C. Aidala et al. (PHENIX), “Creation of quark–-gluon plasma droplets with three distinct geometries,” Nature Phys. 15, 214–220 (2019), arXiv:1805.02973 [nucl-ex] .
- Mace et al. (2018) Mark Mace, Vladimir V. Skokov, Prithwish Tribedy, and Raju Venugopalan, “Hierarchy of Azimuthal Anisotropy Harmonics in Collisions of Small Systems from the Color Glass Condensate,” Phys. Rev. Lett. 121, 052301 (2018), [Erratum: Phys.Rev.Lett. 123, 039901 (2019)], arXiv:1805.09342 [hep-ph] .
- Mace et al. (2019) Mark Mace, Vladimir V. Skokov, Prithwish Tribedy, and Raju Venugopalan, “Systematics of azimuthal anisotropy harmonics in proton–nucleus collisions at the LHC from the Color Glass Condensate,” Phys. Lett. B 788, 161–165 (2019), [Erratum: Phys.Lett.B 799, 135006 (2019)], arXiv:1807.00825 [hep-ph] .
- Nagle and Zajc (2019) J.L. Nagle and W.A. Zajc, “Assessing saturation physics explanations of collectivity in small collision systems with the IP-Jazma model,” Phys. Rev. C 99, 054908 (2019), arXiv:1808.01276 [nucl-th] .
- Schenke et al. (2019) Bjrn Schenke, Chun Shen, and Prithwish Tribedy, “Hybrid Color Glass Condensate and hydrodynamic description of the Relativistic Heavy Ion Collider small system scan,” (2019), arXiv:1908.06212 [nucl-th] .
- Schenke (2021) Björn Schenke, “The smallest fluid on earth,” (2021), arXiv:2102.11189 [nucl-th] .
- Lappi et al. (2016) T. Lappi, B. Schenke, S. Schlichting, and R. Venugopalan, “Tracing the origin of azimuthal gluon correlations in the color glass condensate,” Journal of High Energy Physics 2016 (2016), 10.1007/jhep01(2016)061.
- Sjostrand et al. (2008) Torbjorn Sjostrand, Stephen Mrenna, and Peter Z. Skands, “A Brief Introduction to PYTHIA 8.1,” Comput. Phys. Commun. 178, 852–867 (2008), arXiv:0710.3820 [hep-ph] .
- Bierlich et al. (2018) Christian Bierlich, Gösta Gustafson, Leif Lönnblad, and Harsh Shah, “The angantyr model for heavy-ion collisions in pythia8,” Journal of High Energy Physics 2018 (2018), 10.1007/jhep10(2018)134.
- saga og Heioreks (1618-1682) Hervarar saga og Heioreks, Hervarar Saga Pa Gammal Gotska Med Olai Vereli Vttolkning Och Notis (1618-1682).
- Bierlich et al. (2016) Christian Bierlich, Gösta Gustafson, and Leif Lönnblad, “A shoving model for collectivity in hadronic collisions,” (2016), arXiv:1612.05132 [hep-ph] .
- Lin et al. (2005) Zi-Wei Lin, Che Ming Ko, Bao-An Li, Bin Zhang, and Subrata Pal, “Multiphase transport model for relativistic heavy ion collisions,” Physical Review C 72 (2005), 10.1103/physrevc.72.064901.
- Gyulassy and Wang (1994) Miklos Gyulassy and Xin-Nian Wang, “Hijing 1.0: A monte carlo program for parton and particle production in high energy hadronic and nuclear collisions,” Computer Physics Communications 83, 307–331 (1994).
- Zhang et al. (2021) Chunjian Zhang, Arabinda Behera, Somadutta Bhatta, and Jiangyong Jia, “Non-flow effects in correlation between harmonic flow and transverse momentum in nuclear collisions,” (2021), arXiv:2102.05200 [nucl-th] .
- Jia et al. (2017) Jiangyong Jia, Mingliang Zhou, and Adam Trzupek, “Revealing long-range multiparticle collectivity in small collision systems via subevent cumulants,” Phys. Rev. C 96, 034906 (2017), arXiv:1701.03830 [nucl-th] .
- Abelev et al. (2014) Betty Bezverkhny Abelev et al. (ALICE), “Event-by-event mean fluctuations in pp and Pb-Pb collisions at the LHC,” Eur. Phys. J. C 74, 3077 (2014), arXiv:1407.5530 [nucl-ex] .
- Zhang et al. (2019) Chao Zhang, Liang Zheng, Feng Liu, Shusu Shi, and Zi-Wei Lin, “Update of a multiphase transport model with modern parton distribution functions and nuclear shadowing,” Phys. Rev. C 99, 064906 (2019), arXiv:1903.03292 [nucl-th] .
- He et al. (2016) Liang He, Terrence Edmonds, Zi-Wei Lin, Feng Liu, Denes Molnar, and Fuqiang Wang, “Anisotropic parton escape is the dominant source of azimuthal anisotropy in transport models,” Physics Letters B 753, 506–510 (2016).
- Orjuela Koop et al. (2015) J. D. Orjuela Koop, A. Adare, D. McGlinchey, and J. L. Nagle, “Azimuthal anisotropy relative to the participant plane from a multiphase transport model in central Au, Au, and 3HeAu collisions at GeV,” Phys. Rev. C92, 054903 (2015), arXiv:1501.06880 [nucl-ex] .
- Bzdak and Ma (2014) Adam Bzdak and Guo-Liang Ma, “Elliptic and triangular flow inp-pb and peripheral pb-pb collisions from parton scatterings,” Physical Review Letters 113 (2014), 10.1103/physrevlett.113.252301.
- Abelev et al. (2013) Betty Bezverkhny Abelev et al. (ALICE), “Multiplicity dependence of the average transverse momentum in pp, p-Pb, and Pb-Pb collisions at the LHC,” Phys. Lett. B 727, 371–380 (2013), arXiv:1307.1094 [nucl-ex] .
- Nagle et al. (2018) J. L. Nagle, Ron Belmont, Kurt Hill, Javier Orjuela Koop, Dennis V. Perepelitsa, Pengqi Yin, Zi-Wei Lin, and Darren McGlinchey, “Minimal conditions for collectivity in and collisions,” Phys. Rev. C 97, 024909 (2018), arXiv:1707.02307 [nucl-th] .
- Orjuela Koop et al. (2016) J. D. Orjuela Koop, R. Belmont, P. Yin, and J. L. Nagle, “Exploring the Beam Energy Dependence of Flow-Like Signatures in Small System Au Collisions,” Phys. Rev. C93, 044910 (2016), arXiv:1512.06949 [nucl-th] .
- Alver et al. (2008) B. Alver et al. (PHOBOS), “Importance of correlations and fluctuations on the initial source eccentricity in high-energy nucleus-nucleus collisions,” Phys. Rev. C 77, 014906 (2008), arXiv:0711.3724 [nucl-ex] .
- Loizides (2016) Constantin Loizides, “Glauber modeling of high-energy nuclear collisions at the subnucleon level,” Phys. Rev. C 94, 024914 (2016), arXiv:1603.07375 [nucl-ex] .
- Snyder et al. (2021) R. Snyder, M. Byres, S. H. Lim, and J. L. Nagle, “Gluonic Hot Spot Initial Conditions in Heavy-Ion Collisions,” Phys. Rev. C 103, 024906 (2021), arXiv:2008.08729 [nucl-th] .