High-resolution infrared action spectroscopy of the fundamental vibrational band of CN+
Abstract
Rotational-vibrational transitions of the fundamental vibrational modes of the 12C14N+ and 12C15N+ cations have been observed for the first time using a cryogenic ion trap apparatus with an action spectroscopy scheme. The lines to of 12C14N+ and to of 12C15N+ have been measured, limited by the trap temperature of approximately 4 K and the restricted tuning range of the infrared laser. Spectroscopic parameters are presented for both isotopologues, with band origins at 2000.7587(1) and 1970.321(1) cm-1, respectively, as well as an isotope independent fit combining the new and the literature data.
keywords:
molecular ions , high resolution , trapped ions , interstellar molecules1 Introduction
The first molecules observed in the interstellar medium (ISM) were the carbon containing diatomic species CH, \ceCH+, and CN, all identified through their electronic spectra [1, 2]. The cyano radical (CN) has been the subject of many laboratory and astronomical investigations, having been found in a variety of astronomical environments including diffuse and dense molecular clouds [3, 4], circumstellar envelopes [5], and external galaxies [6]. For decades, it has been a valuable probe of the conditions in these environments and has been used to accurately determine the temperature of the cosmic microwave background [7, 8, 3]. Its cation form, \ceCN+, is thought to play an important role in the formation of CN in shielded regions where there is sufficient \ceN2 density [9, 4]. In regions with high \ceH2 density, on the other side, the presence of \ceCN+ is unlikely, due to its fast reaction with molecular hydrogen [10, 11, 12, 13]. A preliminary search for \ceCN+ in the ISM, which relied on predictions of the rotational transitions from ultraviolet measurements [14, 15], ultimately proved unsuccessful [16].
CN+ is isoelectronic with \ceC2, and therefore was expected to have either a or ground state. Quantum-chemical calculations have had difficulty predicting the relative energy of these low lying states, and have not been able to definitively determine which electronic state has the lowest energy [17, 18]. The first laboratory measurements of \ceCN+ were achieved through ultraviolet emission spectroscopy of \ceC2N2/He discharges [14, 15], however, at that time it was not possible to identify the electronic ground state with certainty. Recently, millimeter- and sub-millimeter wave rotational spectra of both the \ceC^14N+ and \ceC^15N+ isotopologues were observed for the first time using action spectroscopy via state-dependent attachment of He-atoms in a cryogenic ion trap [19], finally confirming a ground electronic state.
In the present investigation, we have extended the sub-mm work on \ceCN+ to the infrared. Rotational-vibrational transitions of \ceC^14N+ and \ceC^15N+ were predicted from molecular constants derived from a global isotope invariant fit of the sub-mm and UV data [see Ref. 19]. A survey of the fundamental vibrational band in the 5 m region was conducted using a similar action spectroscopic technique which employed the method of Laser Induced Inhibition of Complex Growth (LIICG)[20]. Due to its cryogenic operation principle and the small rotational partition function of CN+ at low temperatures, only seven \ceC^14N+ and three \ceC^15N+ transitions were observed, reaching . These are the first infrared measurements of \ceCN+. This investigation provides experimental benchmarks for future high-level computational investigations of \ceCN+ as well as accurate rest frequencies for future infrared studies and astronomical searches.
2 Experimental setup
The experiments were conducted in a cryogenic 22-pole ion trap apparatus (COLTRAP), which has previously been described in detail [21, 20]. As the recent rotational investigation of CN+ has been performed in the same machine with very similar experimental conditions [19], only a brief description is given here. CN+ ions are created inside a storage ion source through electron impact ionization ( eV) of methyl cyanide vapour, CH3CN. As isotopically enriched methyl cyanide is readily available commercially, C15N+ was produced from CH3C15N (Sigma Aldrich, 98 % 15N). Using an excess of helium in the source chamber ( mbar) turned out to further enhance CN+ production, as described in [19]. Ion pulses are extracted from the source and mass selected (e.g. for 12C14N+) in a subsequent quadrupole mass filter. When the selected ions enter the 22-pole trap, they are slowed down and cooled to the ambient trap temperature of 4 K by collisions with He gas (the trap is constantly filled with a number density of about cm-3). Typically, about 10,000 ions are stored inside the trap, and due to the low temperature and large helium number density, also CN+-He complexes are formed via ternary collisions. Because of destruction of these complexes in collisions with He atoms, an equilibrium
| (1) |
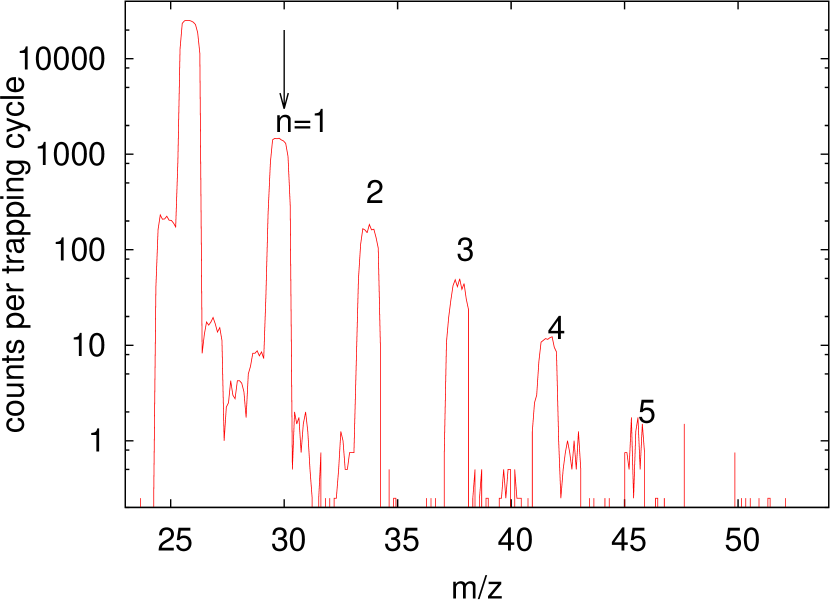
is reached inside the trap after a couple of 10 ms. A typical distribution of the CN+-(He)n complexes formed in the trap is shown in Fig. 1.
For the detection of the rovibrational transitions, the method of laser induced inhibition of complex growth (LIICG, [20, 22, 23, 24, 25, 26, 27]) was applied. This action spectroscopic method exploits the fact that vibrational excitation of the bare ion leads to a suppression of the formation of the cation-helium complex (CN+-He in this case). This action can be detected by extraction of the trap content, mass selection for CN+-He (e.g., at , see arrow in Fig. 1), and counting of these clusters using a Daly-type detector. A rovibrational line, appearing as dip in the CN+-He counts, is recorded by repeating these trap cycles at 1 Hz and counting CN+-He as a function of the laser frequency.
In the present investigation, a quantum cascade laser (QCL, Daylight Solutions) operating in the range 1961–2205 cm-1 and providing up to several 100 mW of power, has been applied. The intrinsic linewidth of the QCL is specified to be smaller than 30 MHz. A fraction of the mid-IR light was picked off and guided to a wavemeter (Bristol 621 A-IR) for frequency determination, while the rest was sent through the UHV environment of the 22-pole ion trap via a pair of CaF2 windows. After leaving the ion trap machine the radiation passed through a 20 cm long cell containing OCS gas at mbar pressure. A power sensor head (Thorlabs S302C) was placed at the end of the cell to monitor the power of the IR radiation and to record the OCS absorption lines which were used for absolute frequency calibration.
3 Rotational-vibrational transitions of \ceC^14N+ and C15N+
| \ceC^14N+ | C15N+ | ||||||
|---|---|---|---|---|---|---|---|
| exp. | exp. | ||||||
| 1989.32514(16) | 3. | 0 | – | – | |||
| 1993.17469(16) | 2. | 0 | – | – | |||
| 1996.98573(16) | 1. | 1 | – | – | |||
| 2004.49333(16) | 1. | 4 | – | – | |||
| 2008.18993(16) | 0. | 7 | 1977.52511(17) | 0. | 5 | ||
| 2011.84773(17) | 0. | 4 | 1981.07275(17) | 0. | 5 | ||
| 2015.46685(19) | 0. | 5 | 1984.58361(17) | 0. | 0 | ||
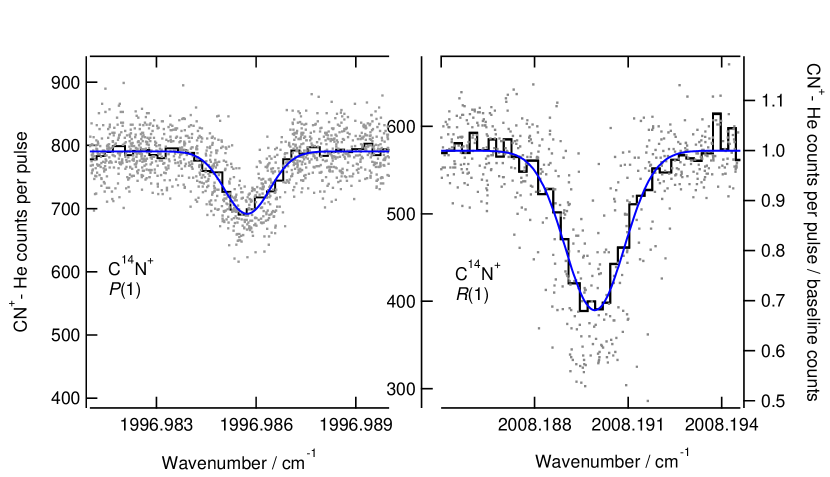
Seven rovibrational lines of the fundamental vibrational band, from to , were recorded for C14N+, and three rovibrational lines, from to , for C15N+, in total spanning the range from 1977.5 to 2015.5 cm-1. Limitations in tunability and coverage at the lower wavenumber end of the QCL prohibited measurements of additional transitions of the C15N+ species. Experimental transition wavenumbers of each CN+ line were derived from Gaussian fits to the spectral signals, as shown in Fig. 2 for the and lines. A minimum of six sweeps across each line was performed in both scanning directions. The wavenumber accuracy obtained in this fashion alone is on the order of a few cm-1 and is limited by the accuracy of the wavemeter. The accuracy was further improved by including a carbonyl sulfide, OCS, reference gas cell. The scan ranges about the \ceCN+ transitions included at least one rovibrational OCS transition for which the wavenumber is known to very high accuracy as tabulated in the HITRAN database [28]. The final CN+ line wavenumbers have been calculated as . Therefore, the uncertainty of the final wavenumbers has been estimated as the quadratic mean of i) the statistical uncertainty from the CN+ line center derived from the fit (ranging from cm-1 depending on the signal-to-noise ratio), ii) the rms of the scattered line centers derived from repeated measurements over a CN+ line ( cm-1, which reflects the actual repeatability of the wavemeter readings), iii) the statistical uncertainty of the OCS line centers derived from their fit (ranging from cm-1), iv) the rms of the scattered line centers derived from repeated measurements over a OCS calibration line ( cm-1), and, finally, v) the uncertainty for the tabulated OCS wavenumbers. For the latter, we have adopted the wavenumber values and the upper uncertainty limits quoted in the HITRAN2016 database, i.e. cm-1 [28]. For most lines the accuracy is limited by the wavemeter repeatability and by the conservative estimate of the accuracy of the calibration lines.
The transition wavenumbers and their uncertainties are shown in Table 1 for both isotopologues, while Table 2 shows the rotational constants and band origins for the levels. These were obtained by fitting the frequency values to a linear rotor energy expression using the program PGOPHER [29]. In the fit, the ground state constants () were kept fixed at the values obtained from millimeter-/sub-millimeter-wave spectroscopy published previously [19]. For C14N+, the obtained residual of the fit, MHz, is consistent with the uncertainties estimated above. For C15N+, due to the limited number of measured lines, the centrifugal distortion constant has been fixed to a scaled value.
| C14N+ | unit | ||||
|---|---|---|---|---|---|
| 2000 | .7587(1) | cm-1 | |||
| 56556 | .90031(57) | 55982 | .7(12) | MHz | |
| 0 | .199511(46) | 0 | .15(6) | MHz | |
| C15N+ | unit | ||||
| 1970 | .321(1) | cm-1 | |||
| 54826 | .28843(49) | 54272 | .5(27) | MHz | |
| 0 | .187327(32) | 0 | .14 a | MHz | |
a fixed to a scaled value
4 Isotope invariant fitting
The newly obtained data have also been reduced using a global Dunham-Watson type model [30] and a revised set of isotope invariant parameters has been obtained complementing the data set derived earlier [19]. A detailed account on the strategies employed in such kind of treatment has been given elsewhere [31, 32]. Fitting was performed using Pickett’s SPFIT/SPCAT suite of programs [33] and a truncated output from SPFIT is given as electronic supplementary material to this article. The new set of isotope independent parameters is given in Table 3, where it is compared against the parameter set of Ref. [19]. Inclusion of the new high-resolution infrared data afforded consideration of the parameter and the term which accounts for the breakdown of the Born-Oppenheimer (BO) approximation. This term is defined as , with being an isotope invariant term, the electron-to-nitrogen atomic mass ratio, the reduced mass of \ce^12C^14N+ and a BO breakdown (BOB) parameter accounting for nitrogen substitution. The IR rms of the fit is about 0.1 cm-1, which is a consequence of the limited quality of the combination differences from the electronic spectra [14] used in the fit. The rms of the new high resolution data in Table 1 alone is 1.3 cm-1.
From the parameter determined here, an experimental equilibrium bond length of Å is derived. This value agrees to much better than Å with the value derived from the initial UV experiments and to within some Å with the highest level quantum-chemical calculations reported in the literature so far [see Ref. 34, and references therein].
| Parameter | Ref. [19] | This study | ||
| /MHz | 56836. | 013(27) | 56832. | 336(77) |
| /MHz | 0. | 199421(27) | 0. | 199420(27) |
| /MHz | 558. | 227(54) | 543. | 408(284) |
| /cm-1 | 2033. | 044(55) | 2033. | 095(32)b |
| /cm-1 | 2032. | 984(31) | ||
| /cm-1 | 0. | 1115(95) | ||
| /cm-1 | 16. | 194(22) | 16. | 168(20) |
| /MHz | 3. | 733(68) | ||
| N)/MHz | +4. | 9660(32) | +4. | 9660(33) |
| N)/MHz | 4. | 11(65) | 4. | 13(65) |
| (mmw)/MHz | 0. | 007 | 0. | 007 |
| (IR)/cm-1 | 0. | 114 | 0. | 104 |
| Weighted | 1. | 06 | 1. | 00 |
a , see [Ref. 30].
b Derived value.
5 Astrochemical considerations and future perspectives
Now that the high resolution pure rotational and rotational-vibrational spectra of CN+ have been studied, a closer look at the reaction kinetics may be indicated. Of particular importance in an astrophysical scenario is the reaction of CN+ with molecular hydrogen. Hydrogenation proceeds in two steps finally leading to the terminal product HCNH+,
| (2) | |||||
| (3) |
with a similar reaction chain involving HNC+ as the intermediate (HCN+ and HNC+ are formed in equal amounts in reaction (2) [12]). In the past, these reactions have been investigated at room temperature using SIFT (selected ion flow tube) and ICR (ion-cyclotron resonance) techniques [10, 11, 12, 13], and rate coefficients close to the Langevin collision rate were determined ( cm3s-1 for both reaction steps). Consequently, this behaviour will make detection of CN+ in denser regions of space challenging. To the best of our knowledge, there are no measurements of these reactions at the cryogenic temperatures prevailing in the ISM. For such exothermic and direct hydrogen abstraction reactions, no temperature dependence is expected. Nonetheless, we caught a preliminary glimpse of this reaction chain at a nominal trap temperature of 15 K.
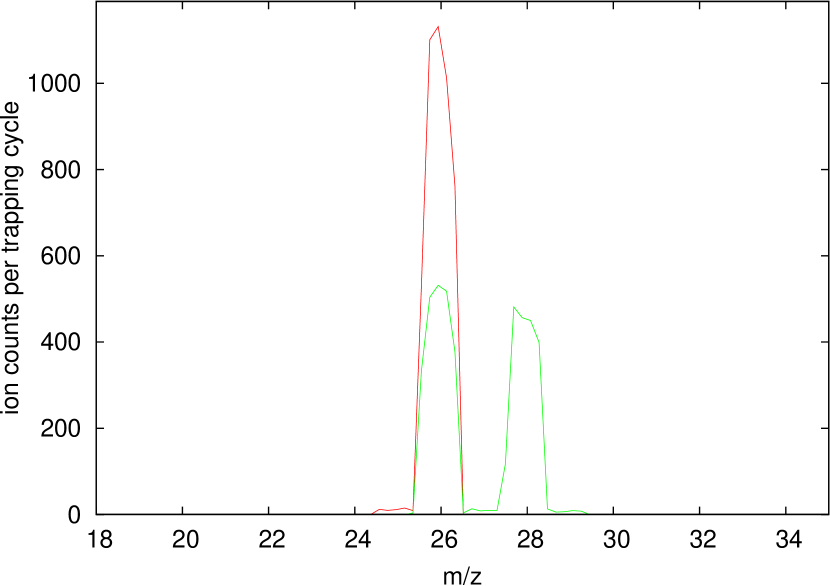
Fig. 3 shows an example measurement with and without the admission of a low concentration of H2 to the trap. While we could confirm that at low temperature the reaction chain is indeed proceeding close to the collision rates given above (we refrain from giving exact values for and because a precise pressure calibration is not implemented in the trapping machine yet), it also became evident that about half of the mass-selected ion ensemble admitted to the trap is reacting only very slowly with H2. This finding points to the fact that the ions admitted to the trap do not comprise CN+ exclusively but are most likely heavily contaminated with another isobaric species (such a conclusion is not possible based on the LIICG spectra shown in Fig. 2). Based on the ion mass and the \ceCH3CN precursor, we suspect the acetylene cation, HCCH+, to be the ion in question (or the H2C radical cation quickly isomerizing to HCCH+). The acetylene cation is known to react very slowly with H2 at the low temperatures prevailing in our ion trap [35, 36]. Although CH3CN can be handled very safely and turned out to be an ideal precursor for the spectroscopic experiments presented in this work, in future kinetic and spectroscopic experiments, it might be advantageous to use HCN (heavily diluted in He) as precursor gas in the ion source to produce cleaner samples of CN+ and HCN+/HNC+ [37]. In particular, we plan accurate low-temperature measurements of and with the approach outlined in Refs. [38, 39]. Also, HCN+/HNC+ will be a prime spectroscopic target in coming investigations, as no high-resolution data whatsoever exist to date.
Acknowledgments
This work (including the research visit of JLD in Köln) has been supported by the Deutsche Forschungsgemeinschaft (DFG) via SFB 956 project B2 (project ID 18401886) and DFG SCHL 341/15-1 (“Cologne Center for Terahertz Spectroscopy”). JLD acknowledges partial support from the Spanish AEI through grant FIS2016-77726-C3-1-P and from the European Research Council through grant agreement ERC-2013-SyG-610256-NANOCOSMOS. JLD expresses his immense gratitude to F. J. Lovas, and to current and past members of the former “Molecular Physics Division” at NBS, then “Molecular Physics Division” at NIST, now “Optical Technology Division” at NIST, for their continuous inspiration, mentor-ship and friendship.
Appendix A. Supplementary material
Supplementary data associated with this article can be found, in the online version, at XXX.
References
- [1] A. McKellar, Evidence for the molecular origin of some hitherto unidentified interstellar lines, Publ. Astron. Soc. Pac. 52 (1940) 187–192.
- [2] W. S. Adams, Some Results with the COUDÉ Spectrograph of the Mount Wilson Observatory, Astrophys. J. 93 (1941) 11–23.
- [3] H. Liszt, R. Lucas, Comparative chemistry of diffuse clouds II. CN, HCN, HNC, CH3CN & N2H+, Astron. Astrophys. 370 (2) (2001) 576–585.
- [4] G. I. Boger, A. Sternberg, CN and HCN in Dense Interstellar Clouds, Astrophys. J. 632 (1) (2005) 302–315.
- [5] A. Wootten, S. M. Lichten, R. Sahai, P. G. Wannier, CN Abundance Variations in the Shell of IRC+10216, Astrophys. J. 257 (1982) 151–160.
- [6] C. Henkel, R. Mauersberger, P. Schilke, Molecules in External Galaxies: the detection of CN, C2H, and HNC, and the tentative detection of HC3N, Astron. Astrohpys. 201 (1988) L23–L26.
- [7] G. B. Field, J. L. Hitchcock, Cosmic Black-Body Radiation at 2.6 mm, Phys. Rev. Lett. 16 (18) (1966) 817.
- [8] D. M. Meyer, M. Jura, A precise measurement of the cosmic microwave background temperature from optical observations of interstellar CN, Astrophys. J. 297 (0) (1985) 119.
- [9] E. F. van Dishoeck, J. H. Black, Comprehensive models of diffuse interstellar clouds - Physical conditions and molecular abundances, The Astrophysical Journal Supplement Series 62 (1986) 109.
- [10] A. B. Raksit, H. I. Schiff, D. Bohme, A Selected Ion Flow Tube Study of the Kinetics of CN+ Reactions at 296 2 K, Int. J. Mass. Spectrom. Ion Proc. 56 (1984) 321–335.
- [11] J. Huntress, W. T., Laboratory studies of bimolecular reactions of positive ions in interstellar clouds, in comets and in planetary atmospheres of reducing composition., Astrophys. J. Suppl. Ser. 33 (1977) 495–514.
- [12] S. Petrie, C. G. Freeman, M. J. McEwan, E. E. Ferguson, The ion chemistry of HNC(+)/HCN(+) isomers - Astrochemical implications, MNRAS 248 (1991) 272–275.
- [13] G. B. Scott, D. A. Fairley, C. G. Freeman, M. J. McEwan, P. Spanel, D. Smith, Gas phase reactions of some positive ions with atomic and molecular hydrogen at 300 K, J. Chem. Phys. 106 (10) (1997) 3982–3987.
- [14] A. Douglas, P. M. Routly, The Spectrum of the CN+ Molecule., Astrophys. J. 119 (2) (1954) 303–311.
- [15] B. Lutz, The Emission Spectrum of CN+, Astrophys. J. 163 (1971) 131–140.
- [16] J. M. Hollis, B. L. Ulich, L. E. Snyder, D. Buhl, F. J. Lovas, A radio search for interstellar co+, hcn+, hnc+, and cn+ ions, Astrophys. J. 219 (1978) 74–76.
- [17] P. J. Bruna, S. D. Peyerimhoff, R. J. Buenker, The Ground State of the CN+ Ion: A Multireference CI Study, Chem. Phys. Lett. 72 (2) (1980) 278—-284.
- [18] K. A. Peterson, Accurate multireference configuration interaction calculations on the lowest and electronic states of C2, CN+, BN, and BO+, J. Chem. Phys. 102 (1) (1995) 262–277.
- [19] S. Thorwirth, P. Schreier, T. Salomon, S. Schlemmer, O. Asvany, Pure rotational spectrum of CN+, Astrophys. J. 882 (1) (2019) L6.
- [20] O. Asvany, S. Brünken, L. Kluge, S. Schlemmer, COLTRAP: a 22-pole ion trapping machine for spectroscopy at 4 K, Appl. Phys. B 114 (1-2) (2014) 203–211.
- [21] O. Asvany, F. Bielau, D. Moratschke, J. Krause, S. Schlemmer, New design of a cryogenic linear RF multipole trap, Rev. Sci. Instr. 81 (2010) 076102.
- [22] O. Asvany, K. M. T. Yamada, S. Brünken, A. Potapov, S. Schlemmer, Experimental ground-state combination differences of CH, Science 347 (6228) (2015) 1346–1349.
- [23] I. Savić, D. Gerlich, O. Asvany, P. Jusko, S. Schlemmer, Controlled synthesis and analysis of He–H in a 3.7 K ion trap, Mol. Phys. 113 (15-16) (2015) 2320–2332. doi:10.1080/00268976.2015.1037802.
- [24] P. Jusko, A. Stoffels, S. Thorwirth, S. Brünken, S. Schlemmer, O. Asvany, High-resolution vibrational and rotational spectroscopy of CD2H+ in a cryogenic ion trap, J. Mol. Spectrosc. 332 (2017) 59 – 66.
- [25] H. Kohguchi, P. Jusko, K. M. T. Yamada, S. Schlemmer, O. Asvany, High-resolution infrared spectroscopy of O2H+ in a cryogenic ion trap, J. Chem. Phys. 148 (14) (2018) 144303.
- [26] J. L. Doménech, P. Jusko, S. Schlemmer, O. Asvany, The first laboratory detection of vibration-rotation transitions of 12CH+ and 13CH+ and improved measurement of their rotational transition frequencies, Astrophys. J. 857 (1) (2018) 61.
- [27] C. Markus, S. Thorwirth, O. Asvany, S. Schlemmer, High-resolution double resonance action spectroscopy in ion traps: vibrational and rotational fingerprints of CH2NH, Phys. Chem. Chem. Phys. 21 (2019) 26406–26412.
- [28] I. E. Gordon, L. S. Rothman, C. Hill, R. V. Kochanov, Y. Tan, P. F. Bernath, M. Birk, V. Boudon, A. Campargue, K. V. Chance, B. J. Drouin, J. M. Flaud, R. R. Gamache, J. T. Hodges, D. Jacquemart, V. I. Perevalov, A. Perrin, K. P. Shine, M. A. H. Smith, J. Tennyson, G. C. Toon, H. Tran, V. G. Tyuterev, A. Barbe, A. G. Császár, V. M. Devi, T. Furtenbacher, J. J. Harrison, J. M. Hartmann, A. Jolly, T. J. Johnson, T. Karman, I. Kleiner, A. A. Kyuberis, J. Loos, O. M. Lyulin, S. T. Massie, S. N. Mikhailenko, N. Moazzen-Ahmadi, H. S. P. Müller, O. V. Naumenko, A. V. Nikitin, O. L. Polyansky, M. Rey, M. Rotger, S. W. Sharpe, K. Sung, E. Starikova, S. A. Tashkun, J. Vander Auwera, G. Wagner, J. Wilzewski, P. Wcisło, S. Yu, E. J. Zak, The HITRAN2016 molecular spectroscopic database , J. Quant. Spectrosc. Radiat. Transf. 203 (2017) 3–69.
- [29] C. M. Western, Pgopher: A program for simulating rotational, vibrational and electronic spectra, J. Quant. Spectros. Rad. Transfer 186 (2017) 221 – 242.
- [30] J. K. G. Watson, The isotope dependence of diatomic Dunham coefficients, J. Mol. Spectrosc. 80 (1980) 411–421.
- [31] L. Bizzocchi, C. D. Esposti, L. Dore, J. Gauss, C. Puzzarini, The Born–Oppenheimer equilibrium bond distance of GeO from millimetre- and submillimetre-wave spectra and quantum-chemical calculations, Mol. Phys. 113 (2014) 801–807.
- [32] H. S. P. Müller, S. Spezzano, L. Bizzocchi, C. A. Gottlieb, C. Degli Esposti, M. C. McCarthy, Rotational Spectroscopy of Isotopologues of Silicon Monoxide, SiO, and Spectroscopic Parameters from a Combined Fit of Rotational and Rovibrational Data, J. Phys. Chem. A 117 (2013) 13843–13854.
- [33] H. M. Pickett, The fitting and prediction of vibration-rotation spectra with spin interactions, J. Mol. Spectrosc. 148 (1991) 371–377.
- [34] R. Polák, J. Fišer, Multireference CI calculation of nuclear quadrupole coupling constants of CN+ and CN-: rovibrational dependence, Spectrochim. Acta 58 (9) (2002) 2029–2041.
- [35] D. Gerlich, Experimental Investigation of Ion-Molecule Reactions Relevant to Interstellar Chemistry, J. Chem. Soc. Faraday Trans. 89 (1993) 2199–2208.
- [36] A. Sorgenfrei, Ion-Molekül-Reaktionen kleiner Kohlenwasserstoffe in einem gekühlten Ionen-Speicher, Ph.D. thesis, University of Freiburg, Germany (1994).
- [37] S. Petrie, C. G. Freeman, M. Meot-Ner, M. J. McEwan, E. E. Ferguson, Experimental study of HCN+ and HNC+ ion chemistry, J. Am. Chem. Soc. 112 (20) (1990) 7121–7126.
- [38] O. Asvany, S. Schlemmer, D. Gerlich, Deuteration of CH (n=3-5) in collisions with HD measured in a low temperature ion trap, Astrophys. J. 617 (2004) 658–692.
- [39] O. Asvany, I. Savić, S. Schlemmer, D. Gerlich, Variable temperature ion trap studies of CH + H2, HD and D2: negative temperature dependence and significant isotope effect, Chem. Phys. 298 (2004) 97–105.