Rovibrational spectroscopy of the CH+-He and CH+-He4 complexes
Abstract
A cryogenic 22-pole ion trap apparatus is used in combination with a table-top pulsed IR source to probe weakly bound CH+-He and CH+-He4 complexes by predissociation spectroscopy at 4 K. The infrared photodissociation spectra of the C–H stretching vibrations are recorded in the range of 2720–2800 cm-1. The spectrum of CH+-He exhibits perpendicular transitions of a near prolate top with a band origin at 2745.9 cm-1, and thus confirms it to have a T-shaped structure. For CH+-He4, the C-H stretch along the symmetry axis of this oblate top results in parallel transitions.
keywords:
ion trap , rovibrational spectroscopy , CH+-He1 Introduction
Molecular complexes consisting of a cation and a weakly bound neutral partner have been investigated by action spectroscopy in the last four decades. These techniques were primarily invented and used to obtain spectroscopic information about the bare cation itself [1, 2, 3, 4, 5], but more recently the focus shifted also towards the weak interaction between the constituents and the corresponding shallow potential energy surface (PES), in particular for floppy cation-helium complexes. For instance, IR spectra, and, more recently, also partly rotational spectra of N2HHe [6], HCOHe [7, 8], OHHe [9], CHHe [10, 11], NHe [12], NHHe [13], O2HHe [14, 15], HHe [16] and HHen [17, 18] have been explored.
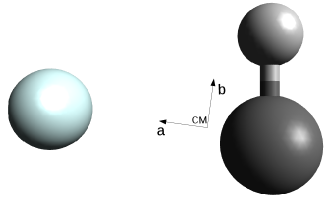
CH+ was the very first molecular ion known to exist in interstellar space, detected by its electronic transitions [19, 20], and since then it has also been detected by its rotational [21, 22, 23, 24], and vibrational [25] transitions (the latter only very recently). In the astronomically important collision between CH+ and He the weakly bound CH+-He complex is formed as an intermediate. Up to date, the CH+-He complex has been investigated only theoretically, first by Hughes and Nagy-Felsobuki [26], and later by Meuwly and Wright [27]. These authors predict a T-shape structure rather than a linear one, see Fig. 1. Detailed knowledge of the CH+ - He PES is important to be able to predict inelastic collision rates in space [28, 29]. Determination of its bound states by rotational or rovibrational spectroscopy, together with theoretical work, is a very exact way of exploring the underlying PES.
In a previous work aimed at high-resolution detection of the C-H stretching fundamental of the bare CH+ cation [30], we serendipitously found seven Lorentzian lines which we ascribed to CH+-He. In this work, we complete the search for the lines of the complex using the same ion trap machine, and apply a lower-resolution pulsed laser to record the infrared photodissociation (IRPD) spectrum of CH+-He. In addition, we also measure the IRPD spectrum of the symmetric complex CH+-He4.
2 Experimental details
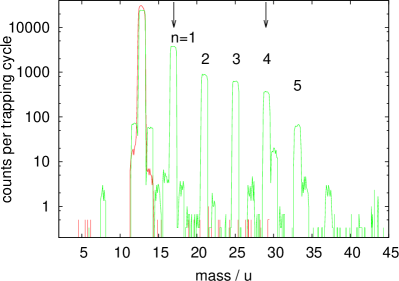
The IRPD experiments of CH+-He and CH+-He4 are carried out in the ion trapping machine COLTRAP [31]. A 1:1 mixture of helium and methane (Linde 5.5) is used as a precursor to create CH+ ions by electron impact ionization in an external storage ion source (electron energy about 30 eV). Helium is used in the precursor mixture because ionized helium is known to promote the fragment ion production [32]. Subsequent mass-filtering ( u) in a linear quadrupole ensures that a pure sample of several ten thousand CH+ ions enters the 4 K 22-pole ion trap [33]. About 40 ms before the ion bunch reaches the trap, He buffer gas is injected into the trap via a piezo valve and is thus thermalized by collisions with the trap walls. This leads to the cooling of the incoming ions by collisions with the buffer gas. The formation of CH+-He and higher complexes CH+-Hen via ternary collision processes is promoted by the low trap temperature and the high instantaneous He number density. In the mass spectrum of Fig. 2 one can see that the complexes with are readily formed, whereas complexes with or even have less abundance, in agreement with a shell closure at a four-membered He-ring around the CH+ molecular axis, as suggested earlier [34].
For IRPD spectroscopy, the shown ion ensemble is trapped for a period of 2.5 s and irradiated by the pulsed infrared radiation, leading to excitation upon resonance and subsequent destruction of the complexes (CH+-He has a dissociation energy of cm-1 [27]). After extracting all ions from the trap, the ions are mass-filtered in the CH+-He or CH+-He4 mass channels ( or 29 u, see arrows in Fig. 2) by a second linear quadrupole and efficiently counted by a Daly-type detector. The predissociation spectrum is recorded by counting the number of these complexes (typical counts are on the order of 5000) as a function of the IR excitation frequency. In that way, the resonant absorption of IR photons is observed as a dip in the counts, see lower part of Fig. 3. As long-term fluctuations of the complex counts were not severe, we omitted to use a laser shutter for normalization purposes.
The pulsed IR radiation is produced by a table-top LaserVision optical parametric oscillator/amplifier (OPO/OPA) system. The OPO/OPA system is pumped with a 1064 nm Nd:YAG laser (Continuum Surelite-Ex) operating at 10 Hz and with maximum pulse energies of 600 mJ. This system has a bandwidth of 0.1 cm-1 when seeded. The IR laser wavelength is monitored with a wavemeter (HighFinesse WS-5) with a manufacturer-stated accuracy of 0.1 cm-1. The IR beam passes through the trapping machine via two Brewster window assemblies [35] adjusted for vertical polarization and containing BaF2 windows. Typical pulse energies are on the order of 3 mJ (in seeded mode).
3 Rovibrational spectroscopy of CH+-He
During our former work [30] we serendipitously recorded seven CH+-He lines and even a single 13CH+-He line. The latter, at 2758.548404(5) cm-1, is depicted in Fig. 1 of reference [30]. The seven unpublished and initially unassigned lines of CH+-He are listed in Table 1. The use of a high-resolution narrow-band cw IR source allowed to determine their positions and Voigt line profiles with high accuracy and precision (the accuracy of the used wavemeter was 30 MHz, the precision even better). Thus the lifetimes of the vibrationally excited states, in the order of 1-2 ns, could be determined (see Table 1). Two lines were recorded at even higher precision and accuracy (about 80 kHz) using a frequency comb system [36].
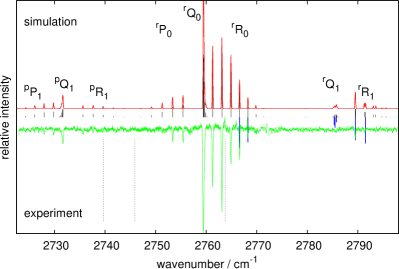
Similar to CH+ (), the complex CH+-He is a closed-shell molecule with a singlet electronic ground state. Ab initio calculations [26, 27] predicted its equilibrium structure to be non-linear. It has rather a T-shaped equilibrium structure with the helium atom in a distance of Å and angle of relative to the C-H center of mass and axis, respectively (see Fig. 1). Its symmetry group is thus Cs and its ground electronic state is designated . Its calculated rotational constants [27] reveal that it is a near prolate top. As the C-H stretch investigated here points almost perpendicular to the symmetry axis of the prolate top (the symmetry axis is the a-axis, the C-H transition moment points almost along the b-axis), a perpendicular transition of a near prolate top can be expected.
The spectrum obtained in this work indeed resembles that of a perpendicular transition of a near prolate top. It is shown in the lower part of Fig. 3, together with the seven high-resolution lines obtained in our earlier work, depicted as blue sticks. As at least two lines of the high-resolution data set could be detected and well separated in this work, they have been used to re-calibrate the spectrum of this work (it has been shifted up by 0.13 cm-1, which is well within the accuracy of the used wavemeter). The experimental spectra are accompanied by PGOPHER [37] simulations in the upper part of Fig. 3, one with narrow sticks and one convoluted with a Gaussian laser bandwidth of 0.1 cm-1 representative of the current experimental conditions. The fit of the simulation to the spectroscopic data yields a rotational temperature of about 10 K and spectroscopic constants as summarized in Table 2. Fortunately, we were able to resolve one asymmetry splitting in the branch (though with low signal-to-noise ratio), which in turn enabled us to assign the formerly measured high-resolution lines with confidence, so that the parameter could be determined. All assigned lines are collected in Table 1. The weighted RMS of the fit is 0.29, which shows that our error limits given for the lines of this work are very conservative.
For the determination of the structure of CH+-He we assume the C-H backbone to be unchanged w.r.t. CH+. From the ground state rotational constant cm-1 [38, 30] of CH+ we obtain a C-H bond length of Å. As the principal a-axis of CH+-He passes trough the He atom and the center of mass of CH (see Fig. 1), the corresponding rotational constant cm-1 is determined by the tilt of the CH-unit towards this axis, i.e. by the Jacobi angle, for which we calculate for the ground vibrational state. Using also the rotational constant cm-1 (see Table 2) we further estimate Å (the distance between He and the center of mass of the CH subunit), in good agreement with the average value Å given by Meuwly and Wright [27] for the ground vibrational state. In a similar way, using Å for the vibrationally excited state probed in this work, we obtain an angle and a distance which is only slightly larger, Å.
| / cm-1 | Obs.-Calc. | / ns a | ||||
|---|---|---|---|---|---|---|
| 2726.14(5) | 0 | .015 | ||||
| 2727.97(5) | -0 | .003 | ||||
| 2729.86(5) | 0 | .002 | ||||
| 2731.7 | ||||||
| 2735.69(5) | 0 | .012 | ||||
| 2737.67(5) | 0 | .010 | ||||
| 2739.63(5) | -0 | .031 | ||||
| 2751.32(5) | 0 | .027 | ||||
| 2753.40(5) | 0 | .015 | ||||
| 2755.46(5) | 0 | .019 | ||||
| 2759.45 | ||||||
| 2761.27(5) | -0 | .034 | ||||
| 2763.13(5) | -0 | .005 | ||||
| 2764.92(5) | 0 | .018 | ||||
| 2766.607175(8) b,c | 0 | .0 | 1 | .50(2) | ||
| 2768.254(1) b | 0 | .0 | 1 | .63(7) | ||
| 2785.315(1) b | 0 | .0 | 1 | .4(2) | ||
| 2785.468(1) b | 0 | .0 | 1 | .5(1) | ||
| 2785.791(1) b | 0 | .0 | 1 | .8(5) | ||
| 2789.534(1) b | 0 | .0 | 1 | .61(6) | ||
| 2791.51941(2) b,c | 0 | .0 | 1 | .65(3) | ||
a The lifetimes are determined by extracting the Lorentzian width in a Voigt fit, assuming the
Gaussian contribution to correspond to a temperature of 14 K
b The seven CH+-He lines with higher precision have been detected in our previous work [30].
c lines with very high precision and accuracy have been measured with a frequency comb system.
| ab initio a | this work | ||||||
| ground | ground | ||||||
| CH+-He, Cs | |||||||
| 2869 b | 2745 | .94(1) | |||||
| 15. | 28 | 15 | .15(1) | 14 | .435(2) | ||
| 0. | 93 | 0 | .9785(2) | 0 | .9708(4) | ||
| 0. | 074 | 0 | .07972(9) | 0 | .091(3) | ||
| 0 | .23(1) | 0 | .13(2) | ||||
| CH+-He4, C4v | |||||||
| 2763 | .77(5) | ||||||
| 0 | .378(1) | 0 | .375(1) | ||||
a Reference [27]
b harmonic value
4 Rovibrational spectroscopy of CH+-He4
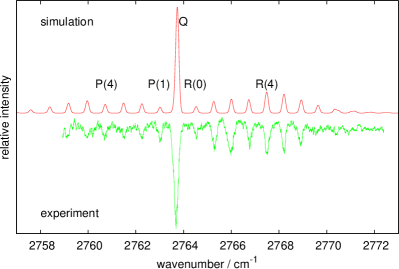
In order to get more insight into the structure of the helium complexes, we also investigated CH+-He4 by IRPD. We chose this complex instead of CH+-He2 or CH+-He3, as the latter are suspected to be floppy with a complicated spectrum (and we postpone their investigation to a later work). CH+-He4, on the other hand, is predicted to be an oblate symmetric top [39], with a 4-membered ring of helium atoms surrounding the C-H axis. It thus belongs to the symmetry group C4v. The IRPD spectrum of CH+-He4, measured by observing the mass channel u (see Fig. 2) as a function of laser wavenumber, is shown in Fig. 4. It exhibits parallel transitions () of a symmetric top molecule, thus confirming the proposed structure. At the resolution of this experiment, only the rotational constant (the one perpendicular to the symmetry axis of the top) and the band origin can be determined with confidence, and are included in Table 2. As expected, the band origin, at 2763.77(5) cm-1, is further blue shifted w.r.t. the ones of CH+ and CH+-He (see also the dashed vertical lines in Fig. 3). As anticipated by theoretical work [39], these blue shifts seem very linear, and we obtain a value of about 6 cm-1 per additional He atom. Therefore, we may predict band origins of 2751.7 cm-1 and 2757.7 cm-1 for the floppy CH+-He2 and CH+-He3, respectively.
The experimental rotational constant cm-1 is in good agreement with the proposed structure of CH+-He4. Assuming this molecule to be formed by filling up the 4-membered ring with He atoms and having all a distance of about 2.22 Å to the CH-axis as calculated for CH+-He, we obtain a rotational constant cm-1. This value even suggests that the distance of the He atoms to the CH-axis is slightly larger for CH+-He4 than for CH+-He. In summary, this is consistent with the picture that in the CH+-Hen series, every additional He atom strengthens the C-H bond, leading to the mentioned additive blue shift of the band origin of about 6 cm-1/He atom, while the CH+ - He bonds get weaker, leading to slightly larger distances of the He atoms to the CH-axis.
5 Conclusions and Outlook
Using a combination of a cryogenic ion trap machine with a tunable table-top pulsed IR source the C-H stretches of the cation-helium complexes CH+-He and CH+-He4 have been recorded in the 3 m region. To the best of our knowledge, CH+-He4 is the largest cation-helium complex () for which a rotationally resolved IR spectrum has been reported. The investigation confirms the proposed structures of CH+-He [27] and CH+-He4 [39], with the helium atoms attached to the C-H backbone in a T-shaped manner, by multiple evidence: i) the mass spectrum shows a magic number at 4 helium atoms and thus supports a 4-membered ring around the CH+ axis, ii) the relatively long lifetime of the vibrationally excited CH+-He complex of about 1.6 ns is consistent with (but does not necessarily prove) the fact that the He-bond does not point along the C-H axis, iii) the band origins of the C-H stretch vibrations of CH+-He and CH+-He4, when compared to the one of CH+ (2739.670097(5) cm-1 [30]), exhibit blue shifts which are quite small and show a regular additive behavior, and finally, iv) the full spectral analyses given in the preceding sections reveals CH+-He and CH+-He4 to have rotational constants which are in close agreement with the proposed structures. It is astonishing that such potentially floppy molecules with weak bonds of the helium atoms to the CH+ core present themselves as texbook-like rigid near-prolate and oblate symmetric tops, respectively, at least at the resolution of the current experiment. Further high-resolution experiments are necessary to reveal deviations from a perfect rigid rotor model and to explore the shallow potential energy surface via the determination of the higher order centrifugal distortion constants.
The CH+-He complex can be compared to other complexes which have a linear cation core. Typically, complexes of the type AH+-He (with AH+ being the linear cation core) exhibit a linear proton-bound structure, leading to a redshift of the A-H vibrational frequency upon complexation with He, as witnessed for the mentioned systems HCOHe [7, 8], OHHe [9], N2HHe [6], HeHHe [18], and HHe [40]. To the best of our knowledge, CH+-He is the only such complex with a T-shaped structure. CH+-He and CH+-He4 are thus somewhat more similar to the HHen series of complexes, for which the symmetric linear complex with , He-H+-He, has been determined as the central core, and with having a T-shaped structure and a 4-membered helium ring around this core. While low-resolution IR studies could confirm these motifs [17], high-resolution studies for are currently hampered by lifetime broadening [18].
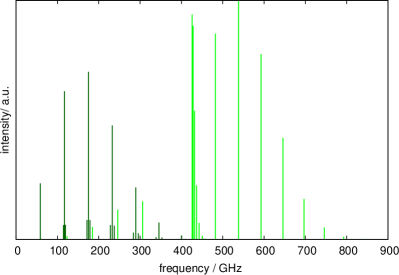
More detailed information about the structure of CH+-He can also be obtained by the investigation of its ground vibrational state. Rotational spectroscopy of CH+-He is feasible as it possess a permanent dipole moments along both the a- and b-axes (see Fig. 1). We expect the dipole moment along the a-direction to be particularly strong, as the charge sits mainly on the CH+ moiety which is separated by more than 2 Å from the He atom. A rough prediction of the a-type and b-type rotational spectra can be found in Fig. 5. High-resolution rotational spectroscopy of CH+-He can be achieved by combining the IRPD spectroscopy presented in this work with a rotational photon in a double-resonance scheme, as recently demonstrated for the complexes CH-He and HCO+-He [11, 8]. As shown in those works, the rotational spectroscopy of loosely bound complexes is not limited by lifetime and broadening issues, so that accurate quantum state information on the kHz-level can be obtained.
Acknowledgements
This work has been supported via Collaborative Research Centre 956, sub-project B2, funded by the Deutsche Forschungsgemeinschaft (DFG, project ID 184018867) as well as DFG SCHL 341/15-1 (“Cologne Center for Terahertz Spectroscopy”) and AS 319/2-2. JLD acknowledges partial financial support from the Agencia Estatal de Investigación (AEI) through grant FIS2016-77726-C3-1-P and from the European Research Council through grant agreement ERC-2013-SyG-610256-NANOCOSMOS. We thank the anonymous reviewer for a thorough check of the submitted manuscript.
References
- [1] D. W. Boo, Z. Liu, A. G. Suits, J. Tse, Y. T. Lee, Dynamics of Carbonium Ions Solvated by Molecular Hydrogen: CH(H2)n (n=1,2,3), Science 269 (1995) 57–59.
- [2] E. Bieske, O. Dopfer, High resolution spectroscopy of ionic complexes, Chem. Rev. 100 (2000) 3963–3998.
- [3] M. Brümmer, C. Kaposta, G. Santambrogio, K. R. Asmis, Formation and photodepletion of cluster ion–messenger atom complexes in a cold ion trap: Infrared spectroscopy of VO+, VO, and VO, J. Chem. Phys. 119 (24) (2003) 12700–12703.
- [4] J. Jašík, J. Žabka, J. Roithová, D. Gerlich, Infrared spectroscopy of trapped molecular dications below 4 K, Int. J. Mass Spectrom. 354 (2013) 204–210.
- [5] J. Jašík, R. Navrátil, I. Němec, J. Roithová, Infrared and Visible Photodissociation Spectra of Rhodamine Ions at 3 K in the Gas Phase, J. Phys. Chem. A 119 (51) (2015) 12648–12655.
- [6] S. A. Nizkorodov, J. P. Maier, E. J. Bieske, The infrared spectrum of the N2H+-He ion-neutral complex, J. Chem. Phys. 102 (13) (1995) 5570–5571.
- [7] S. A. Nizkorodov, J. P. Maier, E. J. Bieske, The infrared spectrum of He–HCO+, J. Chem. Phys. 103 (4) (1995) 1297–1302.
- [8] T. Salomon, M. Töpfer, P. Schreier, S. Schlemmer, H. Kohguchi, L. Surin, O. Asvany, Double resonance rotational spectroscopy of He-HCO+, Phys. Chem. Chem. Phys. 21 (2019) 3440–3445.
- [9] D. Roth, S. A. Nizkorodov, J. P. Maier, O. Dopfer, Intermolecular interaction in the OH+–He and OH+–Ne open-shell ionic complexes: Infrared predissociation spectra of the and vibrations, J. Chem. Phys. 109 (10) (1998) 3841–3849.
- [10] R. V. Olkhov, S. A. Nizkorodov, O. Dopfer, Intermolecular interaction in the CH-He ionic complex revealed by ab initio calculations and infrared photodissociation spectroscopy, J. Chem. Phys. 110 (1999) 9527–9535.
- [11] M. Töpfer, T. Salomon, S. Schlemmer, O. Dopfer, H. Kohguchi, K. M. T. Yamada, O. Asvany, Double resonance rotational spectroscopy of weakly bound ionic complexes: the case of floppy CH-He, Phys. Rev. Lett. 121 (2018) 143001.
- [12] E. Bieske, A. Soliva, A. Friedmann, J. Maier, Vibrational predissociation lifetime of N-He (X, ), J Chem. Phys. 96 (5) (1992) 4035–4036.
- [13] N. Lakin, R. Olkhov, O. Dopfer, Internal rotation in NH-Rg dimers (Rg = He, Ne, Ar): Potential energy surfaces and IR spectra of the band, Faraday Discuss. 118 (2001) 455–76; discussion 487.
- [14] S. A. Nizkorodov, D. Roth, R. V. Olkhov, J. P. Maier, O. Dopfer, Infrared predissociation spectra of He-HO and Ne-HO: prediction of the frequency of HO, Chem. Phys. Lett. 278 (1) (1997) 26 – 30.
- [15] H. Kohguchi, P. Jusko, K. M. T. Yamada, S. Schlemmer, O. Asvany, High-resolution infrared spectroscopy of O2H+ in a cryogenic ion trap, J. Chem. Phys. 148 (2018) 144303.
- [16] I. Savić, D. Gerlich, O. Asvany, P. Jusko, S. Schlemmer, Controlled synthesis and analysis of He–H in a 3.7 K ion trap, Mol. Phys. 113 (15-16) (2015) 2320–2332.
- [17] O. Asvany, S. Schlemmer, T. Szidarovszky, A. G. Császár, Infrared signatures of the HHe and DHe () complexes, J. Phys. Chem. Lett. 10 (2019) 5325–5330.
- [18] M. Töpfer, A. Jensen, K. Nagamori, H. Kohguchi, T. Szidarovszky, A. G. Császár, S. Schlemmer, O. Asvany, Spectroscopic signatures of HHe and HHe, Phys. Chem. Chem. Phys. 22 (2020) 22885–22888.
- [19] T. Dunham, Interstellar Neutral Potassium and Neutral Calcium, Publ. Astron. Soc. Pacific 49 (1937) 26.
- [20] A. E. Douglas, G. Herzberg, Note on CH+ in Interstellar Space and in the Laboratory, Astrophys. J. 94 (1941) 381.
- [21] J. Cernicharo, X.-W. Liu, E. González-Alfonso, P. Cox, M. J. Barlow, T. Lim, B. M. Swinyard, Discovery of Far-Infrared Pure Rotational Transitions of CH+ in NGC 7027, Astrophys. J. 483 (1997) L65–L68.
- [22] E. Falgarone, T. Phillios, J. C. Pearson, First detection of 13CH+ (), Astrophys. J. Lett. 634 (2005) L149–L152.
- [23] K. M. Menten, F. Wyrowski, A. Belloche, R. Güsten, L. Dedes, H. S. P. Müller, Submillimeter absorption from SH+, a new widespread interstellar radical, 13CH+ and HCl, Astron. Astrophys. 525 (2011) A77.
- [24] Z. Nagy, F. F. S. Van der Tak, V. Ossenkopf, M. Gerin, F. Le Petit, J. Le Bourlot, J. H. Black, J. R. Goicoechea, C. Joblin, M. Röllig, E. A. Bergin, The chemistry of ions in the Orion Bar I. – CH+ , SH+ , and CF+, Astron. Astrophys. 550 (2013) A96.
- [25] D. A. Neufeld, M. Goto, T. R. Geballe, R. Güsten, K. M. Menten, H. Wiesemeyer, Detection of Vibrational Emissions from the Helium Hydride Ion (HeH+) in the planetary nebula NGC 7027, Astrophys. J. 894 (2020) 37.
- [26] J. M. Hughes, E. I. von Nagy-Felsobuki, Ab initio investigations of the electronic structure of HeCH+ and HeCH2+, Chem. Phys. Lett. 272 (5) (1997) 313 – 318.
- [27] M. Meuwly, N. J. Wright, The Potential Energy Surface and Ro-Vibrational States of He-CH+, J. Phys. Chem. A 104 (6) (2000) 1271–1277.
- [28] T. Stoecklin, A. Voronin, Vibrational and rotational energy transfer of CH+ in collisions with 4He and 3He, Eur. Phys. J. D 46 (2008) 259 – 265.
- [29] K. Hammami, L. Owono Owono, N. Jaidane, Z. Ben Lakhdar, Rotational excitation of methylidynium (CH+) by helium atom at low temperature, Journal of Molecular Structure: THEOCHEM 853 (1) (2008) 18 – 26.
- [30] J. L. Doménech, P. Jusko, S. Schlemmer, O. Asvany, The first laboratory detection of vibration-rotation transitions of 12CH+ and 13CH+ and improved measurement of their rotational transition frequencies, Astrophys. J. 857 (2018) 61.
- [31] O. Asvany, S. Brünken, L. Kluge, S. Schlemmer, COLTRAP: a 22-pole ion trapping machine for spectroscopy at 4 K, Appl. Phys. B 114 (2014) 203–211.
- [32] S. Thorwirth, P. Schreier, T. Salomon, S. Schlemmer, O. Asvany, Pure rotational spectrum of CN+, Astrophys. J. 882 (2019) L6.
- [33] O. Asvany, F. Bielau, D. Moratschke, J. Krause, S. Schlemmer, New design of a cryogenic linear RF multipole trap, Rev. Sci. Instr. 81 (2010) 076102.
- [34] S. Brünken, L. Kluge, A. Stoffels, J. Pérez-Ríos, S. Schlemmer, Rotational state-dependent attachment of he atoms to cold molecular ions: An action spectroscopic scheme for rotational spectroscopy, J. Mol. Spectros. 332 (2017) 67 – 78.
- [35] O. Asvany, H. Krüger, S. Schlemmer, Simple o-ring sealed brewster-angle window for ultrahigh vacuum applications, Journal of Vacuum Science & Technology B 38 (4) (2020) 045001.
- [36] O. Asvany, J. Krieg, S. Schlemmer, Frequency comb assisted mid-infrared spectroscopy of cold molecular ions, Rev. Sci. Instr. 83 (2012) 093110.
- [37] C. M. Western, Pgopher: A program for simulating rotational, vibrational and electronic spectra, J. Quant. Spectros. Rad. Transfer 186 (2017) 221 – 242.
- [38] T. Amano, The J = 1-0 Transitions of 12CH+, 13CH+, and 12CD+, Astrophys. J. Lett. 716 (2010) L1–L3.
- [39] M. Solimannejad, B. S. Mirhoseini, M. D. Esrafili, Microsolvation of CH+ in helium: An ab initio study, J. of Theoretical and Comp. Chem. 15 (2016) 1650018.
- [40] D. Koner, J. C. San Vicente Veliz, A. van der Avoird, M. Meuwly, Near dissociation states for HHe on MRCI and FCI potential energy surfaces, Phys. Chem. Chem. Phys. 21 (2019) 24976–24983.