Optimising top-quark threshold scan at CLIC using genetic algorithm
Abstract
One of the important goals at the future colliders is to measure the top-quark mass and width in a scan of the pair production threshold. However, the shape of the pair-production cross section at the threshold depends also on other model parameters, as the top Yukawa coupling, and the measurement is a subject to many systematic uncertainties. Presented in this work is the study of the top-quark mass determination from the threshold scan at CLIC. The most general approach is used with all relevant model parameters and selected systematic uncertainties included in the fit procedure. Expected constraints from other measurements are also taken into account. It is demonstrated that the top-quark mass can be extracted with precision of the order of 30 to 40 MeV, including considered systematic uncertainties, already for 100 of data collected at the threshold. Additional improvement is possible, if the running scenario is optimised. With the optimisation procedure based on the genetic algorithm the statistical uncertainty of the mass measurement can be reduced by about 20%. Influence of the collider luminosity spectra on the expected precision of the measurement is also studied.
Keywords:
e+-e- Experiments, Top physics1 Introduction
The Compact Linear Collider (CLIC) is a linear collider project, that is considered as a possible next large infrastructure at CERN clic-cdr ; clic-pip . CLIC is proposed as a staged machine running at energies from 380 GeV up to 3 TeV. The physics program of the first CLIC energy stage, at 380 GeV, focuses on precise measurements of the Higgs boson properties including its couplings to other SM particles clic-higgs and a study of top-quark production and decays, incorporating an energy scan over the production threshold clic-top .
Precise measurement of the top-quark mass is essential for the understanding of the Higgs mechanism, electroweak symmetry breaking and for constraining many “new physics” scenarios. Scanning the threshold for top-quark pair production, , was proposed as the method for top-quark mass measurement even before the top quark was actually discovered Fadin:1987wz ; Fadin:1988fn ; Strassler:1990nw . As the production cross-section can be calculated with a high degree of precision using theoretically well-defined top mass definitions Hoang:1999zc it is currently assumed to be the most precise method for top-quark mass determination and least sensitive to theoretical uncertainties.
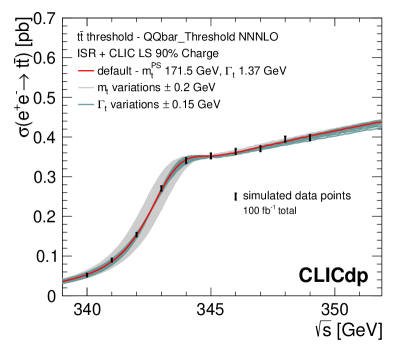
Scan scenario with ten energy points separated by 1 GeV, with 10 of data collected at each energy is considered as a baseline scenario for CLIC, as shown in Fig. 1.
Detailed study clic-top showed that expected statistical uncertainty on the mass is around 21 MeV and on the top-quark width - 51 MeV. However, systematic uncertainties are expected to limit the ultimate precision. In particular, mass uncertainty originating from the uncertainty of the strong coupling is estimated to be about 30 MeV Simon:2016htt . The combined theoretical, parametric and experimental systematic uncertainties are expected to be in the range 40 MeV to 70 MeV, depending on the assumptions clic-top .
While these results are very encouraging, they were obtained from the threshold scan fit taking only the two model parameters, top-quark mass and width, into account. Yet, threshold cross-section shape depends also on other parameters, as the top Yukawa coupling and the strong coupling constant. Fit results are also sensitive to the normalisation of the model predictions and the background level estimates. The main goal of the presented study was to quantify the influence of additional model parameters, and related uncertainties, on the precision of top-quark mass determination at CLIC. By including corresponding parameter variations in the fit, influence of the considered systematic uncertainties can also be reduced.
As the baseline running scenario seems to be conservative, the additional objective of the study was to investigate to what extent statistical uncertainties can be reduced when using the optimised running scenario. The scan optimisation is possible only if the top-quark mass is already known to (100 MeV). If this level of precision is not reached by earlier measurements, an initial scan with fewer energy points can be required, with only a small fraction of total integrated luminosity dedicated to the threshold scan, see eg. Simon:2019axh . However, suggesting any realistic running scenario, when the scan sequence is adjusted basing on the already collected scan data, is a much more complex problem and is beyond the scope of this work. Results included in this paper supersede results presented previously in wilga2018 ; wilga2019 ; thesis ; ichep2020 .
2 Modelling of the threshold scan
In this chapter the procedure developed to model the top-quark pair production cross section measurements in a threshold scan at CLIC is described. Two elements are used to calculate the expected cross section values: theoretical predictions given in terms of the cross section templates and the expected luminosity spectra for CLIC.
2.1 Cross-section templates
Considered in the presented study are the cross section templates generated, assuming different values of top quark parameters, using QQbar_threshold software qq ; qq2 . Parameters used as an input to QQbar_threshold calculations are listed in the upper part of Tab. 1.
| Parameter | Nominal | Min. | Max. | Step | |
|---|---|---|---|---|---|
| top-quark mass | 171.5 GeV | 171.4 GeV | 171.6 GeV | 25 MeV | |
| top-quark width | 1.37 GeV | 1.17 GeV | 1.57 GeV | 0.05 GeV | |
| top Yukawa coupling | 1.0 | 0.6 | 1.4 | 0.1 | |
| strong coupling constant | 0.1185 | 0.1145 | 0.1225 | 0.001 | |
| overall renormalisation scale | 80 GeV | ||||
| nonresonant contr. scale | 350 GeV | ||||
| data normalisation | 1 | ||||
| background contribution | 73 fb | 61 fb | 85 fb | 3 fb | |
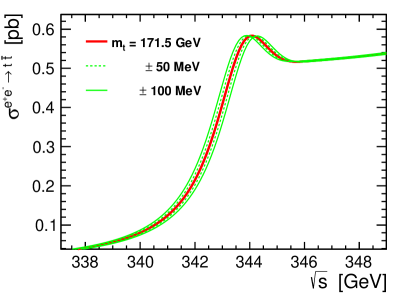
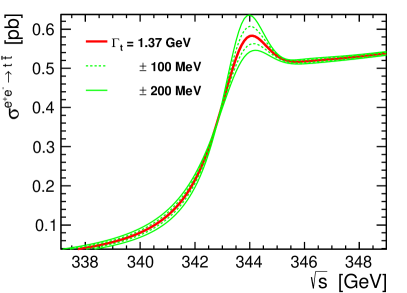
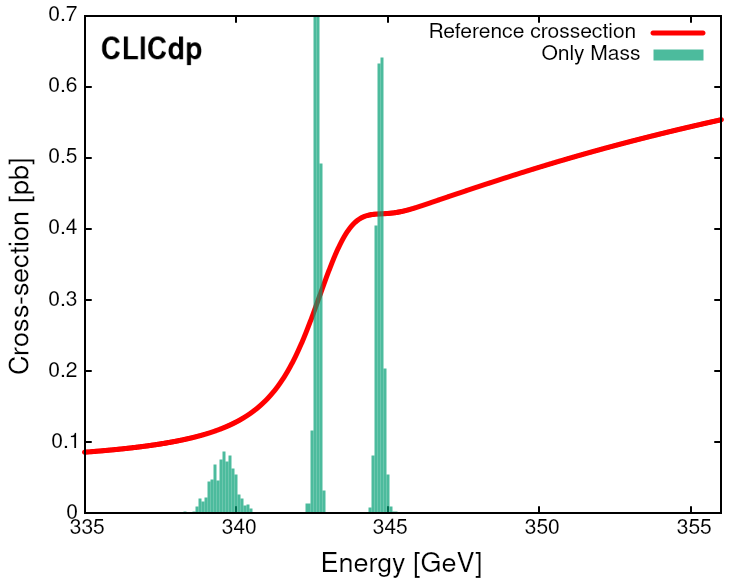
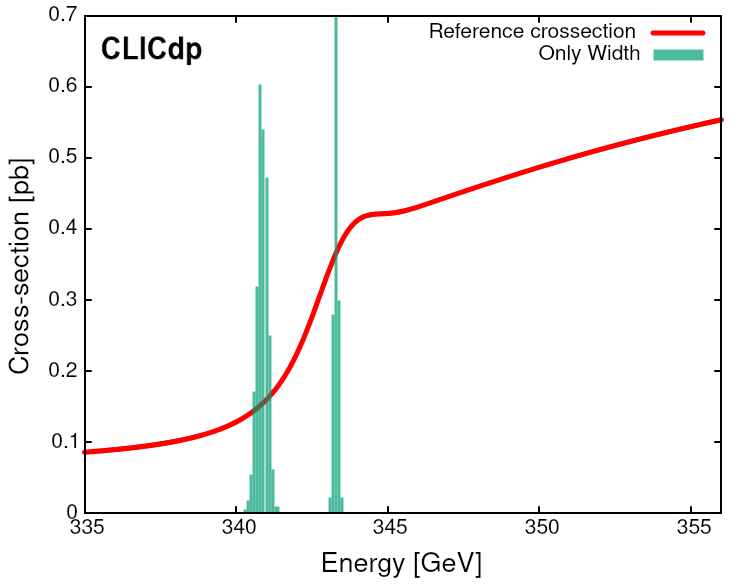
Nominal cross section template was first generated for nominal values of all parameters. Three top-quark parameters considered in the study: mass, , width, , and Yukawa coupling relative to SM prediction, , as well as the strong coupling constant, , were then varied in small steps, corresponding to the expected experimental sensitivities, from their nominal values, resulting in additional cross section templates. Total of 274 templates were generated for different variations of model parameters. Each of those templates consists of 300 points representing cross-section for energy in range from 330 to 360 GeV. Examples of cross-section templates are shown in Fig. 2. Initial state radiation was included in the template cross section calculations.
2.2 Luminosity spectra
In order to take into account environment of the experiment, theoretical cross section templates, as generated with the QQbar_threshold, were convoluted with the expected CLIC luminosity spectra to obtain final cross-section templates used in the analysis.
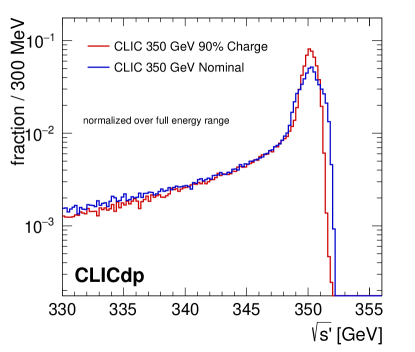
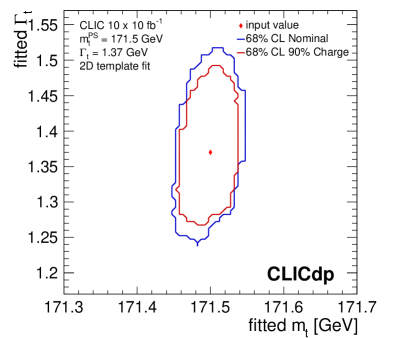
Two luminosity spectra were considered for the threshold scan: the nominal spectra expected for the first stage of CLIC, and the one with reduced bunch charge (90% charge), which allows to obtain narrower energy spectra at the cost of reduced instantaneous luminosity. Previous study clic-top showed that the reduced charge option results in smaller statistical uncertainties of the threshold fit, see Fig. 3, and this spectra was therefore used for the presented study.
2.3 Reference scenario
At the first energy stage CLIC is assumed to run at the energy of 380 GeV, which was selected for optimising both the Higgs boson and top quark measurements. With 1 of total integrated luminosity at this stage, a dedicated scan of 100 is planned at the threshold. As already mentioned above, the baseline scenario of the threshold scan assumes running at 10 equidistant energy points taking 10 of data for each value of . When generating simulated measurements (pseudo-data), the overall top-pair event reconstruction efficiency of 70.2% (including the branching fractions of the considered fully-hadronic and semi-leptonic top pair decays) was assumed, and the background contribution remaining after the event selection procedure corresponding to the cross section of 73 fb Seidel . Reconstruction efficiency is assumed to be independent of the collision energy (in the considered energy range) and of the model parameters.
2.4 Systematic uncertainties
In addition to the variations of the QQbar_threshold input parameters, as listed in the upper part of Tab. 1, possible variations of the overall data normalisation, , and of the assumed background contribution, , were also considered as additional parameters in the modelling of the threshold scan results. Data normalisation factor covers possible systematic variations due to the luminosity measurement, event selection efficiency or normalisation of the theoretical predictions. Uncertainties on the overall data normalisation, , on the background normalisation, , and on the value of the strong coupling constant, are considered as the sources of the systematic uncertainties in the extraction of the top-quark mass and other model parameters, and corresponding constraints were included in the fit to the threshold scan data. If not stated otherwise, relative uncertainty of 1% is assumed for the overall data normalisation clic-cdr , while uncertainty of 2% is used for the background contribution. Strong coupling constant, , is assumed to be known to 0.001.
Additional systematic uncertainties in the modelling of the threshold cross section can be due to variation of the renormalisation scale, , assumed in the QQbar_threshold calculations and to the uncertainty of the nominal top-quark mass, , assumed when planning the threshold scan. These uncertainties were not taken into account in the fit procedure and their influence on the fit results is discussed in Sec. 6.
Top-quark mass parameter of the QQbar_threshold program is defined in the ‘potential-subtracted’ (PS) mass scheme Beneke:1998rk . While conversion of the PS mass to the mass scheme is a subject to additional theoretical uncertainties, this is beyond the scope of this paper.
3 Fit procedure
3.1 Simulated experiments
For each simulation of the threshold scan measurement, one of the cross section templates (convoluted with the luminosity spectra) is selected as the base for pseudo-experiment generation. By this choice, “true” values of top quark parameters are chosen for the considered fit scenario. Unless specified otherwise, nominal parameter values (and nominal template) were used in all calculations.
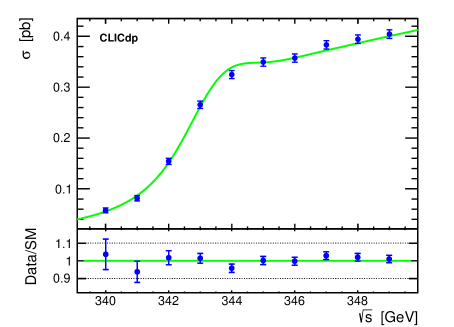
Selected template is used to generate a set of data corresponding to the expected scan results at CLIC, so called pseudo-experiment data (or pseudo-data). For each scan point, cross section value taken from the base template is varied according to the expected statistical fluctuations (from Poisson distribution), taking selection efficiency and background contribution into account. Example of the generated pseudo-data set is shown in Fig. 4.
3.2 Minimisation method
Parameter fit procedure is then applied to the generated pseudo-data set. For each considered cross section template the value is calculated from the formula
| (1) |
where and are the measured cross section values with their statistical uncertainties (pseudo-data set), denotes the template cross section values for corresponding collision energies and given parameter set , and is the template normalisation factor. The second term in the formula corresponds to the normalisation constraint, where different values of the relative normalisation uncertainty are considered. The normalisation factor can be evaluated analytically separately for each template by solving the minimisation condition . The third term represents possible constraints on the model parameters resulting from the earlier, independent measurements with uncertainty . In this study, external constraints are considered for , and .
The values of the top-quark mass and other model parameters can then be extracted from the fit of the polynomial dependence on the components of
| (2) |
where is the value minimised w.r.t. normalisation factor , is the number of considered model parameters and are parameter indexes (). is the symmetric matrix of coefficients of N-dimensional parabola. To simplify the formula, was defined (the linear part is thus given by and the constant part is ). The values of parameters are found by solving a set of linear equations, where values calculated for different parameter sets are used as input. The fitted values of are then used to extract the parameter values minimising the , which constitute the fit result. Statistical uncertainties of the fitted parameter values, , and their correlation coefficients, , are extracted from the fit covariance matrix. In the following, average values of the parameter uncertainties resulting from a large number of fits to the equivalent pseudo-data sets, are quoted as the expected parameter uncertainties from the given fit configuration.
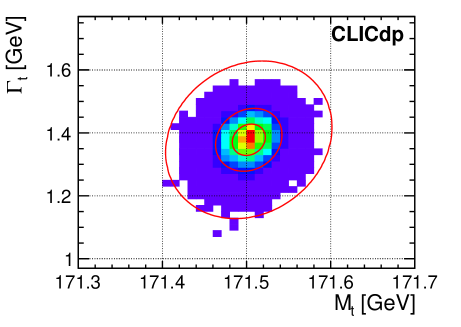
The fitting procedure was applied to a large sample of pseudo-data sets generated for the reference scan scenario (see Fig. 4) and the nominal parameter values (see Tab. 1), taking top-quark mass and width as the only free parameters in the fit. Distribution of the fit results presented in Fig. 5 is well described by the 2-D Gaussian profile; results of the profile fit to the data are indicated by the one, two and five sigma contours indicated in the plot. For the considered 2-D fit configuration (top-quark mass vs top-quark width), fits to the marginalized parameter distributions result in =19.4 MeV and =49.3 MeV. These uncertainties are in a good agreement with results of the previous study clic-top , see Fig. 3 (right). The uncertainties estimated from parameter distributions are also in very good agreement with those extracted from the covariance matrix of the fit.
4 Baseline threshold scan
4.1 Comparison of fit configurations
As mentioned above, study clic-top considered two-parameter fits to the threshold scan data only. This is also the case for earlier studies Seidel ; Horiguchi , while simultaneous fit of four model parameters was previously considered in Martinez:2002st . Presented approach, thanks to its simple, semi-analytical form, allows to perform fits with even more free model parameters. Moreover, it is possible to add additional constraints on the selected parameters to make the fit reflect the expected experimental situation.
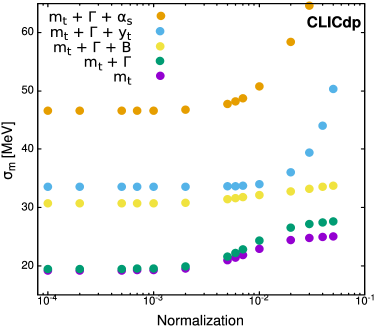
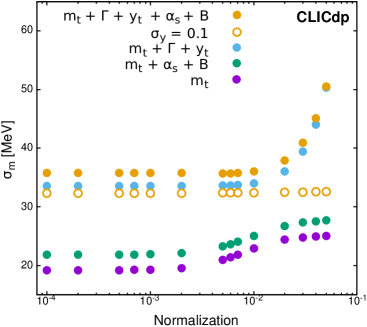
Presented in Fig. 6 (left) is the expected statistical precision of the top-quark mass as the function of the assumed normalisation uncertainty, , for five selected configurations of the threshold scan data fit. Precision of the one-parameter (1D) mass fit () is compared with the two-dimensional (2D) fit of mass and width () and different three-dimensional (3D) fit configurations. Expected top-quark mass uncertainty from the 2D fit to the threshold scan data is very close to the results of the 1D fit and sizeable differences are only observed, if normalisation is not well constrained, . However, expected mass uncertainty increases significantly when adding more (unconstrained) parameters to the fit. Largest deterioration is observed when the strong coupling constant is considered as the free model parameter () with uncertainty increasing by over a factor of two. Same fit configuration is also most sensitive to the overall normalisation of the data. This demontrates that there are significant correlations in the fit between the top-quark mass and other model parameters (as well as the data normalisation) and the external constraints on these parameters are crucial for the precise top-quark mass determination.
In Fig. 6 (right) top-qurk mass uncertainties expected for two different fit approaches are compared. One-parameter fit of the top-quark mass () can be considered as a model for “SM constrained” data analysis, when top-quark width and Yukawa coupling are taken from SM predictions. When including systematic variations from the strong coupling constant, , and the background level, , uncertainty of the top-quark mass is increased by about 2.5 MeV independent on the assumed normalisation uncertainty (). With the normalisation constrained to better than 1%, uncertainty on the top-quark mass of below 25 MeV is expected for “SM constrained” fit configuration.
Also presented in Fig. 6 (right) are results of a more general fit approach, when no relation is assumed between the top-quark mass, its width and Yukawa coupling, allowing for possible BSM contributions. For the three-dimensional fit of mass, width and Yukawa coupling (), expected precision of the mass determination is about 34 MeV, assuming the normalisation is known to better than 1%. After adding the two systematic parameters to the fit, the uncertainty increases by about 2 MeV. Independent measurement of the top Yukawa coupling at CLIC deBlas:2018mhx or by other experiments Cepeda:2019klc can improve the precision of the top-quark mass determination to around 32 MeV, assuming . Constrain on the top Yukawa coupling reduces also the sensitivity to the data normalisation, which can be attributed to the significant correlations between the parameters describing the Yukawa coupling, background level and the strong coupling constant.
4.2 Impact of constraints
As demonstrated above, constraints on model parameter resulting from measurements preceding the top threshold scan at CLIC can significantly reduce statistical uncertainties of the fit. In this section, impact of these constraints is studied in a more quantitative way. The problem can also be reversed: how precisely should other model parameters be measured in order to allow for the best possible top-quark mass determination in the threshold scan. Considered is the most general fit configuration with all model parameters included in the five-dimensional (5D) fit: top-quark mass, , width, , and the Yukawa coupling, , as well ass the strong coupling constant, and the background level scaling factor, (see Tab. 1). Note that the data normalisation factor, , the sixth model parameter, is not included in the fit procedure but is evaluated analytically for each cross section template, as described in Sec. 3.2.
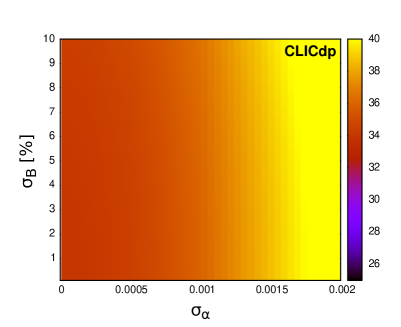
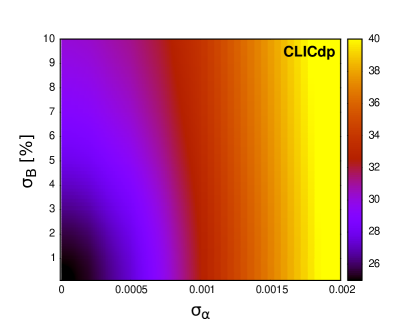
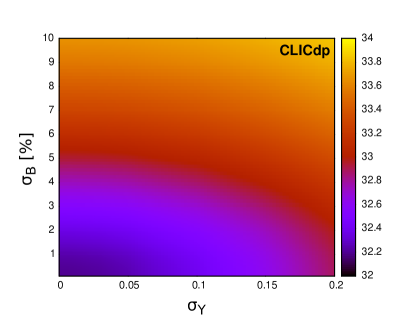
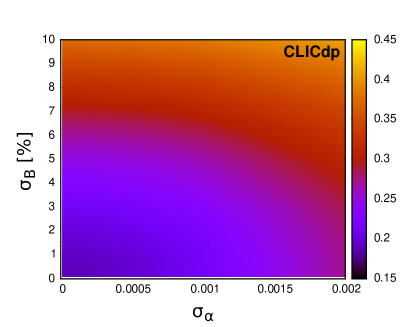
Shown in Fig. 7 is the expected top-quark mass uncertainty from the 5D fit to the threshold scan data plotted as a function of the assumed strong coupling constant and background contribution uncertainties. Relative uncertainty of 1% is assumed for the overall data normalisation. Two fit scenarios are considered: with the top Yukawa coupling considered an unconstrained model parameter (left plot) and with assumed Yukawa uncertainty from earlier measurements of (right). If no constraint can be set on the value of the Yukawa coupling, uncertainty of the extracted top-quark mass depends mainly on the assumed uncertainty on . Even if the strong coupling constant is known with very high precision, uncertainty on the mass cannot be reduced below about 34 MeV (see also 3D fit results shown in Fig. 6). The estimated top-quark mass uncertainty decreases significantly, if external constraint on the Yukawa coupling, with , is imposed, as shown in Fig. 7 (right). However, to be able to extract top-quark mass with precision of the order of 25 MeV, strong coupling constant would need to be known with precision higher than 0.0003 and the background contribution to at least 2%. With the current uncertainty of the world average, pdg , mass uncertainty cannot be reduced below about 32 MeV. Unfortunately, uncertainty on the strong coupling constant is not likely to be significantly reduced in the near future Strategy:2019vxc .
Impact of the assumed Yukawa coupling constraint on the expected fit precision is also shown in Fig. 8. Uncertainty on the top-quark mass is presented as a function of the assumed Yukawa coupling and the strong coupling constant uncertainties (left plot), and as a function of the Yukawa coupling and the background contribution uncertainties (right plot).
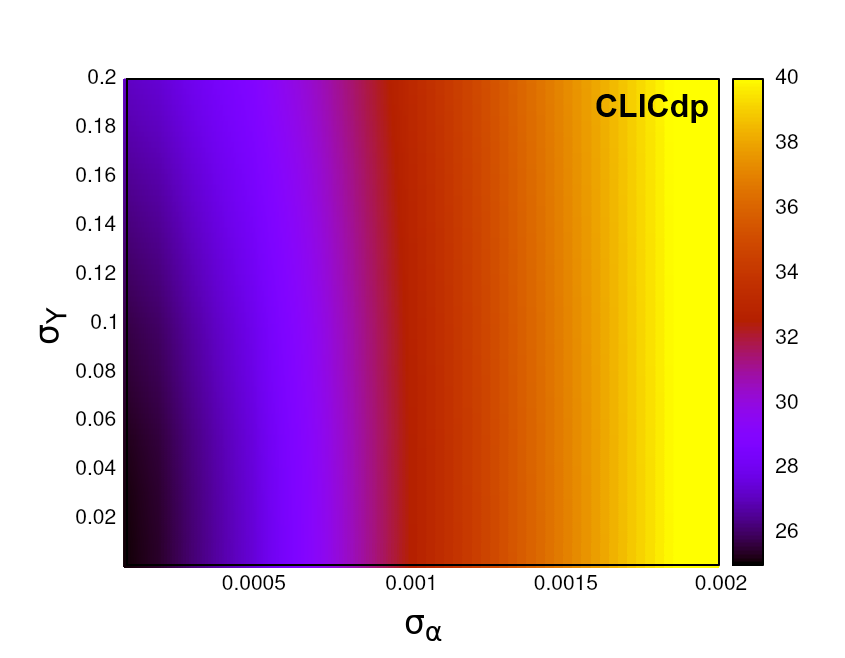
Presented results indicate that, although the extraction of top-quark mass does profit from additional Yukawa coupling constraint, possible improvement of the coupling determination precision beyond the assumed uncertainty of , will hardly improve the mass determination precision. Therefore this value of uncertainty is used for the following analysis, although higher precision is expected considering combined analysis of the Higgs boson measurements at the HL-LHC Cepeda:2019klc .
As the top-quark pair-production cross section depends on the top Yukawa coupling, the threshold scan data can also be used to constrain its value. The statistical precision of the Yukawa coupling determination from the 5D fit was investigated as a function of the assumed background and strong coupling uncertainties. Results presented in Fig. 9 indicate that contribution from the Yukawa coupling can be observed in the threshold scan data with 5 significance (i.e. with statistical precision of about 0.2) assuming the normalisation is known at percent level, the strong coupling is known better than 0.001 and the background uncertainty is below 3%.
4.3 Systematic effects
Results presented above demonstrate that systematic uncertainties are likely to limit the ultimate precision of the top-quark mass determination from the threshold scan. Various sources of uncertainties have been investigated in clic-top and the combined systematic uncertainty of the top-quark mass is expected to be in range of 30 MeV to 50 MeV. In particular, the parametric uncertainty originating from the strong coupling constant was estimated to be 30 MeV (for the reduced charge luminosity spectrum considered here), also assuming an uncertainty of 0.001 in . Systematic mass uncertainty resulting from the background level estimates is much smaller: for the 5% shift of the estimated background contribution 18 MeV variation is expected in the extracted top-quark mass Seidel , corresponding to about 7 MeV variation for the background level uncertainty of 2% assumed here.
The procedure described in this work, including parameters describing systematic effects and the corresponding constraints directly in the fit to the threshold scan data, allows for proper treatment of all uncertainties, including their correlations, resulting in a significant reduction of the total mass uncertainty. When systematic variations of the strong coupling constant and the background level are not considered, the expected statistical uncertainty of the top quark mass from the 3D fit is 34 MeV (22 MeV) without (with) additional constraint on the Yukawa coupling. With parametric uncertainties from and variations of 30 MeV and 7 MeV, respectively, this would correspond to the total top-quark mass uncertainty of 46 MeV (38 MeV). With the proposed approach, where the threshold scan data can be also used to reduce the influence of the parameter variations, the final uncertainties (including the considered systematic effects) are 36 MeV (32 MeV), see Fig. 6. This corresponds to the reduction of the total uncertainty by 15 to 20%.
5 Scan optimisation
5.1 Multi-objective optimisation
When looking for the best scenario of the top-quark threshold scan at CLIC (or at any other future collider) one needs to consider different aspects of the measurement. The top quark mass is not the only parameter that needs to be extracted (with the best possible statistical uncertainty). There are other model parameters, measurement of which needs to be optimised at the same time. Multi-objective optimisation problems are likely to be complex and must be approached differently, depending on the specific case. When looking for the best optimisation approach it is necessary to take into account, for example, how easy it is to find solution to the considered problem and how many solutions are expected. It could be that there are so many possible solutions that all of them cannot be analyzed.
The easiest case is when one can propose a set of equations describing the problem, defining the variables to be optimised. These equations can be then solved analytical or numerically, to find the optimum. Yet, it is rarely the case when the problem can be reduced to such a set of equations.
In most real-world problems, heuristic procedures are being used to find optimal solutions. They include Genetic algorithms, that are inspired by biological evolution processes, such as reproduction, mutation, recombination, and selection evo . In a Genetic algorithm, a set of proposed solutions to an optimisation problem, called Individuals, is evolved towards better solutions. Each Individual has a defined set of properties, called genotype, which can be mutated and altered, and set of measurable traits, called phenotype, that are determined by the genotype. Phenotype consists of traits that are used to evaluate their performance and choose the best Individuals to the next generation. During consecutive iterations of the algorithm population evolves towards better solutions. Ultimately, after a finite number of iterations, population should converge to the optimal solution.
5.2 Non dominated sorting genetic algorithm II
From many available Genetic algorithms, Non dominated sorting genetic algorithm II, proposed by Kalyanmoy Deb in 2002 deb , was chosen for this study, for its high efficiency and elasticity. Each iteration of the algorithm is divided into three steps:
-
•
Creating Children and adding them into population
-
•
Non dominated sorting of the population (with Jensen algorithm jensen )
-
•
Choosing the best Individuals for the next generation
Each one of those steps is highly customizable, so it is possible to adjust the implementation in order to achieve the best results. Thanks to use of efficient non dominated sorting algorithm it was possible to lower time complexity from original deb to jensen , where is number of objectives and is the size of the population.
Creating Individuals and First Generation
The first step was to translate our measurement procedure into Genetic algorithm language. One measurement scenario was assumed as an Individual, which genotype is represented by a scan sequence, set of centre-of-mass energy points (scan points make a multiset, as they can repeat, but their order is irrelevant). In this way each scan point can be considered a chromosome. Constant total integrated luminosity of 100 fb-1 was assumed and its equal sharing among all scan points. This might seem restrictive, but scan points with higher luminosity are actually allowed by allowing energy points to repeat in the scan sequence. This way it is also possible to optimise luminosity distribution. The measurement procedure described in previous chapters translates scan sequence (genotype) into measured top quark parameters with their uncertainties (phenotype). Yet, this process is non-deterministic, as statistical fluctuations were drawn from Poisson distribution separately for each generated pseudo-data set. To take statistical fluctuations into account pseudo-experiment procedure is always repeated three times and the worst result for each objective is taken.111The number of pseudo-experiments run for each Individual is limited by the processing time. However, already with three experiments the possible bias of the optimisation due to statistical fluctuations is basically excluded. The First Generation is seeded by creating 2000 identical Individuals using baseline scenario. Results presented in Chapter 4 show that it provides good fit results for all parameters.
Pairing and breeding Individuals
There are many proposed strategies to find the best pair of parents, but they are computationally costly. In order to ensure diversity in population, each Individual has three children, one with each of three other, randomly chosen Individuals. This method was used because of computational efficiency and for maximizing diversity in population. After obtaining two parent genotypes, it is necessary to ensure they are of the same length before making a new one (a child). It was done by inserting empty chromosomes into a shorter one, to mach their sizes. While iterating over parental genotypes, parent chromosome to insert into child’s genotype is chosen randomly. To allow changing genotype length, 5% chance to drop any of the chromosomes was added. To avoid systematic loss of chromosomes, additional random chromosome was added at the end of the genotype with a 10% probability. It was always required that the length of the resulting genotype is not shorter than 2, as shorter ones cannot be used for the phenotype evaluation (threshold fit procedure). When copying parent chromosome, it is also shifted by a random mutation in a given range. At the beginning of the evolution, the mutation range is GeV, but it shrinks geometrically in each iteration by factor of 0.9. In this way, it was possible to quickly mutate the initial baseline scenario without loosing the ability to converge around the best solution after a larger number of iterations. After creating all children in the generation their phenotypes were computed and they were inserted into the population.
Performance evaluation and selecting the next Generation
When considering more than one objective in the scan optimisation, one cannot simply compare (and sort) Individuals by their phenotype (parameter uncertainties from the fit). Instead, desired configuration is Pareto efficiency, which is defined as a configuration that cannot be modified so as to improve any objective without making at least one other objective worsen pareto . In order to find optimal solution Individuals must be compared with each other. To find which one is better, their Pareto dominance must be checked, which is the situation when one Individual is better in at least one objective, and not worse in all other pareto . The condition for Individual dominating Individual , , can be described by the formula:
| (3) |
where denotes objective calculated for Individual . When neither of them dominate the other, then the two Individuals are Pareto efficient. Individuals were grouped based on this criteria and such groups are called Pareto Frontiers pareto . They can by described by the formula:
| (4) |
Individuals were chosen for the next generation by sorting Pareto frontiers. It is based on criteria that a solution in must be dominated by at least one solution in and may or may not dominate solutions in fang . To efficiently perform those calculations Jensen algorithm was used jensen . After sorting Pareto frontiers, 2000 Individuals from frontiers with lowest ranks were selected for the next generation.
6 Results
6.1 Single objective optimisation
The performance of the optimisation procedure based on the Genetic algorithm was first studied for the optimised measurement of one model parameter only: top-quark mass, top-quark width or top Yukawa coupling. The objective is to minimize the statistical uncertainty resulting from the fit of the given parameter in a most general (5D) fit procedure, with all model parameters taken into account. Population size is set to 2000 and number of generations to 30. All results presented in this section were calculated assuming normalisation uncertainty of , strong coupling constant uncertainty of and background level uncertainty of . When measurement of the top Yukawa coupling was not included in the optimisation objectives, uncertainty of was assumed for constraint coming from independent coupling measurement.
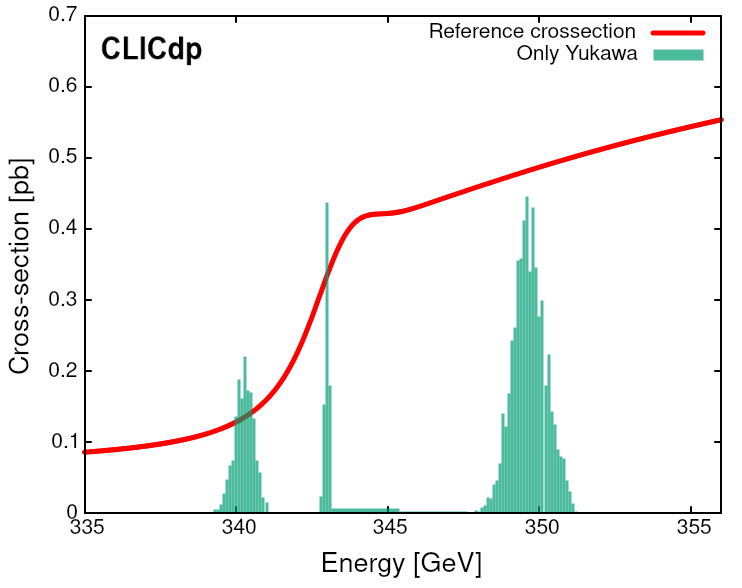
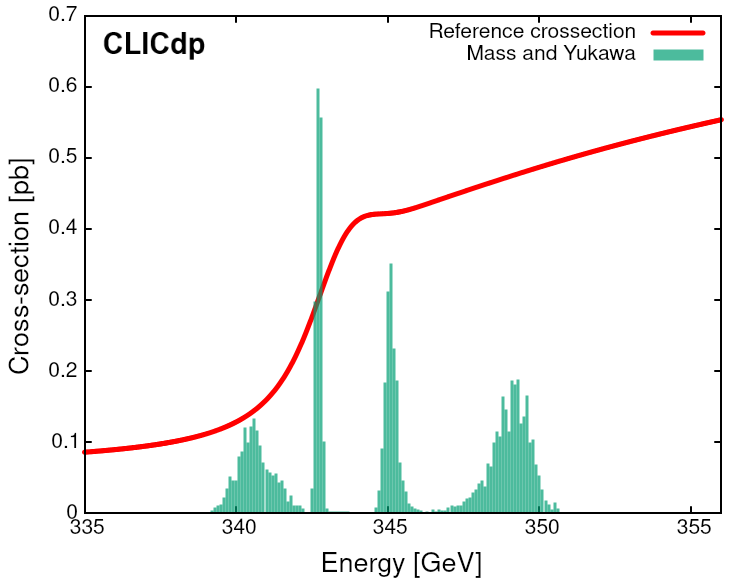
Results of the optimisation procedure for the three considered model parameters are summarised in Fig. 10.
When the scan procedure is optimised for the top-quark mass determination, the measurement is focused in three energy regions, with most of the luminosity taken in the middle of the threshold (around 343 GeV), where the cross section slope is highest, and at the plateau just above the threshold (around 345 GeV), see top left plot in Fig. 10. With this choice of measurement points, it is possible to reduce the expected uncertainty of the top-quark mass by about 30%, from 32 MeV expected for the ten-point baseline scan scenario to 22 MeV for the optimised ones.
However, the scenario optimised for mass measurement is clearly not the best one when the top-quark width measurement is considered. In this case, much larger fraction of the luminosity should be devoted to the cross section measurement just below the threshold (around 341 GeV), see top right plot in Fig. 10. With the width-optimised scan scenario, the statistical uncertainty on the top-quark width is reduced by about 40%, from 58 MeV for the baseline scenario to around 35 MeV for the optimal ones.
Smallest improvement due to scan optimisation can be obtained for the top Yukawa coupling measurement. As shown in Fig. 10 (bottom plot), in order to constrain the Yukawa coupling better, significant fraction of the luminosity has to be taken above the threshold, at around 350 GeV. This allows for about 20% improvement in the precision of the top Yukawa coupling determination, from about 0.18 to 0.14.
Looking at the measurement point distributions in Fig. 10 one can clearly see that four energy regions are relevant in the scan optimisation: energies just below the threshold (around 340-341 GeV), in the middle of the threshold (around 343 GeV), on the plateau just above the threshold (around 345 GeV) and further above the threshold (around 349-350 GeV). Different regions are sensitive to different model parameters: the regions in the middle and just above the threshold are most relevant for the mass measurements, measurement below the threshold is crucial for the width measurement, whereas the Yukawa coupling determination depends on the amount of luminosity which can be devoted to running few GeV above the threshold. This comparison shows that the same choice of energy points can be optimal (or close to optimal) for all considered parameters. However, sharing of the luminosity between four energy regions depends on the optimisation goal.
6.2 Multiple objectives optimisation
When considering multiple objectives, it was decided to focus on pairs of top-quark parameters, in order to study how they influence each other in the optimisation procedure.
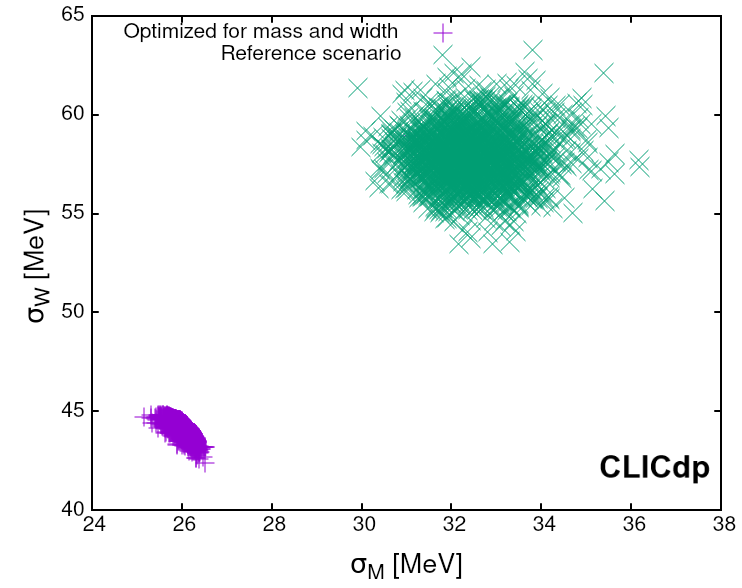
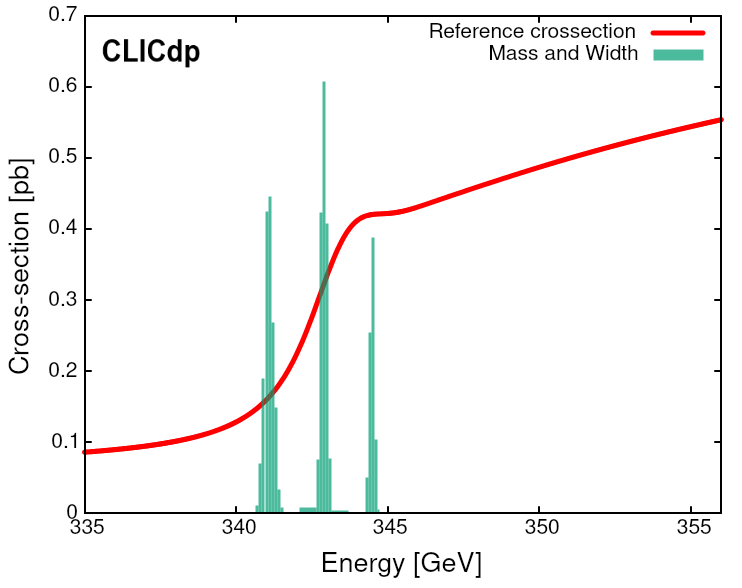
Shown in Fig. 11 are the results of mass and width measurement optimisation. For both parameters, improvement of about 20-25% can be achieved: mass uncertainty is reduced by about 6 MeV, from 32 MeV to 26 MeV, while the width uncertainty is reduced by about 14 MeV, from 58 MeV to 44 MeV. The improvement is smaller, when compared to single objective optimisation, by 10-15% (about 4 MeV for mass and 9 MeV for width uncertainty). As expected, the optimised measurement point distribution combines the scenarios obtained for one parameter mass and width optimisations (see Fig. 10). Most of the scenarios from the last generation, more than 99%, include 5 energy points, showing good convergence of the optimisation.
When optimising the scan procedure for simultaneous top-quark mass and top Yukawa coupling measurement, see Fig. 12, results are again similar to those obtained for one objective optimisation.
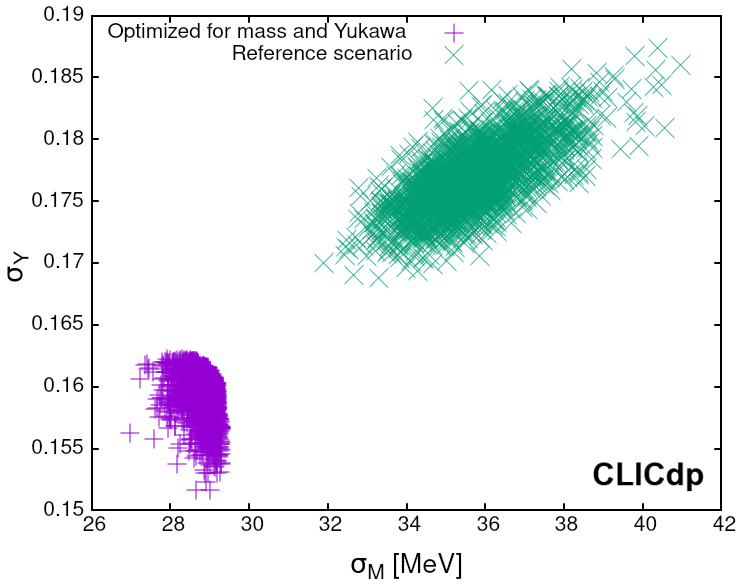
Note that possible constraint on the Yukawa coupling is not taken into account for this optimisation. Improvement of about 20% can be expected for the mass measurement, from 36 MeV to 29 MeV, but only about 10% improvement in the Yukawa coupling uncertainty. The measurement point distribution for this optimisation scenario is very similar to the one obtained for Yukawa only optimisation (see bottom plot in Fig. 10), but with additional measurements just above the threshold (at about 345 GeV) required for precise mass determination. More scan points are also required for the optimal measurement in this case: 97% of the last generation scenarios consist of 9 or 10 measurement points.
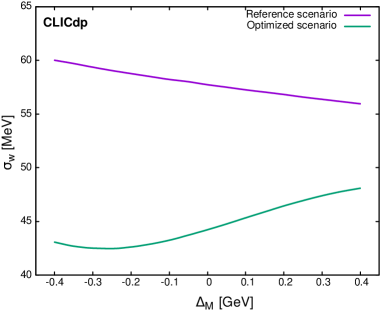
For detailed comparison of the optimised scenarios with the baseline threshold scan configuration, one scenario was selected from the last generation for each of the aforementioned multi objective optimisations. Two selected scenarios are presented in Fig. 13: five-point scenario optimised for mass and width measurement and ten-point one, optimised for mass and Yukawa coupling. In both scenarios points group in pairs, in places where more luminosity should be collected (at the threshold and, in case of mass and Yukawa optimisation, just above the threshold). These “best scenarios” were compared with the reference scenario based on results coming from 20 000 pseudo-experiments.
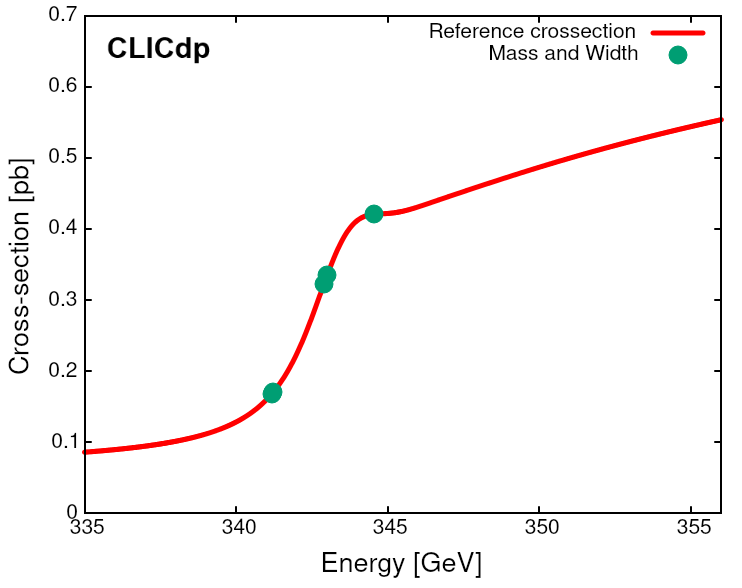
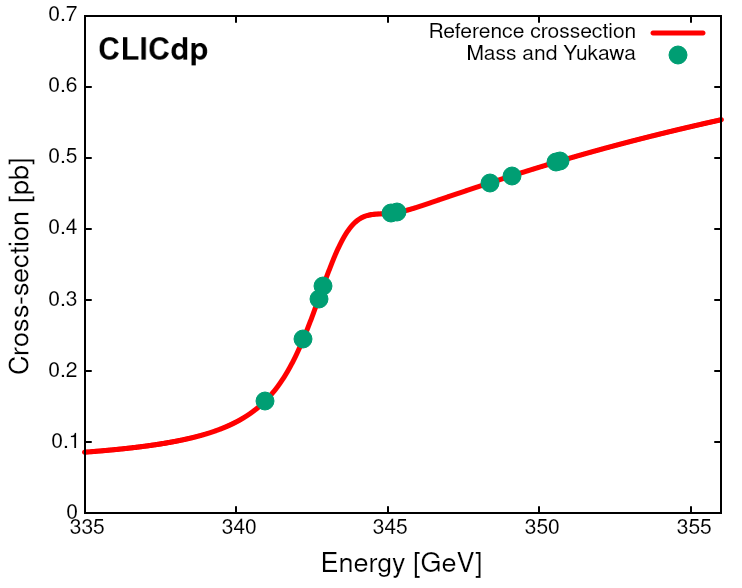
As before, normalisation uncertainty is , strong coupling uncertainty is , background level uncertainty is and, for mass and width optimisation, Yukawa uncertainty of is assumed. Uncertainty of the “true” top quark mass assumed when defining the scan sequence was not included at this point, it will be discussed in the next subsection.
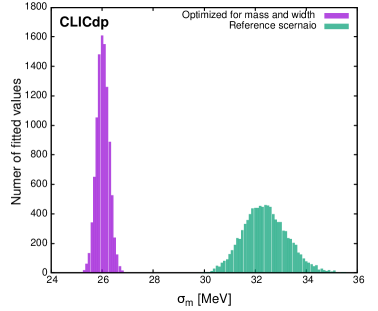
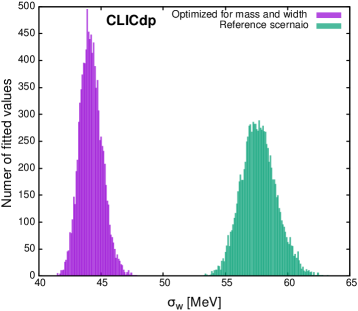
Results of the comparison for the five-point scenario are presented in Fig. 14. Shown are the distributions of uncertainties on the top-quark mass and width. Results based on large sample of pseudo-experiments confirm estimates obtained from the optimisation procedure (where each scenario was evaluated based on three pseudo-experiments only). For the optimised scenario the average expected mass uncertainty is around 26 MeV, while for width it is around 44 MeV. Moreover, uncertainty distributions are narrower that those for the reference scenario confirming that the fit is very stable and less sensitive to the statistical fluctuations.
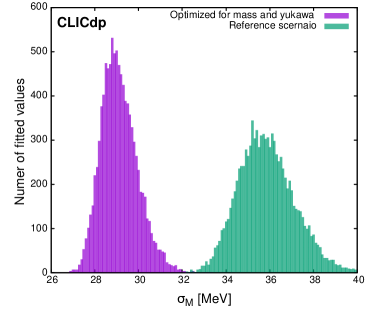
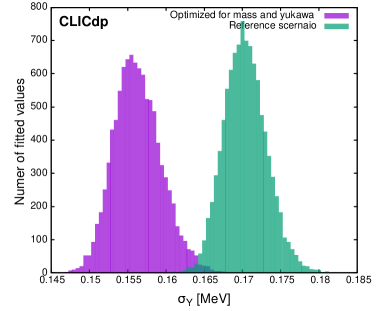
For scenario optimised for mass and Yukawa coupling measurement, results obtained with large sample of pseudo-experiments shown in Fig. 15 are again in good agreement with optimisation results (see Fig. 12). However, uncertainty distribution for the mass measurement is significantly wider than the one obtained for mass and width optimised scenario (Fig. 14). It is also slightly assymetric, with a larger tail towards high uncertainty values, but the optimised scenario always gives better mass measurement precision that the reference one. Similar tail towards high uncertainty values is also visible for the Yukawa coupling uncertainty distribution, which overlaps slightly with the reference scenario one. Still, chance of getting measurement from the optimised scan worse than in the reference scenario is very small.
6.3 Impact of the initial mass uncertainty
The nominal procedure of pseudo-experiment generation starts from selecting the ’true’ model parameters, including the true value of top-quark mass. However, the mass value will only be known with limited precision before the actual experiment takes place, so the position of the scan energy points w.r.t. the true mass will not be known. To verify how this can affect the expected scan results, fit procedure was repeated multiple times for different values of the true mass assumed in the generation of the pseudo-experiment data. Both the reference scan scenario and the scenario optimised for the mass and width measurement were considered with mass variations of up to GeV from the nominal top-quark mass assumed in the optimisation procedure, which corresponds to twice the projected future experimental uncertainty of the top-quark mass measurement at the HL-LHC Azzi:2019yne .
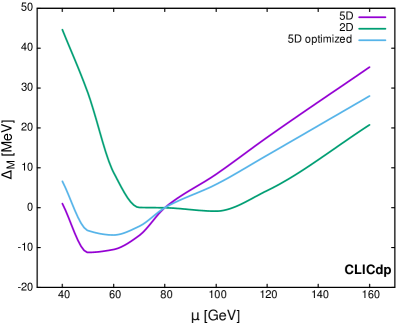
The average fitted mass values follow very closely the variation of the input mass and no sygnificant deviation is observed for both the reference and the optimised scan scenario. More pronounced is the impact of the initial mass variation in the estimated parameter uncertainties. Presented in Fig. 16 are uncertainties on the top-quark mass and width from the 5D fit as a function of the initial top-quark mass variation, .
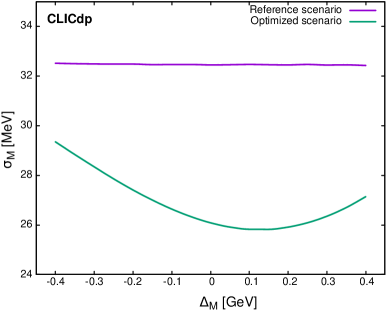
For the reference scenario, the impact of the mass shift on the mass uncertainty is negligible, but it does affect the width uncertainty. The lowest energy point of the reference scenario, as defined in clic-top , is at the begining of the threshold slope. For negative mass shifts, when the the actual top quark mass is lower than the nominal mass, less luminosity is collected in the threshold region sensitive to the width variations (see also Fig. 2).
For the optimised scan scenario the best mass measurement precision is obtained for small positive mass shift, GeV, while for negative shifts the uncertainty increases. Reversed relation is observed for the width uncertainty, which is smallest for negative mass shift of GeV and increases for the positive shifts. This observation is in agreement with results presented in Fig. 10 indicating that the energy point on the threshold slope optimal for the mass measurement is slightly below the point optimal for the width measurement. Selected in the combined optimisation procedured is the running energy which is between the two one-variable choices.
Although both mass and width measurements can be affected by the uncertainty in the reference top-quark mass assumed for planning the threshold scan, the precision expected from the optimised scan is superior to the one of the reference scenario for the initial mass variations considered. This suggests that the mass determination precision od 200 MeV expected from the HL-LHC running Azzi:2019yne should already be sufficient for initial optimisation of the threshold scan at CLIC.
6.4 Renormalisation scale variation
In the study clic-top the dominant systematic uncertainty in the top-quark mass measurement from the threshold scan was attributed to the missing higher orders in theory calculations. This uncertainty was estimated with the variation of the QCD renormalisation scale parameter, , used as an input to QQbar_threshold calculations (see Tab. 1) and was found to be around 40 MeV. Unfortunately, this type of uncertainty can not be included in the presented analysis framework. Default value of the renormalisation scale used in QQbar_threshold calculations corresponds to the maximum value of the top-pair production cross section at the threshold Simon:2019axh and the linear approximation used in the proposed fit procedure, resulting in parabolic dependence of the value on the model parameters (see Eq. (2)) is no longer valid. Therefore, the renormalisation scale variation was not included in the fit procedure but was considered separately, as described below. One has to realise that the scale variation is only an effective way of estimating the theoretical uncertainties and does not correspond to any parametric uncertainty which could be defined in terms of the probability density function. One can also expect that the theoretical calculations will still improve before the threshold scan is eventually performed.
To quantify the dependence of the fit results on the assumed QCD renormalisation scale, fit procedure was repeated multiple times for different values of assumed in the generation of the pseudo-data sets while the nominal scale value GeV was always used in the fit procedure. Dependence of the extracted top-quark mass on the input renormalisation scale, for three different fit configurations, is presented in Fig. 17.
For the two parameter fit to the reference scan scenario data, maximum mass shift of about 40 MeV is observed, consistent with results of clic-top . The dependence of the mass shift on the renormalisation scale is modified significantly when 5-D fit to the reference scan scenario is considered and the resulting uncertainty estimate (corresponding to the scale variation by factor of 2) is reduced to about 35 MeV. Sensitivity to the renormalisation scale is further reduced, by about 20%, for the optimised scan scenario. Expected uncertainty from the theory calculations can be estimated to about 28 MeV.
6.5 Influence of the luminosity spectra
All results presented so far were obtained assuming 100 fb-1 of data collected during the top threshold scan at CLIC. This luminosity is not sufficient to reach statistical uncertainty below 20 MeV, which was considered as a goal in the previous study clic-top . However, fit uncertainties can be significantly reduced, if more luminosity is collected at the threshold. Expected measurement precision is also sensitive to the assumed shape of the luminosity spectra.
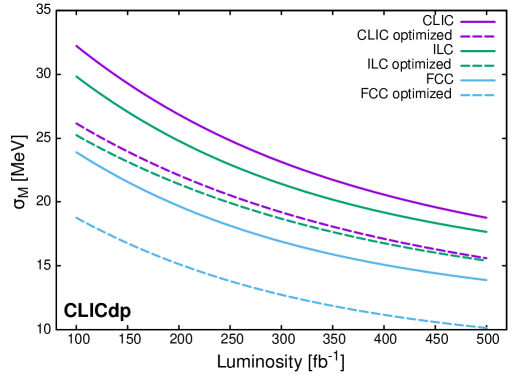
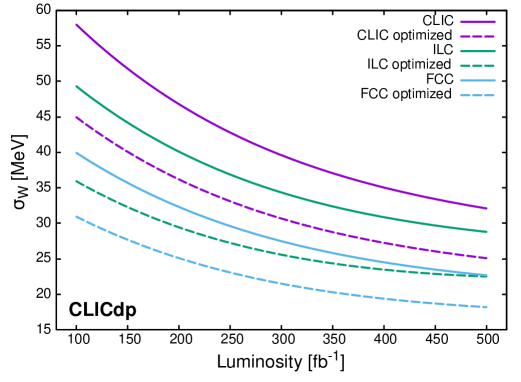
Dependencies of the expected mass and width uncertainties on the integrated luminosity of the threshold scan are shown in Fig. 18. CLIC estimates are compared with results of the same analysis and optimisation procedure applied when assuming ILC ilc or FCC-ee fccee luminosity spectra. To make comparison even more realistic, ’true’ top quark mass is varied in the pseudo-data generation procedure to model its initial uncertainty of 200 MeV Azzi:2019yne . Note that the choice of the optimal scenario does change with the change of luminosity spectra. For ILC spectra, about 90% of scenarios from the last generation of mass and width optimisation include 6 energy points. Six point optimised scenario was therefore selected for the comparison. Similarly, seven-point scenario was used for FCC-ee, as this was the final number of energy points in all scenarios of the last generation. Note that only the luminosity spectra was changed for this comparison; reconstruction efficiency and background level estimated from the CLIC study Seidel were used for all spectra and the possible influence of the beam polarisation was not considered.
Due to additional constraints imposed on the data normalisation, background contribution, the strong coupling constant and Yukawa coupling, the expected uncertainties decrease slower than with . In order to achieve 20 MeV mass uncertainty, about 400 fb-1 of data is required with reference running scenario at CLIC and about 200 fb-1 at FCC-ee. The optimised scenarios can reach this level of precision already with about 250 fb-1 at CLIC and below 100 fb-1 at FCC-ee. This shows clear advantage of optimised scenarios, as they can provide same precision as the reference scenario with the luminosity lower by roughly a factor of 2.
As described above, results presented in Fig. 18 were obtained for the most general 5D fit approach. When the “SM constrained” 3D fit is performed to the same scan data, with top-quark width and Yukawa coupling taken from the SM predictions, mass uncertainty from the scan scenario optimised for CLIC is reduced by about 2 MeV for the whole range of the integrated luminosity values. It is also interesting to notice that very similar mass uncertainties are obtained after the optimisation procedure for CLIC and ILC luminosity spectra. On the other hand, much higher width precision is obtained for the ILC. This is due to the fact that, compared to the five point scenario optimal for CLIC, the scenario optimised for ILC includes additional scan point in the region below the threshold (at around 341 GeV) improving the width determination, but reducing the luminosity collected at the higher energy points (more relevant for mass determination).
Presented results confirm that the optimisation procedure based on Genetic algorithm can be used to propose different running scenarios. It is possible to improve precision of top-quark mass determination by about 20%, also improving the measurement of the top-quark width or top Yukawa coupling at the same time. With optimised running scenario, the statistical uncertainties on mass and width are similar to the uncertainties expected for the reference scenario with doubled integrated luminosity (200 fb-1).
7 Conclusions
Complementary fit and optimisation procedures have been developed for the top-quark threshold scan analysis at CLIC. The new fit procedure is more flexible that the one used in the previous study clic-top and allows to include all relevant model parameters as well as additional constraints on model parameters, coming eg. from earlier measurement, and constraints on data normalisation. For the baseline scan scenario assumed at CLIC, with 100 fb-1 of integrated data luminosity, top quark mass can be measured with uncertainty of 32 MeV assuming the current uncertainty of the strong coupling constant, relative uncertainty of the Yukawa coupling of 0.1 and the background normalisation to be better than 2%. At the same time, cross section contribution from the top Yukawa coupling can be confirmed with statistical significance higher that . To improve the mass determination precision to below 25 MeV the strong coupling constant would need to be known with uncertainty below 0.0003.
Optimisation procedure based on non dominated sorting genetic algorithm II has been applied to the top-quark pair-production threshold scan. Each measurement scenario (set of energy points with total equally distributed luminosity of 100 fb -1) is considered a genotype and results of the fit procedure constitute a phenotype. Implementation of the genetic evolution, starting from the baseline scenario, includes random mutations: mixing of parent genotypes, possibility to drop or gain a new (random) chromosome (scan point). Stable optimisation results are obtained for population size of 2000 and number of generation of 30. Using single and multi objective optimisation, it was shown that optimisation procedure can reduce the mass uncertainty by up to 20%. With the proposed procedure, reduction of the mass uncertainty from the top threshold scan fit should be possible, corresponding to about a factor of 2 increase in the integrated luminosity. For the optimised running scenario statistical uncertainty on the top-quark mass of 20 MeV can be reached at CLIC with 250 fb-1. Scan optimisation results also in the reduced sensitivity to the renormalisation scale variations.
Acknowledgements
The work was carried out in the framework of the CLIC detector and physics (CLICdp) collaboration. We acknowledge partial use of the earlier results from K. Debski kacper_debski . We thank collaboration members for fruitful discussions, valuable comments and suggestions. The work was partially supported by the National Science Centre (Poland) under OPUS research projects no. 2017/25/B/ST2/00496 (2018-2021).
References
- (1) M. Aicheler et al., eds., A Multi-TeV Linear Collider based on CLIC Technology: CLIC Conceptual Design Report, CERN (2012), 10.5170/CERN-2012-007.
- (2) CLIC accelerator collaboration, M. Aicheler, P. Burrows, N. Catalan Lasheras, R. Corsini, M. Draper, J. Osborne et al., eds., The Compact Linear Collider (CLIC) - Project Implementation Plan, 1903.08655.
- (3) H. Abramowicz et al., Higgs physics at the CLIC electron–positron linear collider, Eur. Phys. J. C 77 (2017) 475 [1608.07538].
- (4) CLICdp collaboration, Top-Quark Physics at the CLIC Electron-Positron Linear Collider, JHEP 11 (2019) 003 [1807.02441].
- (5) V.S. Fadin and V.A. Khoze, Threshold Behavior of Heavy Top Production in Collisions, JETP Lett. 46 (1987) 525.
- (6) V.S. Fadin and V.A. Khoze, Production of a pair of heavy quarks in annihilation in the threshold region, Sov. J. Nucl. Phys. 48 (1988) 309.
- (7) M.J. Strassler and M.E. Peskin, The Heavy top quark threshold: QCD and the Higgs, Phys. Rev. D 43 (1991) 1500.
- (8) A.H. Hoang and T. Teubner, Top quark pair production close to threshold: Top mass, width and momentum distribution, Phys. Rev. D 60 (1999) 114027 [hep-ph/9904468].
- (9) F. Simon, A First Look at the Impact of NNNLO Theory Uncertainties on Top Mass Measurements at the ILC, in Proceedings, International Workshop on Future Linear Colliders (LCWS15): Whistler, B.C., Canada, November 02-06, 2015, 2016, https://inspirehep.net/record/1427722/files/arXiv:1603.04764.pdf [1603.04764].
- (10) F. Simon, Scanning Strategies at the Top Threshold at ILC, in International Workshop on Future Linear Colliders, 2, 2019 [1902.07246].
- (11) K. Nowak and A.F. Żarnecki, Prospects for improving top-quark mass measurement precision at future colliders, Proc.SPIE 10808 (2018) 1080840.
- (12) K. Nowak and A.F. Żarnecki, Extracting the top-quark mass and Yukawa coupling from the threshold scan at CLIC, Proc. SPIE 11176 (2019) 1117648.
- (13) K. Nowak, Optimising top-quark threshold scan at CLIC using genetic algorithm, University of Warsaw (2020), https://cds.cern.ch/record/2728555.
- (14) K. Nowak, Optimising top-quark pair-production threshold scan at future colliders, PoS ICHEP2020 (in print) 337.
- (15) M. Beneke, Y. Kiyo, A. Maier and J. Piclum, Near-threshold production of heavy quarks with QQbar_threshold, Comput. Phys. Commun. 209 (2016) 96 [1605.03010].
- (16) M. Beneke, A. Maier, T. Rauh and P. Ruiz-Femenia, Non-resonant and electroweak NNLO correction to the top anti-top threshold, JHEP 02 (2018) 125 [1711.10429].
-
(17)
K. Debski, “Optymalizacja procedury wyznaczania masy kwarku top w
przyszłych
akceleratorach .” report from the advanced laboratory excersise (in Polish),
Faculty of Physics, University of Warsaw, 2018. - (18) K. Seidel, F. Simon, M. Tesar and S. Poss, Top quark mass measurements at and above threshold at CLIC, Eur. Phys. J. C73 (2013) 2530 [1303.3758].
- (19) M. Beneke, A Quark mass definition adequate for threshold problems, Phys. Lett. B434 (1998) 115 [hep-ph/9804241].
- (20) T. Horiguchi, A. Ishikawa, T. Suehara, K. Fujii, Y. Sumino, Y. Kiyo et al., “Study of top quark pair production near threshold at the ILC.” arXiv:1310.0563, 2013.
- (21) M. Martinez and R. Miquel, Multiparameter fits to the t anti-t threshold observables at a future linear collider, Eur. Phys. J. C 27 (2003) 49 [hep-ph/0207315].
- (22) R. Franceschini et al., The CLIC Potential for New Physics, CERN Yellow Rep. Monogr. 3 (2018) [1812.02093].
- (23) M. Cepeda et al., Report from Working Group 2: Higgs Physics at the HL-LHC and HE-LHC, CERN Yellow Rep. Monogr. 7 (2019) 221 [1902.00134].
- (24) Particle Data Group collaboration, Review of Particle Physics, PTEP 2020 (2020) 083C01.
- (25) R.K. Ellis et al., Physics Briefing Book: Input for the European Strategy for Particle Physics Update 2020, 1910.11775.
- (26) M. Mitchell, An Introduction to Genetic Algorithms, Cambridge, MA: MIT Press. (1996).
- (27) K. Deb, S. Agrawal, A. Pratap and T. Meyarivan, A fast elitist non-dominated sorting genetic algorithm for multi-objective optimization: Nsga-ii, in Parallel Problem Solving from Nature PPSN VI, M. Schoenauer, K. Deb, G. Rudolph, X. Yao, E. Lutton, J.J. Merelo et al., eds., (Berlin, Heidelberg), pp. 849–858, Springer Berlin Heidelberg, 2000.
- (28) M.T. Jensen, Reducing the run-time complexity of multiobjective eas: The nsga-ii and other algorithms, IEEE Transactions on Evolutionary Computation 7 (2003) 503.
- (29) V. Pareto, Cours d’Economie Politique, Pouge (1896).
- (30) H. Fang, Q. Wang, Y.-C. Tu and M.F. Horstemeyer, An efficient non-dominated sorting method for evolutionary algorithms, Evolutionary Computation 16 (2008) 355 [https://doi.org/10.1162/evco.2008.16.3.355].
- (31) P. Azzi et al., Report from Working Group 1: Standard Model Physics at the HL-LHC and HE-LHC, CERN Yellow Rep. Monogr. 7 (2019) 1 [1902.04070].
- (32) P. Bambade et al., The International Linear Collider: A Global Project, 1903.01629.
- (33) FCC collaboration, FCC Physics Opportunities, Eur. Phys. J. C79 (2019) 474.